Embed Size (px)
Citation preview
Milk Market Channel Structure: Its Impact on Farmers and Consumers, and the Inadequacies of Antitrust Enforcement as a Foundation for Dairy Policies:
Evidence from the Northeast Dairy Industry
October 30, 2003
Testimony
Monopsony Issues in Agriculture: Buying Power of Processors in Our Nation’s Agricultural Markets
Judiciary Committee, United States Senate
by
Ronald W. Cotterill, Adam N. Rabinowitz, and Li Tian
Food Marketing Policy Center Department of Agricultural and Resource Economics
University of Connecticut Storrs, CT 06269-4021
Tel: (860) 486-2742 Fax: (860) 486-2461
Email: [email protected]
Copies of this report and others can be printed from our Website: http://www.fmpc.uconn.edu/
ii
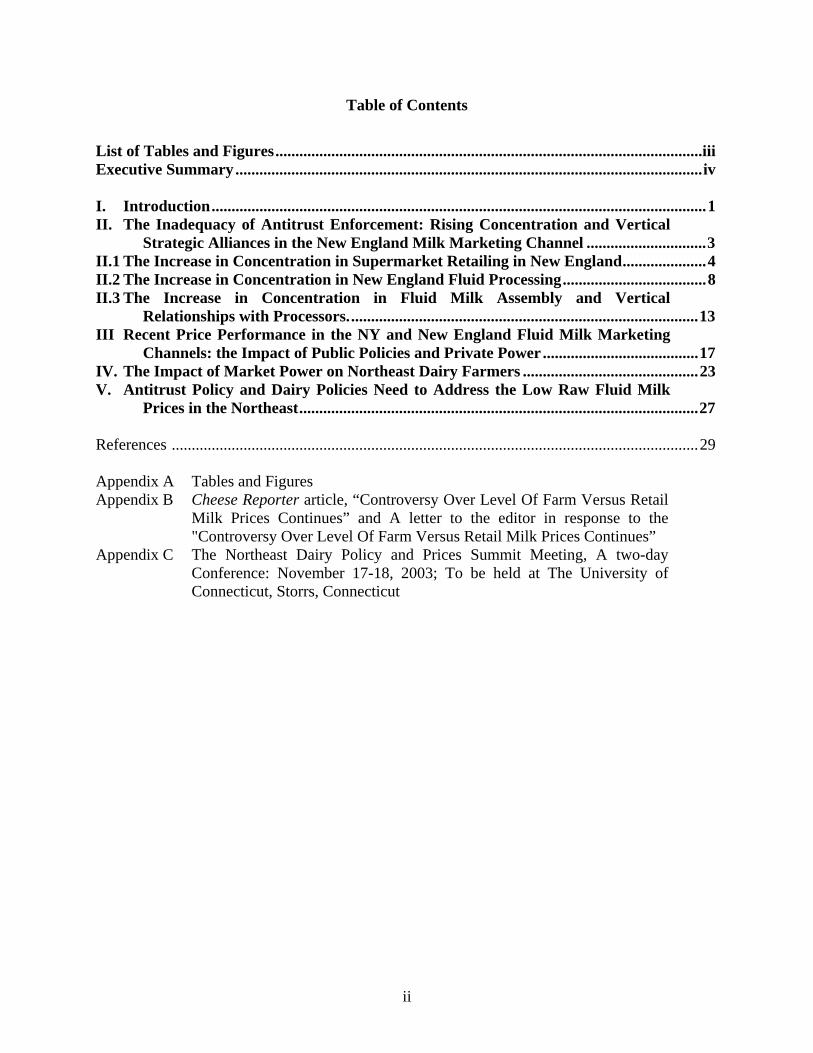
Table of Contents
List of Tables and Figures...........................................................................................................iii Executive Summary.....................................................................................................................iv I. Introduction............................................................................................................................1 II. The Inadequacy of Antitrust Enforcement: Rising Concentration and Vertical
Strategic Alliances in the New England Milk Marketing Channel ..............................3 II.1 The Increase in Concentration in Supermarket Retailing in New England.....................4 II.2 The Increase in Concentration in New England Fluid Processing....................................8 II.3 The Increase in Concentration in Fluid Milk Assembly and Vertical
Relationships with Processors........................................................................................13 III Recent Price Performance in the NY and New England Fluid Milk Marketing
Channels: the Impact of Public Policies and Private Power .......................................17 IV. The Impact of Market Power on Northeast Dairy Farmers ............................................23 V. Antitrust Policy and Dairy Policies Need to Address the Low Raw Fluid Milk
Prices in the Northeast....................................................................................................27 References ....................................................................................................................................29 Appendix A Tables and Figures Appendix B Cheese Reporter article, “Controversy Over Level Of Farm Versus Retail
Milk Prices Continues” and A letter to the editor in response to the "Controversy Over Level Of Farm Versus Retail Milk Prices Continues”
Appendix C The Northeast Dairy Policy and Prices Summit Meeting, A two-day Conference: November 17-18, 2003; To be held at The University of Connecticut, Storrs, Connecticut

iii
List of Tables and Figures Table 1. IRI Market Area All Product Market Shares and Number of Stores of Leading
Supermarket Chains, 1996, 2000, and 2003 ............................................................32 Table 2. Volume of Sold to Supermarkets and Market Share by Manufacturer: All New
England, July 1999 through July 2000 ....................................................................33 Table 3. Weighted Average All Milk Price by Chain: November 2002 vs June 2003 .............33 Table 4. Federal Milk Order Mailbox Prices for 2002 and 2003 by Month and annual
Average ....................................................................................................................34 Figure 1. Hartford Stop & Shop vs All Other Supermarkets, Market Level Milk Prices
March 1996 – July 2000 ..........................................................................................35 Figure 2. Providence Stop & Shop vs All Other Supermarkets, Market Level Milk
Prices March 1996 – July 2000................................................................................36 Figure 3. Boston Brand Level Retail Milk Prices, March 1996 – July 2000 .............................37 Figure 4. Boston Market Level Retail and Farm Fluid Milk Prices, January 1996 –
October 2003............................................................................................................38 Figure 5 Actual Raw Milk, Estimated Wholesale, and Actual Retail Milk Pricing by
Brand for the Four Leading Supermarket Chains in Southern New England: June 2003 .................................................................................................................39
iv
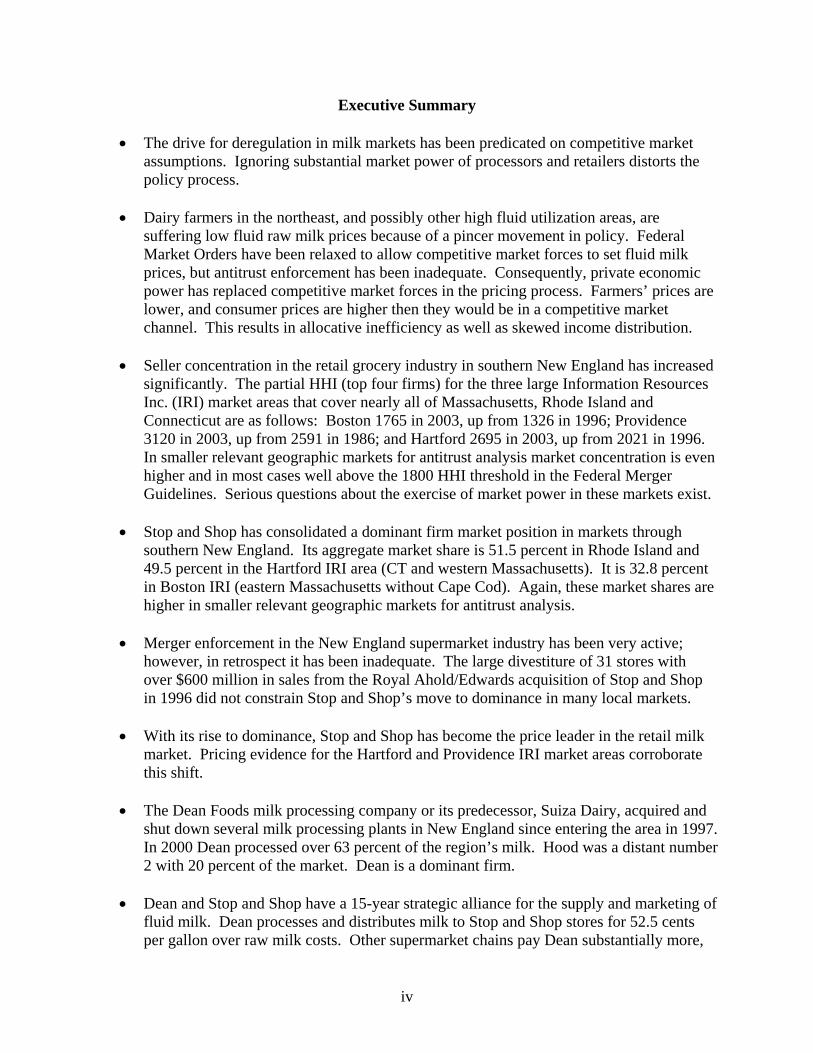
Executive Summary
• The drive for deregulation in milk markets has been predicated on competitive market assumptions. Ignoring substantial market power of processors and retailers distorts the policy process.
• Dairy farmers in the northeast, and possibly other high fluid utilization areas, are
suffering low fluid raw milk prices because of a pincer movement in policy. Federal Market Orders have been relaxed to allow competitive market forces to set fluid milk prices, but antitrust enforcement has been inadequate. Consequently, private economic power has replaced competitive market forces in the pricing process. Farmers’ prices are lower, and consumer prices are higher then they would be in a competitive market channel. This results in allocative inefficiency as well as skewed income distribution.
• Seller concentration in the retail grocery industry in southern New England has increased
significantly. The partial HHI (top four firms) for the three large Information Resources Inc. (IRI) market areas that cover nearly all of Massachusetts, Rhode Island and Connecticut are as follows: Boston 1765 in 2003, up from 1326 in 1996; Providence 3120 in 2003, up from 2591 in 1986; and Hartford 2695 in 2003, up from 2021 in 1996. In smaller relevant geographic markets for antitrust analysis market concentration is even higher and in most cases well above the 1800 HHI threshold in the Federal Merger Guidelines. Serious questions about the exercise of market power in these markets exist.
• Stop and Shop has consolidated a dominant firm market position in markets through
southern New England. Its aggregate market share is 51.5 percent in Rhode Island and 49.5 percent in the Hartford IRI area (CT and western Massachusetts). It is 32.8 percent in Boston IRI (eastern Massachusetts without Cape Cod). Again, these market shares are higher in smaller relevant geographic markets for antitrust analysis.
• Merger enforcement in the New England supermarket industry has been very active;
however, in retrospect it has been inadequate. The large divestiture of 31 stores with over $600 million in sales from the Royal Ahold/Edwards acquisition of Stop and Shop in 1996 did not constrain Stop and Shop’s move to dominance in many local markets.
• With its rise to dominance, Stop and Shop has become the price leader in the retail milk
market. Pricing evidence for the Hartford and Providence IRI market areas corroborate this shift.
• The Dean Foods milk processing company or its predecessor, Suiza Dairy, acquired and
shut down several milk processing plants in New England since entering the area in 1997. In 2000 Dean processed over 63 percent of the region’s milk. Hood was a distant number 2 with 20 percent of the market. Dean is a dominant firm.
• Dean and Stop and Shop have a 15-year strategic alliance for the supply and marketing of
fluid milk. Dean processes and distributes milk to Stop and Shop stores for 52.5 cents per gallon over raw milk costs. Other supermarket chains pay Dean substantially more,

v
61.5 cents per gallon over raw milk costs. Although this price difference is most likely not cost justified, other chains have no Robinson-Patman claim against the alliance because Stop and Shop does not use the wholesale price advantage to compete on price and thereby damage other chains. It has elevated prices and widened profit margins.
• Concentration has also increased dramatically at the milk assembly stage of the northeast
milk-marketing channel. Dairy Farmers of America, the nation’s largest milk marketing cooperative, has formed Dairy Marketing Services, a marketing agency in common with several other cooperatives including Dairylea, and Land O Lakes (northeast division). DFA and DMS have full supply contracts with Dean Foods and National Dairy Holdings, the nation’s two leading processors who are dominant in the northeast.
• St. Albans Cooperative has joined DMS to preserve its long-standing supply relationship
with Stop and Shop, who closed its milk plant in 2000 and now receives milk from Dean.
• The proposed NDH Hood merger could shift Hood’s supply from Agrimark to DMS. If that happens, Agrimark faces possible exclusion from the federal market order fluid milk pool. To avoid this, Agrimark might also join DMS giving them a virtual monopoly on milk assembly in New England.
• DMS seeks to benefit farmers by rationalizing milk assembly and lowering hauling costs.
This is a real benefit but not enough to substantially improve farmer welfare.
• Even as a monopoly DMS cannot exert substantive market power against downstream processors and retailers to elevate farm milk prices. If DMS attempted this, Dean and NDH could use traditional pool-busting payments to independent farmers that have defeated cooperatives bargaining in the region in the past.
• Surveys of retail milk prices in November 2002 and June 2003 indicate that retail milk
prices in the metro New York and Hudson River area are 59-70 cents per gallon lower than in southern New England. New York’s price gouging law is the primary cause of this difference.
• Information on processing and delivery costs from Dairy Technomics allows the
decomposition of retail prices for brands and supermarket chains. For milk aggregated across all brands and the top four chains in southern New England we report the following for June 2003. Farmers received $1.03 per gallon for the raw milk bottled. Processors collected an additional 59.6 cents per gallon for processing and transporting the milk to supermarkets, i.e., the delivered wholesale price averaged $1.63 per gallon. Finally, retailers charged $3.07 per gallon so their gross margin was $1.45 per gallon.
• Research at the University of Maine and Pennsylvania State University indicate that in-
store milk handling costs range from 20 to 40 cents per gallon. Thus the leading supermarket chains net profit margins for milk are effectively equal to or more than what the farmer receives for producing the milk. This is allocatively inefficient and unfair pricing.
vi
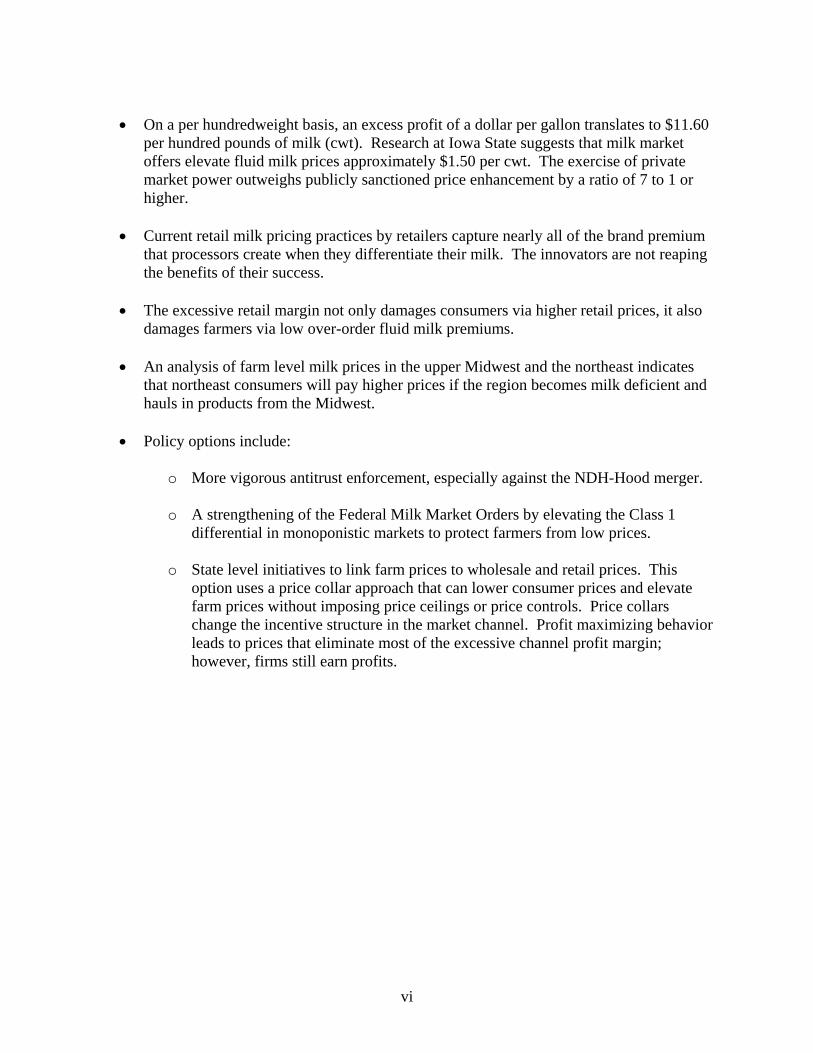
• On a per hundredweight basis, an excess profit of a dollar per gallon translates to $11.60
per hundred pounds of milk (cwt). Research at Iowa State suggests that milk market offers elevate fluid milk prices approximately $1.50 per cwt. The exercise of private market power outweighs publicly sanctioned price enhancement by a ratio of 7 to 1 or higher.
• Current retail milk pricing practices by retailers capture nearly all of the brand premium
that processors create when they differentiate their milk. The innovators are not reaping the benefits of their success.
• The excessive retail margin not only damages consumers via higher retail prices, it also
damages farmers via low over-order fluid milk premiums.
• An analysis of farm level milk prices in the upper Midwest and the northeast indicates that northeast consumers will pay higher prices if the region becomes milk deficient and hauls in products from the Midwest.
• Policy options include:
o More vigorous antitrust enforcement, especially against the NDH-Hood merger.
o A strengthening of the Federal Milk Market Orders by elevating the Class 1
differential in monoponistic markets to protect farmers from low prices.
o State level initiatives to link farm prices to wholesale and retail prices. This option uses a price collar approach that can lower consumer prices and elevate farm prices without imposing price ceilings or price controls. Price collars change the incentive structure in the market channel. Profit maximizing behavior leads to prices that eliminate most of the excessive channel profit margin; however, firms still earn profits.
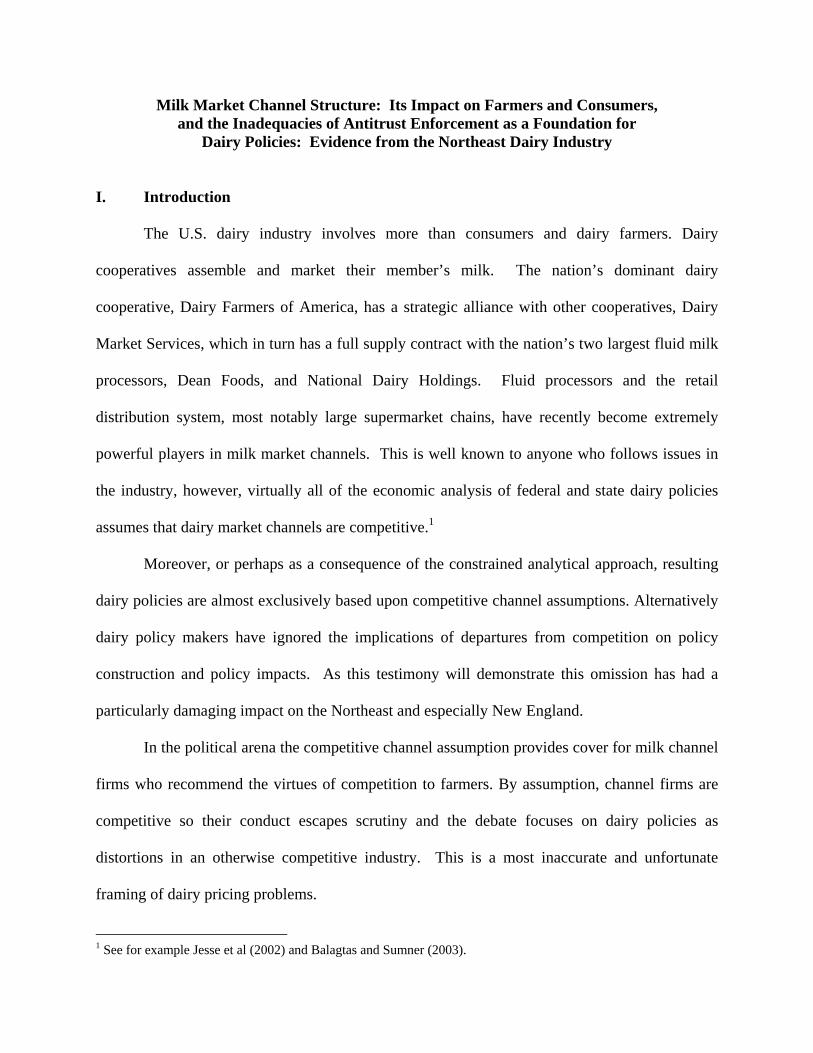
Milk Market Channel Structure: Its Impact on Farmers and Consumers, and the Inadequacies of Antitrust Enforcement as a Foundation for
Dairy Policies: Evidence from the Northeast Dairy Industry I. Introduction
The U.S. dairy industry involves more than consumers and dairy farmers. Dairy
cooperatives assemble and market their member’s milk. The nation’s dominant dairy
cooperative, Dairy Farmers of America, has a strategic alliance with other cooperatives, Dairy
Market Services, which in turn has a full supply contract with the nation’s two largest fluid milk
processors, Dean Foods, and National Dairy Holdings. Fluid processors and the retail
distribution system, most notably large supermarket chains, have recently become extremely
powerful players in milk market channels. This is well known to anyone who follows issues in
the industry, however, virtually all of the economic analysis of federal and state dairy policies
assumes that dairy market channels are competitive.1
Moreover, or perhaps as a consequence of the constrained analytical approach, resulting
dairy policies are almost exclusively based upon competitive channel assumptions. Alternatively
dairy policy makers have ignored the implications of departures from competition on policy
construction and policy impacts. As this testimony will demonstrate this omission has had a
particularly damaging impact on the Northeast and especially New England.
In the political arena the competitive channel assumption provides cover for milk channel
firms who recommend the virtues of competition to farmers. By assumption, channel firms are
competitive so their conduct escapes scrutiny and the debate focuses on dairy policies as
distortions in an otherwise competitive industry. This is a most inaccurate and unfortunate
framing of dairy pricing problems.
1 See for example Jesse et al (2002) and Balagtas and Sumner (2003).

2
The importance of antitrust enforcement in the fluid marketing channels should now be
clear. If vigorous and effectively competitive conditions prevail then these “Chicago School”
competitive market models of agricultural production and food marketing channels have more
standing.2 However, we submit that in several areas of the country, dairy farmers have been the
victim of a pincer movement in policy. Dairy policies have been relaxed to allow market forces
to determine farm level milk prices. For example, when discussing federal fluid milk market
orders, Jesse et al. state that fluid milk market orders should,
“Allow competitive forces to determine effective prices. Administered federal order prices are designated as minimum prices. If the cost of supplying fluid milk relative to supplying manufacturing markets is greater than the Class I differential, then cooperatives can and do obtain premiums to cover the difference and raise the effective Class I price to a competitive level” (Jesse et al, 2002, p. 23)
At the same time antitrust enforcement has failed to challenge successfully horizontal mergers
and vertical strategic alliances in many regional milk marketing channels including New
England. Consequently, we now have very few, large, and interconnected firms in many regional
and local dairy market channels. In regions where this is the case and the federal order minimum
prices for fluid milk have been lowered to make room for competition, competition can be
subverted by powerful buyers that leave fluid milk prices below competitive levels.
2 Over the past 70 years economists have offered other cogent rebuttals, alternative models of industrial organization if you like, to this textbook competitive market characterization of agricultural production and food marketing channels. Agricultural commodity and market regulatory policies are needed, and in many instances efficiency enhancing because:
• Agricultural production is an uncertain biological process subject to the vagaries of disease and weather. • There is an over production trap in farming due to high fixed costs and decentralized production units. • Rapid technical progress produces a treadmill effect. Farmers that are slow to adopt technology lose. • Production is seasonal, subject to longer run cycles and price instability. • The product is fresh, and you must sell it or smell it so farmers are susceptible to “hold ups” in the market
place. • Food safety is a concern.

3
The promoters of increased concentration in processing and retailing have claimed that
economies of size bring cost efficiencies that result in lower consumer prices. Empirical
evidence paints a stark and different picture. In New England, the Pacific Northwest and
elsewhere, supermarket fluid milk prices are extremely high when compared to raw fluid prices
and processing and retailing costs (Rabinowitz et al. 2003, Cotterill et al. 2003, Robinson 2003).
In this paper we will illustrate how the dairy policy and fluid milk pricing problem has
changed in the New England fluid milk channel since the mid 1990’s. We will do so by
explaining how the structure of the New England fluid milk channel has changed, how fluid milk
policies have changed, the interaction between policy and channel structure, and the impacts on
farmers, channel firms, and consumers. A central theme to this narrative is the interplay of
public and private market power with their impacts on raw fluid and retail fluid milk prices.
We will demonstrate that milk pricing has changed and channel firm net profit margins
have widened as channel concentration has increased. The case study also strongly suggests that
market power is being exercised against farmers in the Northeast via low over-order premiums as
well as against consumers in Southern New England via higher retail prices.3
II. The Inadequacy of Antitrust Enforcement: Rising Concentration and Vertical Strategic Alliances in the New England Milk Marketing Channel
Since 1996, several major structural events occurred in the New England supermarket
and fluid milk processing industry. In this section we will document changes in market structure
at the supermarket, processing, and milk assembly stages of the fluid milk channel. We also will
3 The current situation is virtually identical in the Pacific Northwest. See Rabinowitz et al. for analysis. Chicago has also experienced noncompetitive fluid milk pricing. Minneapolis has high retail prices relative to costs, as do many other areas, that merit investigation (USDA, 2003a)

4
review salient antitrust actions, explain how antitrust enforcement was inadequate, and offer
some observations on current antitrust issues.
II.1 The Increase in Concentration in Supermarket Retailing in New England
The watershed merger for the diminution of supermarket competition in Southern New
England is the Royal Ahold acquisition of Stop and Shop in 1996. Stop and Shop was, and is
today, the leading supermarket chain in Southern New England. Royal Ahold/Edwards
supermarkets was the number two chain in many local markets in Southern New England. The
Federal Trade Commission (FTC) and the Massachusetts, Connecticut, and Rhode Island
Attorney Generals adopted a fix it strategy and negotiated a major divestiture of 31 supermarkets
with sales of over $600 million to smaller competitors in an attempt to preserve competition.
As an economic expert for the states, the lead author of this testimony provided the
market area analysis and negotiated with the FTC and parties in this matter. We created Adams
Supermarkets, a new local supermarket chain owned by Bozzutos Wholesale, Cheshire,
Connecticut; divested stores to Shaws Supermarkets, a new and expanding entrant into
Connecticut, to Ro-Jacks, a 5 store independent in Providence, and to others. Royal Ahold
converted all its remaining Edwards to Stop and Shops.
In retrospect, the antitrust agencies should have challenged this merger rather than
attempt to fix it via divestiture.4 An extensive ex post analysis of pricing in many of the divested
stores (Cotterill et al, 1999) supports this conclusion. The operators of the divested stores
competed on price for several months, however, when Stop and Shop retaliated with lower prices
4 See Cotterill (2002b), Comments on the Food Marketing Institutes' Submission to the FTC Workshop Titled, "Supermarket Merger Investigations and Remedies." for a more detailed discussion for FTC divestiture practices.

5
in neighboring stores, after a few months of punishment, the operations of the divested stores
caved in and followed Stop and Shop to higher price levels.
Ro-Jacks supermarket went bankrupt attempting to operate the five additional supermarkets that
were much larger than its original five stores.5 Two of the ten Adams Supermarkets are now
closed and the chain has not grown.
Today, Stop and Shop is the unchallenged leader in Southern New England with market
shares above 50% in many local “antitrust” market areas. Several other horizontal mergers,
including Shaws 1999 acquisition of the Star Markets in Boston, have also contributed to the
increase in supermarket concentration. Table 1 gives the market shares and four firm
concentration ratios for the three aggregate IRI market areas that cover virtually all of
Massachusetts, Connecticut, and Rhode Island (Trade Dimension, 2003). Market concentration
and the trends to increased concentration reported in Table 1 are undoubtedly higher in smaller
geographic antitrust market areas because chain stores are not uniformly distributed throughout
an IRI area. Table 1 gives store numbers and market shares for the top four supermarket chains
in 1996, 2000, and 2003 for each IRI area.
The Boston IRI area which is all of eastern Massachusetts except Cape Cod, is the least
concentrated; however, the partial HHI (top four firms) increase from 1,325 in 1996 to 1,765 in
2003. Stop and Shop store numbers increases from 68 to 88, and its market share goes up from
26.2% to 32.8%. Shaws market share jumps to 26.7% in 2000 because it was allowed to acquire
Star Markets. Note that its store numbers remained unchanged at 80 between 2000 and 2003, but
it lost 4.5 market share points. The market positions of DeMoulas and Roche Brothers, two
strong local chains, remained stable throughout this period. 5 At the time, the lead author of this testimony prepared an extensive report for the Rhode Island Attorney General, that recommended Ro-Jacks not be given the divested status and predicted their bankruptcy.

6
The Providence IRI area is the State of Rhode Island. The market share levels and trends
document Stop and Shop’s dominance in 1996 and growth into an even stronger dominant
position. In 2003, Stop and Shop’s share of supermarket sales was 51.5 percent. Its only
significant rival is Shaws with a distant 20 percent of the market. The partial HHI is extremely
high at 3,120 points.
The Hartford IRI market area includes virtually all of Connecticut and western
Massachusetts. Again, Stop and Shop was the dominant firm in 1996 with 60 stores and a 40.4
percent share. By 2003 it expanded to 69 stores and 49.5 percent of the area’s supermarket sales.
The biggest loser was A&P who exited many markets in the area. A&P operated only nine
stores in 2003, down from 35 in 1996, and its share was only 2.9 percent in 2003, down from
11.7 in 1996. Some of the stores that it sold were state of the art, recently constructed
superstores, and curiously some were sold to Stop and Shop. In our opinion a sale to the area
market leader should not have passed antitrust muster. If Stop and Shop and the acquired A&P
were not in a more narrowly defined antitrust geographic market, one should revive the potential
competition argument when dominance by Stop and Shop in the region is so pervasive. Price
Chopper, a New York firm that has been trying to enter New England for years, is a more
suitable buyer. The partial HHI for this very large IRI area has increased from 2,021 in 1996 to
2,695 in 2003. As in Providence, this is far above the federal merger guidelines upper threshold
of 1,800.
Stop and Shop routinely engages in real estate practices that are explicitly designed to
protect its market position. In Putnam, Connecticut, Stop and Shop has held the lease and kept a
store empty (an old Edwards store) since 1996 in a downtown shopping plaza. It also has
objected to the landlord renting an empty K-Mart Store in the same plaza to Price Chopper, a

7
formidable competitor, on the grounds that the lease for the dark Edwards prevents any other site
in the plaza from being rented to a grocery store. Such exclusivity clauses are common in leases
in shopping centers; however, it is most extraordinary for a supermarket to rent and hold empty a
store in a center and then attempt to exercise the exclusivity clause to keep a supermarket out of
another store site in the center.
As a result of Stop and Shop’s actions, the shopping plaza has died and is an eye sore in
the center of town. The town’s library sits in the middle of this dilapidated strip mall. Consider
the impact on kids that should be using the library. Civic pride suffers. In 1999 when we
surveyed supermarket prices in 19 Royal Ahold stores in Connecticut and Pennsylvania we
found a strong correlation between the HHI and Royal Ahold price levels. Putnam, with a single
Stop and Shop, one smaller old supermarket was the most concentrated market. It also had the
highest prices of all the supermarkets that we checked (Cotterill, 1999 p.16). Stop and Shop’s
motive seems clear. They exclude competitors and charge higher prices.
Figure 1 and 2 provide price evidence on milk pricing at Stop and Shop in the Hartford
and Providence IRI areas. Note that after the Royal Ahold acquisition, Stop and Shop’s milk
price moved up in both market areas and remained higher than those of all other supermarkets.
The crossover occurs earlier in Hartford than Providence possibly because the acquisition was
completed earlier in Connecticut than in Rhode Island where the debate over divestiture to Ro-
Jacks delayed settlement several months since 1996. Stop and Shop is the price leader in
Southern New England for milk and has led prices up.

8
II.2 The Increase in Concentration in New England Fluid Processing
Since 1972, the market structure of fluid milk processing in New England has collapsed
to a single dominant firm, Dean Foods, with extensive private label processing, the Garelick
fresh milk brand and other secondary brands. In July 1997, co-temporal with the Dairy Compact
implementation, Suiza Dairy, the precursor of Dean Foods, purchased the Garelick Company and
entered New England. In July 1998, Suiza purchased another leading New England milk
processor, West Lynn Creameries; and in August 1998 it purchased yet another leading
processor, Cumberland Farms. Cumberland Farms had a reputation for being aggressively
competitive when bidding against Suiza/Garelick for private label contracts (Healy, 2000).6 The
Cumberland merger should never have been sanctioned by the antitrust authorities. Thereafter,
Suiza purchased Natures Best Dairy in Rhode Island and attained control of New England
Dairies in Hartford, CT through a joint venture with Dairy Farmers of America.
On June 1, 2000, Suiza/Garelick commenced supplying private label milk and Garelick
brand milk to Stop and Shop. Prior to that, Stop and Shop processed its own private label milk
in addition to processing and distributing the Hood milk that it sold in its supermarkets.7
Moreover, Stop and Shop also controlled the marketing, including pricing of Hood milk in its
6 Several independent industry sources corroborate this fact. 7 This is common knowledge in the New England dairy industry. Several independent industry sources corroborate this fact. Also, one can use the USDA Health Inspection Service plant numbers that by law are printed on every container to identify the processing plant. Hood milk sold in Stop and Shop had the same plant number as Stop and Shop private label during this era. Today, Stop and Shop and nearly all other private label milk in southern New England comes from plant no. 35-100, the Dean Foods plant in Franklin, Massachusetts that also bottles Garelick and Sealtest milk.

9
stores (Beatty). This means that for Stop and Shop there is no question over who controlled
prices on 80 percent of the milk that it sold prior to July 2000.8
The 15-year strategic alliance contract (Gorenstein) that ties Stop and Shop to Suiza was
scrutinized and modified by the New England state attorney generals on antitrust grounds.9 The
states alleged the following:
“the February 2000 transaction would increase concentration in the market for sale of fluid milk products in New England by reducing the level of milk processing capacity in New England that is not controlled by Suiza….Suiza could unilaterally exercise market power resulting in increased prices to retailers and consumers, and that the transaction would increase barriers to entry for Suiza’s competitors and potential competitors by making it more difficult for them to obtain capital to build capacity.” (Sorrell, June 25, 2001)
The consent decree provided the following resolution:
• “Suiza shall offer 30 million gallons of its New England milk processing capacity per year, for a period of five years, to its competitors. Competitors who want to utilize Suiza’s New England milk processing capacity will enter into processing agreements with Suiza.
• Suiza and Stop & Shop shall not honor their past agreement to restrict Stop & Shop stores from selling competitors’ milk or cream products, and shall not enter into any agreements in the future to restrict Stop & Shop stores from selling competing brands.
• Stop & Shop shall not sell the milk processing assets of the Readville plant to Suiza, and may only sell the assets to a party approved by the Vermont Attorney General.
• Suiza shall not purchase or otherwise acquire an ownership interest in any dairy processing facilities in New England without first notifying the Vermont Attorney General and allowing the Vermont Attorney General time to Investigate the proposed transaction.
• Suiza shall not sell, close or cease operations of any New England dairy plants without first notifying the Vermont Attorney General.” (Sorrell, June 25, 2001)
8 A similar situation holds today in the Pacific Northwest where Safeway and Kroger (Fredy Meyer and Quality Food Centers) operate their own milk processing plants. The benefits of high retail prices accrue entirely to the integrated chain. 9 The lead author of this testimony served as economic expert for the states.

10
In a separate agreement Suiza agreed to continue purchasing its raw milk from Stop and
Shop’s traditional supplier, St. Albans cooperative. Leon Berthiaume, General Manager of the
St. Albans Dairy Cooperative, said:
“We appreciate the extensive efforts of the Vermont Attorney General’s Office to protect the interests of consumers, farmers and processors in our state. The results of this process will prove to be beneficial to all interested parties.” (Sorell, June 25, 2001)
John Kaneb, President of HP Hood Inc., a company whose products would have been
disadvantaged by the agreement, also praised the settlement:
“I congratulate the Vermont Attorney General on bringing about a result that helps preserve competition in the New England dairy industry, while allowing a commercial transaction between private parties to go forward. This is constructive antitrust policy in action.” (Sorrell, June 25, 2001)
Table 2 gives an estimate of the market shares in all of New England for the leading milk
processors for the year ending June 30, 2000. We have no more recent data; however, these
shares are reasonably accurate today. Before the Stop and Shop private label contract
Suiza/Garelick accounted for 44.8 percent of fluid milk sales to supermarkets. This is more than
twice the share of the number two processor, Hood. Suiza/Garelick is nearly three times larger
than Hood if one removes the Stop and Shop Hood milk from Hood’s share. After the June 2000
closing of the Stop and Shop plant, Suiza controlled 63.7 percent (44.8 + 18.9) of the New
England supermarket channel. This market share may have increased since then because in the
15 year strategic alliance, Stop and Shop clearly has less incentive to sell Hood milk (Baily,
March 24, 2000).
After the consummation of the Stop and Shop deal, Suiza/Garelick may sell more than
four times the volume of milk than its nearest competitor, Hood, sells in New England. The

11
Suiza/Garelick market share in the smaller Boston IRI market is even higher and probably falls
in the 80-90 percent range after the Stop and Shop acquisition.
Strictly speaking, these market share estimates are for the supermarket channel; however,
Suiza/Garelick’s dominance in other channels is most probably similar. There are very few
alternative suppliers. Also, one could include milk plants around Albany, New York in the
market. Both Suiza and Crowley have plants there. Such changes do not alter the following
conclusion. By 2000, Suiza was unmistakably the dominant milk processor in New England.10
As Suiza acquired its market share, it actually closed or caused the closure of several very
substantial milk plants including the Stop and Shop Readville, MA plant, the New England
Dairies plant in Newington, CT, and the Cumberland Farms-Massachusetts plant. Today it
operates two large plants in southern New England in the Boston IRI market area (Franklin, MA
and West Lynn, MA). Suiza’s East Greenbush, New York plant near Albany and two smaller
plants in Vermont and Maine also supply milk to New England. As a result of Suiza’s related
plant closings, by 2000 there was dramatically less processing capacity in New England and little
excess capacity outside of the Suiza plant system (Healy, 2000).11
Suiza’s rise to dominance in the New England market was associated with a visible
elevation and changed pricing philosophy relative to Hood. In Figure 3, the Garelick and private
label retail price moves in 1999 and 2000 that widen the marketing margin are at least in part due
to price leadership by Suiza-Garelick at the processor level.
10 Lest one think that this dominance does not effect conduct. Industry executives now request anonymity when providing information for fear of retaliation by Dean Foods. 11 In response to the disappearance of capacity and increased demand for an alternative to Dean Foods, Guida-Siebert Dairy, New Britain, Connecticut expanded capacity in 2001. Plant numbers on milk bottles and information from Alex Guida, president of Guida-Siebert Dairy indicate that it now supplies BIG Y, a regional chain, with private label milk.

12
The only other explanation for the disappearance of the gap between Hood and the other
two products in Figure 1 is that retailers exclusively controlled the retail prices and priced in a
fashion to generate a very significant shift in volume away from private label and Garelick to
Hood.12 In fact for the market leader, Stop and Shop, the incentive was to disadvantage Hood.
On April 5, 2001, Suiza Foods, the number two fluid processor in the nation, announced
that it was merging with Dean Foods, the nation’s largest processor, to create a company named
Dean Foods that would control approximately 40% of the nation’s fluid milk processing. In
many regional fluid processing markets, but not New England, this merger created serious
antitrust problems. After negotiation with the U.S. Department of Justice, Antitrust Division, the
merger was consummated in December 2001. The DOJ required Dean to divest 11 fluid milk
plants to three individuals and Dairy Farmers of America, who sold its 1/3 interest in Suiza back
to the company. DFA and the private owners each own one half of the newly created company,
National Dairy Holding (U.S. DOJ, 12/18/2001; PR Newswire, 12/21/2001). Dean remains the
nation’s largest fluid processor with $8.12 billion in sales in 2002, and NDH is the third largest
with $2.3 billion sales (Dairy Field, 6/2003)13. Soon thereafter National Dairy Holdings acquired
Crowley Foods (Binghamton, NY) from a Dutch multinational. In that deal, NDH entered the
New England fluid market because Crowley owns Weeks Dairy in Concord, New Hampshire,
and a fluid plant near Albany that can ship into New England.
12 See Cotterill and Tian (2003) for estimation of Hood, Garelick, and private label demand curves for the Boston market. 13 Kroger, the nation’s second largest supermarket chains, is the number 2 processor with sales of $2.8 billion.
13
II.3 The Increase in Concentration in Fluid Milk Assembly and Vertical Relationships with Processors.
Both the National and the New England fluid milk industries are an example of the
replication hypothesis, a venerable idea from industrial organization theory. As economic
concentration occurs at one stage in a multistage channel, the replication hypothesis predicts
concentration increase at other stages in the channel. Indeed, large fluid milk processors and
large fluid milk cooperatives often assert that “the demands” of serving dominant supermarket
chains that are national, or at least multi-regional in scope, has driven consolidation in fluid
processing and that in turn has driven consolidation in cooperative milk assembly.
Until recently, milk assembly in New England was easily classified into three primary
groups. The Agrimark cooperative was the largest player supplying milk to many fluid
processors including Hood and Guida, current Agrimark customers. The St. Albans Cooperative
shipped all of its fluid milk to the Stop and Shop milk plant. The third block of milk in New
England was from independent farmers that Garelick, among others, had under contract.
Agrimark and St. Albans supplied well over 50% of the fluid milk in the New England fluid milk
market order prior to its consolidation in 2000 into the new Northeast milk market order that
includes New York, Philadelphia, and Washington DC.
Today the situation is very different. It also is very unstable because of continuing
instability in the structure of fluid milk processing in the region. The predecessor to Dean Foods,
Suiza Dairy, was 1/3 owned by Dairy Farmers of America (DFA). Suiza Dairy had a fluid full
supply contract arrangement for milk from DFA in regions where DFA offered milk. In the
northeast, DFA includes the former Eastern Milk Producers Cooperative of NY. Eastern was a
part of Milk Marketing Inc, Strongville, Ohio and it merged with two Midwestern cooperatives
to form DFA. DFA strengthened its position in the northeast in 1999 by forming a marketing

14
agency in common, named Dairy Marketing Services (DMS), with Dairylea, the leading dairy
cooperative in NY (Associated Press, 9/2/99). Suiza Dairy (1/3 owned by DFA at this time) then
strengthened DMS by making it the milk assembly agent for its independent farmers nationwide.
This included the independent farmers in New England. St. Albans joined DMS because its
access to the fluid milk market via the Stop and Shop/Suiza agreement expires in 2006. Finally
the NDH (50% owned by DFA) plants in Concord, NH and near Albany, NY are also under full
supply contracts with DMS. In New England these moves have made DMS the major fluid milk
assembler with Agrimark, a distant second.
Looking to the Northeast, Atlantic Dairy Cooperative was the supplier of as much as 80%
of the fluid milk to the Philadelphia market order that was merged into the Northeast Order in
2000. It was acquired by Land O’Lakes. In August 2003 Land O’Lakes fluid milk assembly in
the Northeast also joined the DMS marketing agency in common (The Business Journal, 8/4/03).
DMS now supplies Dean Foods and National Dairy Holdings plants in New York, New Jersey,
and Pennsylvania as well as New England. These plants are dominant in the northeast fluid
market.
What are the impacts of the consolidation of milk assembly under the DMS banner?
DMS promotes itself as a harbinger of efficient milk assembly, thereby lowering hauling charges
and improving farmer mailbox prices.
“Dairy Marketing Services (DMS) is a milk marketing organization formed for the purpose of creating efficiencies and reducing costs of milk assembly, field services, and transportation. It serves farmers by working to streamline the milk marketing system, and serves processors by being better able to meet their needs.” (Dairy Marketing Service, 2003).
Undoubtedly these are legitimate efficiencies. But we doubt that they are more than a few cents
per hundredweight. For example, nearly all of northern Vermont milk in the DMS system today

15
was assembled in St. Albans and that will not change. In Pennsylvania all milk in the DMS
system was assembled by Atlantic Dairy/Land O’Lakes and that will not change. In upstate New
York, Dairylea, DFA, and independents shipping to Dean and NDH (Crowley) may have had
overlapping costs that can be rationalized. However, that gain may not be large for larger farms
that can fill a tanker or a large part of a tanker.
On the other side of the accounting ledger several antitrust concerns surface. Does DMS
have monopsonistic power against farmers? Does DFA have undue influence over DMS and
consequently do northeast dairy farmers lose? DFA is a multinational operation with its roots in
the Midwest. Also it is a “top down” organization that behaves more like a proprietary firm than
a cooperative. This may have benefits, but it leads northeast farmers to question whether it
represents and acts in their best interests. Does DMS have monopolistic power in the raw milk
market that enables it to extract large over-order premiums from processors and retailers?14
These questions are very hard to answer with empirical evidence at this time because the
DMS/DFA track record is very short. For insight, let’s retreat to the documented structural
changes in the dairy channel, the profit maximizing drive by all players in the channel including
farmers via their cooperatives, and the economic implications of these two facts. Structurally we
have dominant firms or tight oligopoly in nearly all local retail markets. We have dominance in
many regional fluid milk processing markets and we have a dominant cooperative agency
assembling milk. This means that many fluid milk marketing channel are faced with the
successive firms with unilateral market power.
14 DFA field representative (not DMS) has used the promise of cooperative power in presentation to potential member in New England. To date the primary manipulation had not been in fluid milk processing. It is the Cooperatives Working Together (CWT) program which is in our opinion, and the opinions of other agricultural economists, an ill-fated attempt to control supply. When it comes to supply control cooperatives are not as well suited as the federal government, which can eliminate free riders.

16
Elsewhere, we have written about the problem of double or in this case triple
marginalization in a marketing channel (Cotterill 2001, 2002c). As these successive firms move
to exercise market power against consumers the tendency is to elevate prices too high, damaging
channel profits as well as consumers. One needs a vertical strategic alliance to internalize this
pricing externality, i.e. the participants at the three steps of channel must jointly set the retail
price and agree upon the division of the resulting profits. One must ask if this type of vertical
price fixing is legal? Is it subject to a rule of reason test that balances market power from
vertical cooperation with efficiency gains from eliminating double or triple marginalization? In
other words, do these vertical strategic alliances between retailers and processors, and between
processors and cooperatives create barriers to entry that enhance the partners’ ability to deviate
from competitive pricing? Clearly the New England Attorney General thought this to be the case
in the Stop & Shop/Suiza-Dean strategic alliance.
This leads us to a current antitrust matter, the proposed merger between NDH and Hood
in November 2002 (Cohen, 8/4/2003). This proposed merger would combine Hood and the
Crowley Albany and Concord plants. This horizontal merger should not be allowed from the
consumer’s side because it reduces competition in the highly concentrated New England fluid
market. A cogent argument can also be made from the farm side of the market. The Agrimark
Cooperative would lose its fluid milk sales to Hood because NDH/Hood would move into the
DMS/DFA full supply contract camp. This fluid loss threatens to depool Agrimark from the
fluid milk market order because the coop may consequently sell less than 20% of its members’
milk in Class 1. Agrimark members would then be paid lower cheese milk prices rather than the
higher blend pure that include sales at the higher Class 1 price.

17
Due to strong resistance from the state and federal antitrust agencies and elected
representatitives, NDH and Hood withdrew their merger proposal on May 12th. At that time,
they announced a co-mingling of ownership rather than outright merger between NDH, Hood,
and DFA. This second proposal is still under review. Again any form of interlocking
directorship or management between Hood and Crowley will damage competition in fluid
processing in New England.
If the combination transfers Hood fluid needs to DMS, Agrimark’s alternatives include
selling sufficient Class 1 milk at more distant fluid plants in the order (New York City, New
Jersey) which would increases transport cost deductions for its members. The other option is to
join DMS and effectively complete the monopolization of fluid milk assembly in the northeast.
If DMS in fact does achieve a monopoly on milk assembly in the northeast; will it be able
to extract over-order premiums from processors and retailers? We think not. If DMS attempts to
do so then Dean Foods could counter by retrieving its independent farmers and resorting to
traditional pool busting pricing practices as in the RCMA era in the early 1990s in the northeast.
In short, DMS can capture legitimate efficiencies, but it may be pushing on a rope if it attempts
any significant over-order pricing in the northeast. This also suggests to us that in any tripartite
division of profits, DMS will come up short because it has the weakest bargaining position.
Processors and retailers have far stronger positions.
III. Recent Price Performance in the NY and New England Fluid Milk Marketing Channels: the Impact of Public Policies and Private Power
Events in the northeast dairy industry including changing market structures and changing
federal and state dairy policies have had dramatic effects on the performance of fluid milk
marketing channels. In 1991, New York passed a price gouging law that limits retail prices on

18
one brand of milk to no more than 200% of the price paid for 3.5% raw fluid milk. This raw
price includes over-order premiums that raise price above the announced federal order Class 1
price. At that time, the New York legislature also passed a law that gave the state the authority
to levy over-order premiums for farmers. This subsequent law was declared unconstitutional. In
effect, downstate consumers interests received their part of the logroll, but upstate farmers were
denied theirs.
Why did the NY legislature pass these two laws? Huff (2003) documents that farmers
were suffering from an extended period of low milk prices and downstate retail prices remained
high. The lack of effective price transmission hurt consumers who continued to pay high prices
and farmers because fluid consumption did not increase. Clearly the NY legislature wanted to
elevate raw fluid milk prices and eliminate price gouging by channel firms.
A similar but longer raw fluid price trough occurred between October 2001 and July
2003. Figure 4 illustrates the situation for Boston. The two vertical lines indicate the period
when the Northeast Dairy Compact was in effect with its price floor at $1.46 per gallon ($16.94
per cwt). Between October 2001 and January 2002, raw milk prices measured by Class 1 plus
coop premium price series, dropped 34 cents per gallon. This price fell another 22 cents by July
2003, for a total decline of 56 cents per gallon. Retail prices dropped only 10 cents. What is
going on?
Agricultural economists have traditionally analyzed this price transmission problem by
correlating the retail price with the farm price, controlling for changes in the prices of other
impacts. The challenge to this approach is to find a good measure of other input prices.
Moreover, the retail price series in Figure 4 is only for whole milk, price checked at two chain
stores and one convenience store. It may not accurately reflect retail prices. Also, one routinely

19
does not have a wholesale price in these studies so one cannot determine margins at the
processing and retailing stages of the channel.
Over the past year at the University of Connecticut we have developed a different
analytical approach. In November 2002, we surveyed prices in 191 stores from 35 grocery firms
located in NY, CT, MA, and RI (Cotterill et al, 2002). We found that retail milk prices in
supermarkets were 59 cents per gallon lower, on average, in NY than southern New England.
We were able to confirm the average milk price reported for November in Figure 4 but also
provide pricing details for individual chains and types of milk.
We repeated a mini survey in March 2003 of the leading chains in Connecticut and added
a critical component to our analysis. We obtained wholesale milk prices, i.e., the price the
processors charge for delivering bottled fluid milk into the dairy case coolers of supermarket
chains, from Dairy Technomics. This firm routinely measures raw milk prices, processing, and
delivery costs for supermarket chain buyers who use the information to bargain for lower
wholesale milk prices. Dairy Technomics estimates are for specific plants and for deliveries to
specific chains. Dairy Technomics estimates have been verified as accurate by milk processors
and by outside audit (Cotterill, 2003). For example, we found that Dean Foods delivers gallons
of private label and Garelick milk from its Franklin, MA plant to Stop & Shop under its 15-year
strategic alliance for the price it pays for raw milk plus 52.5 cents per gallon. Dean delivers the
same milk from the same plant to all other chain supermarkets in southern New England for the
same raw pay price plus 61.5 cents per gallon (Cotterill et al, 4/23/03).15 The Dairy Technomics
estimates allow us to determine the wholesale price, processor and retail gross margins.
15 This suggests that other retailers may have a secondary line Robinson-Patman case against Dean. They do pay higher prices than Stop and Shop that probably are not cost justified. However, Stop and Shop has not used their cost advantage to damage the other chains. They have exercised price leadership, elevating retail prices so a R.P. suit fails because the plaintiffs are not damaged.

20
Our results for March 2003 are reported and discussed elsewhere (Cotterill et al, 4/23/03,
Cotterill, 2003). Appendix Figure 1 to this testimony displays chain and brand level prices for
March 2003.
In June 2003, in cooperation with the NY Attorney General, we conducted an extensive
survey of New York and a replication of the November survey. We also obtained processor
costs by plant for delivering to different supermarket chains from Dairy Technomics. Price
survey results are reported in Rabinowitz et al (2003). Also see the Cheese Reporter article
attached in Appendix B for an excellent review of results. This week (October 26-31, 2003) we
are again surveying the same stores and obtaining Dairy Technomics estimates for the processing
stage.
This series of surveys over a year where, as documented in Figure 4, farm prices were
low, continued to fall and recently increased dramatically will allow us to analyze channel
margins over time and changes in them as well as retail prices as farm price changes. Moreover,
we can analyze changes under the price gouge law in NY and compare them to New England
where there is no such law. We also can analyze price changes by brand in each of several firms
including some who operate in NY as well as New England.
Since we have not had time to analyze the October 2003 data, we focus on June 2003
prices and a comparison to November 2002. The weighted average all milk price for
supermarket chains in New England in June 2003 averaged $3.01 per gallon, the same as we
found in November 2002. By comparison the average price for supermarkets in NY was $2.31
per gallon, down 11 cents from their November 2002 price. Two major conclusions follow.
First, milk is 70 cents per gallon cheaper in the surveyed NY area (Long Island, metro NY city
and the Hudson river valley up to Albany) than in southern New England. Second, when the raw

21
fluid price dropped eight cents a gallon in Boston retail prices did not drop in New England but
they did in New York. We concur with Huff (2003). The NY price gouge law improves farm to
retail price transmission.
Table 3 reports all milk prices for individual chains in NY and in New England. Note
that Stop & Shop charged $3.21 per gallon, up 3 cents from November in New England, whereas
in NY the chain charged only $2.45 per gallon, down 14 cents from November. One observes
similar differentials for other chains that operate in New England and New York. Wal-Mart
however is an exception. Wal-Mart charged $2.54 per gallon in June 2003 in New England
down 25 cents from its November 2002 price. Wal-Mart appears to have responded to our call
for lower milk prices in New England (Cotterill, 2002a). Wal-Mart prices in NY are lower at
$2.10 per gallon, however they dropped only 5 cents from November 2002.
Figure 5 is the most important chart in this testimony. It gives the raw milk prices by
brand for each of the top four supermarkets in southern New England. It also gives the Dairy
Technomics wholesale dollar margin for each brand. The sum of the processor margin and the
raw milk price is the wholesale price for milk delivered into the coolers at the chains stores.
Finally, Figure 5 gives the retail dollar margin and the retail price by brand for each of the four
chains.16
The first column in Figure 5 is the all milk average for southern New England.
Processors paid farmers $1.031 per gallon and collected 59.6 cents per gallon for processing and
distribution of milk to supermarket chains. The average wholesale price was $1.627 per gallon.
The average retail milk price is far higher–$3.07 per gallon. Supermarkets kept $1.447 per
gallon, nearly half of the retail price for in store costs and profits. Research at the University of
Maine and Penn State University indicate that in store costs for large chain stores is as low as 20 16 See Rabinowitz et al (2003) for survey details.
22
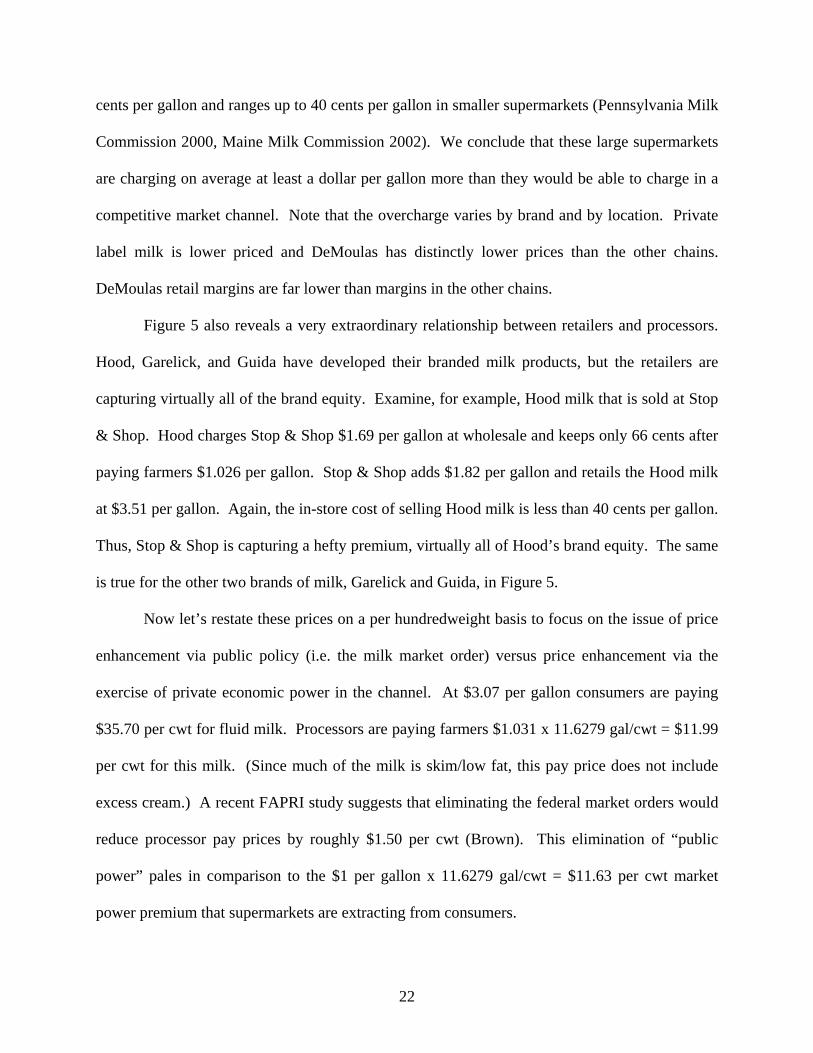
cents per gallon and ranges up to 40 cents per gallon in smaller supermarkets (Pennsylvania Milk
Commission 2000, Maine Milk Commission 2002). We conclude that these large supermarkets
are charging on average at least a dollar per gallon more than they would be able to charge in a
competitive market channel. Note that the overcharge varies by brand and by location. Private
label milk is lower priced and DeMoulas has distinctly lower prices than the other chains.
DeMoulas retail margins are far lower than margins in the other chains.
Figure 5 also reveals a very extraordinary relationship between retailers and processors.
Hood, Garelick, and Guida have developed their branded milk products, but the retailers are
capturing virtually all of the brand equity. Examine, for example, Hood milk that is sold at Stop
& Shop. Hood charges Stop & Shop $1.69 per gallon at wholesale and keeps only 66 cents after
paying farmers $1.026 per gallon. Stop & Shop adds $1.82 per gallon and retails the Hood milk
at $3.51 per gallon. Again, the in-store cost of selling Hood milk is less than 40 cents per gallon.
Thus, Stop & Shop is capturing a hefty premium, virtually all of Hood’s brand equity. The same
is true for the other two brands of milk, Garelick and Guida, in Figure 5.
Now let’s restate these prices on a per hundredweight basis to focus on the issue of price
enhancement via public policy (i.e. the milk market order) versus price enhancement via the
exercise of private economic power in the channel. At $3.07 per gallon consumers are paying
$35.70 per cwt for fluid milk. Processors are paying farmers $1.031 x 11.6279 gal/cwt = $11.99
per cwt for this milk. (Since much of the milk is skim/low fat, this pay price does not include
excess cream.) A recent FAPRI study suggests that eliminating the federal market orders would
reduce processor pay prices by roughly $1.50 per cwt (Brown). This elimination of “public
power” pales in comparison to the $1 per gallon x 11.6279 gal/cwt = $11.63 per cwt market
power premium that supermarkets are extracting from consumers.

23
Private economic power and excess milk profits outweigh federal market order price
enhancement by a ratio of 7 to 1 in New England. Those who think doing away with federal
market orders would benefit consumers and farmers in low fluid utilization areas (e.g., upper
Midwest) due to lower retail prices and increased fluid milk consumption need to think again.
The primary beneficiaries of order deregulation may well be processors and retailers.
Moreover, the use of private power in the channel is destroying the economic basis of the
orders. Retailers will elevate milk prices until the demand for milk becomes elastic, i.e., the
percent decline in milk sold is greater than the percent increase in price. When milk prices are
elastic the Class 1 price discrimination scheme of the federal orders reduces rather than increases
the blend price that farmers receive. At that point, private economic power completely destroys
the classified pricing system of the federal orders.
IV. The Impact of Market Power on Northeast Dairy Farmers
A critical question remains for analysis. Is the margin enhancement due to the exercise
of market power against consumers or is it also due solely to the exercise of market power
against northeast dairy farmers? We can actually answer this question by referring to the Jesse et
al quote at the beginning of this testimony and the related federal market order reforms that
occurred during the 1990s. Class 1 differentials were reduced, effectively leveling the
geographic impact of the market order system’s price discrimination scheme. Today, Class 1
milk at the Eau Claire, Wisconsin basing point is $1.70 per hundredweight over the
manufacturing milk price. This amount is the price discrimination component (assuming no
higher costs for supplying fluid) that is common to all federal milk market orders. This Class 1
differential increases as one moves east until it is $3.25 per hundredweight in Boston. If the

24
manufacturing milk price is $9.75 per cwt, as it was in June 2003 then the Class 1 minimum in
Wisconsin is $9.75 + $1.70 = $11.45 per cwt and it is $9.75 + $3.25 = $13.00 per cwt in Boston.
Jesse et al calls the geographic components of the Class 1 differentials “pricing distortions” and
states that these are now so low that competition sets regional milk prices:
“…competition has operated both within and outside the orders to mitigate the effect of these pricing distortions. For example, low Class 1 differentials in Wisconsin are augmented by large over-order Class 1 price premiums negotiated by cooperatives. Cooperatives premiums are relatively low in other markets and nonexistent in some. This tends to equilibrate effective Class 1 prices, even though the order minimum prices may be distorted. …” (Jesse et al, 2002 p.21) Since manufacturing milk prices are identical in Wisconsin and Boston, any geographic
federal order distortions disappear when fluid market prices set by over order premiums. This
means that the reported mailbox prices for Wisconsin and the northeast, i.e. the prices that
farmers actually receive for their milk are geographically competitive prices that reflect the
supply and demand for milk throughout the nation.
Let’s look at those mailbox prices for Wisconsin and the northeast. Table 4 reports them
for 2002 and the final seven months of 2003. In 2002 the Wisconsin mailbox price averaged
$12.02 per cwt whereas in the northeast it was LOWER at $11.89 per cwt. For 2003 to date they
are essentially equal but in July 2003 the northeast mailbox price at $11.63 was 63 cents
LOWER than the Wisconsin price, $12.26.
In a geographically competitive raw milk market, the mailbox prices in the northeast
should be higher not lower than those in Wisconsin. As one moves east from the Midwest prices
should rise by the transportation costs. They do not.
Alternatively, northeast milk prices at $11.89 per cwt are clearly below the cost of
production for virtually all dairy farmers in the region. If a number of them go out of business
and one has to haul milk or dairy products from Wisconsin, one will have to pay farmers there

25
$12.02 per cwt or more for their milk and also pay the transportation cost to the northeast. Milk
and dairy product prices in the northeast will be higher not lower as northeast dairy farmers go
out of business and product comes in from Wisconsin.
Jesse et al state that in “deficit milk markets”:
“… Setting minimum prices at levels that promote year-round local fluid milk self-sufficiency is inefficient relative to setting prices that result in a combination of local production and shipments from other markets. …”
We disagree with this presumption for the northeast given current market conditions. As
our farmers go out of business, milk and milk products from the Midwest will cost consumers
more not less.
So why are mailbox prices less in the northeast than the Midwest? The answer is that
retailers and processors in the northeast are not paying over-order premiums that are as high as
those in the Midwest. Also cheese plants in the northeast are not paying premiums that are as
high as the cheese milk premiums in Wisconsin. Northeast raw milk markets, relatively
speaking, are dominated by the milk channel firms at the expense of the region’s dairy farmers.
Monopsony power the northeast dairy markets is a major force.
Professor Jesse from the University of Wisconsin understands this situation. As reported
in a recent Cheese Report article he recognizes that Wisconsin farmers have benefited from
cheese premiums as well as over-order Class 1 premiums. He also recognizes that it may be hard
to maintain cheese premiums in the face of the expansion of cheap milk in the far west and new
cheese plants out there.17 Among others he sees the following solution: a shift up from 10% of
17 Northeast farmers have often been admonished for wanting higher Class 1 prices because they would contribute to over production of milk. Jesse et al (2002) and many others make this link. Consider the following facts. In 2002, there were 255 thousand dairy cows in New England, down 7 thousand cows from 2 years earlier. During the same two years, California, Idaho, and New Mexico EXPANDED their herds by 220 thousand cows (USDA, 2002 and 2003b). Higher fluid milk prices in New England would have virtually no impact on the national supply situation. The problem is in the west and must be dealt with there or at the federal level.

26
Wisconsin cheese production in value added specialty cheeses where the premium can be
maintained and the capture of more of the east coast fluid milk market (Mueller, Sept 12, 2003).
“Jesse leaves the door open, however, for the possibility that Wisconsin’s average milk price will not be lower relative to the national average. For that to happen, …, milk production would have to continue to fall in the East in order to open that market there for fluid milk from Wisconsin, and the state’s dairy processing industry would have to shift significantly from the production commodity cheese to more specialty cheeses (about 10 percent of the state production now)” (Mueller 2003).
On the scope of fluid milk markets Jesse et al clearly think the market is now national.
They state:
“Recognize the national scope of fluid milk markets. Policies need to recognize that dairy products – including fluid milk – trade in national markets. The concept of a local milkshed became obsolete when grocery chains began to maintain national distribution systems for both perishable and nonperishable items.” (Jesse et al, 2002)
Dairy processors also think this way.
“By pasteurizing and homogenizing, and blow molding and filling bottles in a sterile environment, Dean now produces milk-based drinks that don’t require refrigeration and can sit on a shelf for 150 days. Instead of delivering directly to stores, Morningstar can ship drinks through a network of warehouses and sell them in soda aisle of grocery stores. At $12 million per filling line (which can do 18,000 bottles per hour), the technology doesn’t come cheap. But, as Engles points out, ‘somebody was going to do this. We’re trying to be first.’ And, of course, biggest.” (Cook, 2003)
One should regard this trade puffery with a strong dose of skepticism.18 We would stress that the
national fluid market that Jesse et al and Dean proclaim is not here yet and may never be the
predominant fluid milk market structure. Fresh milk is still in most situations produced
reasonably close to where it is consumed, and we would maintain that a low cost supply of fresh
milk in the northeast will continue to be produced for the foreseeable future in the northeast.
18 In 2000, a top Suiza Dairy executive regaled a conference of agricultural economists with grand predictions for their new milk products, “Kids Milk” and “Life Milk.” These products were to appeal to moms who wanted to get more calcium, and vitamins into their kids and young adults. At over $4.50 per gallon they have been noticeably unsuccessful.

27
V. Antitrust Policy and Dairy Policies Need to Address the Low Raw Fluid Milk Prices in the Northeast
What does the rise of private pricing power in the dairy marketing channel suggest for
dairy policy? We think there are two avenues. First at the federal level one could restore Class 1
differentials to levels that limit the exercising of channel firms power against farmers. After all
one of the original reasons for establishing market orders was to countervail channel firm market
power and restore “orderly” marketing to the milk industry. Alternatively, regional milk pricing
policies in areas where this problem exists are in order to elevate farm prices.
Antitrust enforcement that prevents further consolidation also is a good idea. But in
many regions, shutting this door does no good because the horse is already out of the barn.
Recently, in Chicago, a consumer class action lawsuit against the dominant supermarket chains,
Jewel and Dominick’s failed because the price leadership scheme they use is not price fixing.
Jewel sets a high price. Dominick’s and others match that price. Since no one talks (conspires)
with others to set the price, their conduct is legal (Zimmermann, 2003).
When antitrust is ineffective, economists look to regulation to improve economic
performance. The New York price gouging law limits retail price to no more than 200% of the
raw milk price processors pay. Prices, on average, in New York are 70 cents per gallon lower
than in New England. New England states are now considering such laws, but these only benefit
consumers.
Another alternative is a price collar at the processing as well as retail level; as was
recently proposed in Connecticut (Cotterill et al 2003).19 A 140% price collar on the wholesale
19 See Appendix B, Cheese Reporter article, “Controversy Over Level Of Farm Versus Retail Milk Prices Continues” and “A letter to the editor in response to the "Controversy Over Level Of Farm Versus Retail Milk Prices Continues” for more explanation of the price collar proposal.

28
price provides an incentive for processors to pay higher over-order premiums to farmers.
Alternatively, they lose money along side farmers in low raw price markets. Processors need 60
cents per gallon to cover their costs. At $1.00 per gallon raw milk price they can charge retailers
only $1.40. If they pay farmers an additional 50 cents, then the raw price is $1.50, and they can
charge $2.10 and recover the 60 cents. Placing a 130% price collar on retailers means retailers
can charge up to 1.3 x 2.10 = $2.73 per gallon. Consumers pay 34 cents per gallon less than
$3.07 per gallon, and farmers gain 50 cents per gallon. Given that farm milk prices are severely
depressed, this reallocation of income in the channel may be appropriate.
The bottom line is this. Vigorous antitrust enforcement is important, but it may be time
for policy makers to re-examine fluid milk channel pricing and to consider new approaches to
dairy policy. One has opportunities to argue for regional milking pricing policies that promote
dairy farming in regions such as New England by promoting more efficient as well as more fair
milk market channel pricing. Doing so also preserves the effectiveness of classified pricing
under the federal orders.

29
References
Associated Press. 1999. Dairylea and Missouri Cooperative Join in Milk Marketing Deal. The Associated Press State & Local Wire, Business News, September 2.
Bailey, S. 2000. Casualty of War. The Boston Globe. March 24; C1. Balagtas, J.V. and D.A. Sumner. 2003. The Effects of the Northeast Dairy Compact on
Producers and Consumers, with Implications of Compact Contagion. Review of Agricultural Economics, 25: 112-144.
Brown, Scott. 2003. “The Effect on the United States Dairy Industry of Removing Current
Federal Regulations.” FAPRI at the University of Missouri, Food and Agricultural Policy Research Institute, UMC Report #03-03, April. http://www.fapri.missouri.edu
Cohen, Judy Radler. 2003. Dairy Farms Milk Few Takeout Deals. Mergers and Acquisitions
Report, August 4. Cook, Lynn J. 2003. Got Growth? Forbes, May 12. Cotterill, Ronald W. 2003. A Preliminary Response to the Report Prepared for the
Massachusetts Food Association by John Schnittker titled, "An Analysis of the Cotterill Proposal' University of Connecticut, Food Marketing Policy Center, September 4. http://www.fmpc.uconn.edu
_______ 2002a. Supermarket Milk Prices Need To Come Down (Opinion Piece). The Hartford
Courant, November 26. _______ 2002b. Comments on the Food Marketing Institutes' Submission to the FTC Workshop
Titled, "Supermarket Merger Investigations and Remedies." University of Connecticut, Food Marketing Policy Center Issue Paper No. 27, August. http://www.fmpc.uconn.edu
_______ 2002c. Who Benefits from Deregulated Milk Prices: The Missing Link is the Market
Channel. University of Connecticut, Food Marketing Policy Center Issue Paper No. 26. April. http://www.fmpc.uconn.edu
_______ 2001. Neoclassical Explanations of Vertical Organization and Performance of Food
Industries. Agribusiness 17(1): 33-57. _______ 1999. An Antitrust Economic Analysis of the Proposed Acquisition of Supermarkets
General Holdings Corporation by Ahold Acquisition Inc. University of Connecticut, Food Marketing Policy Center Research Report No. 46. April. http://www.fmpc.uconn.edu
Cotterill, Ronald W., Adam N. Rabinowitz, and Li Tian. 2003. A Law to Promote Efficient and
Fair Pricing of Milk in Connecticut. University of Connecticut, Food Marketing Policy Center, April 23. http://www.fmpc.uconn.edu/milk

30
_______ 2002. Milk Prices in New England and Neighboring Areas of New York: A Prologue
to Action? University of Connecticut, Food Marketing Policy Center, November 19. http://www.fmpc.uconn.edu/milk
Cotterill, Ronald W., and Andrew W. Franklin. 2001. The Public Interest and Private Economic
Power: A Case Study of the Northeast Dairy Compact. University of Connecticut, Food Marketing Policy Center Monograph No. 1., May 2. http://www.fmpc.uconn.edu/compact
Cotterill, Ronald W., and Li Tian. 2003. Alternative Models and Estimation Strategies for
Branded and Private Label Demand Systems in Differentiated Product Oligopolies: Fluid Milk. University of Connecticut, Food Marketing Policy Center.
Cotterill, Ronald W., Tirtha P. Dhar, and Andrew W. Franklin. 1999. Post Merger Price
Conduct: A Case Study of Pricing in Connecticut Markets After the 1996 Royal Ahold-Stop & Shop Merger. University of Connecticut, Food Marketing Policy Center Research Report No. 47, October. http://www.fmpc.uconn.edu
Dairy Field. 2003. How the Industry’s Leading Players Stay at the Top (Top 10 Outlook).
Dairy Field, June; 186 (6). Dairy Marketing Services. 2003. About DMS. http://www.dairymarketingservices.com Gorenstein, Dan. 2001. New England Attorneys General Milk Dairy Processor. NH Public
Radio, News, June 25. Healy, Jonathon L. 2000. Commission of Food and Agriculture, Massachusetts, letter to
Kenneth Becker, Executive Director, Northeast Dairy Compact Commission, February 9. Huff, Charles. 2003. A Review of New York's Milk Price Gouging Law. New York State
Department of Agriculture and Markets, August 19. Jesse, Ed, Tom Cox, Bob Cropp, and Randy Fortenbery. 2002. Rethinking Dairyland, The
Effects of Federal Dairy Programs on the Competitiveness of Dairying in Wisconsin. University of Wisconsin – Madison, Department of Agricultural and Applied Economics Paper No. 78C, September. http://www.aae.wisc.edu/www/pub/mpbpapers/mpb78c.pdf
Maine Milk Commission. 2002. Order #02-9RM Retail Margins. September 29. Mueller, Ray. 2003. Gap Between Wisconsin, National Average Milk Price Expected to Fall in
Future as Premiums Decline. Cheese Reporter, September 12, 128(10). Pennsylvania Milk Commission. 2000. Findings of Fact and Conclusions of Law. General
Price Hearing for Milk Marketing Area No. 2. August 2.

31
PR Newswire. 2001. Suiza Foods and Dean Foods Complete Merger; Combination Creates Dairy Processing and Distribution Leader Servicing Over 150,000 Customers Coast-to-Coast Via More Than 6,000 DSD Routes; Merged Company will be named Dean Foods Company and will have Annual Revenues of Approximately $10 Billion. PR Newswire, Financial News, December 21.
Rabinowitz, Adam N., Matthew Schwane, and Ronald W. Cotterill. 2003. Retail Milk Prices in
New England, New York, and Seattle: An Unresolved Issue. University of Connecticut, Food Marketing Policy Center, September 23. http://www.fmpc.uconn.edu/milk
Robinson, Deborah and Robert Pregulman 2003. Got Milked?: Who’s Skimming the Cream
from Seattle-Tacoma Milk Prices? The Washington Public Interest Research Group, August. http://washpirg.org/WA.asp?id2=10535&id3=WA&
Sorrell, William H. 2001. Attorney General Sorrell Announces Antitrust Settlement with Dairy
Giant Suiza. State of Vermont, Office of the Attorney General Press Release, June 25. http://www.state.vt.us/atg/press06252001.htm
The Business Journal. 2003. Land O’Lakes Teams up with Dairy Marketing Services. The
Business Journal (Minneapolis/St. Paul), August 4. Trade Dimensions. 2003. 2003 Market Scope. Wilton, CT. U.S. Department of Agriculture. 2003a. Milk Marketing Order Statistics, Retail Milk Prices.
United States, Department of Agriculture, Agricultural Marketing Service. http://www.ams.usda.gov/dyfmos/mib/rtl_milk_prices.htm
_______. 2003b. Dairy Market News. United States Department of Agriculture, Agricultural
Marketing Service. http://www.ams.usda.gov/dairy/mncs/index.htm U.S. Department of Justice. 2001. Justice Department Requires Suiza Foods and Dean Foods to
Divest 11 Dairy Processing Plants. United States, Department of Justice Press Release, December 18. http://www.usdoj.gov
Zimmermann, Stephanie. 2003. Cost of Breakfast Just Got Steeper. The Chicago Sun-Times,
August 30.

32
Table 1. IRI Market Area All Product Market Shares and Number of Stores of Leading Supermarket Chains, 1996, 2000, and 2003. IRI Market Data 1996 2000 2003 Number of
Stores Share Number of
Stores Share Number of
Stores Share
Boston Stop & Shop Shaws Demoulas Star Markets Roche Bros. CR4 Partial HHI Providence Stop & Shop Shaws Edwards RoJacks Daves CR4 Partial HHI Hartford Stop & Shop Big Y Shaws A & P CR4 Partial HHI
68 47 33 38 13
19 11 6 2 -
60 31 13 35
26.216.913.113.55.1
69.71325.9
46.817.88.72.8
-
76.12590.6
40.413.97.7
11.7
73.72021.6
778033
-13
2013
-66
61321620
28.526.712.6
-4.5
72.31704.2
48.023.8
-8.83.2
83.92958.9
42.215.47.67.0
72.12123.2
888034
-14
2314
-36
6935159
32.822.213.3
-4.8
73.01765.2
51.520.4
-3.76.0
81.63120.1
49.514.06.12.9
72.52695.1
The Partial HHI is the sum of the squared market shares of the four leading firms presented in this table. Source: Calculated from Trade Dimensions Market Scope 1997, 2000 Update and 2003 Mid-year
Update. Systems, Wilton, CT.

33
Table 2: Volume of Milk Sold to Supermarkets and Market Share by Manufacturer: All New England, July 1999 through July 2000. Million lbs Share Suiza (Garelick and PL) 652.99 44.8% Stop & Shop (PL) 275.26 18.9%
Total Suiza after 6/1/2000* 928.25 63.6%Hood (Stop & Shop) 69.4 4.8% Hood (All Other) 222.6 15.3%
Combined Hood 292 20.0%Guida 96.02 6.6% Crowley 33.69 2.3% Oakhurst 108.79 7.5% * Effective June 1, 2000, Suiza began supplying Stop & Shop private label milk under a 15-year contract. The Stop & Shop plant was closed. Source: Calculated from Food Marketing Policy Center IRI database. Table 3: Weighted Average All Milk Prices by Chain November 2002 vs June 2003 Chain New England New York
June 2003
Change from Nov 2002
June 2003
Change from Nov 2002
Stop & Shop 3.12 0.03 2.45 -0.14 Shaw's / Star Market 2.97 -0.01 - - DeMoulas / Market Basket 2.49 -0.05 - - Roche Bros 2.83 0.10 - - Big Y 2.92 -0.13 - - A & P / Waldbaums 3.15 0.00 2.52 -0.18 Shop Rite 3.15 0.25 2.24 -0.20 Price Chopper 3.26 0.09 2.23 -0.10 Ro Jacks 3.07 0.04 - - Hannaford N/A N/A 2.24 -0.09 King Kullen - - 2.44 -0.13 Wal-Mart 2.54 -0.25 2.10 -0.05 Pathmark - - 2.44 -0.13 Note: - means chain not in area, N/A means no observations in data Source: Food Marketing Policy Center Survey November 2002 and June 2003.
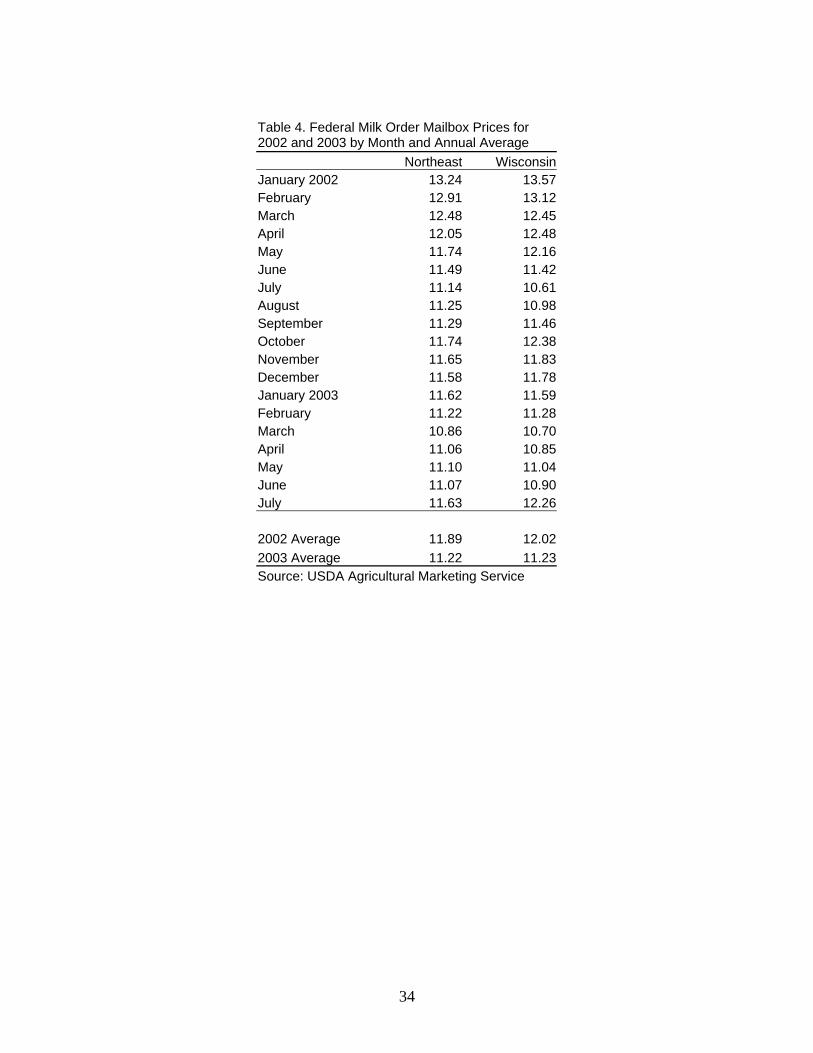
34
Table 4. Federal Milk Order Mailbox Prices for 2002 and 2003 by Month and Annual Average Northeast WisconsinJanuary 2002 13.24 13.57February 12.91 13.12March 12.48 12.45April 12.05 12.48May 11.74 12.16June 11.49 11.42July 11.14 10.61August 11.25 10.98September 11.29 11.46October 11.74 12.38November 11.65 11.83December 11.58 11.78January 2003 11.62 11.59February 11.22 11.28March 10.86 10.70April 11.06 10.85May 11.10 11.04June 11.07 10.90July 11.63 12.26 2002 Average 11.89 12.022003 Average 11.22 11.23Source: USDA Agricultural Marketing Service

35
Hartford
Stop & Shop vs All Other Supermarkets Market Level Milk Price March 1996 - July 2000
$2.30
$2.40
$2.50
$2.60
$2.70
$2.80
$2.90
$3.00
$3.10
$3.20
$3.30
3/3/
96
5/3/
96
7/3/
96
9/3/
96
11/3
/96
1/3/
97
3/3/
97
5/3/
97
7/3/
97
9/3/
97
11/3
/97
1/3/
98
3/3/
98
5/3/
98
7/3/
98
9/3/
98
11/3
/98
1/3/
99
3/3/
99
5/3/
99
7/3/
99
9/3/
99
11/3
/99
1/3/
00
3/3/
00
5/3/
00
7/3/
00
Pric
e pe
r Gal
lon
Hartford Stop & Shop Milk AO stores
Source: Calculated from Food Marketing Policy Center IRI database.
Figure 1.

36
Providence
Stop & Shop vs All Other Supermarkets Market Level Milk Price March 1996 - July 2000
$2.30
$2.40
$2.50
$2.60
$2.70
$2.80
$2.90
$3.00
$3.10
$3.20
$3.30
3/3/
96
5/3/
96
7/3/
96
9/3/
96
11/3
/96
1/3/
97
3/3/
97
5/3/
97
7/3/
97
9/3/
97
11/3
/97
1/3/
98
3/3/
98
5/3/
98
7/3/
98
9/3/
98
11/3
/98
1/3/
99
3/3/
99
5/3/
99
7/3/
99
9/3/
99
11/3
/99
1/3/
00
3/3/
00
5/3/
00
7/3/
00
Pric
e pe
r Gal
lon
Providence Stop & Shop AO Supermarkets
Source: Calculated from Food Marketing Policy Center IRI database.
Figure 2.

37
BostonBrand Level Retail Milk Price
March 1996 - July 2000
$2.00
$2.20
$2.40
$2.60
$2.80
$3.00
$3.20
$3.403/
3/19
96
5/3/
1996
7/3/
1996
9/3/
1996
11/3
/199
6
1/3/
1997
3/3/
1997
5/3/
1997
7/3/
1997
9/3/
1997
11/3
/199
7
1/3/
1998
3/3/
1998
5/3/
1998
7/3/
1998
9/3/
1998
11/3
/199
8
1/3/
1999
3/3/
1999
5/3/
1999
7/3/
1999
9/3/
1999
11/3
/199
9
1/3/
2000
3/3/
2000
5/3/
2000
7/3/
2000
Pric
e pe
r Gal
lon
Hood Garelick Private Label
Figure 3.
Source: Calculated from Food Marketing Policy Center IRI Database

38
BostonMarket Level Retail and Farm Fluid Milk Price
January 1996 - October 2003
$1.00
$1.20
$1.40
$1.60
$1.80
$2.00
$2.20
$2.40
$2.60
$2.80
$3.00
$3.20
Jan'
96 Apr Ju
l
Oct
Jan'
97 Apr Ju
l
Oct
Jan'
98 Apr Ju
l
Oct
Jan'
99 Apr
July
Oct
Jan'
00 Apr Ju
l
Oct
Jan'
01 Apr Ju
l
Oct
Jan'
02 Apr Ju
l
Oct
Jan'
03 Apr Ju
l
Oct
Dol
lars
per
Gal
lon
Boston Retail Compact/Class 1 Coop/Class 1
Figure 4.
So urce: Data from Order One Market Adminis t rato r and Dairy Market NewsVertical lines ind icate b eg inning (7/97) and end (9 /01) o f No rtheas t Dairy Comp act.

39
Figure 5: Actual Raw Milk, Estimated Wholesale, and Actual Retail Milk Pricing by Brand for the Four Leading Supermarket Chains in Southern New England: June 2003
1.031 1.034 1.034 1.026 1.034 1.034 1.026 1.030 1.030 1.026 1.034 1.034 0.978
0.596 0.523 0.523 0.661 0.622 0.622 0.661 0.675 0.675 0.661 0.622 0.622 0.778
1.447 1.4091.755
1.825
1.284 1.301
1.813
1.240 1.3361.800
0.6881.134 1.034
0.000
0.500
1.000
1.500
2.000
2.500
3.000
3.500
4.000
P Label Garelick Hood P Label Garelick Hood P Label Guida Hood P Label Garelick Hood
Dol
lars
per
Gal
lon
Raw Milk Price Wholesale $ Margin Retail $ Margin
Stop & Shop Shaw's Big Y DeMoulas
2.966
3.312 3.511
2.940 2.957
3.499
2.944 3.040
3.486
2.344
2.790 2.790
3.074
AllMilk
Prices are the average across Whole, 2%, 1%, and Skim Milk and include all sales or promotional prices.

Appendix A
Tables and Figures

Appendix Table 1: Hartford and Boston Retail Milk Prices and Raw Fluid Milk Prices
Per gallon Per gallon Per gallon Per gallon Per gallonJan'96 1.38 2.38 1.39 2.37 1.45Feb 1.38 2.40 1.39 2.38 1.45Mar 1.36 2.41 1.37 2.41 1.44Apr 1.35 2.40 1.36 2.40 1.42May 1.36 2.40 1.37 2.39 1.43Jun 1.41 2.42 1.40 2.41 1.47Jul 1.45 2.44 1.46 2.43 1.53Aug 1.47 2.46 1.48 2.38 1.54Sep 1.52 2.45 1.52 2.39 1.59Oct 1.55 2.46 1.56 2.43 1.63Nov 1.59 2.50 1.60 2.45 1.66Dec 1.49 2.50 1.49 2.41 1.59Jan'97 1.27 2.51 1.28 2.42 1.37Feb 1.25 2.49 1.25 2.45 1.35Mar 1.30 2.49 1.31 2.45 1.40Apr 1.34 2.49 1.35 2.45 1.42May 1.34 2.49 1.35 2.45 1.43Jun 1.25 2.49 1.26 2.44 1.36Jul 1.46 2.68 1.46 2.64 1.46Aug 1.46 2.68 1.46 2.63 1.46Sep 1.46 2.68 1.46 2.63 1.46Oct 1.46 2.68 1.46 2.62 1.46Nov 1.46 2.68 1.46 2.63 1.46Dec 1.46 2.68 1.46 2.63 1.46Jan'98 1.46 2.68 1.46 2.60 1.46Feb 1.46 2.68 1.46 2.59 1.48Mar 1.46 2.68 1.46 2.60 1.47Apr 1.46 2.69 1.46 2.60 1.47May 1.46 2.68 1.46 2.60 1.46Jun 1.46 2.61 1.46 2.54 1.46Jul 1.46 2.60 1.46 2.55 1.46Aug 1.46 2.60 1.46 2.57 1.46Sept 1.54 2.61 1.55 2.58 1.59Oct 1.56 2.64 1.57 2.58 1.61Nov 1.57 2.66 1.58 2.58 1.62Dec 1.65 2.74 1.66 2.71 1.70
(continues)
January 1996 - October 2003Boston Class I
& CompactHartford Class I &
CompactBoston Retail
PriceHartford Retail
PriceBoston
Coop Price

Appendix Table 1. (continued)
Per gallon Per gallon Per gallon Per gallon Per gallonJan'99 1.72 2.89 1.73 2.89 1.77Feb 1.76 2.89 1.77 2.89 1.81Mar 1.67 2.88 1.68 2.81 1.72Apr 1.46 2.73 1.46 2.67 1.46May 1.46 2.67 1.46 2.72 1.46June 1.46 2.68 1.46 2.72 1.46July 1.46 2.64 1.46 2.72 1.46August 1.46 2.63 1.46 2.64 1.46Sept 1.46 2.70 1.46 2.66 1.49Oct 1.63 2.87 1.64 2.91 1.68Nov 1.67 2.95 1.68 2.89 1.72Dec 1.46 2.91 1.46 2.83 1.46Jan'00 1.46 2.91 1.46 2.92 1.46Feb 1.46 2.84 1.46 2.85 1.46Mar 1.46 2.81 1.46 2.83 1.46Apr 1.46 2.79 1.46 2.81 1.46May 1.46 2.82 1.46 2.84 1.46Jun 1.46 2.83 1.46 2.83 1.46Jul 1.46 2.85 1.46 2.82 1.46August 1.46 2.84 1.46 2.85 1.46Sept 1.46 2.83 1.46 2.82 1.46Oct 1.46 2.83 1.46 2.82 1.46Nov 1.46 2.87 1.46 2.87 1.46Dec 1.46 2.94 1.46 2.88 1.46Jan'01 1.47 2.87 1.48 2.90 1.52Feb 1.46 2.94 1.46 2.92 1.46Mar 1.46 2.90 1.46 2.90 1.46Apr 1.46 2.96 1.46 2.94 1.48May 1.49 2.98 1.50 2.95 1.54Jun 1.56 2.98 1.57 2.98 1.65Jul 1.59 3.01 1.60 3.01 1.68August 1.60 3.00 1.60 3.02 1.74Sept 1.61 3.06 1.62 3.08 1.76Oct 1.64 3.07 1.65 3.08 1.79Nov 1.63 3.10 1.63 3.08 1.77Dec 1.30 3.00 1.31 2.99 1.45
(continues)
Hartford Class I & Compact
Hartford Retail Price
Boston Class I & Compact
Boston Retail Price
January 1996 - October 2003Boston
Coop Price

Appendix Table 1. (continued)
Per gallon Per gallon Per gallon Per gallon Per gallonJan'02 1.30 3.01 1.31 2.99 1.45Feb 1.30 3.00 1.31 2.98 1.44Mar 1.27 3.00 1.28 2.99 1.42Apr 1.26 2.99 1.27 2.99 1.40May 1.24 2.99 1.25 2.99 1.39Jun 1.22 2.99 1.23 2.99 1.37Jul 1.18 2.99 1.19 2.99 1.33August 1.17 2.99 1.18 2.97 1.30Sept 1.17 2.99 1.18 2.97 1.30Oct 1.14 2.99 1.15 2.97 1.27Nov 1.18 2.99 1.19 2.97 1.31Dec 1.18 2.99 1.18 2.97 1.30Jan'03 1.18 2.99 1.19 2.97 1.31Feb 1.15 2.99 1.16 2.97 1.28Mar 1.11 2.99 1.12 2.97 1.24Apr 1.10 2.99 1.11 2.97 1.23May 1.11 2.99 1.11 2.97 1.23Jun 1.11 2.99 1.12 2.97 1.24Jul 1.11 3.02 1.12 2.97 1.27Aug 1.21 3.02 1.22 2.97 1.37Sept 1.45 3.07 1.46 3.06 1.60Oct 1.50 3.10 1.51 3.06 1.65Source: Data from Order One Market Administrator and Dairy Market NewsNote: Northeast Dairy Compact began 7/97 and ended 9/01
Boston Coop Price
January 1996 - October 2003Hartford Class I &
CompactHartford Retail
PriceBoston Class I
& CompactBoston Retail
Price

Appendix Figure 1: Actual Raw Milk, Estimated Wholesale, and Actual Retail Milk Pricing by Brand for the Four Leading Supermarket Chains in Southern New England: March 2003
1.036 1.030 1.030 1.051 1.030 1.030 1.051 1.038 1.038 1.051 1.030 1.030 1.051
0.582 0.525 0.525 0.642 0.615 0.615 0.642 0.658 0.658 0.642 0.615 0.615 0.642
1.487 1.4141.836
1.911
1.3451.845
1.997
1.2941.594
0.807 0.977
1.6451.947
0
0.5
1
1.5
2
2.5
3
3.5
4
P Label Garelick Hood P Label Garelick Hood P Label Guida Hood P Label Garelick Hood
Dol
lars
per
Gal
lon
Raw Milk Price Wholesale $ Margin Retail $ Margin
Stop & Shop Shaw's Big Y A&P
2.969
3.390 3.604
2.990
3.490 3.690
2.990
3.290
2.500 2.623
3.290
3.640
3.105
AllMilk
Prices are the average across Whole, 2%, 1%, and Skim Milk and include all sales or promotional prices.

Appendix B
Cheese Reporter article, “Controversy Over Level Of Farm Versus Retail Milk Prices Continues”
and
A letter to the editor in response to the "Controversy Over
Level Of Farm Versus Retail Milk Prices Continues”

Serv
ing
theWorld's Dairy Industry W
eekly
Since 1876
CHEESE REPORTERVol. 128, No. 12 • Friday, September 26, 2003 • Madison, Wisconsin
‘Cancun Collapse Is Good News’ p. 2
Farms Face Opposition on Odors p. 3
“Marketing to Kids” p. 4
Whey Solids Use Up in Food p. 9
Licensed Cheese Imports Up p. 10
Controversy Over Level Of FarmVersus Retail Milk Prices Continues
INSIDE THIS ISSUE:
Domestic Commercial Sales Of Nonfat DryMilk Hit 10-Year Low, As Does Dairy Use
price threshold under the New Yorkstate price gouging law.”
Last November, UConn hadnoted that Wal-Mart Supercenterswere not the lowest priced chain inNew England, “despite its reputationas a low-price leader in retail. This isno longer the case.” The June surveyfound that Wal-Mart has comedown in price in New England, andis the lowest priced chain in NewYork.
“It appears that Wal-Mart has lis-tened to the press on high milkprices and has responded, reducedthe gap between wholesale and retailprices, and now along withDeMoulas, prices milk in an effec-tively competitive fashion,” thestudy said.
In addition to duplicating itsNovember survey in New York,UConn researchers also cooperatedwith the New York State Attorneygeneral’s office to collect data from191 stores throughout the state. Thesurvey found that conveniencestores in New York sell the highest-priced milk in the state, rangingfrom an average lowest price of
• See Retail vs. Farm Price, p. 15
Minnesota Milk ProductionJuly and August 1993-2003
'93 '94 '95 '96 '97 '98 '99 '00 '01 '02 '03650
670
690
710
730
750
770
790
810
830
850
July August
Elmhurst, IL—Domestic commer-cial sales of nonfat dry milk (NDM)last year totaled 741.7 millionpounds, down 19.4 percent, or 178.5million pounds, from 2001 and thelowest level of domestic commercialNDM sales since 1993, according toa new report from the AmericanDairy Products Institute (ADPI).
Domestic commercial NDM saleswere last below the 800-million-pound mark in 1993, when theytotaled 591.0 million pounds. Thehighest level of domestic commer-cial NDM sales since then was 954.7million pounds in 1995, while thehighest level this decade was 920.2million pounds in 2001, accordingto ADPI’s “2002 Dry Milk ProductsUtilization & Production Trends,”as well as previous ADPI reports.
This compilation represents the55th annual industry-wide survey ofend-uses. The census, participatedin by ADPI members, other cooper-ating processors, and distributors,reflects approximately 85 percent of
total domestic distribution. Withsuch comprehensive coverage, pro-jections have been made from thesurvey data to the total industry.
The dairy industry is by far thelargest domestic buyer of nonfat drymilk, and last year NDM sales to thedairy industry totaled 416.2 millionpounds, down 33.0 percent, or 204.9million pounds, from 2001. Thatwas also the lowest level since 1993,when sales to the dairy industrytotaled 378.2 million pounds.
Nonfat dry milk sales to the dairyindustry had reached a high of 651.3million pounds in 1998.
NDM sales to the dairy industryaccounted for 56.1 percent of totaldomestic commercial sales of NDMlast year, down from 67.5 percent oftotal domestic commercial sales in2001. Prior to last year and goingback to 1993, the dairy industry’sshare of total domestic commercialsales of NDM has ranged between
• See NDM Sales Decline, p. 8
Use of rbST Found ToBoost Output Per Cow, ButNot Net Income Per CowIthaca, NY—The use of recombi-nant bovine somatotropin (rbST)on New York dairy farms increasedmilk production per cow but did nottranslate into any incrase in netincome per cow, according to a newpaper by Loren Tauer, professor inCornell University’s department ofapplied economics and manage-ment.
RbST, also known as bovinegrowth hormone (BGH), becamecommercially available to US dairyproducers in February of 1994, fol-lowing years of investigation andtesting in the US, Tauer noted.RbST can be injected into the dairycow to augment her naturally pro-duced levels of this hormone,enhancing milk production, but alsorequiring additional feed and otherinputs to achieve increased milkproduction.
Given the large productionresponse per cow that most of thetests reported prior to rbSTapproval, the hormone was generallyprojected to be profitable for dairyfarmers, with estimates oftenexceeding $100 per year per cow,although some projected little or noprofit, Tauer noted.
Although Monsanto’s PosilacrbST product has been available foralmost 10 years and a number ofstudies have estimated the determi-nants of rbST adoption, few studieshave assessed actual profitability ondairy farms, he explained.
Tauer and W. A. Knoblauch useddata from the same 259 New Yorkdairy producers in 1993 and 1994 toestimate the impact of rbST on milkproduction per cow and returnabove variable cost per cow. The useof rbST had a positive and statisti-cally significant impact on thechange in average production percow between the two years, but theprofit change affect, although posi-tive and large, was not statisticallydifferent from zero.
This new paper revisits the NewYork dairy farms for the production
• See RbST Income Impact, p. 20
MIF Opposes Hearing OnFluid Milk Definition, WantsGreater Knowledge BaseOn Milk-Based DrinksWashington—Members of the MilkIndustry Foundation (MIF) areopposing a recent request that theUS Department of Agriculture(USDA) hold an emergency hear-ing to address the fluid milk productdefinition under federal milk mar-keting orders.
In comments filed with USDAlast Friday, MIF also suggested thatUSDA delay action on this subject“to allow the industry to develop agreater knowledge base about newmilk-based drinks and other bever-ages containing milk, and to under-stand the competitive relationshipbetween traditional fluid milk prod-ucts and those that contain smalleramounts of milk-derived compo-nents.”
More specifically, MIF suggested adelay of one year “to allow adequatemarket experience to evaluate thecompetitive beverage market and to
• See Fluid Milk Definition, p. 6
Storrs, CT—The controversy inNew England continues overwhether retail milk prices are toohigh compared to farm milk prices,and over possible legislative remediesto those price differences.
The University of Connecticut’sFood Marketing Policy Center thisweek released a study that concludesthat retail milk prices in New Eng-land are “much higher” than in NewYork, which has a milk price gouginglaw that establishes a maximumthreshold retail milk price of 200percent over the announced Class Imilk price plus any over-order pre-miums paid to farmers.
But a report prepared for theMassachusetts Food Associationcontends that the UConn priceanalysis is “flawed,” that retail milkprice markups are “reasonable,” andthat proposed legislation in Con-necticut and Massachusetts is “mis-guided” and “grossly interferes” withthe marketing of fluid milk.
The new UConn study was writ-ten by Adam N. Rabinowitz, gradu-ate research assistant, MatthewSchwane, undergraduate researchassistant, and Ronald W. Cotterill,director, all with the Food Marketing
Policy Center. The study reportsresults for a retail milk price surveythat was conducted in June 2003.
The survey found that, in nearlyall cases, retail fluid milk prices inNew York are lower than prices inNew England for each type andchannel, and the change over time isalso different. For example, 2 percentmilk in New York chain stores was$2.25, down 10 cents from a surveyconducted last November, while thesame milk in New England was$2.90, up five cents from lastNovember.
Prices at convenience stores andchain supermarkets “are quite close,”the survey found, while prices at cluband limited-assortment stores “aremuch lower” In fact, club stores andlimited-assortment stores were foundto have “significantly cheaper milkprices in all geographic areas in thisstudy.”
One “significant change” from lastNovember, the study noted, is thatchain store prices in New Yorkdropped about 10 cents across alltypes of milk, while there was norespective change in New Englandchain stores. The drop in New Yorkprices was “due to the decrease in the

C H E E S E R E P O R T E R 15September 26, 2003
For more information, circle #12 on the Reader Response Card on p. 18
porting and merchandising fluidmilk in its journey from the farm tothe grocery store,” the report said. “Italso ignores the fact that processorspay a premium over and above theClass I price for fluid milk and thatdairy farmers also receive govern-ment payments to compensate themfor the presently low fluid milkprice.”
For example, if the farm price forfluid milk is $1.20 per gallon andprocessors pay an over-order pre-mium of 12 cents per gallon, the costto the processor is $1.32 per gallon.Processor costs, which include thecost of the container, processing, andtransportation to the retail store areconservatively around 85 cents a gal-lon, resulting in a delivered whole-sale price of $2.17 per gallon.
Merchandising costs at retail for agrocery store, which include labor,utilities, capital cost, as well asadvertising and other costs are atleast 45 cents per gallon, giving aconservative estimate of $2.62 pergallon before overhead and profit areadded on.
The Massachusetts law as written“would make it impossible for a retailgrocery to cover store milk cost atcurrent farm price levels, as the max-imum price allowable before thethreat of a finding of ‘uncon-scionably excessive’ is only$2.40/gallon in our example whilethe grocery store costs are $2.62/gal-lon,” the report said.
As with the Connecticut proposal
there is an incentive to increase theprice paid to the producer so that thefarm-retail spread widens to allowprocessors and retailers to cover theircost, the report continued. TheMassachusetts proposal “clearlyplaces even more pressure than theConnecticut proposal on the retailerto increase his pay price so that he isable to cover the wholesale price,store merchandising cost and stillallow for overhead and profit.”
According to the report, if thislegislation were enacted and retailersincreased their price to processorswith the understanding that theincrease would be passed along todairy farmers, “the effect would be toincrease the total costs associatedwith producing, processing andretailing fluid milk.
This would be a threat to con-sumers as it would likely sharplyincrease the price of fluid milk nowmarketed at discount prices” at vari-ous outlets.
“Chain grocery stores would alsobe in the position to increase retailprices as long as they increasedreturns to producers, setting up theclassic case of spiraling costs andreduced fluid milk consumption,”the report added.
Given the “true cost” of produc-ing, processing and merchandisingfluid milk, the report said the pro-posal “is misguided and should beviewed as an uneconomic and ineffi-cient method to deal with low milkprices at the farm level.” •
Retail vs. Farm Price(Continued from p. 1)
$2.35 for 1 percent milk to $2.67 forwhole milk.
On the other hand, the surveyfound that wholesale clubs sell theleast expensive milk, with averagesalways at or below $1.97. The aver-age lowest price for whole milk atchain stores was $2.29, 51 centscheaper than in New England.
“Even if one considers the averageprice of milk at chain stores at $2.36,this is still significantly cheaper thanthe New England chain store averageprice, $3.16 per gallon,” the studynoted.
Regarding compliance with NewYork’s price threshold, the UConnanalysis indicated that when thethreshold price decreases substan-tially, as was the case from Novemberto June, “compliance decreases aswell.”
UConn researchers also assistedDeborah Robinson, an intern withWashPIRG, in surveying Seattle areasupermarkets and convenience storesin June 2003. The survey found thatmilk prices are higher in the Seattlearea than in New England.
“Retail milk pricing is very non-competitive in Seattle and the bigchains lead the way,” the study said.The “fringe competitors” use milk asa loss leader to attract business, but“so few consumers actually switchthat the high milk prices remainprofitable for the leading chains.”
Consumers, Farmers Losing Out“Lack of competition is driving retailmilk prices in New England to recordlevels, despite some of the lowestfarm prices in years,” the UConnstudy said. “The impact of this isextensive, and is felt by both farmersand consumers.”
Using a documented cost of 58.2cents per gallon of milk for process-ing and delivering milk to retail out-lets in April 2003, UConnresearchers estimated that thewholesale price for milk delivered tothe store in June, with a $1.11 ClassI price, was $1.69 per gallon. Retailprices in New England continue tohover above $3.00 per gallon.
“Clearly, it does not cost super-markets $1.31 a gallon for in-storehandling, storing, and selling ofmilk,” the study said. “It is clear thatconsumers lost out on the low farmprices from December 2001 to Sep-tember 2003, while dairy farmerscontinued to suffer dire economictimes.”
While it appears that the NewYork price gouging law is effective inhelping keep milk prices low, “thereare obviously other forces in NewYork that play a factor because manyfirms’ low prices are well below thelaw’s threshold,” the study said. Fur-ther, the increased lack of compli-ance with New York’s law at lowfarm milk prices “indicates that amore complex law may be necessaryif and when New England states
attempt to control the uncon-scionably excessive pricing of fluidmilk.”
The bottom line is that it appearsthe New York law, however imper-fect in concept and/or enforcement,“is working in at least one funda-mental and important economicdimension. Retail milk prices in NewYork are closer to the cost of produc-tion and distribution than they are inNew England when farm prices arelow.
“The law seems to be making amajor contribution to the allocativeefficiency in the New York milkindustry,” the study continued.“However, it has done little to ele-vate farm prices, thereby not address-ing the dairy farm crisis that theregion faces.”
Milk Prices Are Not A ProblemThe report prepared for the Massa-chusetts Food Association was writ-ten by agricultural economist. JohnSchnittker. The specifics of thereport address the Connecticut andMassachusetts milk pricing propos-als.
There are “significant differences”between the two proposals, thereport noted. The Connecticut pro-posal limits wholesale and retailmarkups to 140 percent and 130 per-cent, respectively, while the Massa-chusetts proposal calls for a finding of“unconscionably excessive” pricingand possible legal action by the stateif the retail price equals or exceeds200 percent of the farm price.
But from a practical standpoint,the two propsoals are “very similar,”the report said, as “they attempt toartificially create a situation in whichthe processor or retailer cannot coverthe cost of acquiring, processing,transporting and merchandising fluidmilk. Processors and retailers arethen placed in the untenable situa-tion of either not covering their costsand losing money or increasing theprice paid for fluid milk in anattempt to widen the allowable farm-retail spread.”
The analysis and findings ofSchnittker’s report regarding theConnecticut proposed law applydirectly to the Massachusetts pro-posal. The overall costs of produc-ing, processing, and merchandisingfluid milk would increase, and con-sumers would be at risk that grocerystore milk prices would increase.
“There is little doubt under eitherproposal that the low-priced, dis-count milk now available at manynon-grocery store locations wouldsee significant price increases, elimi-nating the discount milk option nowavailable to low-income consumers,”the report said.
At face value, retail prices thatequal or exceed 200 percent of thefarm price “sound excessive andunjustified,” the report stated. “Butthis approach to milk pricing is mis-taken and simplistic as well as arbi-trary and capricious.
“It omits any recognition of thecost involved in processing, trans-

October 19, 2003
Dick Groves, Editor The Cheese Reporter 2810 Crossroads Drive, Suite 3000 Madison, WI 53718 Dear Dick:
Your story in the Cheese Reporter, September 26, 2003, titled, “Controversy Over Level
Of Farm Versus Retail Milk Prices Continues” is an excellent analysis of our recently
released price survey and the John Schnittker critique of our earlier April 23,2003 report
to the Ct legislature. John's report was a consultant study for the Mass Food Distributor's
Association and was released at the Sept 4th hearing held by the Mass Legislature's
Committee on the Environment and Agriculture. I also testified there with Secretary of
State Galvin (please see our website http://www.fmpc.uconn.edu for that written
testimony, John's report, my initial written response to it, and related Boston channel TV
news videos. We are very pleased to be able to provide videos and radio pieces on line
for viewing).
In this letter I will respond to Schnittker’s main criticisms and comments on milk pricing,
current milk price policies, and proposed milk price policies in the Northeast.
The proposed Mass price gouge law is the same as the current NY price gouge law that
has been in effect for 12 years. JS incorrectly maintains that the 200% retail price collar
applies to the class 1 fluid milk price. In fact in both the NY law and the proposed Mass
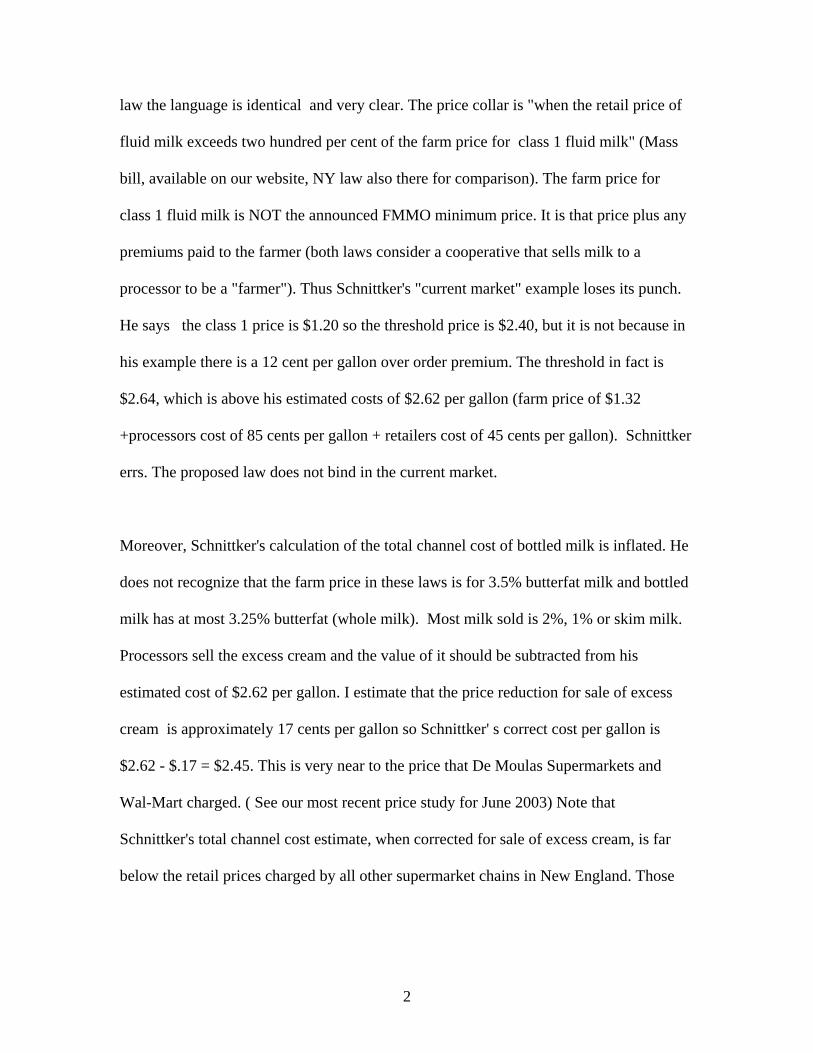
2
law the language is identical and very clear. The price collar is "when the retail price of
fluid milk exceeds two hundred per cent of the farm price for class 1 fluid milk" (Mass
bill, available on our website, NY law also there for comparison). The farm price for
class 1 fluid milk is NOT the announced FMMO minimum price. It is that price plus any
premiums paid to the farmer (both laws consider a cooperative that sells milk to a
processor to be a "farmer"). Thus Schnittker's "current market" example loses its punch.
He says the class 1 price is $1.20 so the threshold price is $2.40, but it is not because in
his example there is a 12 cent per gallon over order premium. The threshold in fact is
$2.64, which is above his estimated costs of $2.62 per gallon (farm price of $1.32
+processors cost of 85 cents per gallon + retailers cost of 45 cents per gallon). Schnittker
errs. The proposed law does not bind in the current market.
Moreover, Schnittker's calculation of the total channel cost of bottled milk is inflated. He
does not recognize that the farm price in these laws is for 3.5% butterfat milk and bottled
milk has at most 3.25% butterfat (whole milk). Most milk sold is 2%, 1% or skim milk.
Processors sell the excess cream and the value of it should be subtracted from his
estimated cost of $2.62 per gallon. I estimate that the price reduction for sale of excess
cream is approximately 17 cents per gallon so Schnittker' s correct cost per gallon is
$2.62 - $.17 = $2.45. This is very near to the price that De Moulas Supermarkets and
Wal-Mart charged. ( See our most recent price study for June 2003) Note that
Schnittker's total channel cost estimate, when corrected for sale of excess cream, is far
below the retail prices charged by all other supermarket chains in New England. Those

3
prices are routinely above $3.00 per gallon. Schnittker is silent on the discrepancy
between his cost estimate and documented retail prices that are much higher.
The price gouge gap is even wider in this example. Schnittker's retailing cost is
reasonably accurate, however his costs for processing and delivery into supermarkets are
not. Dairy Technomics, a firm that is in the business of estimating processor costs to help
supermarkets bargain for and monitor wholesale milk prices, finds that they are around
60 cents per gallon. Selected Dairy Tech estimates for Hood, Guida and Dean/Garelick
milk , the big three processors, have been verified by the companies themselves or by an
independent audit by Price Waterhouse (See my Preliminary Response to Schnittker on
our web site)
In conclusion, when corrected for sale of excess cream and over estimation of processor
costs Schnittkers "current market example", which appears to be for some month prior to
the September 2003 run up in raw fluid milk prices, nicely illustrates that retail prices are
unconscionably excessive because they generate gross profit margins far above wholesale
delivered milk and in-store costs for retailers.
Schnittker also misses two critical points. First both the NY and the proposed Mass law
give retailers an out. They can justify a retail price that is higher than the threshold price
by documenting that it is due a high wholesale price paid to a processor and/or high in
store costs such as labor or rent or utilities. If such costs account for a retail price above
the threshold then the store is not in violation. These laws only go after excessive net of

4
cost profits at retail. Second, the price collar rate at 200% is not set in stone. It can be
changed if it generates a large number of investigations that in fact are cost justified.
Schnittker incorrectly maintains that the NY and the proposed Mass law gives retailers
incentives to pay higher wholesale prices with guidance that they be paid back to farmers
as over order premiums so that the threshold price level will increase. Schnittker clearly
contradicts himself here. In the above numerical example he maintained that the
threshold price was only based on the class 1 price. Now he would correctly base it on the
FMMO minimum class 1 price plus any over order premium. But Schnittker ignores the
cost justification out that retailers have. If their costs are above the threshold all they must
do is say so. They don't have to pay over order premiums to farmers to elevate the
threshold. In the 12 years that the NY law has operated no retailer has ever even
attempted to pay over order premiums for this reason.(See NY Ag and Markets Charles
Huff's report on the operation of the NY law on our website)
This brings me to a basic and critical difference between the proposed Ct price collar
approach the NY/Mass approach. The latter is a pro consumer approach that limits excess
retail profits by lowering retail prices. Our pricing studies and Huff's review of the NY
law demonstrate that this approach works. A little history is instructive here. In 1991
when the NY price gouge law was passed it was the consumer/downstate component of
two bills that were linked for passage. Upstate rural interests wanted and received an
over-order pricing law that empowered the NY Dept of Ag and Markets to elevate farm
prices when they are extremely low as they were in 1990 and 1991 (and as they were

5
from Dec 2001 to Sept 2003). According to Huff the cooperation (logrolling) of farm and
consumer interests (upstate and downstate interests) effectively ensured rapid passage of
both bills. The problem, however came later when the over order pricing law was
challenged in court and declared unconstitutional. Farmers lost their side of the policy
solution to the low farm price and high consumer price milk problem.
Today the Connecticut proposal is an attempt to redress the farmer side of the milk price
policy problem. Schnittker is correct when he says that the 140% price collar on
processors will give processors incentive to raise farm price via payment of over order
premiums if farm prices are so low that the 40% markup will not cover their costs. But
this is true ONLY IF they want to avoid losses. Processors have a choice: either suffer
right along with farmers when farm prices are low, or pay over order premiums until the
collar no longer binds.
In the CT proposal retailers would be permitted to markup wholesale delivered prices
only 130%. Given processors costs are approximately 60 cents per gallon the 140-%
wholesale markup rule incents processors to pay over order premiums to raise the raw
milk price for milk that actually goes in the bottles to $1.50 per gallon (This is $17.43 per
cwt, and the payments to farmers for the excess cream up to 3.5% butterfat would add
approximately another $1.97 per cwt in our April 2003 example. The policy's parameters
can be adjusted to target any desired level of farmer support). With raw bottling milk
priced at $1.50 per gallon the resulting wholesale price would be $2.10 per gallon so the
130% retail rule allows retailers to price as high as $2.73 per gallon. Note that this price

6
is well below current retail prices in New England (over $3.00 per gallon). In
conclusion, the CT approach raises farm price and lowers retail prices. BUT, retailers still
get to keep 63 cents per gallon, an amount well above Schnittker's 45 cent retail cost per
gallon. Most, but not all, of current retail profits are redistributed to farmers and
consumers.
Schnittker fears that the CT proposal will set off a price spiral that will benefit farmers,
processors and retailers at the expense of consumers. We too worried about this and
carefully analyzed the post law equilibrium in Appendix D of our April 23,2003 report.
Schnittker apparently failed to read it, for he never mentions it. There we demonstrate
that the 130% retail price collar increases the effective store level own price elasticity of
demand 4.33 times. This "flatter" effective demand really puts a damper on the price
spiral hypothesis.. Stated otherwise, we demonstrate in Appendix D that for observed
market values of retail and processing cost for input factors other than milk, profit
maximizing retailers and processors will in fact behave as in the example given above.
Farm price will increase and consumers will pay less.
Schnittker's concludes that the Cotterill proposal "is misguided and should be viewed as
uneconomic and inefficient way to deal with low milk prices at the farm level".
We beg to differ. The CT price collar approach attacks demonstrated allocative (pricing)
inefficiency in northeast milk marketing channels by bringing channel costs at each stage
( and especially the retailing stage) more in line with cost of production and distribution.
As such it is an entirely new approach to milk policy, one that puts farmers in a

7
progressive position of promoting channel pricing efficiency rather than looking for
a higher price at the farm gate devil-be-damned what happens downstream. For what
happened downstream during the recent 21 month period of extremely low farm milk
prices see Policy Issue Paper No 40 (on our website) or the report on it in the September
12, 2003 Cheese Reporter, p. 14. Public power via the market orders, according to an
Iowa State study raises retail milk prices about $1.50 per cwt, whereas our research
documents that private market power exercised by retailers generates unconscionably
excessive net profit rates and raises retail milk prices $1.00 per gallon or $11.60 per cwt.
A policy that reigns in this excessive exercise of private market power in the milk
channel can elevate farm fluid milk prices several dollars per cwt and still cut price to
consumers. A farmer consumer alliance such as was achieved in New York in 1991
makes eminent sense for both groups.
Admittedly the CT price collar proposal could raise northeast farm level milk prices. IF
the body politic wants to keep dairy farms in the region this is a policy that can
help achieve that goal. During its 1997 to 2001 lifespan the Northeast Dairy Compact
helped New England dairy farmers because it effectively restored what Congress wrote
into federal market order legislation. Congress mandated a 16 cent per gallon or $3.25 per
cwt elevation of the class 1 minimum price for fluid milk at Boston relative to the upper
Midwest. Except during the Compact era, recent farm mailbox prices in the northeast
have been effectively equal to those received in the upper Midwest because farmers there
have more bargaining power and have received significant over order premiums for their
cheese milk as well as their fluid milk.

8
Now if one wishes to prevent the continued demise of dairy farms in the northeast, there
is need for some other regional or state policies to once again elevate fluid prices in the
northeast - a high cost of production area, but an area that is near densely populated
urban areas that need fresh milk. (For more detail on this interregional milk pricing issue
see FMPC Issue Paper No 37 on our website in the price gouging section. Also see the
story on Ed Jesse's analysis by Ray Mueller in the Sept 12, 2003 Cheese Reporter. Ed
recognizes that for some time now cheese milk premiums (and I would add class1 over
order premiums necessitated by those cheese premiums to draw milk from cheese plants
to bottling) have kept upper Midwest farm milk prices up. Jesse thinks it may be harder
to do in the future but he and others are beavering away to find something. Give us
Northeasterners the same license please.)
Sincerely, Ronald W. Cotterill, Director Food Marketing Policy Center

Appendix C
The Northeast Dairy Policy and Prices Summit Meeting A two-day Conference
November 17-18, 2003
To be held at
The University of Connecticut Storrs Campus
Storrs, Connecticut
College of Agriculture and Natural Resources
October 20, 2003
We would like to invite you to a conference we are holding on November 17th and 18th at the University of Connecticut titled, “The Northeast Dairy Policy and Prices Summit.” The program is attached. Invited participants include key legislators, commissioners of agriculture, northeast dairy cooperative leaders, milk processors and retailers, and leaders of farm, environmental and consumer groups. Any interested person or industry participant is welcome at this meeting. We expect over 100 participants from New England, New York, Pennsylvania, New Jersey, and Delaware. University of Connecticut research has documented extensive pricing problems in the New England fluid milk channel. Retail prices are far in excess of channel costs and farm prices are low due, in part, to a lack of bargaining power and consequently an inability to capture a larger portion of the consumers’ dollar. Farmers, fluid milk processors, and consumers are being short changed by powerful supermarket chains in New England. The story is entirely different and equally interesting in New York and Pennsylvania.
The goals of this meeting are: 1) to document current cost of production at the farm, processing, and retail levels in the milk distribution channel, 2) to explain current pricing practices in the farm to retail market channel, 3) to discuss current and proposed milk pricing policies at the state level, 4) to determine whether a coordinated regional effort can redirect pricing in the milk channel so that dairy farm income and/or consumer welfare are enhanced. The future structure of dairy farming with its contribution to public environmental, open space, and cultural goals may very well depend upon the promulgation of pro-farmer policies at the state and regional level. Policies at the federal level will not be sufficient. This is partly due to the fact that cooperative and state/regional policies in other parts of the nation have offset federal initiatives that have recognized the higher value of fluid milk produced in the urbanized northeast. A fundamental premise for this meeting is recognition that the Northeast, and especially New England, must consider state/regional action, as we did with the Northeast Dairy Compact between 1997 and 2000, to promote the future of the region’s dairy farming and

October 20, 2003 Page two milk processing. We hope that you will join us. The attached information includes registration/lodging information. The cut off date for registration without a financial penalty is November 7th. Please R.S.V.P. to the following email address: [email protected]. Sincerely, Ronald W. Cotterill, Director Food Marketing Policy Center University of Connecticut For the conference organizing committee: George Wilber, Connecticut Representative Robert Wellington, Vice President and Economist, Agrimark Cooperative Ronald W. Cotterill, Director, Food Marketing Policy Center RWC/lk Attachments The conference information is also available on our website: http://www.fmpc.uconn.edu/dairysummit.pdf

The Northeast Dairy Policy and Prices Summit Meeting
A two-day Conference
November 17-18, 2003
To be held at
The University of Connecticut Storrs Campus Storrs, Connecticut
Monday, November 17th at the Rome Ballroom in the Rome Commons
Tuesday, November 18th at Shippee Hall
Meeting Sponsored by
The University of Connecticut College of Agriculture and Natural Resources,
Cooperative Extension Service, The Food Marketing Policy Center, and
The Council of State Governments, Northeast Section

2
CONFERENCE PROGRAM Monday, November 17, 2003 9:00 – 9:45 a.m. Registration, Coffee, and Snacks 9:45 – 10:00 a.m. Welcoming Remarks George Wilber, Representative, Connecticut Legislature Carl Peterson, Chairman, Agri-Mark 10:00 a.m. Cost of Production on Northeast Farms Michael Sciabarassi, University of New Hampshire, Cooperative Extension 10:30 a.m. Cost of Production on Large New York, New William Zwiegbaum,
England Dairy Farms and Western Super Dairies First Pioneer Farm Credit, Albany, New York
11:00 a.m. Cost of Milk Processing and Distribution Corey Durling, Partner Dairy Technomics, Lebanon, New Jersey 11:30 Retail in-store Costs of Milk Distribution Professor George Criner, University of Maine 12:00 – 1:15 p.m. Buffet Lunch – Rome Ballroom 1:15 – 2:15 p.m. The Outlook for Farm Milk Prices and Federal Robert Wellington, Economist, Dairy Policy Agri-Mark, Lawrence, MA 2:15 – 3:15 Recent Retail, Wholesale, and Farm Prices in Professor Ronald W. Cotterill, New England and New York: Documentation Director, of Excessive Retail Margins in New England Food Marketing Policy Center, University of Connecticut 3:15 – 3:30 p.m. Coffee Break 3:30 p.m. State-Regional Policy Option 1. Charles Huff, Chief of Licensing/ A Review of the New York Price Gouge Law Auditing, NY Department of
Ag and Markets 4:30 – 5:30 p.m. Round Robin Forum: Each organization or group can briefly introduce itself, and
state its interests and/or concerns on dairy policy and pricing. The goal of this session is to facilitate discussion through the evening and on day two of the meeting.
5:30 – 7:00 p.m. Reception – Rome Ballroom 7:00 – 9:30 p.m. Dinner – Rome Ballroom Keynote Speaker –
Richard Blumenthal, Attorney General of Connecticut

3
Tuesday, November 18, 2003 9:00 a.m. State-Regional Policy Option 2: Over Order David DeSantis, Director,
Premiums by the Pennsylvania Milk Marketing Enforcement and Accounting, Board Pennsylvania Milk Marketing
Board 10:00 a.m. Coffee Break 10:15 – 11:15 a.m. State-Regional Policy Option 3: The Proposed Professor Ronald W. Cotterill, Connecticut Price Collar Approach Director, Food Marketing Policy Center, University of Connecticut 11:15 – 12:00 p.m. Legal Aspects of State-Regional Policy Douglas Eberly, Options General Counsel, Pennsylvania Milk Marketing Board 12:00 p.m. Buffet Lunch – Pequot Room 1:30 – 2:30 p.m. Report from State Legislators on Status of Milk Price Regulation and Pending Legislation 2:30 – 3:15 p.m. Discussion of Policy Options to Promote the Facilitators: Viability of the Northeast Dairy Industry. Representative George Wilber Carl Peterson, Chairman, Agri-Mark 3:15 –3:30 Coffee Break 3:30 –4:00 Continued Discussion 4:00 p.m. Adjourn
4
REGISTRATION Please complete this registration form and send it along with the $75 registration fee to: Dr. Ronald W. Cotterill, Director Food Marketing Policy Center Agricultural and Resource Economics 1376 Storrs Road, Unit 4021 Storrs, Connecticut 06269-4021 Checks are to be made payable to the University of Connecticut. We regret that cash and credit cards cannot be accepted. Name.................................................................................................................................................. Title .................................................................................................................................................... Organization....................................................................................................................................... Address .............................................................................................................................................. City..................................................................................................................................................... State.................................................Zip Code.................................................................................... Telephone........................................................................................................................................... Email .................................................................................................................................................. Fax......................................................................................................................................................
REGISTRATION FORM AND CHECK MUST BE RECEIVED BY NOVEMBER 7TH
REGISTRATION FEE AFTER NOVEMBER 7TH WILL BE $125