Embed Size (px)
Citation preview

Indian Journal of Chemical Technology Vol. 9, January 2002, pp. 74-78
Mild steel deterioration with time in various aqueous salt solutions
Rita Mehra* & Aditi Soni
Department of Applied Chemistry, Maharshi Dayanand Saraswati Universi ty Ajmer 305 009, India
Received 7 November 2000; revised 25 May 2001 ; accepted 23 June 2001
The corrosivity of water supplies need to be evaluated in view of the aesthetic problems in water and also because of the potential public health importance. As such, some recent work on mild steel deterioration has been carried out. The results assessed from weight loss measurements for different chemical mediums support the chloride aggress iveness reported in literature. But the relative behaviour of other ions vary with time being lesser in concentration as per potable water quality standards. Potentiostati c polarisation results have also been carried out to determine the effect of different anion s and time on corrosion rate through changes in potential. The corrosion potential (Ecorr·), corrosion current Ucorr·), Tafel slopes, corrosion rate have been obtained from polarisation experiments using a three electrode set-up. For re liabi lity of results , the data has been statistically analysed.
Various studies on drinking water quality and the effect on public health 1•3 indicate the concern for investigating the deterioration of "as built" pipeline materials. Due to varying factors therein, the control of medium to which the material is exposed is wellfounded as the characteristics of water are a function of different sources, site and environmental conditions.
The studies on corrosion of mild steel in various test solutions at concentrations acceptable for potable water shows difference in behaviour of various ions towards corrosion of mild steel. Few earlier works4·7
report the effect of different salt solutions and that of period of immersion in ac id and salt solutions8
·9
.
Results of polarization and weight loss measurements for corrosive mediums of varying degrees NaCI-600 ppm, KCI-600 ppm, Na2S04-400 ppm, CaC03-400 ppm, CaClr 120 ppm, MgS04-150 ppm, and their effect on mild steel deterioration with time have been given here 10
.11
• These will be referred in the following text as a, b, c, d, e, f, respectively.
Experimental Procedure The 2x2 cm2 urea square mild steel specimens of
minimum thickness 0.03 mm which can be neglected in calculating the surface area of specimens were used. These were suspended by a glass hook in a beaker fill ed with test solution. The chemical composition of the mild steel used was C-0.22%, S-0.01 8%, Ni-0.25 %, Mn-0.62%, P-0.022%, Mo-
*For correspondence (Fax: 0145-441176)
0 .15%, Si-0.28%, Cr-0.095%, Cu-0.20%, besides iron, analysed by standard method 12
•14
• The specimens were cleaned by buffing, degreased in benzene, washed by 50% acetone, dried, marked and weighed to a constant weight before exposing to the conosive medium. Then specimens were exposed to the different test solutions for different duration of immersion 24, 72, 120, 192, 240 and 360 h. After definite period of exposure, specimens were removed and cleaned as per recommended procedure 15
.16 in a
solution of hydrochloric acid, 50 gpl stannous chloride and 20 gpl antimony chloride, dried and weighed. The authencity of data was ascertained by reported measurements. Experimenta l set-up for polarisation measurements consisted of potentiostat/ galvanostat, Model CL-95 of Elico with a sweep generator. Saturated calomel electrode was used as reference electrode. The variation of the mild steel electrode potential under open circuit conditions in the tested solution was followed as a function of time till steady state values were stabilised and subseq•1ently anodic and cathodic potentiostatic polarisation curves were drawn . All electrochemical studies were made at 28±1°C and in each experiment 500 mL of test solution was employed. Redistilled water was used in the preparation of test solutions. All chemicals used were of analytical grade.
Results and Discussion The corrosion rate of mild steel in the test solutions
was calculated from decrease in weight observed in coupons in weight loss tests using following formula.

MEHRA & SON!: MILD STEEL DETERIORATION WITH TIME IN SALT SOLUTIONS 75
Table !-Effect of time of exposure on weight loss (mg/dm2) of mild steel in different test solutions at 28 ± l°C
Time (h)
NaCI KCI Na2so. CaC03 CaC12 MgS04 (a) (b) (c) (d) (e) (f)
24 72 120 192 240 360
19.537±1.44 18.875±0.77 I 0.500± 1.41 7.500±0.82 3.750±0.44 4.375±0.25 59 .625±5 .81 57 .375±2.53 33.750±1.89 31.250±2.77 21.875± 1.90 23.250±0.90 98.750±5.26 96.450±4.25 75.000±9.23 69.750±5.40 45.875±3.23 43 .750±1.07 162.500±9.85 159.500±7.71 144.000±7.91 77.750±8.22 99.375±5.25 81 .250±4.82
209.162±11.96 203.125±9.5 1 140.000±6.68 108.125±7.30 115.000±5.76 II 1.250±6.49 328.112±9.64 31 0.625± I 0.46 203.125±10.04 150.000±9.50 163.750±10.68 151 .250±8.52
1.00
~ 3.00
0.00 '-'---'--'---,-':-:,-:-:'-:---l..-.J 21 11 110 IW UO !60
Fig. 1-Effect of immersion period on potential of mild steel
dissolution in different test solutions NaCl (0}, KCI ( + }, Na2S04
( .&) CaC03 ( • ). CaC1 2 <• ) and MgS04 (1'1 ) for 360 h.
. 534x w Corrosion rate (mpy) = ---
DxAxT
where w is weight loss (mg), D is density (g/cm\ A is exposed area of specimen (in2), Tis time of exposure (h).
For potentiostatic measurements potentiostatic parameters-/carr. Ecorr were obtained from the slopes of linear polarisation curves and corrosion rate was calculated using the following expression,
0.129x l eo xE.W. Corrosion rate (mpy)= rr
DxA
where fcorr is corrosion current (A), E. W. is equivalent weight of metal (g), A is exposed area of specimens (cm2), Dis density of metal (g/cm2).
Table 1 shows the results of weight loss obtained by NACE standard TM-01-6~ method for mild steel for different duration of exposure in different aqueous salt solutions. An increase in value of loss in weight has been observed. The corrosion of mild steel in various aqueous salt solutions is in the order of a>b>c>d>f>e for 24 and 72 h, a>b>c>d>e>f for
·-200
~00 ~1~,~n~I10n->,~n~1~<on--o.,~~ 7rlfte (It )
Fig. 2-Effect of immersion period on corrosion potential of mild
steel in different test solutions NaCl (0), KCI ( + ). Na2S04 (A. )
CaC03 (e ), CaCI2 <• ) and MgSO. (1'1) for 360 h.
120 and 192 h, a>b>c>e>d>f for 240 h and
a>b>c>e>f>d for 360 h. The two anions that are reported to have a significant influence on the corrosion characteristics of mild steel are chloride and sulphate than other ions. The relative increase is 0.097 times for KCl, 0.129 times for NaCl , 0.289 times for Na2S04, 0.333 times for CaC03, 1.911 times for CaCb and 1.305 times for MgS04 from 24 to 360 h duration. The relative increase in corrosion rate is less because of neutral or slightly basic nature of salts 17
.
The major effect on mild steel is due to adsorption behaviour of anions of the electrolyte at the electrode surface. Fig. 1 depicts the corrosion rate variation with immersion period for mild steel in different test solutions. On comparing the corrosion rate in Fig. 1 however the metal loss increases progressively with time but corrosion rate does not follow a definite trend for all test solutions and is not proportional with time. This variation in corrosion rate may be ascribed to the stability of ferrous oxide protective film formed after corrosion reaction. Fig 1 also shows that the corrosion rate increases continuously with time in KCl and NaCl solutions but the increase is relatively less, though being higher in magnitude than CaCb

76
BOO
600
400
200
0
> E..
-200
"@ -400 -c: C1.l -600 0 0..
-800
-1000
-1200
-1400
-1600
0
INDIAN J. CHEM. TECHNOL., JANUARY 2002
NaC/0-0 I<Cl~
2 log current density (~cm1)
800
600
40
200
5' 0-
E -200 -(i
;::; c -4 QJ
l -600
-800
-1000
-1200
-1400
-1600 0
3
eac~-· MgSO .. ---
l ·
!> E -CG
;::; c: C1.l -0
0.
aoo+----------------.------------,
coco;--
200
0
-1
0 1 2 log current density (jlA J c:m')
2 .
log current dens ity ()lA/cm2)
3
Fig. 3-Polari sati on curves for corrosion of mi ld steel in differen t test solutions NaCI (0), KCI ( + ), Na2S04 (A ) CaC03 {e ), CaC1 2
<• ) and MgS04 (l'l) for 360 h period of immersion

MEHRA & SON!: MILD STEEL DETERIORATION WITH TIME IN SALT SOLUTIONS 77
Table 2-Potentiostatic parameters for mild steel in different test solutions after 36 h duration of exposure at 28± I oc
Solution OCP E corr. f corr. f3a f3c Corrosion Corrosion rate from -mY -mY I! A mY/decade -mY/decade rate mpy wt. loss date mpy
KCI 545 520 12.300 NaCI 520 505 11 .220
Na2S04 460 430 7.079 CaC03 379 385 4.169 CaC12 432 430 6.026 MgS04 320 310 4.898
and MgS04. This is because of easy availability of corrosive chloride ions in highly concentrated NaCl and KCl solutions. The chloride ion is so corrosive that it starts its corrosive action as it comes in contact with metal or alloy. Thus, within 24 h duration the corrosion is 3.5385 mpy and increases continuously up to 3.9950 mpy for 360 h at 600 ppm of NaCI. For KCl the increase in corrosion rate is from 3.4472 mpy to 3. 7819 mpy for 360 h. After 240 h the increase in corrosion rate is less because of less penetration of ions in the material due to the corrosion reaction.
Somewhat similar effect is exhibited by CaCb, but corrosion rate is observed to increase with time up to 192 h followed by a decrease. This can be attributed to the fact that the corrosion caused by the acid formed is inhibited due to the greater amount of Ca(OHh as the reaction proceeds with time. However, it is observed that the increase is greater than that found in NaCl and KCI. Likewise in MgS04 as medium, the corrosion rate is less as compared to Na2S04. The relative increase in corrosion rate for CaC03 is very less, indicating the non-corrosive behaviour of carbonate and less mobility of Ca2
+ ions. These results cannot be compared with earlier stud/ 8
-19 as they correspond to high anionic
concentrations. The specimens immersed in the different test
solutions develop the open circuit potential as -545 mY for NaCl, -520 mY for KCl, -460 mY for Na2S04,
-379 mY for CaC03, -432 mY for CaCb and -320 mY for MgS04. The variation of OCP with time have been depicted in Fig. 2, which shows that the OCP in all test solutions regardless of their nature, shift towards negative (less noble) direction with increase in immersion period. Few systems attain steady value after a slight increase viz. CaC03 and Na2S04 whereas KCl , NaCl, CaCiz systems attain steady state after initial decrease. Further Fig. 2 shows that steady state potential for NaCl and KCl are considerably more negative than MgS04 and CaC03. From Figs 1 & 2 it can be seen that there is an increase in
60 125 5.6524 3.9950 66 127 5.1561 3.7819 88 133 3.2531 2.4731 90 142 1.9158 1.8263 90 135 2.7692 1.9937 80 145 2.2508 1.8415
corrosiOn rate of mild steel (dw/dt) and simultaneously shifting of the potential of steel towards negative values with immersion period . Both anodic and cathodic polarisation plots for mild steel in different test solutions are furnished in Fig. 3. The values of fcorr. Ecorr. Tafel slopes and OCP for various test solutions obtained from polarisation curves have been given in Table 2. Fig. 3 shows the higher values for cathodic tafel slopes than anodic slopes due to the dissolution of anode into the corrosive medium. The corrosion rates calculated 15 from polarisation curves are slightly greater than those determined from weight loss measurements. This is expected since corrosion rate is maximum in the beginning and decreases when equilibrium value is attained. But in contradiction to the previous studies 15
'16 the corrosion rates obtained
from potentiostatic measurements are not significantly higher than those of weight loss measurements. Even in CaC03 the corrosion rates are nearly similar. These observed results can be correlated with the small concentration of ions and small values of corrosion rates as compared to earlier studies 17
-19
•
For the more commonly used low C steel and steel alloy according to MG fontane< 1 mpy is outstanding corrosion rate, 1-5 mpy is excellent, 5-20 mpy is good can be used with caution, 20-50 mpy is fair can be used for short exposure, 50-200 mpy is poor and >200 mpy completely unacceptable20
. However these corrosion rates calculated are acceptable for long exposure. But the corrosion rates are a significant contribution of all salts available in water, hence best promising results can be obtained by decreasing corrosion due to each of the salt.
Conclusion The experiments performed to study the
deterioration of the mild steel in various aqueous salt solutions indicate that the corrosion of mild steel in various aqueous salt solution is in the order: a>b>c>d>f>e for 24 h and a>b>c>e>f>d for 360 h i.e. for all duration taken into consideration chloride
78 INDIAN J. CHEM. TECHNOL., JANUARY 2002
and sulphate have a significant influence on corrosion rate. The potent iostatic parameters of corrosion reaction of mild steel indicate that OCP shift towards negative (less noble) direction and cathode is slightly more polarised than anode. Excellent corrosion resistance in the present invest igation can be further upgraded to outstanding with corrosion rate < 1 mpy by inhibiting corrosion by 74.97% for NaCI, 73.56% for KCI, 59.56% for Na2S04, 42.24% for CaC03, 49.84% using appropriate check measures and inhibitors.
References I Chifford K & Schoff Hevey Chen J H Y, Proc Eleventh
International Conference in Organic Coatings Science & Technology, Athens. Greece 9 ( 1985) 203 .
2 Vashi R T & Champaneri V A, Indian J Chem Techno/, 4 (1997) 180.
3 Qurashi M A, Mideer A S, Wajid M A & Ajmal M, Indian J Chem Techno! . I (1994) 329.
4 Kaunisto T, Proc Corrosion Relat Aspect Mater Potable Water Supplies, London U K, ( 1992).
5 Egamy S S, Bull Electrochem, II (1995) 48.
6 Bhattacharjee A K ~ Singh I, Indian J Mar Sci , 23 ( 1996) 280.
7 Dubey R S & Upadhyay U P, Indian J Chem Techno/, 4 (1997) 101.
8 Chatterjee P & Singh T B, J Electochem Soc 41 ( 1992) 225. 9 Robut, Parry H./Cecil Chilton, Fifth lmemational Student
Edition (McGraw Publication) Chemical engineering hand book , (1973) 23.
10 Vogel A I, Quantitative Inorganic Analysis (Longmans Green and Company Ltd., London), 1964,639.
II Jain S K, An Introduction to Metallurgical Analysis (Vikas Publishing House Pvt. Ltd., Sahibabad), 1986, 153.
12 Thompson D H, Handbook of Testing and Evaluation, Edited by Ai lor W H (John Wiley, New York). 1984, 136.
13 De A K. Environmental Chemistry, Jrd ed (New Age International Ltd .. New Delhi), 1998, 226.
14 Manual on Water Supply and Treatment, Jrd ed (Ministry of Work and Housing, New Delhi) , 1984, 132.
15 Gaur B, Singh A K & Rao N J . Indian J Chem Techno/, ( 1994) 225 .
16 Orijela G & Boden P J, Br Carro J, 16 (1981) 212. 17 Elmorsi M A, J Electrochem Soc, 45 ( 1996) 13. 18 Foley R T, Corrosion, 26 ( 1978) 58. 19 Uhling H H, Corrosion and Corrosion Control (John Wiley ,
New York), 1985,74. 20 Fontana M G, Corrosion Engineering, Jrd ed (McGraw Hill
Publication), 1986. 172.
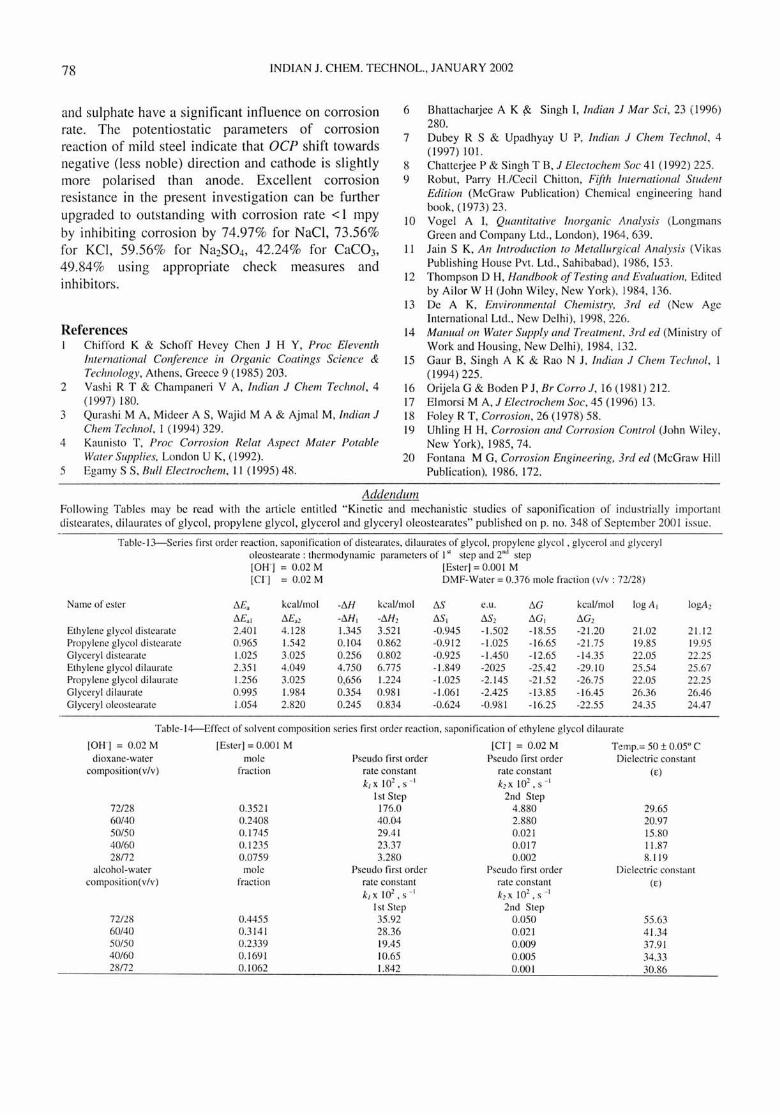
Addendum Following Tables may be read with the article entit led "Kinetic and mechanistic studies of saponification of industrially important distearates, dilaurates of glycol, propylene glycol, glycerol and glyceryl oleostearates" published on p. no. 348 of September 200 I issue.
Table-13-Series first order reaction. saponification of distearates. dilaurates of glycol, propylene glyco l , glycerol and glyceryl oleostearate : thermodynamic parameters of I" step and 2"" step [OH-] = 0.02 M [Ester]= 0.001 M [Cr] = 0.02 M DMF-Water = 0.376 mole fracti on (v/v: 72/28)
Name of ester !'J.E, kcal/mol -!J.H kcal/mol !J.S e.u. tJ.G kcal/mol log A, logA 2
!J.£,, !J.E,, -!J.H, -tJ.H, tJ.S, tJ.S, tJ.G, !J.G, Ethylene glycol distearate 2.401 4. 128 1.345 3.521 -0.945 -1 .502 - 18.55 -21.20 21.02 21.12 Propylene glycol distearate 0.965 1.542 0.104 0.862 -0.912 - 1.025 -16.65 -21.75 19.85 19.95 Glycery l distearate 1.025 3.025 0.256 0.802 -0.925 -1.450 -12.65 -14.35 22.05 22.25 Ethylene glycol dilaurate 2.35 1 4.049 4.750 6.775 -1.849 -2025 -25.42 -29.10 25.54 25.67 Propylene glycol dilaurate 1.256 3.025 0 656 1.224 -1 .025 -2.145 -21.52 -26.75 22.05 22.25 Glyceryl dilaurate 0.995 1.984 0.354 0.981 -1.06 1 -2.425 -13 .85 -16.45 26.36 26.46 Glyceryl oleostearate 1.054 2.820 0.245 0.834 -0.624 -0.98 1 -16.25 -22.55 24.35 24.47
Table-14----Effect of so lvent composition series first order reaction. saponification of ethylene glycol dilaurate
[OH-] = 0.02 M [Ester]= 0.001 M [Cr] = 0.02 M Temp.= 50 ± 0.05" C dioxane-water mole Pseudo first order Pseudo first order Dielectric constant
composition(v/v) frac tion rate constant rate constant (E) k, x 1 o'. s _, k2 xl02 ,s - '
1st Step 2nd Step 72/28 0.3521 176.0 4.880 29.65 60/40 0.2408 40.04 2.880 20.97 50/50 0.1745 29.41 0.021 15.80 40/60 0.1235 23.37 0.017 11.87 28172 0.0759 3.280 0.002 8.119
alcohol-water mole Pseudo first order Pseudo first order Dielectric constant composition(v/v) fraction rate constant rate constant (E)
k1x 102 • s _, k, x 1 o' . s _, 1st Step 2nd Step
72/L.S 0.4455 35.92 0.050 55.63 60/40 0.3141 28.36 0.02 1 41.34 50150 0.2339 19.45 0.009 37.91 40/60 0.1691 10.65 0.005 34.33 28172 0.1062 1.842 0.001 30.86