Embed Size (px)
Citation preview

EM 3/15
Credit crunched: Single parents, universal credit and the struggle to make work pay Mike Brewer and Paola De Agostini February 2015

1
Credit crunched: Single parents, universal credit and the struggle
to make work pay1
Mike Brewera,b
Paola De Agostinia
a Institute for Social and Economic Research, University of Essex
bInstitute for Fiscal Studies
Abstract
This paper examines the likely impact of Universal Credit on the incomes and work
incentives of single parent families. Using the UK module of EUROMOD (version F6.20),
we also simulate how single parents’ household income, and their work incentives,
would change following adjustments to the universal credit structure. We examine four
main alternative scenarios: 1) reducing the overall universal credit taper rate from 65%
to 55%; 2) Increasing the basic (standard) allowances in universal credit for single
parents; 3) Increasing the earnings disregard in universal credit for single parents and
4) Increasing the income tax threshold for the basic tax rate. We also examine the
impact on single parents of an increase in the minimum wage. Finally, we examine the
impact on the Exchequer of a five percentage point increase in the single parent
employment rate, in terms of benefits saved and taxes paid.
JEL classification: C15, H24, I38
Keywords: microsimulation; income distribution; universal credit; single parents; work
incentives.
Corresponding author:
Mike Brewer
Email: [email protected]
1 This research was supported by Gingerbread. We are very grateful to our colleagues Francesco Figari and Holly Sutherland for assistance with the modelling, and comments on the report. We are also grateful for comments from officials at Gingerbread. This paper uses EUROMOD version F6.20. EUROMOD is continually being improved and updated and the results presented here represent the best available at the time of writing. The process of extending and updating EUROMOD is financially supported by the Directorate General for Employment, Social Affairs and Inclusion of the European Commission [Progress grant no. VS/2011/0445].The Family Resources Survey is Crown copyright and is reproduced with the permission of the Controller of HMSO and the Queen's Printer for Scotland, and is available from the Economic and Social Data Service (www.esds.ac.uk). The ESDS, the original owners of the data (the Department for Work and Pensions) and the copyright holder bears no responsibility for its further analysis or interpretation. All errors remain the responsibility of the authors.

2
Contents 1 Introduction .................................................................................................................................... 3
2 Data and methods ........................................................................................................................... 6
2.1 Creating the baseline and reform systems in EUROMOD ....................................................... 6
3 Results ............................................................................................................................................. 8
3.1 Single parent families in the income distribution ................................................................... 8
3.2 Impact of universal credit on the income of single parent families ..................................... 11
3.3 Work incentives for non-working single parents .................................................................. 15
3.4 Impact of universal credit on work incentives forworking single parents ............................ 23
4 The effects of possible changes to universal credit on the income distribution and work
incentives for single parents ................................................................................................................. 29
4.1 Reducing the UC taper from 65% to 55% ............................................................................. 35
4.2 Increasing UC standard allowances ...................................................................................... 37
4.3 Impact of increasing income disregards ............................................................................... 39
4.4 Impact of increasing the income tax threshold for basic rate tax ........................................ 42
5 Impact of a rise in the national minimum wage on the income of single parent families ........... 44
6 Modelling an increase in the single parent employment rate ...................................................... 46
7 Conclusions ................................................................................................................................... 48
References ............................................................................................................................................ 51
A. Appendix: Details of “difficult to model” tax and benefit reforms ............................................... 52
B. Appendix: Comparing some results before and after housing costs ............................................ 57
C. Appendix: Extra tables and figures ............................................................................................... 62

3
1 Introduction
This paper examines the likely impact of universal credit (UC) on the incomes and incentives of single
parent families2. It contributes to the literature, which explores the interaction between single
parent families and the UK personal tax and benefit system, and the distributional impact of
universal credit. The analysis reflects announcements in the 2013 Budget, and reflects changes to
personal taxes and benefits for 2014-15 announced then.
Universal credit, which is due to be introduced from October 2013, will represent a very substantial
reform to the system of means-tested benefits and tax credits for working-age families. The core of
the reform is that almost all means-tested welfare benefits and in-work tax credits will be combined
into a single programme, universal credit. It will be administered by the Department for Work and
Pensions (DWP), and will be payable to families where no one is in work, and to families on a low
income where someone is in work. The government hopes that universal credit will make it easier
for claimants to claim benefits, make the gains to work more transparent, and reduce the amount
spent on administration and lost in fraud and error. As well as these changes to the way that benefit
entitlements are calculated, the conditionality regime faced by universal credit recipients in work
will be substantially different from that which currently applies. In particular, conditionality will
apply to two groups of universal credit recipients who currently face no forms of conditionality:
some part-time workers will face obligations to seek better-paid or longer-hours work, and some
non-working adults whose partners are in low-paid work will face obligations to look for work. 3
The analysis uses microsimulation methods, combining the UK component of the EUROMOD tax and
benefit microsimulation model4 with a synthetic dataset derived from the Family Resources Survey
(which provides a relatively accurate impression of a household’s composition, characteristics and
income sources). Microsimulation methods are ideally suited for this work, as they provide the
ability to estimate the disposable income of families under actual or hypothetical tax and benefit
policy scenarios, and to estimate concepts such as the marginal effective tax rate, which is a good
summary measure of the financial incentive facing workers to work a little bit more (or the penalty
for working a little bit less)
Our overall aim is to examine the likely impact of universal credit (UC) on the incomes and work
incentives of single parent families. We do this by analysing incomes and incentives to work under
two hypothetical tax and benefit systems:
Our estimate of the personal tax and benefit system in October 2014, assuming that
universal credit has not been implemented at all and accounting for announced changes in
2 We use families to mean the same thing as tax unit or benefit unit; in other words, an adult, his or her
partner, and any dependent children. This definition of “family” is a different concept from the “household”. 3 For more on UC, see Brewer, Browne and Jin (2011, 2012a, 2012b) and Tarr and Fin (2012) and Pennycook
and Whittaker (2012). Up to date information can be found at this website: http://www.dwp.gov.uk/policy/welfare-reform/universal-credit/ 4 T the latest published guide to the UK component is De Agostini and Sutherland (2013), although the current
version of the model is more up to date than this report suggests, and a recent example of its use is Callan et al. (2011)

4
the UK tax and benefit system that are due to take place by October 2014 (which we call our
“base system”).5
Our estimate of the personal tax and benefit system in October 2014, assuming that
universal credit has been fully implemented (which we call our “universal credit system”).
Neither of these systems corresponds to what we actually expect the tax and benefit system to look
like in October 2014 (which is why we describe both as hypothetical). In reality, the government
plans to introduce universal credit from October 2013 but with a complex phase-in over the
following four years, and with a form of transitional protection for those families who are moved
across from the current benefits and tax credits to universal credit. Our analysis abstracts from this
complicated phase-in and the transitional protection in order to give an impression of how, in the
long-run, single parent families will be affected by universal credit. The analysis is also static, in that
it assumes families do not alter their employment (or other) decisions in response to universal
credit.
Our main research questions are then:
Where do single parent families lie in the income distribution?
What is the impact of UC on incomes of single parent families?
What are the incentives to work of non-working single parents, and how does this change
under UC?
What are the marginal effective tax rates facing single parent workers, and how do they
change under UC?
Using EUROMOD, we can also simulate how single parents’ household income, and their work
incentives, would change following adjustments to the universal credit structure. We examine the
following changes:
Reducing the overall universal credit taper rate from 65% to 55%
Increasing the basic (standard) allowances in universal credit for single parents
Increasing the earnings disregard in universal credit for single parents
Increasing the income tax threshold for the basic tax rate
We also examine the impact on single parents of an increase in the minimum wage However,
any analysis of increases in the minimum wage has been done under the assumption that
employment patterns are unaffected by the change. This may be plausible for small changes, but
will be less plausible for increases to the level of a living wage.
Finally, we examine the impact on the Exchequer of a five percentage point increase in the single
parent employment rate, in terms of benefits saved and taxes paid.
5 The main changes to the personal tax and benefit system affecting those of working age due between April
2012 and October 2014 are: further real rises in the income tax personal allowances, further freezes in child benefit and the withdrawal of child benefit from high-income families; the below-inflation uprating of many benefits in April 2013 and April 2014; various reforms to Housing Benefit and Local Housing Allowance; the benefits cap; freezes to elements of working tax credit. We also allow for the gradual replacement of IB with ESA, and the gradual rise in the female state pension age: see Appendix B for details.

5
In this analysis, we make two key distinctions. First, we analyse the impact on single parent families
according to where families lie in the distribution of income (measured using equivalised net family
income). Second, we split single parent families according to whether they work or not, and whether
they work at the national minimum wage (NMW) or at a higher (above NMW) wage.
The rest of the paper is organised as follows:
Section 2 describes the data we use and methods.
Section 3 contains our main results on how single parents fare under universal credit.
Section 4 considers various changes to our base UC scenario.
Section 5 looks at the impact of a rise in the national minimum wage under UC on single
parent families.
Section 6 models the effect of an increase in the single parent employment rate on the
Exchequer’s costs.
Section 7 concludes.
Appendices contain more details on the tax and benefit modelling and a comparison of
some results before and after housing costs.

6
2 Data and methods
This section describes the data and methods we use and details behind some of the modelling of tax
and benefit reforms implemented since 2010.
2.1 Creating the baseline and reform systems in EUROMOD
This paper makes use of the UK part of EUROMOD, the European tax and benefit microsimulation
model (see Sutherland and Figari (2013), and further information at
https://www.iser.essex.ac.uk/euromod ).6 This section outlines the main steps involved in updating
the latest published version of the UK component of EUROMOD to 2014. We use data from the
Family Resources Survey 2009/10 (the latest available when we started this work) on 21,582 families
in the UK. It provides detailed information on private income sources and other characteristics that
determine tax liability and benefit and tax credit entitlements. In order to use these data to simulate
the UK 2014 tax and benefit system, we need to take account of changes since 2009/10 to financial
variables (such as earnings, other sources of income, and some expenditures which are subsidised by
the tax system, such as rental costs and spending on childcare), tax liabilities and benefit
entitlement. To do that, we uprate financial variables (i.e. earnings, wages, etc) in our 2009/10 data
to their projected level in 2014 by using actual changes in earnings and prices to date, together with
the latest forecast of these measures, as made by the Office for Budget Responsibility (see Appendix
A).7 We do not account for socio-demographic changes.
We use EUROMOD to account for announced changes due to take place by April 2014 in the UK tax
and benefit system. Some of these changes can be straightforwardly implemented in EUROMOD (for
example, the changes to taper rates and hours requirements in tax credits in 2012; the total
household benefit cap (from 2013), and the withdrawal of child benefit from families earning more
than £50,000 (from 2013)). But others are more difficult to model precisely, and require a more ad
hoc but sophisticated approach (the rise in the female state pension age, the reforms to local
housing allowance (LHA), and the transfer of recipients from incapacity benefit (IB) to employment
support allowance (ESA)). We explain these in more detail in Appendix A.
Our main analysis then compares incomes and work incentives under two hypothetical tax and
benefit systems:
Our estimate of the personal tax and benefit system in October 2014, assuming that
universal credit has not been implemented at all (which we call our “base system”).
Our estimate of the personal tax and benefit system in October 2014, assuming that
universal credit has been fully implemented (which we call our “universal credit system”).
We do not attempt to describe the nature of the reform in detail here. For more information, we
refer readers to Brewer, Browne and Jin (2011, 2012a, 2012b), Tarr and Fin (2012), Pennycook and
Whittaker (2012) and http://www.dwp.gov.uk/policy/welfare-reform/universal-credit/. When we
6 The latest published version of the UK component of EUROMOD is Sutherland et al (2012), although the
current version of the model is more up to date than this report suggests, and a recent example of its use is Callan et al. (2011). 7 The analysis was finalised in December 2012, and so we use the OBR forecasts from the Autumn Statement
2012.

7
start this report, there was still uncertainty about how some aspects of UC would be implemented,
and so we have had to make certain assumptions. In general, where DWP has not clearly defined
how some rules will be applied, we assume that the current rules will be maintained, with our aim
being to ensure that families did not appear to be losing or gaining in our simulations simply due to
assumptions we made about not-yet-confirmed elements of the reform. Some of the specific areas
on which we have made assumptions are as follows:
We “switch off” support for mortgage interest provided through Income Support.8
As it remains unclear how the UC will interact with the new localised Council Tax Support
system, we omit Council Tax and Council Tax Benefit from both the baseline system and the
UC system.
In reality, the government plans to introduce universal credit from October 2013 but with a
complex phase-in over the next four years, and with a form of transitional protection for
those families who are moved across from current benefits and tax credits to universal
credit. Our analysis abstracts from this complicated phase-in and the transitional protection
in order to give an impression of how, in the long-run, single parent families will be affected
by universal credit.
UC is expected to have a higher take-up rate than the benefits that it replaces because it
requires only one application (while currently one needs to apply for each benefit or tax
credit separately); and there is much less scope for families to “fall between” benefits and
tax credits when circumstances change, as can happen under the current system. As we lack
a credible prediction of the take-up rate of UC, we assume full take up, and then, in order to
make the base and UC systems comparable, we assume full take-up also for the base
system.9
8 This assumption has almost no consequences for our analysis of single parent families, almost none of whom
will be entitled to support for mortgage interest. 9 This is a significant assumption: in reality, take-up of means-tested benefits and tax credits amongst working
families is far from complete, and the Government expects fewer working families not to claim UC than fail to claim their current entitlements. If so, such a take-up response would increase the apparent generosity or cost of UC, and increase the income gains amongst low income working families. However, it is also possible that the in-work conditionality regime under UC might deter some families from claiming UC. Our assumption of full take-up is intended both as a pragmatic and agnostic solution. We note in the text where results might be substantially different had we taken a different approach.

8
3 Results
This section contains the results of our analysis. We first show where single parent families lie in the
income distribution under our “base system” (which describes a hypothetical tax and benefit system
of October 2014 in which universal credit has not been implemented). We then show: what the
impact of UC is on the incomes of single parent families; what the marginal effective tax rates facing
low paid single parents working at the minimum wage are; and how universal credit will change this.
In this analysis, we make two key distinctions:
First, we analyse the impact on single parent families according to where families lie in the
distribution of income (measured using decile groups of equivalised net family income in the
base system).
Second, we split single parent families according to their employment and earning status.
Families are eligible to receive UC if at least one adult in the family is of working age, and the
family’s income is low enough, and so our population of interest for the analysis in this chapter is all
families (benefit units) which contain at least one adult who is of working-age.
We take the family as the unit of analysis, and incomes are equivalised using the Modified OECD
equivalence scale10.
The analysis is static, in that it assumes families do not alter their employment (or other) decisions in
response to universal credit, and it assumes full take-up of all benefits and tax credits.
3.1 Single parent families in the income distribution
This section analyses where single parent families are estimated to lie in the distribution of income
amongst all working-age families (defined as a family or benefit unit containing at least one person
of working-age).
Figure 3.1 shows the composition of each income decile group by family type, whilst Figure 3.2 plots
workless versus working single parents in each income decile group as a fraction of all single parent
families.
Our results show that:
10
We use families to mean the same thing as tax unit or benefit unit; in other words, an adult, his or her partner, and any dependent children. This definition of “family” is different concept from the “household”. Choosing the family, rather than the household, as the unit of analysis can have important implications. For example, a household containing a young single parent adult earning the NMW but living with other well-paid adults who are in different “families” (ie, either unrelated adults, or perhaps the siblings or parents of young adult) might appear to have a high household income, but the single parent adult earning the NMW might appear to have a low family income. If we had taken the household as the unit of analysis, and thus analysed the position of single parent households in the household income distribution, then we might expect to find the single parents NMW to be less well correlated with having a low (household) income than what we find in this report when using the family.

9
Single parent families are mainly located in the middle of the working-age income
distribution (3rd and 4th deciles)
Workless single parent families tend to be found in the bottom half of the income
distribution, peaking in decile group 3.
Single parent families for whom low paid jobs are the main source of earnings tend to be
found in the bottom half of the income distribution, peaking in decile group 5, but our
estimates suggests they are to be found in families all across the income distribution11.
11
Graphs and tables for these results are available from the authors upon request.

10
Figure 3.1 – Composition of each income decile group, by family type (working-age families on the working-age income distribution)
Source: authors’ calculation based on Family Resources Survey, 2009-10, using EUROMOD and assumptions specified in the text to simulate 2014-5. Notes: FRS 2009/10, weighted
Figure 3.2 . – Distribution of single parent families across the working age income distribution, by employment status
Source: as for Figure 3.1.
Notes: where ‘non-working families’ means families where no adult is employed and ‘working families’ identifies families where all adults work. Denominator is total single parent families of working age, so workless single parents in the 3
rd decile make up more than 18% of the total single parent working-age families
02
04
06
08
01
00
Pro
po
rtio
n o
f fa
mili
es (
%)
1 2 3 4 5 6 7 8 9 10
single adult couple without children couple with children
single parent couple w/o children, one age SPA
05
10
15
20
Pro
po
rtio
n o
f LP
fa
mili
es (
%)
1 2 3 4 5 6 7 8 9 10
non-working families working families

11
3.2 Impact of universal credit on the income of single parent families
This section estimates the impact of universal credit (UC) on the income of single parent families.
These estimates have been calculated by comparing families’ net incomes under two (hypothetical)
tax and benefit systems: an estimate of the personal tax and benefit system in October 2014,
assuming that universal credit has not been implemented at all, and an estimate of the personal tax
and benefit system in October 2014, assuming that universal credit has been fully implemented. As
discussed in Section 2, this impact has been estimated under a number of important assumptions,
including:
Transitional protection and the phase-in of UC have been ignored
Council tax benefit and its replacement have been ignored
Several simplifications have been made where policy under UC is still not yet clear or where
the number of affected cases is very small
We have assumed full take-up in all systems.
Table 3.1 shows the distribution and differences of equivalised disposable income before and after
UC among the whole working-age population and for single parents. Table 3.2 analyses the change
in mean income by family type, employment and earning status.
Figure 3.3, Figure 3.3, Figure 3.5, and Figure 3.6 show the average change in family income in pounds
and in percentage of income, for all families and for single parents, by income decile group and
according to whether the main earner in the family works at the minimum wage or above.
The results shown in these tables and figures are broadly in line with previous estimates in Brewer,
Browne and Jin (2012a&b), DWP (2012) and Adam and Browne (2013). In particular:
Mean incomes are in general slightly higher under UC, consistent with the long-run impact of
UC being to increase entitlements to state support.
The bottom half of the income distribution tends to gain slightly and the top half to lose
slightly, on average. 12 But, as Brewer, Browne and Jin (2012a) and Adam and Browne (2013)
show, these small average changes conceal a great deal of variation in the way that family
incomes are affected by UC.
Mean income for single parent families is slightly lower under UC, and they tend to slightly
lose on average from the introduction of UC.
However, there is great variation within these average results. Single parents working at the
minimum wage in the bottom half of the income distribution gain slightly from UC, while
non-working single parents and those working at a wage higher than the minimum wage see
their mean income reduced after the introduction of UC.
12
There are a number of differences between the analysis in this paper and those presented in Brewer, Browne and Jin (2012a&b). Perhaps the most innocuous-seeming, but of practical importance, is that the results in this paper use the modified OECD scale to equivalised household incomes, consistent with what is done by official documents, whereas most analysis using the IFS model uses the McClements equivalence scale.

12
Table 3.1. Net disposable income (£ per week) under 2014 baseline and under UC by employment
and NMW status (working-age families)
2014-15 Base system 2014-15 UC system Difference
Single parent
All families
Single parent
All families
Single parent
All families
mean 247.52 325.05 244.09 327.21 -3.43 2.16
p5 125.5 57.47 119.64 57.09 -5.86 -0.38
p10 148.65 74.32 148.58 83.99 -0.07 9.67
p25 181.27 169.44 179.91 175.72 -1.36 6.28
p50 226.14 267.49 225.08 269.76 -1.06 2.27
p75 283.04 416.47 280.51 416.48 -2.53 0.01
p90 354.05 602.74 347.44 602.74 -6.61 0
p95 411.92 761.56 407.67 762.34 -4.25 0.78
Notes and Source: as for Figure 3.1
Table 3.2. Changes in mean weekly equivalised disposable income by employment and earnings status and family type
Family type Earnings status Before UC (£) After UC (£) Difference (£) Difference %
Single adult Non-worker 123.48 135.76 12.27 9.94
Single adult Min Wage 219.87 221.60 1.74 0.79
Single adult Above NMW 367.32 368.59 1.27 0.35
Couples without children Non-worker 151.26 156.70 5.44 3.60
Couples without children Min Wage 335.53 334.41 -1.12 -0.33
Couples without children Above NMW 500.63 501.13 0.50 0.10
Couples with children Non-worker 177.26 175.61 -1.65 -0.93
Couples with children Min Wage 282.67 281.57 -1.10 -0.39
Couples with children Above NMW 376.39 376.41 0.02 0.00
Single parent Non-worker 190.43 187.66 -2.77 -1.46
Single parent Min Wage 255.59 251.53 -4.06 -1.59
Single parent Above NMW 304.65 299.72 -4.93 -1.62
Notes and Source: as for Figure 3.1

13
Figure 3.3 – Difference (£) in net equivalent income of working-age families and single parent families over the working age income distribution
Notes and Sources: as for Figure 3.1
Figure 3.4 - Changes in mean weekly net equivalised income by employment status, earnings and family type, under universal credit compared to the current system [working age households only]
Notes and Sources: as for Figure 3.1
-10
-50
51
0
Wee
kly
cha
ng
e in
net e
q fa
mily
inco
me b
y d
ecile
gro
up
1 2 3 4 5 6 7 8 9 10
working-age non single parents Single parents of working-age

14
Figure 3.5 – Difference (£) in single parent families’ equivalent disposable income over the working-age income distribution, by employment and earnings status
Notes and Sources: as for Figure 3.1
Figure 3.6 –Difference (%) in single parent families’ equivalent disposable income over the working-age income distribution, by employment and earnings status
Notes and Sources: as for Figure 3.1
-80
-60
-40
-20
02
0
We
ekly
ch
an
ge
in
ne
t eq
fam
ily incom
e b
y d
ecile
gro
up
1 2 3 4 5 6 7 8 9 10
Non-worker Min Wage Above NMW
-20
-10
01
02
0
We
ekly
ch
an
ge
in
ne
t eq
fam
ily incom
e b
y d
ecile
gro
up
1 2 3 4 5 6 7 8 9 10
Non-worker Min Wage Above NMW

15
3.3 Work incentives for non-working single parents
In this section, we estimate what impact UC has on the work incentives facing non-working single
parents. We measure these incentives using the participation tax rate (PTR), which measures what
fraction of gross earnings is lost to withdrawn benefit or tax credit entitlement and higher tax and NI
liability when entering the labour market. High PTRs represent weak incentives to be in work. The
focus is on how the incentives change for non-working adult single parents; we also compare these
to PTRs for non-working adults living in one earner couples with children (i.e. second earners).
In the analysis presented here, we assume that non-working adults enter the labour market at the
national minimum wage; Table 3.3, Table 3.4 and Figure 3.7 to Figure 3.10 show the full distribution
of PTRs for non-working single parents and non-working adults living in one earner couples with
children, separately for different assumptions about how many hours will be worked by the
(currently) non-working adults. They show that:
On average Universal Credit decreases the participation tax rate of non-working adults
especially at lower hours of work (Table 3.3).
On average single parents face higher PTRs under the current system (Table 3.3 vs Table
3.4); but Universal Credit increases the financial pay off from working of single parents (on
the assumption that they would earn the NMW). The higher decrease of PTRs for single
parents is observed at 10 hours of work per week.
This arises mostly because UC removes the 16 hours minimum limit for the entitlement at in-
work support.
Figure 3.7 to Figure 3.10 show the full distribution of PTRs for non-working single parents and adults
living in one earner couples with children, separately for different assumptions about how many
hours will be worked by the (currently) non-working adults. They show that:
Under the current tax and benefit system, non-working single parents are more likely to face
especially high PTRs than under UC, independently from the number of hours they would
work.
In general, under UC non-working single parents face lower PTRs. In particular, single
parents’ PTRs for jobs requiring up to 20 hours per week are always lower under UC than
under the current system. Moreover, a higher number of single parents will face especially
low PTRs when starting a job at 10 hours per week.
Potential second earners in couples with children will face higher PTRs (and therefore lower
financial incentives to work) under UC than under the current system. This rise in PTR occurs
because single-earner couples with children tend to gain from the introduction of UC; and as
a result of the higher headline withdrawal rate under UC; both factors mean that, compared
to the current system, there is more state support to be lost when the potential second
earner moves into work, and it is lost faster as the earnings of the potential second earner
rise.
Under UC (almost) no one will face a PTR above 77%. As we say above, excluding
consideration of Council Tax Benefit, universal credit reduces the number facing very high
participation tax rates (80%+).

16
Figure 3.11 shows the decomposition of the mean participation tax rate for non-working adults by
family types under UC13. Mean PTRs have been decomposed into a tax component, describing the
mean increase in taxes paid at the family level as a proportion of the increase in individual earnings;
a national insurance contribution component including variation in employee national insurance
contribution; and a benefit component, measuring the mean of the reduction in benefits paid at the
family level as a proportion of the increase in earnings14. The results show that:
Under the current system, non-working single parents face on average higher PTRs than
non-working adults living in different family structures (with exception of non-working
adults in couples with children); loss of means-tested benefits is usually the most important
component on their decision of working even few hours per week. High PTRs are more likely
for non-working single parents in the middle of the income distribution.
Under UC, non-working single parents face much lower PTRs at 10 and 20 hours of work per
week than under the current system, while the gain is smaller at higher hours of work.
Again the main component affecting their decision of joining the labour market is the
amount of benefits withdrawn, but this will be much lower after the introduction of UC
(Figure 3.11).
For single parents in the lower part of the income distribution, who are more likely to
receive means-tested benefits, on average the benefit withdrawal due to the increase in
earnings would be lower under UC than under the current system increasing their incentive
to work. The incentives to work are stronger for part-time jobs (i.e. 10 or 20 hours per week)
and it can be observed all along the income distribution (Figure 3.12).
Table 3.6 contains our estimates of how many families that contain a worker will also
contain someone subject to conditionality under universal credit (it is not yet clear how
conditionality will apply to families with children, and so we have given two options for
single parents and couples whose youngest child is aged 5-12 earning less than a specific
threshold). Overall, we estimate between 600,000 and 800,000 single parent families will be
subject to conditionality. The majority of these families contain non-working single parents
who are being encouraged to join the labour market. Between 5% and 8% of these families
are single parents working at the minimum wage who are being encouraged to increase
their hours worked or their hourly pay. Between 19% and 29% of these families consist of
single parents working at a wage higher than the minimum wage.
13
Figure C.1 and Figure C.1 in Appendix C show similar results for the current system. 14
Other income components have been checked for and results including self-employed social insurance contribution and pensions are available from the authors on request.

17
Table 3.3 - Distribution of PTRs of non-working adults, assuming they would earn NMW if in work
2014 baseline
mean p5 p10 p25 p50 p75 p90 p95
10 hours 39.66 0 0 0 40.00 68.81 90.84 92.08
20 hours 37.16 0 0 0 34.76 66.86 84.83 89.99
30 hours 31.98 0 0 0.26 30.54 56.81 76.67 82.49
40 hours 31.67 0 0 6.32 29.00 51.28 71.30 77.40
Under UC
mean p5 p10 p25 p50 p75 p90 p95
10 hours 20.49 0 0 0 12.24 38.63 59.26 65.00
20 hours 26.85 0 0 0 31.56 50.88 58.76 65.00
30 hours 27.17 0 0 0.26 30.34 47.50 56.30 65.09
40 hours 29.53 0 0 6.33 28.85 51.57 60.61 62.83
Notes and Sources: as for Table 3.1
Table 3.4 - Distribution of PTRs of non-working single parents, assuming they would earn NMW if in work
2014 baseline
mean p5 p10 p25 p50 p75 p90 p95
10 hours 40.65 0 0 0 68.33 68.34 68.34 68.34
20 hours 39.62 0 0 0 57.33 60.63 80.70 84.83
30 hours 36.97 0 0 0 51.95 62.18 62.18 73.13
40 hours 37.76 0 0 0 48.70 61.54 65.02 70.59
Under UC
mean p5 p10 p25 p50 p75 p90 p95
10 hours 2.11 0 0 0 2.44 2.50 2.50 2.50
20 hours 17.46 0 0 0 26.15 33.75 33.75 33.78
30 hours 24.07 0 0 0 39.10 44.26 44.26 46.52
40 hours 30.07 0 0 0 46.14 51.57 51.57 53.27
Notes and Sources: as for Table 3.1

18
Figure 3.7 – Cumulative distribution of PTRs for non-working adults in single parents vs one earner couples with kids – assuming they start a job at 10 hours per week
Notes and Sources: as for Figure 3.1
Figure 3.8 – Cumulative distribution of PTRs for non-working adults in single parents vs one earner couples with kids – assuming they start a job at 20 hours per week
Notes and Sources: as for Figure 3.1
02
04
06
08
01
00
Pa
rtic
ipation
Tax R
ate
(P
TR
) -
%
0 20 40 60 80 100Cumulative frequency (%)
non-worker in single-earner couple with kids - base non-worker in single-earner couple with kids - UC
non-worker single parent - base non-worker single parent - UC
02
04
06
08
01
00
Pa
rtic
ipation
Tax R
ate
(P
TR
) -
%
0 20 40 60 80 100Cumulative frequency (%)
non-worker in single-earner couple with kids - base non-worker in single-earner couple with kids - UC
non-worker single parent - base non-worker single parent - UC

19
Figure 3.9 – Cumulative distribution of PTRs for non-working adults in single parents vs one earner couples with kids – assuming they start a job at 30 hours per week
Notes and Sources: as for Figure 3.1
Figure 3.10 – Cumulative distribution of PTRs for non-working adults in single parents vs one earner couples with kids – assuming they start a job at 40 hours per week
Notes and Sources: as for Figure 3.1
02
04
06
08
01
00
Pa
rtic
ipation
Tax R
ate
(P
TR
) -
%
0 20 40 60 80 100Cumulative frequency (%)
non-worker in single-earner couple with kids - base non-worker in single-earner couple with kids - UC
non-worker single parent - base non-worker single parent - UC
02
04
06
08
01
00
Pa
rtic
ipation
Tax R
ate
(P
TR
) -
%
0 20 40 60 80 100Cumulative frequency (%)
non-worker in single-earner couple with kids - base non-worker in single-earner couple with kids - UC
non-worker single parent - base non-worker single parent - UC

20
Figure 3.11 – Mean PTR decomposition by income source for each family type under UC system
A) all family types –10hrs B) all family types – 20hrs
C) all family types –30hrs D) all family types –40hrs
Sources: as for Figure 3.1
01
02
03
0
PT
R (
%)
singles couples no kids couples with kids single parents
Benefits Tax NIC
01
02
03
04
0
PT
R (
%)
singles couples no kids couples with kids single parents
Benefits Tax NIC
01
02
03
04
0
PT
R (
%)
singles couples no kids couples with kids single parents
Benefits Tax NIC
01
02
03
04
0
PT
R (
%)
singles couples no kids couples with kids single parents
Benefits Tax NIC

21
Figure 3.12 – Mean PTR decomposition by income source for single parents by decile of equivalent disposable income – UC system
A) Single parents –10hrs B) Single parents – 20hrs
C) Single parents –30hrs D) Single parents –40hrs
Notes and Sources: as for Table 3.1
05
10
15
20
25
30
35
40
45
PT
R (
%)
1 2 3 4 5 6 7 8 9
Benefits Tax NIC
05
10
15
20
25
30
35
40
45
PT
R (
%)
1 2 3 4 5 6 7 8 9
Benefits Tax NIC
05
10
15
20
25
30
35
40
45
PT
R (
%)
1 2 3 4 5 6 7 8 9
Benefits Tax NIC
05
10
15
20
25
30
35
40
45
PT
R (
%)
1 2 3 4 5 6 7 8 9
Benefits Tax NIC

22 Table 3.5 - Estimated number of families receiving UC and affected by conditionality
Non-worker Min Wage Above NMW
Single person, no children, 3,800,000 104,008 532,275
earning less than 35 times min wage
Option (a) Single parent, youngest is aged 5-12 337,898 16,222 40,309
earning less than 16 times min wage
Option (b) Single parent, youngest is aged 5-12 337,898 42,911 146,455
earning less than 35 times min wage
Single parent, youngest is aged 13+ 165,882 19,946 89,218
earning less than 35 times min wage
Couple, no children, jointly 482,085 51,202 339,035
earning less than 70 times min wage
Couple, youngest child <5, jointly 299,445 30,737 162,421
earning less than 35 times min wage
Option (a) Couple, youngest child 5-12, jointly 142,504 15,916 156,975
earning less than 51 times min wage
Option (b)Couple, youngest child 5-12, jointly 142,504 28,088 259,334
earning less than 70 times min wage
Couple, youngest child 13+, jointly 114,454 19,396 148,956
earning less than 70 times min wage
total with (a) 5,342,268 257,427 1,469,189
total with (b) 5,342,268 296,288 1,677,694
Notes and Sources: as for Figure 3.1
23
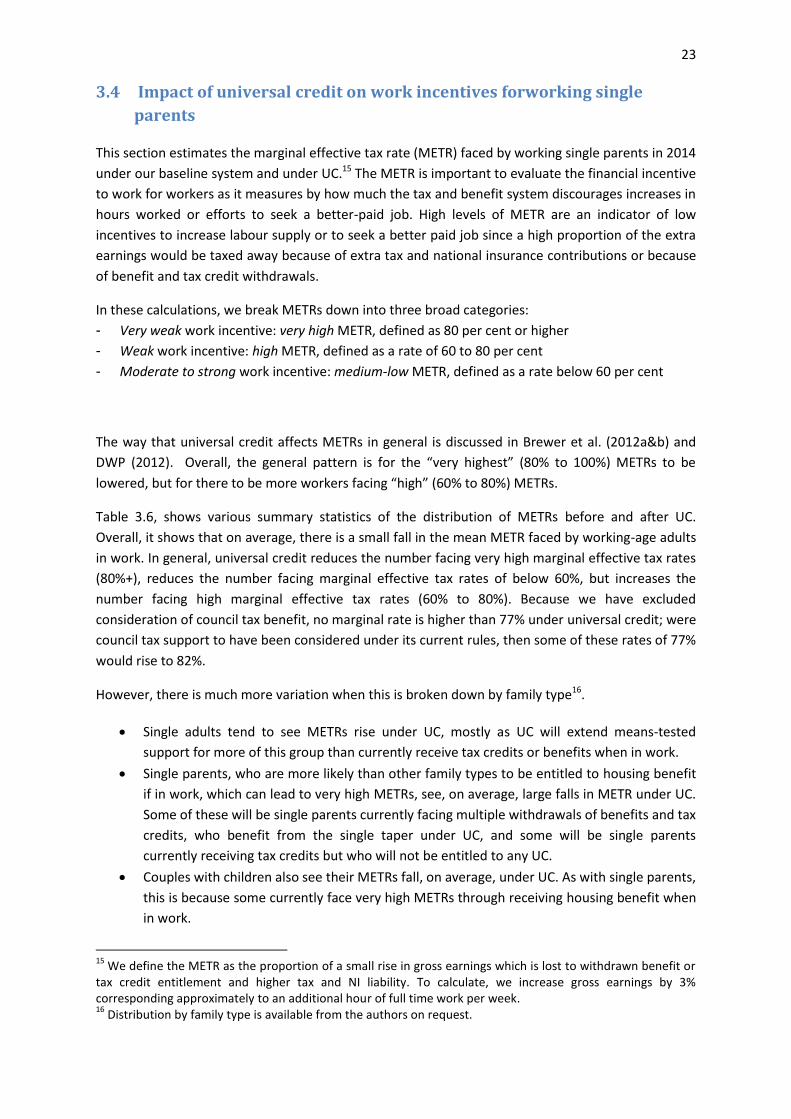
3.4 Impact of universal credit on work incentives forworking single
parents
This section estimates the marginal effective tax rate (METR) faced by working single parents in 2014
under our baseline system and under UC.15 The METR is important to evaluate the financial incentive
to work for workers as it measures by how much the tax and benefit system discourages increases in
hours worked or efforts to seek a better-paid job. High levels of METR are an indicator of low
incentives to increase labour supply or to seek a better paid job since a high proportion of the extra
earnings would be taxed away because of extra tax and national insurance contributions or because
of benefit and tax credit withdrawals.
In these calculations, we break METRs down into three broad categories:
- Very weak work incentive: very high METR, defined as 80 per cent or higher
- Weak work incentive: high METR, defined as a rate of 60 to 80 per cent
- Moderate to strong work incentive: medium-low METR, defined as a rate below 60 per cent
The way that universal credit affects METRs in general is discussed in Brewer et al. (2012a&b) and
DWP (2012). Overall, the general pattern is for the “very highest” (80% to 100%) METRs to be
lowered, but for there to be more workers facing “high” (60% to 80%) METRs.
Table 3.6, shows various summary statistics of the distribution of METRs before and after UC.
Overall, it shows that on average, there is a small fall in the mean METR faced by working-age adults
in work. In general, universal credit reduces the number facing very high marginal effective tax rates
(80%+), reduces the number facing marginal effective tax rates of below 60%, but increases the
number facing high marginal effective tax rates (60% to 80%). Because we have excluded
consideration of council tax benefit, no marginal rate is higher than 77% under universal credit; were
council tax support to have been considered under its current rules, then some of these rates of 77%
would rise to 82%.
However, there is much more variation when this is broken down by family type16.
Single adults tend to see METRs rise under UC, mostly as UC will extend means-tested
support for more of this group than currently receive tax credits or benefits when in work.
Single parents, who are more likely than other family types to be entitled to housing benefit
if in work, which can lead to very high METRs, see, on average, large falls in METR under UC.
Some of these will be single parents currently facing multiple withdrawals of benefits and tax
credits, who benefit from the single taper under UC, and some will be single parents
currently receiving tax credits but who will not be entitled to any UC.
Couples with children also see their METRs fall, on average, under UC. As with single parents,
this is because some currently face very high METRs through receiving housing benefit when
in work.
15
We define the METR as the proportion of a small rise in gross earnings which is lost to withdrawn benefit or tax credit entitlement and higher tax and NI liability. To calculate, we increase gross earnings by 3% corresponding approximately to an additional hour of full time work per week. 16
Distribution by family type is available from the authors on request.

24
Couples without children also tend to see their METRs fall under UC, although the mean
change overall is a quite small fall.
Figure 3.13 shows how the single parents’ distribution of METRs changes under UC, distinguishing
between minimum wage workers and those earning above the NMW. Figure 3.14 repeats the same
exercise for single earner couples with children. They show that:
Under the current tax and benefit system, low paid single parents are more likely to face
especially low and especially high METRs than higher-paid workers.
Under UC, there will be a new spike in the distribution of METRs at 65%, but (almost) no one
will face an METR above 77%. As we say above, excluding consideration of Council Tax
Benefit, universal credit reduces the number facing very high marginal effective tax rates
(80%+) but increases the number facing high marginal effective tax rates (60% to 80%).
Under UC, low paid single parents will face lower METRs. Thus, they will have less to lose
when progressing in the labour market.
Under UC, a higher number of single parents paid above the minimum wage will face METRs
below 60% and a lower number of them will face very high METRs (80%+), but a slightly
higher number will face METRs between 60% and 80%.
Figure 3.15 shows the decomposition by income sources of mean METRs by family types for the
working-age population. Figure 3.16 shows the decomposition by income sources of mean METRs
for single parents over the working-age income distribution.
Mean METRs have been decomposed into a tax component, describing the mean increase in taxes
paid at the family level as a proportion of the increase in individual earnings; a national insurance
contribution component including variation in employee national insurance contribution; and a
benefit component, measuring the mean of the reduction in benefits paid at the family level as a
proportion of the increase in earnings17. The two panels in Figure 3.15 show that while for the
majority of family types the tax component is usually the most important, for single parents the
component driving their incentives to work is the benefits withdrawal both under the base system
and under UC.
Figure 3.16 analyses more in detail the composition of METRs for single parents along the working-
age income distribution. Panels A and B show that for single parents in the lower part of the income
distribution, who are more likely to receive means-tested benefits, on average the benefit
withdrawals due to the increase in earnings would be lower under UC than under the current
system, increasing their incentive to work. This tends to affect mainly low paid workers, but also
single parents working at a wage above NMW and located in the lower part of the income
distribution.
Both under the current system and under UC, “high” values (over 60%) of METR are concentrated in
the middle of the income distribution, peaking in the 5th decile group. Individuals with METRs over
60% keep less than half (40%) of any small increase in their earnings. This can be explained by the
17
Other income components have been checked for and results including self-employed social insurance contribution and pensions are available from the authors on request.

25 presence of means-tested benefits at the bottom of the income distribution, by taxes, and by the
phase out of in-work benefits in the middle and upper part of the income distribution.
Table 3.6 - Distribution of METR under baseline and UC in 2014 system
Baseline scenario UC scenario
Single parent
All families
Single parent
All families
mean 62.12 36.32
55.59 36.19
p5 0 0
0 0
p10 32 18
1.3 20
p25 44.27 32
35.5 32
p50 73 33.2
67.06 32.82
p75 74.17 42
76.2 42
p90 90.55 63.5
77.29 65
p95 92.93 73 77.46 76.2
Medium-low METR (<60%)a 33.70% 89.45% 35.46% 88.08%
High METR (60%-80%) a 47.17% 8.56% 64.22% 11.91%
Very high METR (>80%) a,b 19.13% 1.99% 0.32% 0.01%
Sources: as for Figure 3.1
Notes: a Proportion of working-age individuals facing METR within a given interval (0-60%, 60%-80%
and more than 80%) b Excluding consideration of Council Tax Benefit, the number of people facing very high METRs is
reduced.

26 Figure 3.13 – Cumulative distribution of METRs before and after introduction of UC for single parents
Notes and Sources: as for Figure 3.1
Figure 3.14 – Cumulative distribution of METRs before and after introduction of UC for the single earner in couples with children
Notes and Sources: as for Figure 3.1
02
04
06
08
01
00
Marg
inal E
ffectice T
ax R
ate
(M
ET
R)
- %
0 20 40 60 80 100Cumulative frequency (%)
Single parent earning NMW - base Single parent earning NMW - UC
Single parent earning above NMW - base Single parent earning above NMW - UC
02
04
06
08
01
00
Marg
inal E
ffectice T
ax R
ate
(M
ET
R)
- %
0 20 40 60 80 100Cumulative frequency (%)
Couple with kids, one earner NMW - base Couple with kids, one earner NMW - UC
Couple with kids, one earner above NMW - base Couple with kids, one earner above NMW - UC

27 Figure 3.15 – Mean METR decomposition by income source by family type A) all family types – base system
B) all family types – UC system
Notes and Sources: as for Figure 3.1
02
04
06
0
ME
TR
(%
)
singles couples no kids couples with kids single parents
Benefits Tax NIC
02
04
06
0
ME
TR
(%
)
singles couples no kids couples with kids single parents
Benefits Tax NIC

28 Figure 3.16 – Mean METR decomposition by income source for working single parents over the
income distribution
A)Single parents - base system
B) Single parents – UC system
Notes and Sources: as for Figure 3.1
02
04
06
08
0
ME
TR
(%
)
2 3 4 5 6 7 8 9 10
Benefits Tax NIC
02
04
06
08
0
ME
TR
(%
)
2 3 4 5 6 7 8 9 10
Benefits Tax NIC

29
4 The effects of possible changes to universal credit on the income
distribution and work incentives for single parents
In light of the result that a significant proportion of single parent families will not fare well under UC,
in this section we consider various changes to UC compared to the system as it is currently planned,
to see which (if any) would achieve improvements for single parent families under UC. We consider
the following four alternative scenarios:
1 – Reducing the UC taper from 65% to 55%,
2 – Increasing the basic allowance for everyone within UC by £39 per year18,
3 – Increasing the amount of income disregards for everyone on UC by £39 a year,
4 – Increasing the income tax threshold for the basic tax rate by £300.
For each scenario, we estimate its impact on the disposable income distribution and work incentives
of single parents.
All reforms are applied to the 2014 tax and benefit scenario within UC and their effects are
estimated using EUROMOD run on FRS 2009/10 data uprated to 2014 prices. The magnitude of each
reform has been chosen on the basis of previous research (Hirsch, 2012). It should be remembered
that we exclude simulation of Council Tax benefit, and assume full-take up of benefits and tax credits
as well as no transitional protection in UC throughout. This might lead us to overestimate the
Exchequer costs of the reforms as well as the corresponding gain.
Table 4.1 shows mean effects of the reforms on the income distribution of single parent families.
Table 4.2 and Table 4.3 summarize the effects of the reforms on financial work incentives
respectively for working and non-working single parents19. Table 4.4 shows the estimated annual
costs implied by each reform scenario. Below we examine in turn each of the reforms.
18
Gingerbread’s research has shown that people on low income will lose two thirds of the increase in the personal tax allowance under UC. Thus, a £300 increase in tax allowance is worth £60 to most basic rate tax payers, because they pay 20% tax on £300 less income. However, as UC is assessed on net income, the effect on low income families would be smaller, because the extra £60 would be taken into account as income and they will be taper away once the limit for disregard is passed. We take account of this and try to compensate families on UC by this reduction in credit (around £39 a year on £300 tax allowance) in various ways. 19
The results on the mean effects of the reforms on the income distribution and financial work incentives by various family types are available from the authors upon request.

30 Table 4.1 – Mean distribution effects of the reforms on single parent families
Eq. Net income base scenario
Change of net eq income
from UC
% change in net UC eq. income from reform
UC taper down
UC basic Allowance
up
UC Disregards
up
Basic tax Rate
Threshold up
£/w % % % % %
Poorest 52.75 -15.91 0.00 0.70 0.00 0.00
2 124.49 -3.86 0.01 0.39 0.00 0.00
3 170.00 -0.40 0.04 0.28 0.00 0.00
4 206.40 -0.28 0.38 0.23 0.03 0.01
5 247.20 -1.62 2.13 0.19 0.09 0.06
6 289.24 -2.08 2.25 0.15 0.08 0.08
7 346.04 -3.79 1.87 0.09 0.05 0.12
8 408.84 -3.27 1.32 0.05 0.03 0.16
9 526.26 -0.75 0.56 0.01 0.00 0.24
Richest 832.19 -0.03 0.04 0.00 0.00 0.17
Notes and Sources: as for Table 3.1
Table 4.2 – Effects of the reforms on workers’ METRs
UC UC taper UC basic UC Personal
down Allowance Disregards Allowance
up up up
Single parent mean 55.79 52.14 55.82 55.75 55.66
median 67.82 61.26 67.82 67.57 67.57
25th percentile 35.58 42.00 35.58 35.58 35.52
75th percentile 76.20 69.40 76.20 76.20 76.20
% whose rate rises 37.00 4.00 1.00 1.00 0.00
% whose rate falls 32.00 64.00 0.00 1.00 4.00
All working-age families
mean 36.15 36.69 36.20 36.16 35.98
median 32.82 33.52 32.88 32.82 32.65
25th percentile 32.00 32.00 32.00 32.00 32.00
75th percentile 42.00 42.89 42.00 42.00 42.00
% whose rate rises 8.00 4.00 1.00 0.00 1.00
% whose rate falls 7.00 11.00 0.00 0.00 3.00
Notes and Sources: as for Table 3.1

31
Table 4.3 – Effects of the reforms on workers’ PTRs
UC UC taper UC basic UC Personal
down Allowance Disregards Allowance
up up up
Single parent mean 43.90 38.20 43.89 43.72 43.72
median 51.57 44.61 51.57 51.38 51.41
25th percentile 46.14 39.28 46.14 45.90 45.94
75th percentile 51.57 44.61 51.57 51.38 51.41
% whose rate rises 8.00 0.00 1.00 0.00 0.00
% whose rate falls 90.00 95.00 1.00 93.00 98.00
Total mean 33.01 31.07 33.12 32.96 32.66
median 30.54 30.88 30.84 30.54 30.09
25th percentile 13.79 14.77 13.88 13.87 13.26
75th percentile 51.95 46.67 52.16 51.78 51.50
% whose rate rises 24.00 8.00 33.00 7.00 0.00
% whose rate falls 50.00 38.00 0.00 31.00 94.00
Notes and Sources: as for Table 3.1
Table 4.4 - Estimated annual costs for each policy reform proposal compared to currently
proposed UC (in millions)
UCa UC taper UC basic UC Personal
down Allowance Disregards Allowance up up up
Annual cost for the reform £/y (mln) 2,165 3,528 363 85 1,489
Sources: as for Table 3.1
Notes: a Base UC estimated annual extra costs compared to the current system.

32 Table 4.5 – Summary of the effects of reforming universal credit
Reform to UC
Household type
Effects on income distribution
Effect on incentives to work at all (PTRs)
Effect on progress into work (METRs)
Costing to the exchequer
UC taper rate down
Single parents
Weakly progressive; helps only people in work; helps low paid
Reduces PTRs Improves METRs; Mixed: decrease high METRs and rises low METRs
Most expensive
All Reduces PTRs. Mixed effect: reduces high PTRs but increase low PTRs
Damages METRs; rise high METRs
UC basic allowance up
Single parents
Progressive; helps both non-workers and low paid workers
Very small fall of PTR
Slightly damages METRs
Medium-low cost
All Rise PTRs
Slightly damages METRs
UC income disregards up
Single parents
Weakly progressive for single parents
Small fall of PTRs; low PTRs decrease more than high PTRs
Small fall on average
Less expensive
All Small fall of PTRs; fall in high PTRs smaller than increase in low PTRs
Very small rise on average
Personal allowance up
Single parents
Rich gain most Fall in PTRs; low PTRs decrease more than high PTRs ;
Small fall on average mostly for those facing low METRs
Medium-high cost
All Fall in PTRs; small fall in high PTRs, large fall in low PTRs
Small fall on average

33 Figure 4.1 - Comparing PTR changes implied by the four scenarios at 40 hours per week – all working-age families
a) UC taper reduced from 65% to 55% b) UC increasing standard allowance
c) UC increasing income disregards d) Increasing personal allowance (base income tax
threshold)
Notes and Sources: as for Table 3.1
-8-6
-4-2
02
Mea
n d
iffe
ren
ce
in
PT
Rs
0-10 11-20 21-30 31-40 41-50 51-60 61-70 71-80
-1.2
-1-.
8-.
6-.
4-.
20
.2.4
Mea
n d
iffe
ren
ce
in
PT
Rs
0-10 11-20 21-30 31-40 41-50 51-60 61-70 71-80
-1.2
-1-.
8-.
6-.
4-.
20
.2.4
Mea
n d
iffe
ren
ce
in
PT
Rs
PTRs under base UC scenario
0-10 11-20 21-30 31-40 41-50 51-60 61-70 71-80 -1.2
-1-.
8-.
6-.
4-.
20
.2.4
Mea
n d
iffe
ren
ce
in
PT
Rs
0-10 11-20 21-30 31-40 41-50 51-60 61-70 71-80

34 Figure 4.2 - Comparing PTR changes implied by the four scenarios at 40 hours per week – single parents only
a) UC taper reduced from 65% to 55% b) UC increasing standard allowance
c) UC increasing income disregards d) Increasing personal allowance (base income tax
threshold)
Notes and Sources: as for Table 3.1
-10
-8-6
-4-2
02
Mea
n d
iffe
ren
ce
in
PT
Rs
PTRs under base UC scenario
0-10 11-20 21-30 31-40 41-50 51-60 61-70
-1.2
-1-.
8-.
6-.
4-.
20
.2.4
Mea
n d
iffe
ren
ce
in
PT
Rs
PTRs under base UC scenario
0-10 11-20 21-30 31-40 41-50 51-60 61-70
-1.2
-1-.
8-.
6-.
4-.
20
.2.4
Mea
n d
iffe
ren
ce
in
PT
Rs
PTRs under base UC scenario
0-10 11-20 21-30 31-40 41-50 51-60 61-70
-1.2
-1-.
8-.
6-.
4-.
20
.2.4
Mea
n d
iffe
ren
ce
in
PT
Rs
PTRs under base UC scenario
0-10 11-20 21-30 31-40 41-50 51-60 61-70

35
4.1 Reducing the UC taper from 65% to 55%
Universal Credit will be withdrawn at a rate of 65% as earnings increase. Thus as earnings rise over
the limit that is disregarded, UC will decrease by 65p per extra £1 earned. Unearned income will be
taken into account in full, reducing the maximum amount of UC pound for pound.
However, the first policy paper that proposed the introduction of a universal credit-style system,
back in 2009, originally proposed a system with a taper rate of 55 per cent, which it identified as the
“preferable withdrawal rate”20. We have therefore modelled what impact a reduction in the
universal credit taper from 65% to 55% would have on single parents.
As a proportion of equivalised income, in general the gain from reducing the UC taper is
concentrated in the middle of the income distribution with the largest gain (1.85% of equivalent net
income) accruing to the 4th decile group, while the top decile group is unaffected. The poorest decile
group would gain around 0.30% of income.
Table 4.1 and Figure 4.3 show the results for single parents. Those in the lowest decile group gain
nothing from this reform, whilst single parents in the 2nd and 3rd decile groups (mainly low paid
workers) gain little (probably because the amount earned is not enough to take them over the
disregard income limit). The main gainers from the single parent groups are those in the 5th and 6th
decile groups who would gain a little more than 2% of their income. When distinguishing between
those working at the minimum wage and those paid above this level, reducing the UC taper has a
positive effect for all working single parents; the highest gains are observed among minimum wage
single parents in the 7th decile group, and among single parents paid over the NMW at the 5th and 6th
decile groups (Figure 4.4).
Changing the UC taper from 65% to 55% reduces the number of single parents facing high METRs
(Table 4.2). However, because UC is assessed after tax and NIC have been deducted, the reduction in
the UC taper rate from 65% to 55% does not mean that METRs fall by 10 percentage points. In all,
4% of workers would see their METRs rise, while 11% see it fall compared to our base UC scenario. In
general, the mean METRs rises by 1.49% for working adults compared to the base UC system. More
than half of working single parents (64%) would see their METRs fall if the UC taper was reduced,
meaning that they would lose less of their extra income in withdrawal of means-tested benefits if
they were to work more hours or find a better paid job. On average, the mean METRs faced by
working single parents would fall by 6.5%. A higher number of single parents would face stronger
incentives to work.
Single parents face some of the weakest incentives to work at all (Table 4.2) under the base system,
the base UC and the modified UC scenarios. Reducing the UC taper rate has a positive effect on the
financial incentives to work at all for the whole working-age population and, in particular, for single
parents who see their PTRs fall by 12.9% compared to the base UC scenario (Table 4.3).
In summary, cutting the UC taper rate provides the largest gain to the 4th and 5th decile groups
within the whole working-age population but does little for the lower part of the income distribution
in general and for single parents in particular. On average for the whole working-age population
METRs slightly rise, with 4% facing higher METRs and 11% facing lower METRs;, however the number
20
Centre for Social Justice (2009) Dynamic Benefits: Towards welfare that works

36 of single parents facing high METRs is considerably reduced. PTRs fall on average and the strongest
reduction is seen by single parents, who lose fewer benefits when entering the labour market than
under the current system. However, this reform is expensive, adding up to a total annual cost of £3.5
billion.
Figure 4.3 – Distributional effect for single parent families (eq. £ per week)- UC with a lower (55%) taper rate
Notes and Sources: as for Figure 3.1
Figure 4.4 – Distributional effect for single parent families (% eq. income per week)- UC with a lower (55%) taper rate
Notes and Sources: as for Figure 3.1
02
46
8
We
ekly
ch
an
ge
in
ne
t eq
fam
ily incom
e b
y d
ecile
gro
up
1 2 3 4 5 6 7 8 9 10
Non-worker Min Wage Above NMW
01
23
We
ekly
ch
an
ge
(%
) in
net e
q fa
mily
in
co
me
by d
ecile
gro
up
1 2 3 4 5 6 7 8 9 10
Non-worker Min Wage Above NMW

37
4.2 Increasing UC standard allowances
The second reform that we consider is an increase in the UC standard allowance of 75p per week.
This takes the allowance per week up to £57.75 per week for a single person (aged 16 to 24) and to
£72.70 per week for single adults aged 25 or over21, to £113.7 per week for couples (with and
without children) where either is aged 25 or over and either or both below the state pension age
(SPA), and to £90.22 per week for couples where both aged under 25.
This kind of reform is progressive: overall the poorest income decile group gains on average 1.07% of
income per week compare to the basic UC as announced, while the top end of the income
distribution is on average unaffected. This reform targets well the poorest families as well as those
low paid in various decile groups. However, on average it slightly damages incentives to work mainly
for non-workers (Table 4.2, Table 4.3 and Figure 4.1). Overall 33% of non-working adults see their
PTRs increase, whilst on average no one sees them fall. The most affected demographic group are
non-working single adults with low PTRs (strong incentives to work), 58% of whom see their PTRs
fall.
Overall the annual cost of this reform is estimated to be £363 million.
Figure 4.5 – Distributional effect for single parent families (eq. £ per week)- UC with higher standard allowance
Notes and Sources: as for Figure 3.1
21
At the time of writing this report there was still uncertainty on how UC would have treated young single parents age 16 to 24. We assumed that single parents would continue to be exempt from rules that provide people under the age of 25 a lower rate of support. Since then, universal credit reforms have removed this exemption, resulting in 240,000 young parents losing around £780 a year (http://www.gingerbread.org.uk/uploads/media/17/8115.pdf ).
0.1
.2.3
.4.5
We
ekly
ch
an
ge
in
ne
t eq
fam
ily incom
e b
y d
ecile
gro
up
1 2 3 4 5 6 7 8 9 10
Non-worker Min Wage Above NMW

38
Figure 4.6 – Distributional effect for single parent families (% eq. income per week)- UC with higher standard allowance
Notes and Sources: as for Figure 3.1
0.1
.2.3
.4.5
We
ekly
ch
an
ge
(%
) in
net e
q fa
mily
in
co
me
by d
ecile
gro
up
1 2 3 4 5 6 7 8 9 10
Non-worker Min Wage Above NMW

39
4.3 Impact of increasing income disregards
The third reform we consider is an increase in the UC income disregards22. Under universal credit,
different amounts of income will be disregarded before the taper applies, in order to reflect the
needs of different families and ensure that work pays (DWP, 2013). The amount to be disregarded
will be reduced to reflect support received for housing costs. The actual income disregard levels for
people not receiving support with housing costs are: £111 per month for singles or couples not
responsible for a child, £734 per month for single parents, £536 per month for couples with one or
more children, and £647 per month for singles or couples where one or both have limited capability
for work. Claimants who receive some support for their rent or mortgage interest23 are entitled to
lower disregards: £111 per month for singles or couples not responsible for a child, £263 per month
for single parents, £222 per month for couples with one or more children, and £192 per month for
singles or couples where one or both have limited capability for work.
We apply a similar increase as for scenario 2 and raise all income disregards by 75p per week (£3.25
per month).
Overall this reform has some small positive effects on the lower income decile groups, while it leaves
the highest decile groups unaffected. However, single parents in the bottom half of the income
distribution are also unaffected on average (Table 4.1). This is mainly the case for non-working single
parents and low paid single parents in the first and second decile groups (Figure 4.7). Other working
single parents gain little from this reform (between 0.03% and 0.09% of income). This is mainly
because in order to take advantage of the disregards, the claimant must be in work at a combination
of wage and hours worked that take his or her earned income over the disregarded limit.
Overall, although on average this reform would only slightly affect financial incentives to work, 31%
of non-working adults in the working-age population would see their PTRs fall, while 7% would see
them rise. The effect on single parents’ incentives to progress in work and to start a job would be
stronger, with 93% of non-working single parents seeing their PTRs fall (Table 4.3 and Figure 4.9).
Among the various demographic groups, the most affected by this kind of reform would be non-
working single parents, followed by non-working single adults or couples without children (Table
4.1).
Overall, our estimates show that this reform would cost about £85 million a year.
22
Income disregards are also called work allowances. 23
We do not consider support for mortgage interest in either the base system or UC. Details on how the Government intends to manage this kind of support are not clear yet and, hence, we do not simulate this kind of support within HB and UC. This may affect our estimates of how many people would be entitled to HB under the base/current tax and benefit system and how many under UC.

40 Figure 4.7 – Distributional effect for single parent families (eq. £ per week)- UC with higher income disregards
Notes and Sources: as for Figure 3.1
Figure 4.8 - Distributional effect for single parent families (% eq. income per week)- UC with higher income disregards
Notes and Sources: as for Figure 3.1
0.1
.2.3
We
ekly
ch
an
ge
in
ne
t eq
fam
ily incom
e b
y d
ecile
gro
up
1 2 3 4 5 6 7 8 9 10
Non-worker Min Wage Above NMW
0
.05
.1
We
ekly
ch
an
ge
(%
) in
net e
q fa
mily
in
co
me
by d
ecile
gro
up
1 2 3 4 5 6 7 8 9 10
Non-worker Min Wage Above NMW

41 Figure 4.9 – Mean changes in PTRs of UC implied by an increase of income disregards at various
hours of work per week
a) working 10 hours per week b) working 20 hours per week
c) working 30 hours per week d) working 40 hours per week
Notes and Sources: as for Figure 3.1

42
4.4 Impact of increasing the income tax threshold for basic rate tax
The fourth reform to UC that we consider is an increase of the personal tax allowance for all working
age adults. We consider an increase of £300 per year . This affects the point at which people start
paying tax and as a consequence fewer taxpayers will be subject to the 20% lower tax rate.
This reform affects mainly the top-half of the income distribution (Figure 4.10 and Figure 4.11) and it
reduces METRs by 0.47% on average (Table 4.1). The average effect on METRs for single parents is
lower (0.23% less than the actual UC) than the working-age population average. There is also a small
effect on incentive to work full-time (40 hours per week) for people out of work (PTRs): on average
94% of non-workers see their PTRs decrease, as well as 98% of single parents.
Widening the basic rate band at the top is not a strong way to increase the income of the poor
mainly because most of them pay less than the basic rate income tax and so do not benefit from a
reform of this kind. Moreover the effect on financial incentives to work is positive on average,
although stronger for single parents already facing higher incentives to work (Figure 4.1 and Figure
4.2).
Overall, an increase in the personal allowance of this amount would cost around £1.5 billion per year
to the Exchequer.
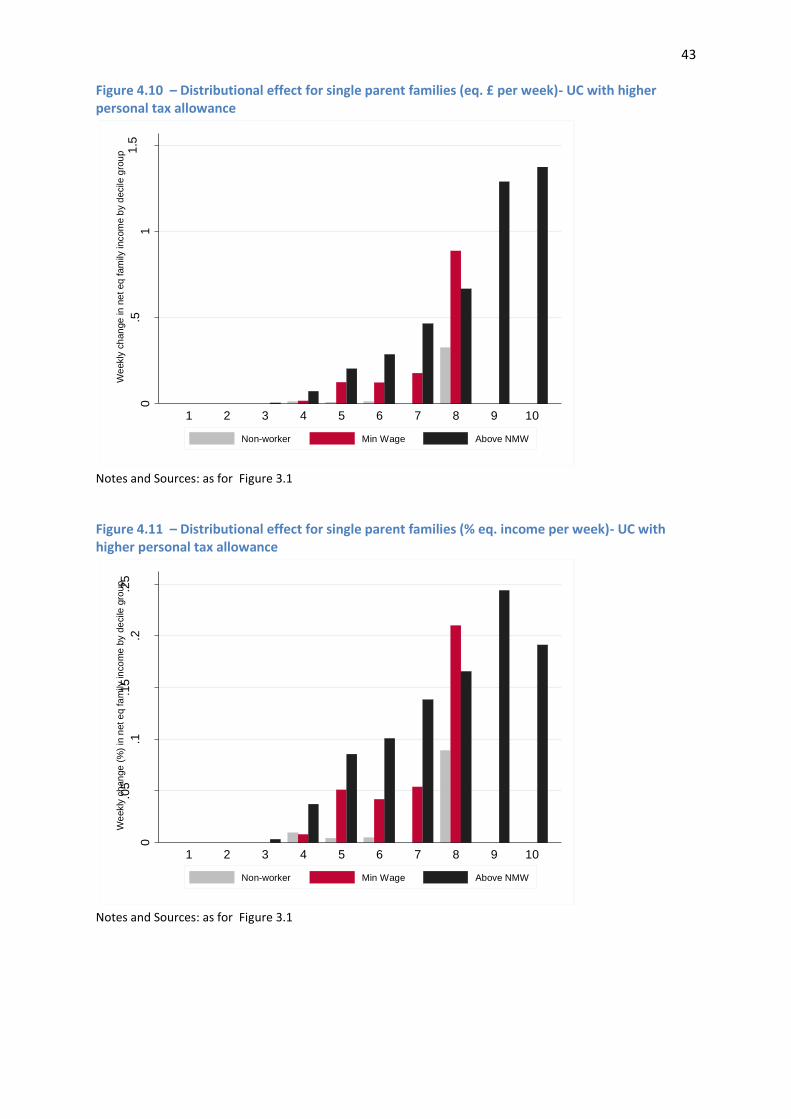
43 Figure 4.10 – Distributional effect for single parent families (eq. £ per week)- UC with higher personal tax allowance
Notes and Sources: as for Figure 3.1
Figure 4.11 – Distributional effect for single parent families (% eq. income per week)- UC with higher personal tax allowance
Notes and Sources: as for Figure 3.1
0.5
11
.5W
eekly
ch
an
ge
in
ne
t eq
fam
ily incom
e b
y d
ecile
gro
up
1 2 3 4 5 6 7 8 9 10
Non-worker Min Wage Above NMW
0
.05
.1.1
5.2
.25
We
ekly
ch
an
ge
(%
) in
net e
q fa
mily
in
co
me
by d
ecile
gro
up
1 2 3 4 5 6 7 8 9 10
Non-worker Min Wage Above NMW

44
5 Impact of a rise in the national minimum wage on the income of
single parent families
This section shows the impact on single parent families of a statutory rise in the national minimum
wage, and how this varies by position in the income distribution and type of family. These estimates
were calculated by increasing our projected level for the NMW in October 2014 by 10%, and
calculating how net incomes change under the currently planned UC system.24
Table 5.1 shows the average change in net income for single parents and the whole working age
population. Figure 5.1 and Figure 5.2 show the same by income decile group, the first for all working-
age families by family type, and the second for single parents25.
In general, the effect of a rise in the NMW on the income of a NMW family depends on the share of
net income accounted for by earnings from the NMW, and the METR faced by the NMW worker in
that family. Families that see incomes change by small amounts are either those in which NMW
workers are facing high METRs, or those in which other sources of income make earnings from NMW
relatively unimportant. Similarly; families that see incomes change by large amounts are either those
in which NMW workers are facing low METRs, or those in which other sources of income make
earnings from NMW relatively important. Amongst those families for whom the NMW is the main
source of earnings, families without children gain the most from a rise in the NMW: this presumably
reflects the fact that they will tend to face lower METRs than families with children under UC. Across
the bulk of the income distribution, a 10% rise in the NMW leads to an increase in net equivalent
family income amongst low paid NMW single parent families of around £3.84 per week; this breaks
down to a figure of around £4.12 for single parent families where the NMW is the main source of
earnings, and around £1.86 for families where the NMW is the secondary source of earnings26.
Table 5.1 - Average change in net equivalent income (£/week) for working-age families and single parent families, by NMW status after a hypothetical 10% rise in the NMW under UC
Single parent All families
Low paid 3.84 8.85
Notes and sources: as for Figure 3.1
24
Our assumption of full-take-up of benefits and tax credits and UC means that our results are likely to be underestimating the true impact, as families not receiving the benefits and tax credits to which they are entitled will tend to face lower METRs and thus gain more from a rise in the NMW. 25
We classify working-age families by “Low paid in main job" when the NMW is paid for the main job of the main earner, “Low paid in 2
nd job or 2
nd earner” when the main earner is paid at the NMW in his second job or
a second earner is paid at NMW in his/her main job; “above NMW” when the main earner is paid above NMW and nobody else in the family is paid at NMW. 26
Number of single parents with a second job: 11 observations in FRS 2009/10 corresponding to 13,814 individuals.

45 Figure 5.1. Change (%) in equivalent family income when NMW increased by 10%, all NMW families (under UC)
Notes and Sources: as for Figure 3.1
Figure 5.2. Change (%) in equivalent family income of single parents when NMW increased by 10% (under UC)
Notes and Sources: as for Figure 3.1
02
46
8
% c
han
ge
in n
et fa
mily
inco
me
1 2 3 4 5 6 7 8 9 10
single adult couple without children
couple with children single parent
01
23
% c
han
ge
in
ne
t fa
mily
incom
e
2 3 4 5 6 7 8

46
6 Modelling an increase in the single parent employment rate
The EUROMOD framework is a static microsimulation process, which means it assumes that people
do not change their behaviours in response to the introduction of a reform. In other words, the
analysis of each alternative scenario to universal credit does not take into account changes in the
behaviour of individuals in the data following the introduction of a policy reform. However, it is
possible to estimate how tax revenues and spending on benefits would change if patterns of
employment were to change.
One of the main objectives of UC is to improve financial incentives to work by making work pay.
Therefore, it is expected that following the introduction of universal credit, people would change
their “employment behaviours” because working more hours, getting a better paid job or joining the
labour market should be more convenient than under the current system.
To estimate the impact on the Exchequer of a rise of 5 percentage points in the employment rate of
single parents, we took the following steps:
1) From the single parents in the FRS, we randomly selected a number equivalent to 5% of the
total population of single parents (giving us just over 100 actual cases). These became the
single parents who are assumed to move into work.
2) Each of the single parents assumed to move into work was matched with a similar single
parent in the FRS who was observed in work, and the non-working single parents were
assumed to move into work at a level of gross earnings and weekly hours of work given by
the matched in-work single parent.27
3) Having imputed gross earnings to the single parents assumed to move into work, we can run
the modified FRS data through EUROMOD in the normal way to estimate their benefit
entitlement and tax liability.
The calculations were done under a hypothetical 2014-15 tax and benefit system in which Universal
Credit has been fully implemented, there is no transitional protection and there is full take-up of
benefits. Values of financial variables in the 2009-10 FRS have been appropriately adjusted so that all
calculations are in 2014-15 prices.
This procedure still uses the following assumptions:
- There are no anticipation effects of UC or dynamic effects of UC on employment. In other
words, people in work and those out of work do not anticipate changes in their labour
market behaviour because of the introduction of UC.
- Other members of the household not directly affected by the UC do not change their labour
market behaviour (ie, no change in hours worked or postponed retirement).
27
In technical terms, a non-working single parent was matched to a working single parent who had a similar probability of being in work given various characteristics that can be observed in the FRS (number of children by age groups (0-5, 6-11, 12-15 and 16-18), education, region, housing tenure, council tax band, local authority disability status, entitlement to Disability Living Allowance (DLA), probability of entitlement to Incapacity Benefit (IB/ESA) as a proxy of incapacity to work, a cubic in age and an indicator variable for being under SPA). This is a form of propensity score matching.

47 The current employment rate of single parents in the FRS is 49.18%. In the scenario considered here,
the employment rate of single parents increases up to 54.21%.
Table 6.1 shows the difference in disposable income and its components between the UC base
scenario and a scenario with a rise in the single parent employment rate of 5 percentage points. It
also shows the aggregate change in spending on benefits and receipts of income tax and national
insurance. If single parents’ employment rate rises to 54.21%, single parents’ family equivalent net
income would rise on average by £3.66 per week. This would generate an average annual gain for
the Exchequer of about £436 million a year due to reduced benefits (£272million) and increased
taxes and national insurance contributions (£164million) compared to the base UC scenario.
Table 6.1- Weekly average changes in disposable income and its components for single parent
families under the hypothesis of a 5 percentage points increase in single parents’ employment
rate.
Value level
Aggregate values
Out of work In work Changes changes
£/wk £/wk £/wk £/yr (mln)
Total earnings 0 212.04 212.04 948
Income tax 16.31 31.28 14.97 67
Employee and self-employed NI 0 12.25 12.25 55
Employer NI 0 9.41 9.41 42
Means-tested benefits 244.59 184.02 -60.57 -272
Disposable income 291.5 415.76 124.26 554
Eq. Disposable income 186.31 267.9 81.6 --
Total from income tax and NI -- -- -- 164
Total impact on the Exchequer -- -- -- 436
Notes and Sources: as for Figure 3.1

48
7 Conclusions
Living in a single parent family is often associated with experiences of poverty, because they are
usually amongst the poorest demographic groups with often weak incentives to work, not only
because they face high childcare costs but also because of high withdrawal of means-tested benefits
when they join the labour market. Therefore, as the aim of reducing child poverty in the UK remains
a priority, it is important to understand how single parent families will be affected by the
introduction of universal credit (UC).
This report looked at how the introduction of UC in the UK will affect the income distribution and
the distribution of work incentives for single parent families. The report also looked at how various
changes to the latest announced details of UC would affect the impact of the reform on single
parent families in particular, but also on other demographic groups within the working age
population.
The analysis shows that mean incomes for working-age families are in general slightly higher under
UC, consistent with the long-run impact of UC being to increase entitlements to state support.
However, mean income for single parent families is lightly lower under UC than under the current
system. On average they are forecasted not to benefit from the introduction of UC, although there is
great variation within these average results. Low-earning single parents in the lower part of the
income distribution gain slightly from UC, while non-working single parents and those working at a
wage higher than the national minimum wage see their mean income reduced after the introduction
of UC.
In terms of work incentives, our analysis shows that under universal credit many non-working single
parents who currently have weak incentives to enter work will see these improved, mainly because
of the removal of the minimum limit on hours worked per week28, as well as slower benefit
withdrawal29. Similarly, some working single parents who currently have weak incentives to work
more will see these improve. However, it is also important to note that, despite this improvement,
single parents will still face some of the weakest incentives to work at all and to progress in work
compared to other household types, and especially when they work 20 or more hours per week.
This report has also simulated some reforms to the latest UC policy announced by the Government
in Budget 2013. In particular, we simulated a reduction in the UC taper from 65% to 55%, an increase
in the standard UC allowance, an increase in the earnings disregard, and an increase in the income
tax threshold for the basic tax rate. We compared these reforms in term of their redistributive
effects and their impact on financial incentives to work to those implied by the basic UC, which will
be introduced from October 2013. None of the reforms to Universal Credit achieves both
substantial redistribution of income to poor and a substantial strengthening of average work
incentives. The best option depends on the government’s priorities given the available budget.
28
This is in contrast to working tax credits where claimants must work a minimum of 16 hours per week 29
For more details on how Universal Credit works see Brewer M., J. Browne and W. Jin (2012) “Universal Credit: A Preliminary Analysis of Its Impact on Incomes and Work Incentives” Fiscal Studies, vol. 33, no. 1, pp. 39-71.

49 If the main concern is direct help for the poorest, then increasing universal credit standard
allowances is the most progressive of the options considered here. Increasing personal tax allowance
would instead leave the poor unaffected while increasing the income at the top-half of the income
distribution. Reducing the taper or increasing income disregards are only weakly progressive: single
parents out of work and those in the lowest tenth of the income distribution would gain nothing
from these reforms since they would affect only people in work and those with high-enough income
to pay basic rate income tax. If the main aim is to help low paid workers, both reducing UC taper and
increasing income disregards would have positive effects on low-middle income families, leaving the
highest income group unaffected.
The reform that is most effective at reducing the number of single parents facing low incentives to
progress in work as well as those facing weak incentives to work at all is reducing the universal credit
taper rate from 65% to 55%.
The reform that does the most damage to work incentives of single parents is the same that would
do the most to help the poor. Overall, increasing universal credit standard allowances would damage
incentives to progress in work and to work at all for the whole working-age population in contrast to
a very small improvement of incentive to work for few single parents.
Increasing income disregards and personal tax allowance have a moderately and similar positive
effect on the incentives to work of single parents: they reduce the number of single parents facing
very weak incentives to work at all, however they would imply mixed effects for people living within
other family structures: increasing personal tax allowance would reduce PTRs for a large number of
adults already facing medium to strong incentives to work. Increasing universal credit income
disregard would slightly improve incentives to work for those currently facing weak incentives to
work, but would damage those of people facing low PTRs.
This report also looked at the effect of a 10% increase in the national minimum wage by family type.
In general, NMW families which see incomes change by small amounts after a rise in the NMW are
either those in which NMW workers are facing high METRs, or those in which other sources of
income make earnings from NMW a relatively unimportant income source. Similarly, NMW families
which see incomes change by large amounts after a rise in the NMW are either those in which NMW
workers are facing low METRs, or those in which other sources of income make earnings form NMW
a relatively important income source. Across the bulk of the income distribution, a 10% rise in the
NMW leads to an increase in net family income amongst NMW families of around 3%; this is around
4% for families where the NMW is the main source of earnings, and around 2% for families where
the NMW is the secondary source of earnings. Families without children gain the most from a rise in
the NMW, reflecting that they will tend to face lower METRs than families with children because
they are less likely to be in receipt of UC.
One of the main justifications for the introduction of UC is to improve the financial incentives to
work by making work pay. It is expected that, following the introduction of UC, individuals on a low
income either in work or out of work will find it more convenient to progress in work or to work at
all because they will face lower withdrawals of means-tested benefits. Although our analysis
abstracts from any behavioural change, we tried to look (in a very simple way) at how the income
distribution would change if the single parent employment rate increased by five percentage points,
and how this change would affect the Exchequer’s costs. Based on our analysis, getting more single

50 parents into work would have significant positive effects for the Exchequer, with a five percentage
point increase in the employment rate resulting in a £436 million annual saving.
There are several important limitations of this analysis that could be relaxed in further work. First,
policy uncertainties meant that the analysis has ignored council tax benefit (and its impending
reform), and ignored the phase-in and transitional protection that will initially apply to many UC
claimants. Second, the analysis has assumed full take-up of all benefits and tax credits, and has been
done on a static, no-behavioural change, basis. If universal credit does succeed in increasing take-up
rates and encourages more people to work, then the impact on incomes will be greater (more
positive) than this analysis suggests.
51
References
Adam, S. and Browne, J. (2013)., “Do the UK Government’s welfare reforms make work pay”, IFS
working paper W13/26.
Brewer, M., Browne, J. and Joyce, R. (2011), “Child and working-age poverty from 2010 to 2020”, IFS
Commentary 121.
Brewer, M., Browne, J. and Jin, W. (2011), “Universal Credit: a preliminary analysis”, IFS Briefing
Note 116.
Brewer, M., Browne, J. and Jin, W. (2012a), “Universal Credit: A Preliminary Analysis of Its Impact on
Incomes and Work Incentives”, Fiscal Studies, 33(1), 39-71.
Brewer, M., Browne, J. and Jin, W. (2012b), “Benefit Integration in the UK: An Ex Ante Analysis of
Universal Credit” in T.Callan (ed), Budget Perspectives 2013, Dublin: ESRI,
http://www.esri.ie/UserFiles/publications/RS28.pdf
Brewer, M., May, R. and Phillips, D. (2009) “Taxes, benefits and the national minimum wage”, Low
Pay Commission research paper
Callan T., C. Leventi, H. Levy, M. Matsaganis, A. Paulus and H.Sutherland, 2011, “The distributional
effects of austerity measures: a comparison of six EU countries” Research Note 2/2011 of the
European Observatory on the Social Situation and Demography, European Commission.
http://www.socialsituation.eu/WebApp/ResearchNotes.aspx
Department for Work and Pensions (2012), “Universal Credit Impact Assessment (December 2012)”,
http://www.dwp.gov.uk/docs/universal-credit-wr2011-ia.pdf
Fry, S. and F. Ritchie (2012) "Behavioural aspects of the National Minimum Wage: Measuring and
interpreting behaviour in the low-wage labour market", Report for the Low Pay Commission. (Office
for National Statistics, and University of West England and Trig Consulting.) November.
Hirsch, D. (2012) “Struggling to make ends meet: Single parents and income adequacy under
Universal Credit”, Gingerbread.
Pennycook, M. and Whittaker, M. (2012), “ Conditions Uncertain: assessing the implications of
Universal Credit in-work conditionality”, London: Resolution Foundation.
Skinner, C., N. Studdard, G. Beissel-Durrant and J. Jenkins (2002), “The Measurement of Low Pay in
the UK Labour Force Survey”, Oxford Bulletin of Economics and Statistics, No. 64 (Supplement)
Sutherland, H. and F. Figari (2013), EUROMOD: the European Union tax-benefit microsimulation
model, International Journal of Microsimulation, 6(1), 4-26.
De Agostini P. and Sutherland H. (2013) "EUROMOD Country Report, United Kingdom" Retrieved July
2013, from https://www.iser.essex.ac.uk/euromod/resources-for-euromod-users/country-reports
Tarr, A. And Finn, D. (2012), “Implementing Universal Credit: will the reforms improve the service for
users?”, London: CESI.

52
A. Appendix: Details of “difficult to model” tax and benefit reforms
Simulating future incomes in EUROMOD
1. Market incomes are updated from 2009/10 up to 2012/13 using indexes that are appropriate for
each source of income. Where data are not available for the last months of this period, the
projection uses OBR forecast assumptions about the movement in prices (CPI or RPI) or nominal
earnings for the income sources that are updated by earnings or all-items price indexes. In the case
of elements of housing costs, which are indexed by specific components of RPI for which forecasts
are not published, it is assumed that the relevant index moves according to the trend of the previous
12 months (see De Agostini and Sutherland (2013) for more detail, and Table A.3 for the sources of
indexes used).
Table A.1 – OBR forecast assumptions (December 2012 Autumn Statement) % change on a year
earlier
2012-13 2013-14 2014-15 2015-16 2016-17
RPI (Sept) 2.6 3.1 2.7 3.1 3.4
CPI (Sept) 2.2 2.6 2.2 2.0 2.0
Wages+salaries 2.6 2.2 3 3.9 4.0
OBR 2012 Economic and Fiscal outlook December 2012 Table 4.1
http://cdn.budgetresponsibility.independent.gov.uk/December-2012-Economic-and-fiscal-
outlook23423423.pdf
2. Other income components that are not simulated (some contributory and disability benefits) are
updated according to the actual increase in a main element of each benefit – all recipients are
assumed to receive the same average percentage increase.
3. Some changes (or decisions not to change) taxes and benefits have been announced for one or
more years beyond 2012/13. These known future elements of policies are simulated by EUROMOD.
Where changes are not yet known it is assumed that thresholds and amounts of payment are
indexed according to announced rules or OBR assumptions, as summarised in the tables below.
Rounding conventions have not been applied. The figures shown in Table A.1 are used to uprate the
tax-benefit component in the following fiscal year.

53
Table A.2 – OBR Indexation assumptions
Policy element Index used Rounding assumption
Income tax personal allowances RPI; CPI once personal allowance reaches £10,00030
Increase rounded up to nearest £10 per year
Income tax basic rate limit RPI; CPI from 2015-16 Increase rounded up to nearest £100 per year
Income tax starting rate limit RPI; CPI from 2015-16 Increase rounded up to nearest £10 per year
Income tax threshold for additional rate; threshold for withdrawal of personal allowances and threshold for child benefit taxation
Fixed in cash terms
Income tax higher rate threshold 1% for two years from 2014-15
NICs Primary threshold/lower profits limit
CPI Rounded to nearest £1pw/£5pa
NICs Secondary threshold RPI; CPI from 2015-16 Rounded to nearest £1pw.
NICs Upper Earnings Limit/Upper Profits limit
Aligned with income tax higher rate threshold
NICs Small earnings exception CPI Rounded to the nearest £10pa
NICs Class 2 weekly rate CPI Rounded to nearest 5p pw.
Disability benefits, Income-related benefits, Maternity benefits and Statutory Sick Pay
CPI; then 1% for three years from 2013
Basic State Pension Higher of earnings, CPI and 2.5%
Pension Credit Guarantee Credit Earnings
Pension Credit Savings Credit CPI
Child Tax Credit Family element Fixed in cash terms
Child Tax Credit Child element CPI; 1% from 2014/15 for two years
Rounded to nearest £5pa
Child Tax Credit Disabled Child elements
CPI Rounded up to nearest £5 pa
Working Tax Credit CPI; 1% from 2013/14 for three years (excluding disability elements)
Rounded up to nearest £5 pa
Working Tax Credit: max childcare costs
Fixed in cash terms
Child benefit CPI; 1% from 2014/15 for two years
Rounded up to nearest 5p pw
Source: 2012 Budget Policy Costings Annex A and HM Treasury Autumn Statement 2012 (December).
See http://cdn.hm-treasury.gov.uk/budget2012_policy_costings.pdf and
http://cdn.hm-treasury.gov.uk/autumn_statement_2012_complete.pdf
30
Calculated to happen in 2017-18 using the OBR assumptions, so ignored in this analysis

54
4. Market incomes are projected from 2012-13 to 2017-18 using the forecast assumptions shown in
Table A.1. Table A.3 summarises the index used for each type of income and expenditure used in
the policy simulations, distinguishing between the projection from 2009-10 to 2013-14 and that
from 2013-14 to 2016-17.
Table A.3 – Indexes used to project market incomes and expenditures
2009-10 to 2012-13 2012-13 to 2017-18
Earnings, self employment income
Index of average earnings OBR forecast earnings growth assumption
Income from capital CPI OBR forecast CPI assumption
Rent paid and received Rent element of RPI OBR forecast RPI assumption
Childcare costs, maintenance paid and received and other private transfers
Index of average earnings OBR forecast earnings growth assumption
Mortgage interest Mortgage interest element of RPI
OBR forecast RPI assumption
Other housing costs Rent element of RPI OBR forecast RPI assumption
Occupational and personal pension contributions
Index of average earnings OBR forecast earnings growth assumption
Personal pension income CPI OBR forecast CPI assumption
Council tax Average change in Band D tax by region
OBR forecast RPI assumption
Modelling LHA and HB
Before the reforms in 2011 to 2012, a claimant’s entitlement to LHA was based on a combination of
a claimant’s actual rent and the LHA rate that applied in their local area (specifically, LHA
entitlement = min(LHA rate, actual rent+£15)). Local LHA rates were set at the median of local rents,
separately according to the number of bedrooms, within areas known as Broad Rental Market Areas
(these are not the same as local authorities and may overlap). The End User License version of the
FRS does not contain LA identifiers (let alone BRMA identifiers), and so, in order to approximate the
local LHA rate faced by claimants, we take averages of LHA rates across standard regions. By doing
this, we are also able to model the cut in LHA rates from April 2011 that set LHA rates at the 30th
centile of local rents, rather than the 50th centile.
Increase in the female SPA
From April 2010, the age at which women become entitled to the State Pension (SPA) is rising by one
month every two months from its pre-2010 level of 60. The state pension age will then rise from 65
to 66 for both men and women between December 2018 and April 2020. This changes the
composition of the sample of people who are of “working-age”, which is clearly important when
forecasting how UC will affect the future working-age population. But it also has implications for
household incomes, as it affects receipt of several state benefits and liability to national insurance.
In our base data (FRS 2009/10) we observe women entitled to SPA from age 60, while in 2014 (our
simulated year) women will be entitled to State Pension only from age 62 (and one month).
Therefore women age 60 and 61 observed as receiving the State Pension in our base data will not be

55
entitled to it in our simulated year. These women could either be working, inactive or
receiving/entitled to some kind of income replacement benefit.
We allow for some mechanical and some simple behavioral response to the increases in the female
SPA for these affected women. First, we remove entitlement to the basic state pension, pension
credit, and other benefits payable only to those above the female SPA. Second, we predict
entitlement to IB/ESA, which are disability benefits paid only to working-age adults. We do this by
using data on women aged 58-59 in our base data to estimate a probit regression of receipt of
IB/ESA, using the following as predictors: education, region or residence, council tax band, housing
tenure, marital status, whether partner works (if present) and local authority disability status. This
regression is then used to generate predicted IB/ESA entitlement probabilities for women age 60
and 61 in our base data. Finally, we allow for a labour supply response to the rise in the female SPA
amongst the women directly affected. We do this by using data on women aged 51-65 in our base
data to estimate a regression of employment status, using the following as predictors: education,
region, housing tenure, council tax band, local authority disability status, entitlement to Disability
Living Allowance (DLA), a cubic in age and an indicator variable for being under SPA. For women in
couples we include an indicator of the partner’s employment status. We use this to predict the
probability of being in work for women 60 and 61 in our base data in a world where the SPA has
increased to 62 years. Aggregating these predicted probabilities tells us the predicted proportion of
those directly affected by the SPA change who will be in work after that change, and we then select
sufficient number of women with highest predicted probabilities of being in work when below SPA in
order to match the predicted increased employment rate. Finally, for those women aged 60-61
whom we have now simulated as being entitled to ESA/IB or being in work, we impute additional
information (each woman simulated as being entitled to IB/ESA is allocated an IB/c-ESA amount,
disability status and duration on benefit, and women simulated as being in work are allocated a
monthly income and hours of work). 31
Although relatively complicated, this procedure still embodies the following assumptions:
- People below the original SPA and those above the new SPA are not affected by the rise in
SPA: in this sense, there are no anticipation effects or dynamic effects on employment of
raising the SPA.
- Other members of the household not directly affected by the SPA increase do not change
their labour market behaviour (ie, no change in hours worked or postponed retirement).
Having simulated the additional IB/ESA entitlements and gross earnings, we can run the modified
base data through EUROMOD in the normal way.
Transition from IB to ESA
Incapacity benefit (IB) has been unavailable to new claimants since October 2008, with adults who
are unable to work through disability or ill-health having to claim employment support allowance
(ESA) instead. In simulating the population between 2010-11 and 2014-15, we need to take into
account the steady fall in the number receiving IB, and the steady rise in the number receiving ESA.
31
We do this by matching on the propensity score, where the “treatment” variable identifies people being either below SPA and the propensity score is estimated using a probit regression with the same predictors as the employment equation, other than the cubic in age.

56
We do this in a number of steps.
First, we reflect the turnover in the population on disability benefits between 2009-10 (the period of
our data) to 2010-11. The DWP tabulation tool (accessed July 2012) tells us that the number of
individuals claiming long-term IB fell by 124,000 between 2009 and 2010, and an additional 72,000
claimed ESA. We replicate this by randomly selecting some individuals receiving IB in our base data
to no longer receive it, and, from those, randomly select some to receive ESA.
Second, we take account of the fact that, between April 2011 and March 2014, existing claimants of
IB (including women age 60-61 “moved” to IB because of the SPA rise (see above)) will be reassessed
to determine whether they are entitled to ESA and, if so, which level of the benefit they are entitled
to. We assume that the rate of reassessment is constant (i.e. 25% of those on IB in 2010 are
reassessed for ESA in each year between 2011 and 2014).
Of those reassessed, we assume that 29% move into the Support Group, 34% to the Work Related
Activities Group (WRAG) and 37% are found to be fit for work and lose entitlement to disability
benefits (figures taken from
http://research.dwp.gov.uk/asd/asd1/stats_summary/stats_summary_may12.pdf ).
Third, from April 2012, contributory ESA for those in the WRAG has been limited to a maximum of
one year. We simulate this by removing entitlement from some of those we estimate to be entitled
to c-ESA.
Table A.4 below shows the end product of all these adjustments.
Table A.4 – Estimated number of ESA recipients in 2014-5
number of cases Grossed up number of cases
Total individual observed with a disability 1,358 1,289,035
ESA claims
Support Group (SG) 695 664,792
Working Related Activities Group (WRAG) 176 166,689
Total ESA successful claims (SG+WRAG) 871 831,481 Source: Authors’ calculation. A further 487 cases (457,554 grossed-up) who in the original FRS are receiving IB
are simulated to be Fit for Work under ESA in 2014.

57
B. Appendix: Comparing some results before and after housing costs
This section repeats some of the analysis, but using the after housing costs (AHC) measure of
income.
Our base dataset (FRS 2009/10) records various types of housing costs: mortgage capital, mortgage
interests, rent, service charges and other housing costs. Table B.1 shows average housing costs for
single parent families by housing tenure along the disposable income distribution under the base
current system.
Table B.1 – Average weekly housing costs for single parent families by housing tenure and net income decile groups under the base system
Owned on
mortgage
Owned outright
Rented Reduced Rented
Social Rented
Free Total
Mean 163.63 6.62 161.73 113.91 92.01 5.17 118.87
1 145.56 0.00 161.91 0.00 0.00 0.00 155.77
2 122.87 4.74 84.36 0.00 48.56 5.92 59.67
3 164.31 6.11 124.13 45.42 86.71 2.73 91.33
4 141.56 7.52 144.26 126.41 96.06 8.11 113.62
5 158.55 6.66 163.63 96.62 96.35 3.24 122.45
6 150.90 6.34 188.53 166.50 116.64 6.93 141.69
7 148.47 10.18 199.14 121.49 124.72 1.56 140.57
8 204.02 7.34 156.99 142.11 154.01 0.00 170.94
9 256.26 7.15 187.83 99.04 175.77 0.00 197.39
10 304.20 9.39 243.15 0.00 0.00 0.00 254.71
Note and Source: Authors’ own calculation on FRS and EUROMOD output.
Table B.2 shows the distribution of weekly equivalent disposable income before and after housing
costs for single parent families by housing tenure under UC. Because at the time of writing there was
still uncertainty about how mortgage interest support would be treated under UC we “switched off”
support for mortgage interest provided through Income Support in the baseline system and did not
include any support for mortgage interest in UC32. Although this assumption has almost no
consequences for our main analysis, when comparing BHC and AHC income distributions, we need to
remember that the net income of home owners on mortgage will be under-simulated because of
this assumption. Thus the negative equivalent disposable income AHC for home owner single
parents on mortgage in the lower part of the income distribution is mainly due to the fact that in our
simulation these families do not receive any support for their housing costs.
32
Other assumptions are: omission of Council Tax and Council Tax Benefit both from the baseline and the UC system, abstraction from the UC phase-in and transitional protection and full take-up assumption

58
Figure B.1 (cf blue bars in Figure 3.3) shows the effect of UC over the (base system equivalent)
income distribution AHC of working age families. It is not surprising that there are no changes from
the effects shown by Figure 3.3 BHC33.
It is, however, interesting to look at how the income distribution changes before and after housing
costs both under the base system and UC. This is shown by the various panels in Figure B.2.
Comparing the two top panels we can see how UC changes the income distribution BHC. As we
discussed above, some people gain and they shift toward the top of the income distribution, whilst
single parents, who on average lose from the introduction of UC, seem to be shifted toward the
bottom. Comparing the panels in Figure B.2 vertically, we can see how the distributions are affected
by housing costs (both for the base system and for UC system). The top parts of the income
distributions are almost unaffected, while, as expected, housing costs play an important rule for
those families at the bottom of the income distribution. Finally, comparing the two bottom panels of
Figure B.2, we can see how AHC income distribution is affected under the base system and under
UC. The main differences are in the bottom-middle part of the income distribution where single
adults move up, while families with children (single parents and couples) seem to move down on
average.
As we saw in Section 3.2, on average single parents will not gain from the introduction of UC. Not
surprisingly, Figure B.2 shows a similar picture. However, as housing costs vary by housing tenure, it
would be interesting to look at these results by housing tenure once more details are available about
the treatment of mortgage interest support provided by UC.
33
This is because we look at the differences in equivalent family income between base and UC system before and after housing costs over the base system equivalent income distribution. In other words, we are taking the following differences: dpiUC_bhc-dpi_bhc which is the same than dpiUC_ahc-dpi_ahc because the addends are both decreases by the same amount: the housing costs.

59
Table B.2 – Distribution of equivalent disposable income under UC for single parent families by housing tenure, BHC and AHC
Before Housing Costs
Owned on
mortgage
Owned outright
Rented Reduced Rented
Social Rented
Free Total
mean 289.61 243.76 261.28 285.13 205.71 191.07 244.09
p5 119.64 119.64 147.91 169.62 126.06 16.79 119.64
p10 147.83 119.64 177.5 198.5 150.24 112.57 148.58
p25 217.05 145.65 197.41 212.17 169.2 140.82 179.91
p50 268.11 226.35 246.11 250.49 194.47 185.76 225.08
p75 328.18 296.99 296.15 318.91 239.35 234.31 280.51
p90 416.86 360.38 358.73 481.4 280.51 275.96 347.44
p95 542.26 494.34 424.29 548.58 306.27 357.4 407.67
After Housing Costs
Owned on
mortgage
Owned outright
Rented Reduced Rented
Social Rented
Free Total
mean 183.86 239.39 153.67 206.59 145.33 187.82 166.12
p5 -1 115.89 47.69 114.52 80.24 15.3 55.75
p10 49.06 119.64 75.25 116.03 94.86 104.14 82.59
p25 119.62 141.44 101.46 133.59 110.72 135.79 113.28
p50 184.23 219.24 136.65 171.73 138.21 179.33 152.2
p75 235.06 290.89 182.06 225.7 173.9 230.77 202.77
p90 306.42 360.38 245.93 404.7 213.18 270.44 266.41
p95 365.88 489.31 297.25 452.18 238.43 357.4 316.9 Note and Source: Authors’ own calculation on FRS and EUROMOD output.

60
Figure B.1 - Change (£) in equivalent family income of working-age population after the introduction of UC (same as Figure 3.8)
Notes and Sources: as for Figure 3.1
-50
51
01
5
Wee
kly
cha
ng
e in
net e
q fa
mily
inco
me b
y d
ecile
gro
up
1 2 3 4 5 6 7 8 9 10

61
Figure B.2 – Equivalent disposable income distribution among the working-age families. Base and UC system, BHC and AHC, by family type
02
04
06
08
0
Pro
po
rtio
n o
f fa
mili
es in e
ach d
ecile
gro
up
1 2 3 4 5 6 7 8 9 10
weighted data; base system BHC
single adult couple without children couple with children
single parent couple w/o children, one age SPA
02
04
06
08
0
Pro
po
rtio
n o
f fa
mili
es in e
ach d
ecile
gro
up
1 2 3 4 5 6 7 8 9 10
weighted data; UC system BHC
single adult couple without children couple with children
single parent couple w/o children, one age SPA
02
04
06
08
0
Pro
po
rtio
n o
f fa
mili
es in e
ach d
ecile
gro
up
1 2 3 4 5 6 7 8 9 10
weighted data; base system AHC
single adult couple without children couple with children
single parent couple w/o children, one age SPA
02
04
06
08
0
Pro
po
rtio
n o
f fa
mili
es in e
ach d
ecile
gro
up
1 2 3 4 5 6 7 8 9 10
weighted data; UC system AHC
single adult couple without children couple with children
single parent couple w/o children, one age SPA

62
C. Appendix: Extra tables and figures

63
Figure C.1 – Mean PTR decomposition by income source for all family types under base system
A) all family types –10hrs B) all family types – 20hrs
C) all family types –30hrs D) all family types –40hrs
Notes and Sources: as for Table 3.1.
02
04
06
0
PT
R (
%)
singles couples no kids couples with kids single parents
Benefits Tax NIC
02
04
06
0
PT
R (
%)
singles couples no kids couples with kids single parents
Benefits Tax NIC
01
02
03
04
05
0
PT
R (
%)
singles couples no kids couples with kids single parents
Benefits Tax NIC
01
02
03
04
05
0
PT
R (
%)
singles couples no kids couples with kids single parents
Benefits Tax NIC

64
Figure C.2 – Mean PTR decomposition by income source for single parents by decile of equivalent disposable income – base system
A) Single parents –10hrs B) Single parents – 20hrs
C) Single parents –30hrs D) Single parents –40hrs
Notes and Sources: as for Table 3.1
02
04
06
0
PT
R (
%)
1 2 3 4 5 6 7 8 9
Benefits Tax NIC
02
04
06
0
PT
R (
%)
1 2 3 4 5 6 7 8 9
Benefits Tax NIC
02
04
06
0
PT
R (
%)
1 2 3 4 5 6 7 8 9
Benefits Tax NIC
02
04
06
0
PT
R (
%)
1 2 3 4 5 6 7 8 9
Benefits Tax NIC

65
Figure C.3 – Cumulative distribution of METRs for working single parents at NMW under various scenarios
Notes and Sources: as for Table 3.1
Figure C.4 – Cumulative METRs distribution for single parents earning above NMW under various scenarios
Notes and Sources: as for Table 3.1
02
04
06
08
01
00
Marg
inal E
ffectice T
ax R
ate
(M
ET
R)
- %
0 20 40 60 80 100Cumulative frequency (%)
baseline UC base UC reduced taper
UC increased std all. UC increased disregards UC increased tax all.
UC increased child care
02
04
06
08
01
00
Marg
inal E
ffectice T
ax R
ate
(M
ET
R)
- %
0 20 40 60 80 100Cumulative frequency (%)
baseline UC base UC reduced taper UC increased std all.
UC increased disregards UC increased tax all. UC increased child care