Embed Size (px)
Citation preview
Migration of population of
Armenia: Economic factors
Hrant Mikaelyan
© 2015 Caucasus Institute, Yerevan
March 2015
www.c-i.am
Caucasus Institute, March 2015
MIGRATION OF POPULATION OF ARMENIA: ECONOMIC FACTORS
Pag
e 1
Caucasus Institute. Yerevan, December 2015
Author: Hrant Mikaelyan, Researcher at the Caucasus Institute
Editors: Nina Iskandaryan, Sergey Minasyan
According to academic and social narratives, there are different reasons
inducing migration, including political, economic, social and cultural factors.
However, the timeline of biggest migration waves shows that the very economic
factors mostly affect migration; increase of migration figures is detected during the
periods of economic crises. This study will examine the interdependence between
the economic factors and migration.
MIGRATION OF POPULATION OF ARMENIA: ECONOMIC FACTORS
Migration and Macroeconomics ................................................................................................. 4
Specific economic factors, influencing Armenia's migration ................................................. 14
Does income inequality influence emigration? ....................................................................... 19
Conclusion .................................................................................................................................. 21
P
age 2
List of Tables and Figures
Table 1. Correlation of Household Final Consumption Expenditure per capita
with Net Migration Rate, 1991-2014 ................................................................................ 5
Figure 1. Pixel chart, showing Final Consumption expenditure and Net
Migration Rate, with linear trend ....................................................................................... 6
Figure 2. Pixel chart, showing Final Consumption expenditure 3-year mean
growth and Net Migration Rate, with linear trend ...................................................... 6
Table 2. Correlation of Household Final Consumption Expenditure per capita
with Net Migration Rate, 1991-2014 ................................................................................ 7
Figure 3. Pixel chart, showing 3-year combined GDP per capita growth rate
(with highest weight of current year) and NMR, with linear trend ...................... 8
Figure 4. Migration exchange between Armenia and Russia in 2001-2014 .... 12
Table 3. Socio-Economic pushing and pulling factors from the point of view of
Armenian migrant citizens ................................................................................................ 14
Figure 5. Wage dynamics in Armenia ............................................................................. 16
Table 4. The most preferred methods of overcoming obstacles to create a
family according to the opinion of the Armenian youth from 16 to 30 years
(2012) ......................................................................................................................................... 16
Figure 6. Emigrational sentiment of the Armenian youth (in percentage of the
respective age group) ........................................................................................................... 17
Table 5. Value-conscious commitment on income equality in some FSU
countries .................................................................................................................................... 19
MIGRATION OF POPULATION OF ARMENIA: ECONOMIC FACTORS
Pag
e 3
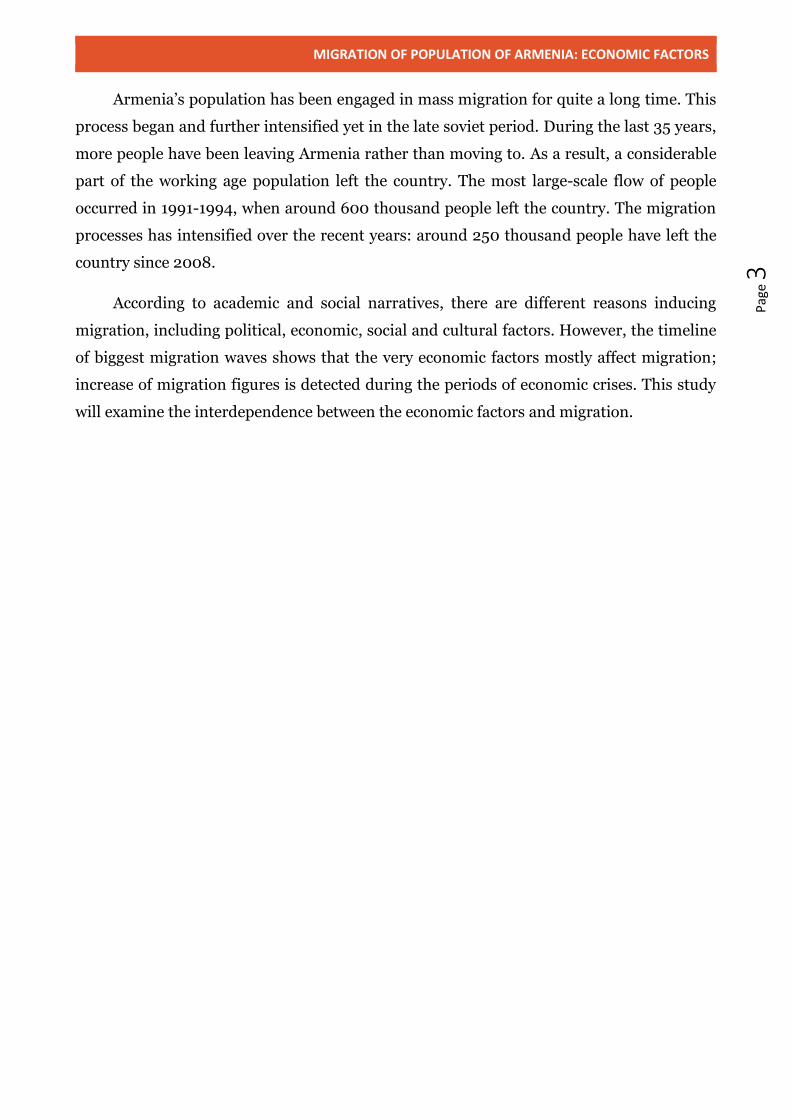
Armenia’s population has been engaged in mass migration for quite a long time. This
process began and further intensified yet in the late soviet period. During the last 35 years,
more people have been leaving Armenia rather than moving to. As a result, a considerable
part of the working age population left the country. The most large-scale flow of people
occurred in 1991-1994, when around 600 thousand people left the country. The migration
processes has intensified over the recent years: around 250 thousand people have left the
country since 2008.
According to academic and social narratives, there are different reasons inducing
migration, including political, economic, social and cultural factors. However, the timeline
of biggest migration waves shows that the very economic factors mostly affect migration;
increase of migration figures is detected during the periods of economic crises. This study
will examine the interdependence between the economic factors and migration.
P
age 4
Migration and Macroeconomics
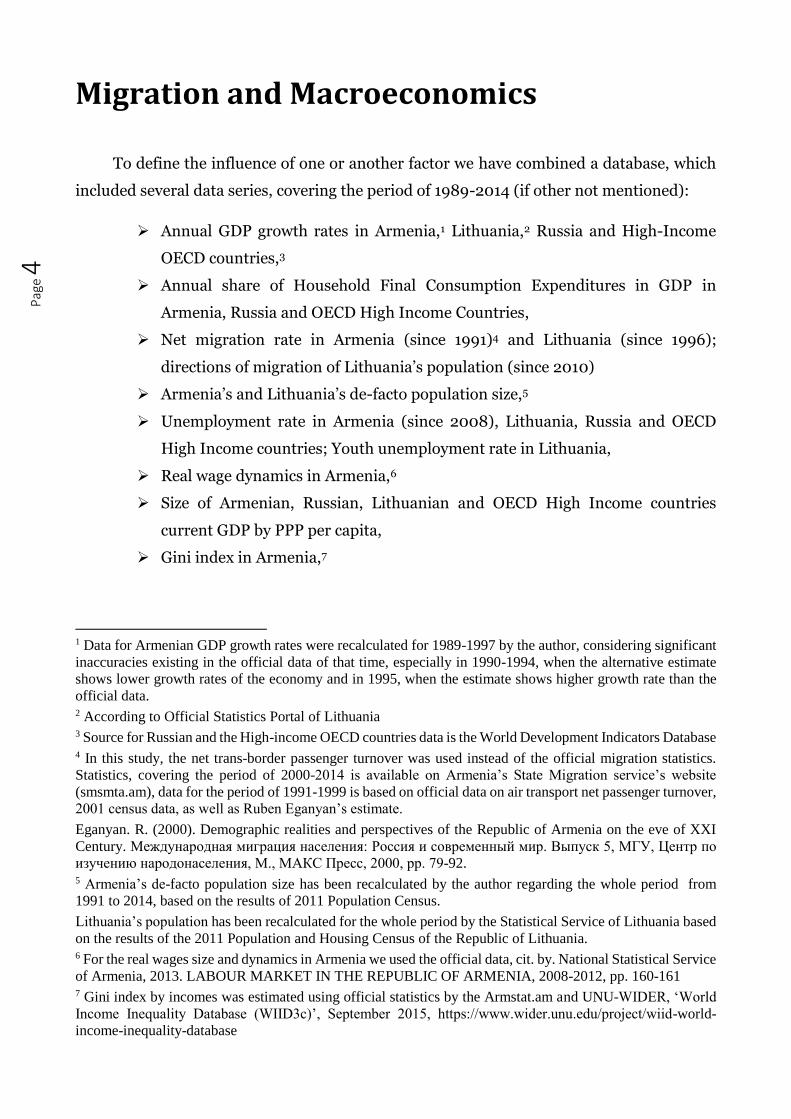
To define the influence of one or another factor we have combined a database, which
included several data series, covering the period of 1989-2014 (if other not mentioned):
Annual GDP growth rates in Armenia,1 Lithuania,2 Russia and High-Income
OECD countries,3
Annual share of Household Final Consumption Expenditures in GDP in
Armenia, Russia and OECD High Income Countries,
Net migration rate in Armenia (since 1991)4 and Lithuania (since 1996);
directions of migration of Lithuania’s population (since 2010)
Armenia’s and Lithuania’s de-facto population size,5
Unemployment rate in Armenia (since 2008), Lithuania, Russia and OECD
High Income countries; Youth unemployment rate in Lithuania,
Real wage dynamics in Armenia,6
Size of Armenian, Russian, Lithuanian and OECD High Income countries
current GDP by PPP per capita,
Gini index in Armenia,7
1 Data for Armenian GDP growth rates were recalculated for 1989-1997 by the author, considering significant
inaccuracies existing in the official data of that time, especially in 1990-1994, when the alternative estimate
shows lower growth rates of the economy and in 1995, when the estimate shows higher growth rate than the
official data. 2 According to Official Statistics Portal of Lithuania 3 Source for Russian and the High-income OECD countries data is the World Development Indicators Database 4 In this study, the net trans-border passenger turnover was used instead of the official migration statistics.
Statistics, covering the period of 2000-2014 is available on Armenia’s State Migration service’s website
(smsmta.am), data for the period of 1991-1999 is based on official data on air transport net passenger turnover,
2001 census data, as well as Ruben Eganyan’s estimate.
Eganyan. R. (2000). Demographic realities and perspectives of the Republic of Armenia on the eve of XXI
Century. Международная миграция населения: Россия и современный мир. Выпуск 5, МГУ, Центр по
изучению народонаселения, М., МАКС Пресс, 2000, pp. 79-92. 5 Armenia’s de-facto population size has been recalculated by the author regarding the whole period from
1991 to 2014, based on the results of 2011 Population Census.
Lithuania’s population has been recalculated for the whole period by the Statistical Service of Lithuania based
on the results of the 2011 Population and Housing Census of the Republic of Lithuania. 6 For the real wages size and dynamics in Armenia we used the official data, cit. by. National Statistical Service
of Armenia, 2013. LABOUR MARKET IN THE REPUBLIC OF ARMENIA, 2008-2012, pp. 160-161 7 Gini index by incomes was estimated using official statistics by the Armstat.am and UNU-WIDER, ‘World
Income Inequality Database (WIID3c)’, September 2015, https://www.wider.unu.edu/project/wiid-world-
income-inequality-database
MIGRATION OF POPULATION OF ARMENIA: ECONOMIC FACTORS
Pag
e 5
Under 2.5$PPP (2005 prices) Poverty rate in Armenia,8
Consumer price index in Armenia.9
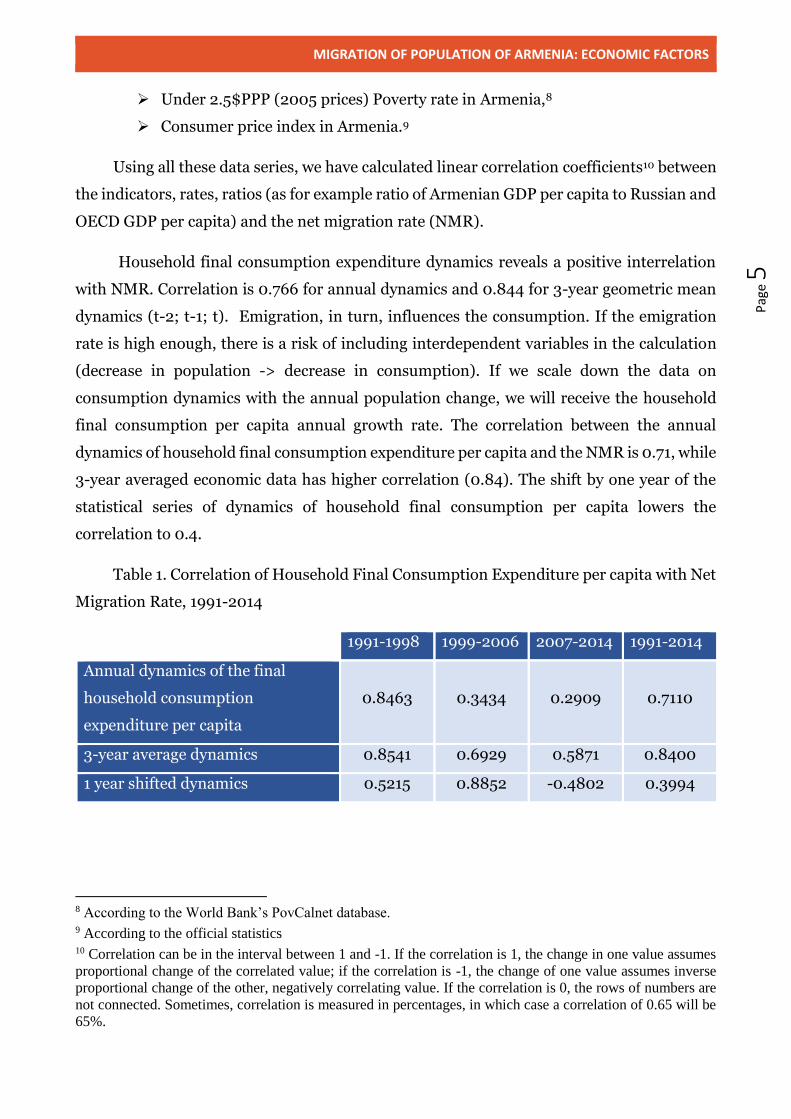
Using all these data series, we have calculated linear correlation coefficients10 between
the indicators, rates, ratios (as for example ratio of Armenian GDP per capita to Russian and
OECD GDP per capita) and the net migration rate (NMR).
Household final consumption expenditure dynamics reveals a positive interrelation
with NMR. Correlation is 0.766 for annual dynamics and 0.844 for 3-year geometric mean
dynamics (t-2; t-1; t). Emigration, in turn, influences the consumption. If the emigration
rate is high enough, there is a risk of including interdependent variables in the calculation
(decrease in population -> decrease in consumption). If we scale down the data on
consumption dynamics with the annual population change, we will receive the household
final consumption per capita annual growth rate. The correlation between the annual
dynamics of household final consumption expenditure per capita and the NMR is 0.71, while
3-year averaged economic data has higher correlation (0.84). The shift by one year of the
statistical series of dynamics of household final consumption per capita lowers the
correlation to 0.4.
Table 1. Correlation of Household Final Consumption Expenditure per capita with Net
Migration Rate, 1991-2014
1991-1998 1999-2006 2007-2014 1991-2014
Annual dynamics of the final
household consumption
expenditure per capita
0.8463 0.3434 0.2909 0.7110
3-year average dynamics 0.8541 0.6929 0.5871 0.8400
1 year shifted dynamics 0.5215 0.8852 -0.4802 0.3994
8 According to the World Bank’s PovCalnet database. 9 According to the official statistics 10 Correlation can be in the interval between 1 and -1. If the correlation is 1, the change in one value assumes
proportional change of the correlated value; if the correlation is -1, the change of one value assumes inverse
proportional change of the other, negatively correlating value. If the correlation is 0, the rows of numbers are
not connected. Sometimes, correlation is measured in percentages, in which case a correlation of 0.65 will be
65%.
P
age 6
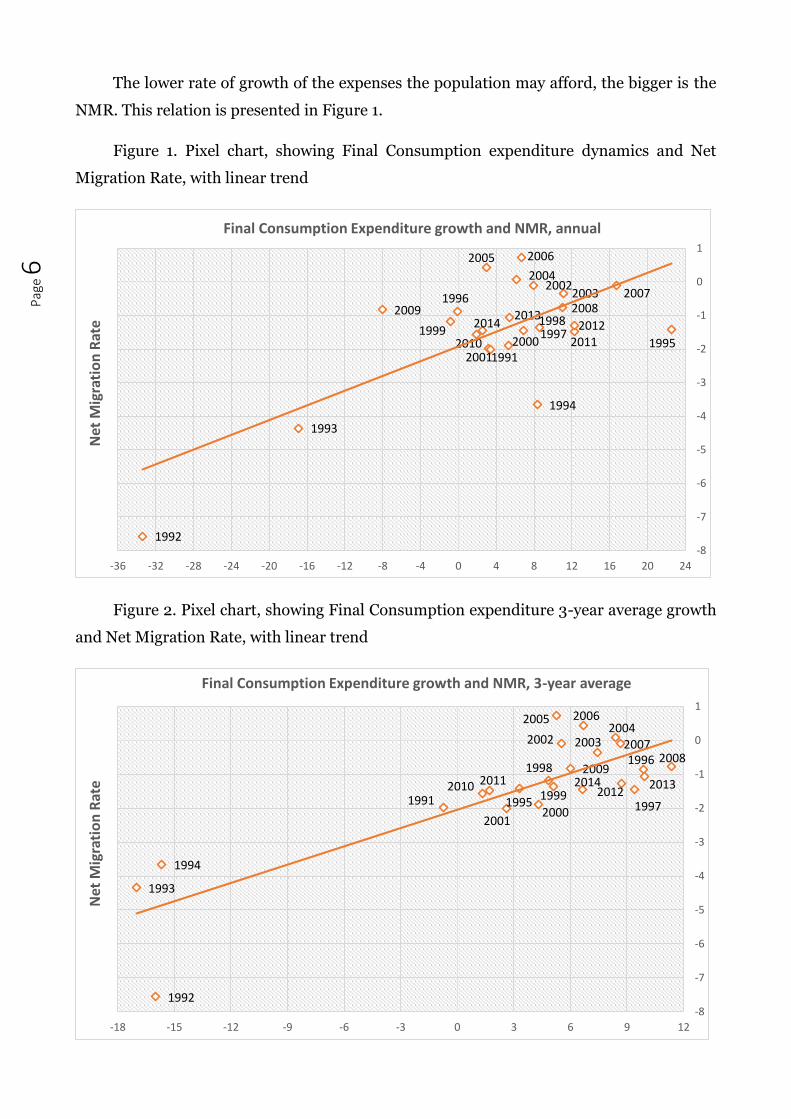
The lower rate of growth of the expenses the population may afford, the bigger is the
NMR. This relation is presented in Figure 1.
Figure 1. Pixel chart, showing Final Consumption expenditure dynamics and Net
Migration Rate, with linear trend
Figure 2. Pixel chart, showing Final Consumption expenditure 3-year average growth
and Net Migration Rate, with linear trend
1991
1992
1993
1994
1995
1996
19971998
19992000
2001
20022003
2004
2005 2006
200720082009
2010 20112012
20132014
-8
-7
-6
-5
-4
-3
-2
-1
0
1
-36 -32 -28 -24 -20 -16 -12 -8 -4 0 4 8 12 16 20 24
Net
Mig
rati
on
Rat
e
Final Consumption Expenditure growth and NMR, annual
1991
1992
1993
1994
1995
1996
1997
1998
1999
20002001
2002 20032004
2005 2006
20072008
2009
2010 20112012
20132014
-8
-7
-6
-5
-4
-3
-2
-1
0
1
-18 -15 -12 -9 -6 -3 0 3 6 9 12
Net
Mig
rati
on
Rat
e
Final Consumption Expenditure growth and NMR, 3-year average
MIGRATION OF POPULATION OF ARMENIA: ECONOMIC FACTORS
Pag
e 7
As it can be seen on the Figure 2, the deviations from the trend are much less than on
Figure 1, while when considering annual statistics, there are many cases, which mismatch
the trend.
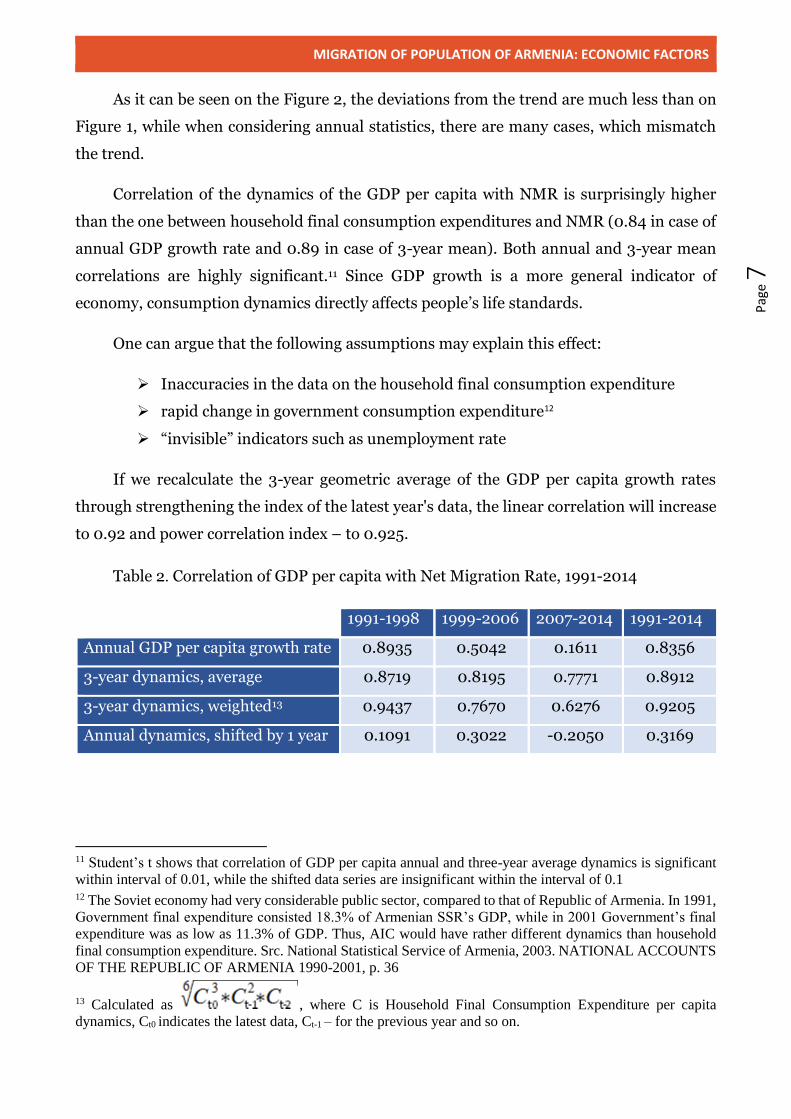
Correlation of the dynamics of the GDP per capita with NMR is surprisingly higher
than the one between household final consumption expenditures and NMR (0.84 in case of
annual GDP growth rate and 0.89 in case of 3-year mean). Both annual and 3-year mean
correlations are highly significant.11 Since GDP growth is a more general indicator of
economy, consumption dynamics directly affects people’s life standards.
One can argue that the following assumptions may explain this effect:
Inaccuracies in the data on the household final consumption expenditure
rapid change in government consumption expenditure12
“invisible” indicators such as unemployment rate
If we recalculate the 3-year geometric average of the GDP per capita growth rates
through strengthening the index of the latest year's data, the linear correlation will increase
to 0.92 and power correlation index – to 0.925.
Table 2. Correlation of GDP per capita with Net Migration Rate, 1991-2014
1991-1998 1999-2006 2007-2014 1991-2014
Annual GDP per capita growth rate 0.8935 0.5042 0.1611 0.8356
3-year dynamics, average 0.8719 0.8195 0.7771 0.8912
3-year dynamics, weighted13 0.9437 0.7670 0.6276 0.9205
Annual dynamics, shifted by 1 year 0.1091 0.3022 -0.2050 0.3169
11 Student’s t shows that correlation of GDP per capita annual and three-year average dynamics is significant
within interval of 0.01, while the shifted data series are insignificant within the interval of 0.1 12 The Soviet economy had very considerable public sector, compared to that of Republic of Armenia. In 1991,
Government final expenditure consisted 18.3% of Armenian SSR’s GDP, while in 2001 Government’s final
expenditure was as low as 11.3% of GDP. Thus, AIC would have rather different dynamics than household
final consumption expenditure. Src. National Statistical Service of Armenia, 2003. NATIONAL ACCOUNTS
OF THE REPUBLIC OF ARMENIA 1990-2001, p. 36
13 Calculated as , where C is Household Final Consumption Expenditure per capita
dynamics, Ct0 indicates the latest data, Ct-1 – for the previous year and so on.
P
age 8
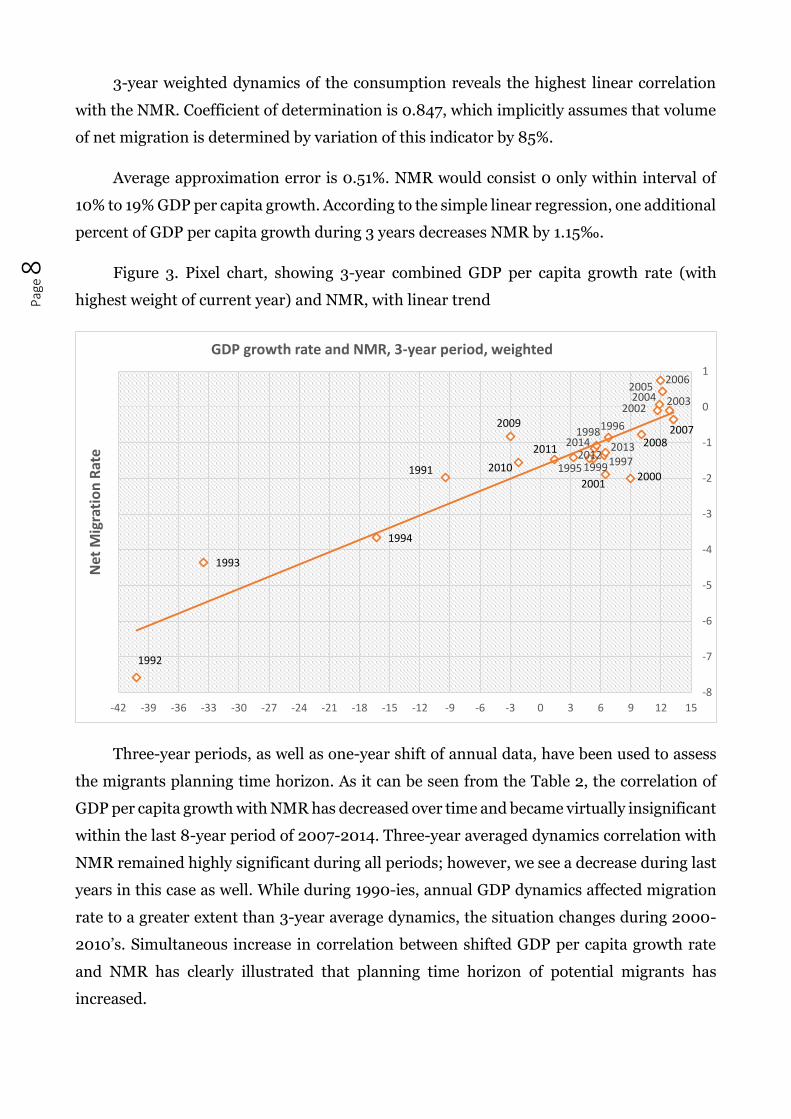
3-year weighted dynamics of the consumption reveals the highest linear correlation
with the NMR. Coefficient of determination is 0.847, which implicitly assumes that volume
of net migration is determined by variation of this indicator by 85%.
Average approximation error is 0.51%. NMR would consist 0 only within interval of
10% to 19% GDP per capita growth. According to the simple linear regression, one additional
percent of GDP per capita growth during 3 years decreases NMR by 1.15‰.
Figure 3. Pixel chart, showing 3-year combined GDP per capita growth rate (with
highest weight of current year) and NMR, with linear trend
Three-year periods, as well as one-year shift of annual data, have been used to assess
the migrants planning time horizon. As it can be seen from the Table 2, the correlation of
GDP per capita growth with NMR has decreased over time and became virtually insignificant
within the last 8-year period of 2007-2014. Three-year averaged dynamics correlation with
NMR remained highly significant during all periods; however, we see a decrease during last
years in this case as well. While during 1990-ies, annual GDP dynamics affected migration
rate to a greater extent than 3-year average dynamics, the situation changes during 2000-
2010’s. Simultaneous increase in correlation between shifted GDP per capita growth rate
and NMR has clearly illustrated that planning time horizon of potential migrants has
increased.
1991
1992
1993
1994
1995
1996
1997
1998
19992000
2001
200220032004
20052006
20072008
2009
2010
2011 201220132014
-8
-7
-6
-5
-4
-3
-2
-1
0
1
-42 -39 -36 -33 -30 -27 -24 -21 -18 -15 -12 -9 -6 -3 0 3 6 9 12 15
Net
Mig
rati
on
Rat
e
GDP growth rate and NMR, 3-year period, weighted
MIGRATION OF POPULATION OF ARMENIA: ECONOMIC FACTORS
Pag
e 9
In 1991-98, the decisions to migrate were almost directly connected to the economic
situation of that time. In the following periods, the economic factors remained dominant as
well. However, there has been an increase in planning time horizon, while the overall
importance of economic factors has slightly decreased.
There is a need of an additional research to clarify why the planning period of migration
decision-making has gradually increased over time. We can make several hypothesis
regarding the reasons, as following:
Potential migrants' household savings have increased due to the economic
growth during the last decades. This, in turn, prolongs the planning horizon;
Interference of socio-demographic factors, e.g. increase in number of the labor
migrants, who are mostly young or mid-age males, which leads to the higher
misbalance of sexes, in addition to already existing one14, causing the
migration of young women in the following years;
Intervention of external factors like the Global economic crisis, which has
affected the economy of Armenia and the migration recipient countries in
different ways;
Increase of importance of the pulling factors in Armenian emigration, which yet
affects the timeframes of migration but not the decision itself;
The emergence of the snowball, which involves new people into the process of
migration after the economic changes took effect. They follow their relatives
who have already emigrated.
Economic dynamics affects how Armenians assess their future in Armenia,
influencing the socio-political narratives. Ultimately, the economic dynamics
indirectly affects migration rate after a while.
The intervention of occasional factors;
Other factors, which are not mentioned in the list.
The analysis of statistical results of the research indicates that the migrants make a
decision based primarily on the economic dynamics in Armenia. Per capita income remains
and is likely to remain several times lower than in High-income countries, or Russia, but
14 In 2015, women composed 53.6% of Armenia’s population, making Armenia fourth in the world by
misbalance of sexes after Latvia, Lithuania and Ukraine.
Source: World Bank “Health Nutrition and Population Statistics: Population estimates and projections”
Database
P
age 1
0
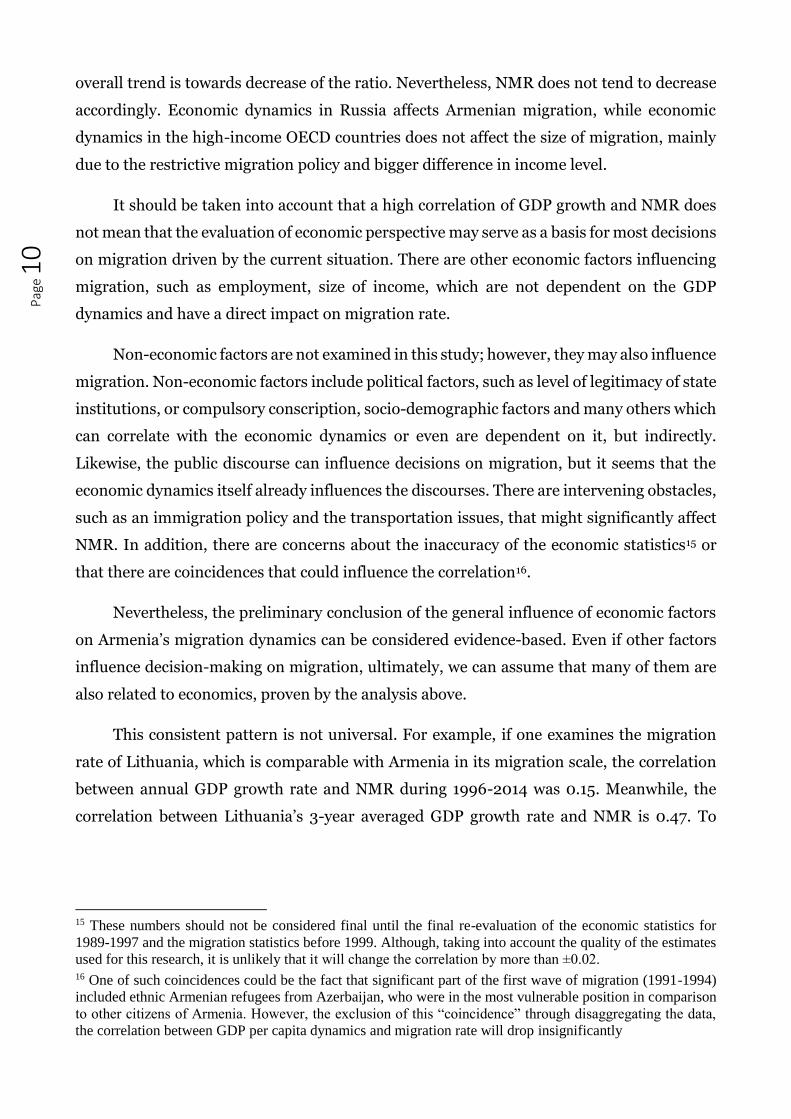
overall trend is towards decrease of the ratio. Nevertheless, NMR does not tend to decrease
accordingly. Economic dynamics in Russia affects Armenian migration, while economic
dynamics in the high-income OECD countries does not affect the size of migration, mainly
due to the restrictive migration policy and bigger difference in income level.
It should be taken into account that a high correlation of GDP growth and NMR does
not mean that the evaluation of economic perspective may serve as a basis for most decisions
on migration driven by the current situation. There are other economic factors influencing
migration, such as employment, size of income, which are not dependent on the GDP
dynamics and have a direct impact on migration rate.
Non-economic factors are not examined in this study; however, they may also influence
migration. Non-economic factors include political factors, such as level of legitimacy of state
institutions, or compulsory conscription, socio-demographic factors and many others which
can correlate with the economic dynamics or even are dependent on it, but indirectly.
Likewise, the public discourse can influence decisions on migration, but it seems that the
economic dynamics itself already influences the discourses. There are intervening obstacles,
such as an immigration policy and the transportation issues, that might significantly affect
NMR. In addition, there are concerns about the inaccuracy of the economic statistics15 or
that there are coincidences that could influence the correlation16.
Nevertheless, the preliminary conclusion of the general influence of economic factors
on Armenia’s migration dynamics can be considered evidence-based. Even if other factors
influence decision-making on migration, ultimately, we can assume that many of them are
also related to economics, proven by the analysis above.
This consistent pattern is not universal. For example, if one examines the migration
rate of Lithuania, which is comparable with Armenia in its migration scale, the correlation
between annual GDP growth rate and NMR during 1996-2014 was 0.15. Meanwhile, the
correlation between Lithuania’s 3-year averaged GDP growth rate and NMR is 0.47. To
15 These numbers should not be considered final until the final re-evaluation of the economic statistics for
1989-1997 and the migration statistics before 1999. Although, taking into account the quality of the estimates
used for this research, it is unlikely that it will change the correlation by more than ±0.02. 16 One of such coincidences could be the fact that significant part of the first wave of migration (1991-1994)
included ethnic Armenian refugees from Azerbaijan, who were in the most vulnerable position in comparison
to other citizens of Armenia. However, the exclusion of this “coincidence” through disaggregating the data,
the correlation between GDP per capita dynamics and migration rate will drop insignificantly
MIGRATION OF POPULATION OF ARMENIA: ECONOMIC FACTORS
Pag
e 1
1
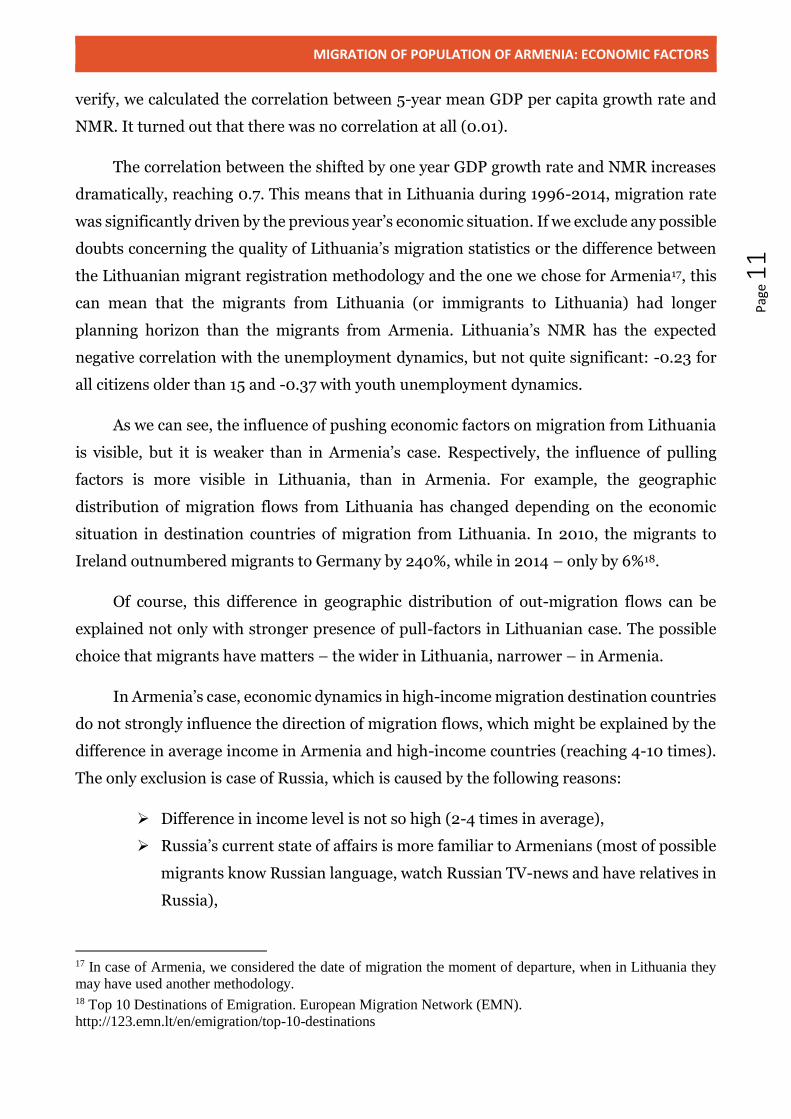
verify, we calculated the correlation between 5-year mean GDP per capita growth rate and
NMR. It turned out that there was no correlation at all (0.01).
The correlation between the shifted by one year GDP growth rate and NMR increases
dramatically, reaching 0.7. This means that in Lithuania during 1996-2014, migration rate
was significantly driven by the previous year’s economic situation. If we exclude any possible
doubts concerning the quality of Lithuania’s migration statistics or the difference between
the Lithuanian migrant registration methodology and the one we chose for Armenia17, this
can mean that the migrants from Lithuania (or immigrants to Lithuania) had longer
planning horizon than the migrants from Armenia. Lithuania’s NMR has the expected
negative correlation with the unemployment dynamics, but not quite significant: -0.23 for
all citizens older than 15 and -0.37 with youth unemployment dynamics.
As we can see, the influence of pushing economic factors on migration from Lithuania
is visible, but it is weaker than in Armenia’s case. Respectively, the influence of pulling
factors is more visible in Lithuania, than in Armenia. For example, the geographic
distribution of migration flows from Lithuania has changed depending on the economic
situation in destination countries of migration from Lithuania. In 2010, the migrants to
Ireland outnumbered migrants to Germany by 240%, while in 2014 – only by 6%18.
Of course, this difference in geographic distribution of out-migration flows can be
explained not only with stronger presence of pull-factors in Lithuanian case. The possible
choice that migrants have matters – the wider in Lithuania, narrower – in Armenia.
In Armenia’s case, economic dynamics in high-income migration destination countries
do not strongly influence the direction of migration flows, which might be explained by the
difference in average income in Armenia and high-income countries (reaching 4-10 times).
The only exclusion is case of Russia, which is caused by the following reasons:
Difference in income level is not so high (2-4 times in average),
Russia’s current state of affairs is more familiar to Armenians (most of possible
migrants know Russian language, watch Russian TV-news and have relatives in
Russia),
17 In case of Armenia, we considered the date of migration the moment of departure, when in Lithuania they
may have used another methodology. 18 Top 10 Destinations of Emigration. European Migration Network (EMN).
http://123.emn.lt/en/emigration/top-10-destinations
P
age 1
2
Geographic closeness and easiness to travel (migrants are more flexible with
reacting on Russian economic dynamics).
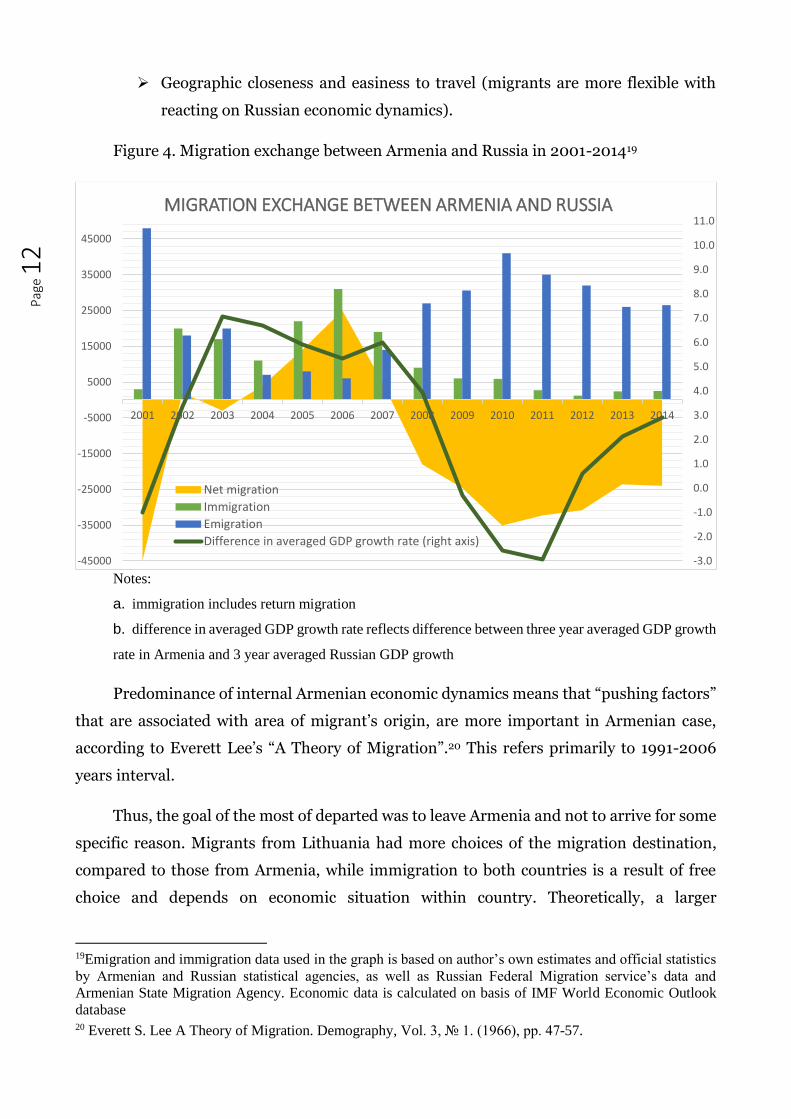
Figure 4. Migration exchange between Armenia and Russia in 2001-201419
Notes:
a. immigration includes return migration
b. difference in averaged GDP growth rate reflects difference between three year averaged GDP growth
rate in Armenia and 3 year averaged Russian GDP growth
Predominance of internal Armenian economic dynamics means that “pushing factors”
that are associated with area of migrant’s origin, are more important in Armenian case,
according to Everett Lee’s “A Theory of Migration”.20 This refers primarily to 1991-2006
years interval.
Thus, the goal of the most of departed was to leave Armenia and not to arrive for some
specific reason. Migrants from Lithuania had more choices of the migration destination,
compared to those from Armenia, while immigration to both countries is a result of free
choice and depends on economic situation within country. Theoretically, a larger
19Emigration and immigration data used in the graph is based on author’s own estimates and official statistics
by Armenian and Russian statistical agencies, as well as Russian Federal Migration service’s data and
Armenian State Migration Agency. Economic data is calculated on basis of IMF World Economic Outlook
database 20 Everett S. Lee A Theory of Migration. Demography, Vol. 3, № 1. (1966), pp. 47-57.
-3.0
-2.0
-1.0
0.0
1.0
2.0
3.0
4.0
5.0
6.0
7.0
8.0
9.0
10.0
11.0
-45000
-35000
-25000
-15000
-5000
5000
15000
25000
35000
45000
2001 2002 2003 2004 2005 2006 2007 2008 2009 2010 2011 2012 2013 2014
MIGRATION EXCHANGE BETWEEN ARMENIA AND RUSSIA
Net migration
Immigration
Emigration
Difference in averaged GDP growth rate (right axis)

MIGRATION OF POPULATION OF ARMENIA: ECONOMIC FACTORS
Pag
e 1
3
significance of pull factors in case of migrants from Lithuania can mean a higher level of
qualification of an average Lithuanian migrant, but such a conclusion needs additional
research, which goes out of the framework of this work.
P
age 1
4
Specific economic factors, influencing
Armenia's migration
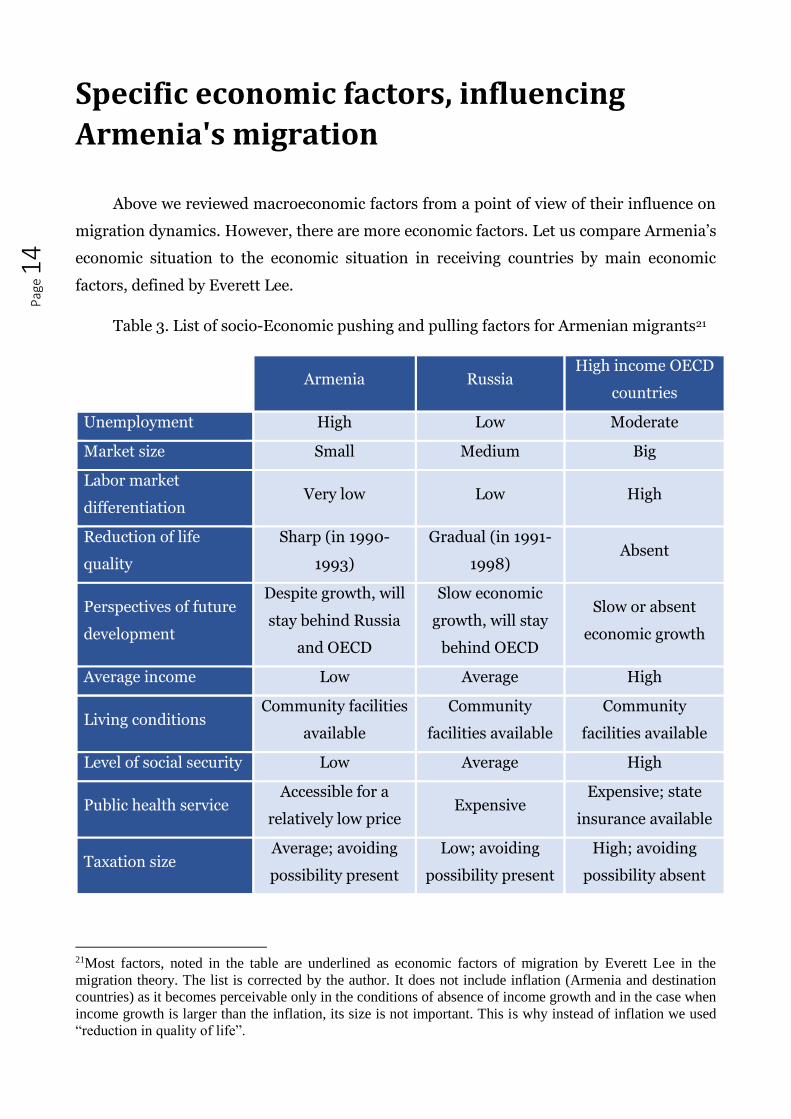
Above we reviewed macroeconomic factors from a point of view of their influence on
migration dynamics. However, there are more economic factors. Let us compare Armenia’s
economic situation to the economic situation in receiving countries by main economic
factors, defined by Everett Lee.
Table 3. List of socio-Economic pushing and pulling factors for Armenian migrants21
Armenia Russia High income OECD
countries
Unemployment High Low Moderate
Market size Small Medium Big
Labor market
differentiation Very low Low High
Reduction of life
quality
Sharp (in 1990-
1993)
Gradual (in 1991-
1998) Absent
Perspectives of future
development
Despite growth, will
stay behind Russia
and OECD
Slow economic
growth, will stay
behind OECD
Slow or absent
economic growth
Average income Low Average High
Living conditions Community facilities
available
Community
facilities available
Community
facilities available
Level of social security Low Average High
Public health service Accessible for a
relatively low price Expensive
Expensive; state
insurance available
Taxation size Average; avoiding
possibility present
Low; avoiding
possibility present
High; avoiding
possibility absent
21Most factors, noted in the table are underlined as economic factors of migration by Everett Lee in the
migration theory. The list is corrected by the author. It does not include inflation (Armenia and destination
countries) as it becomes perceivable only in the conditions of absence of income growth and in the case when
income growth is larger than the inflation, its size is not important. This is why instead of inflation we used
“reduction in quality of life”.
MIGRATION OF POPULATION OF ARMENIA: ECONOMIC FACTORS
Pag
e 1
5
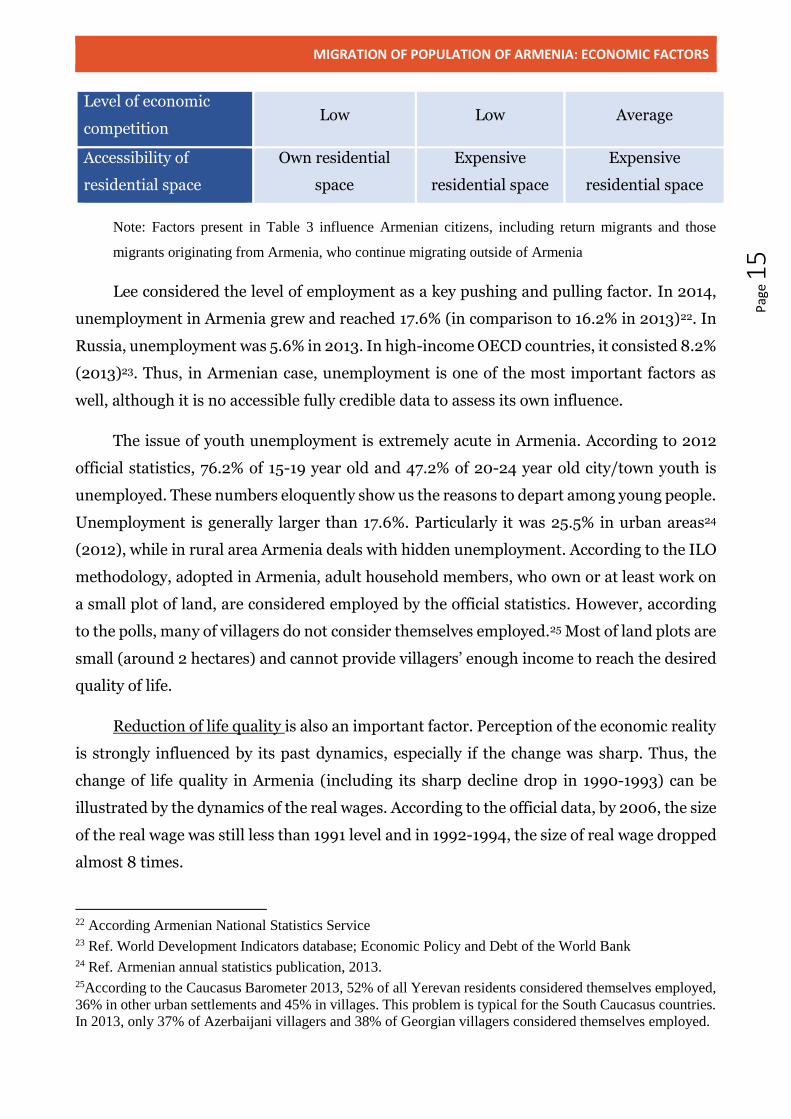
Level of economic
competition Low Low Average
Accessibility of
residential space
Own residential
space
Expensive
residential space
Expensive
residential space
Note: Factors present in Table 3 influence Armenian citizens, including return migrants and those
migrants originating from Armenia, who continue migrating outside of Armenia
Lee considered the level of employment as a key pushing and pulling factor. In 2014,
unemployment in Armenia grew and reached 17.6% (in comparison to 16.2% in 2013)22. In
Russia, unemployment was 5.6% in 2013. In high-income OECD countries, it consisted 8.2%
(2013)23. Thus, in Armenian case, unemployment is one of the most important factors as
well, although it is no accessible fully credible data to assess its own influence.
The issue of youth unemployment is extremely acute in Armenia. According to 2012
official statistics, 76.2% of 15-19 year old and 47.2% of 20-24 year old city/town youth is
unemployed. These numbers eloquently show us the reasons to depart among young people.
Unemployment is generally larger than 17.6%. Particularly it was 25.5% in urban areas24
(2012), while in rural area Armenia deals with hidden unemployment. According to the ILO
methodology, adopted in Armenia, adult household members, who own or at least work on
a small plot of land, are considered employed by the official statistics. However, according
to the polls, many of villagers do not consider themselves employed.25 Most of land plots are
small (around 2 hectares) and cannot provide villagers’ enough income to reach the desired
quality of life.
Reduction of life quality is also an important factor. Perception of the economic reality
is strongly influenced by its past dynamics, especially if the change was sharp. Thus, the
change of life quality in Armenia (including its sharp decline drop in 1990-1993) can be
illustrated by the dynamics of the real wages. According to the official data, by 2006, the size
of the real wage was still less than 1991 level and in 1992-1994, the size of real wage dropped
almost 8 times.
22 According Armenian National Statistics Service 23 Ref. World Development Indicators database; Economic Policy and Debt of the World Bank 24 Ref. Armenian annual statistics publication, 2013. 25According to the Caucasus Barometer 2013, 52% of all Yerevan residents considered themselves employed,
36% in other urban settlements and 45% in villages. This problem is typical for the South Caucasus countries.
In 2013, only 37% of Azerbaijani villagers and 38% of Georgian villagers considered themselves employed.
P
age 1
6
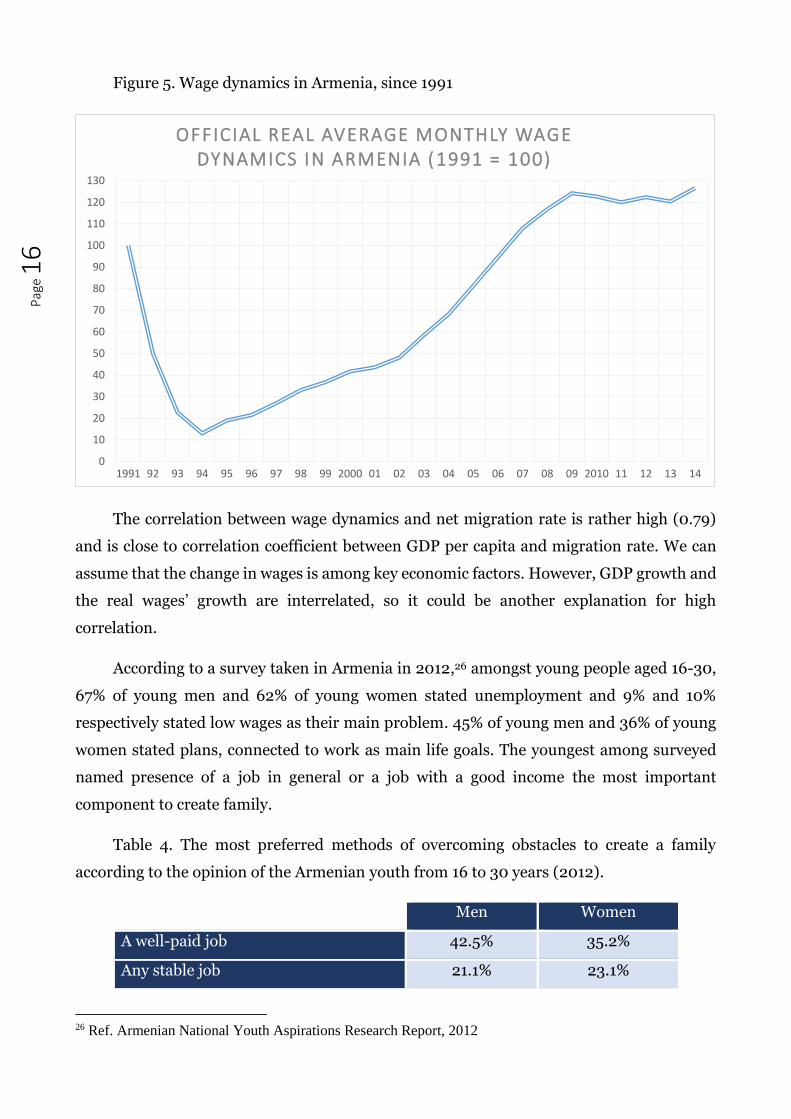
Figure 5. Wage dynamics in Armenia, since 1991
The correlation between wage dynamics and net migration rate is rather high (0.79)
and is close to correlation coefficient between GDP per capita and migration rate. We can
assume that the change in wages is among key economic factors. However, GDP growth and
the real wages’ growth are interrelated, so it could be another explanation for high
correlation.
According to a survey taken in Armenia in 2012,26 amongst young people aged 16-30,
67% of young men and 62% of young women stated unemployment and 9% and 10%
respectively stated low wages as their main problem. 45% of young men and 36% of young
women stated plans, connected to work as main life goals. The youngest among surveyed
named presence of a job in general or a job with a good income the most important
component to create family.
Table 4. The most preferred methods of overcoming obstacles to create a family
according to the opinion of the Armenian youth from 16 to 30 years (2012).
Men Women
A well-paid job 42.5% 35.2%
Any stable job 21.1% 23.1%
26 Ref. Armenian National Youth Aspirations Research Report, 2012
0
10
20
30
40
50
60
70
80
90
100
110
120
130
1991 92 93 94 95 96 97 98 99 2000 01 02 03 04 05 06 07 08 09 2010 11 12 13 14
OFFICIAL REAL AVERAGE MONTHLY WAGE DYNAMICS IN ARMENIA (1991 = 100)
MIGRATION OF POPULATION OF ARMENIA: ECONOMIC FACTORS
Pag
e 1
7
A job with a minimum wage 9.5% 8.6%
All others 26.9% 33.1%
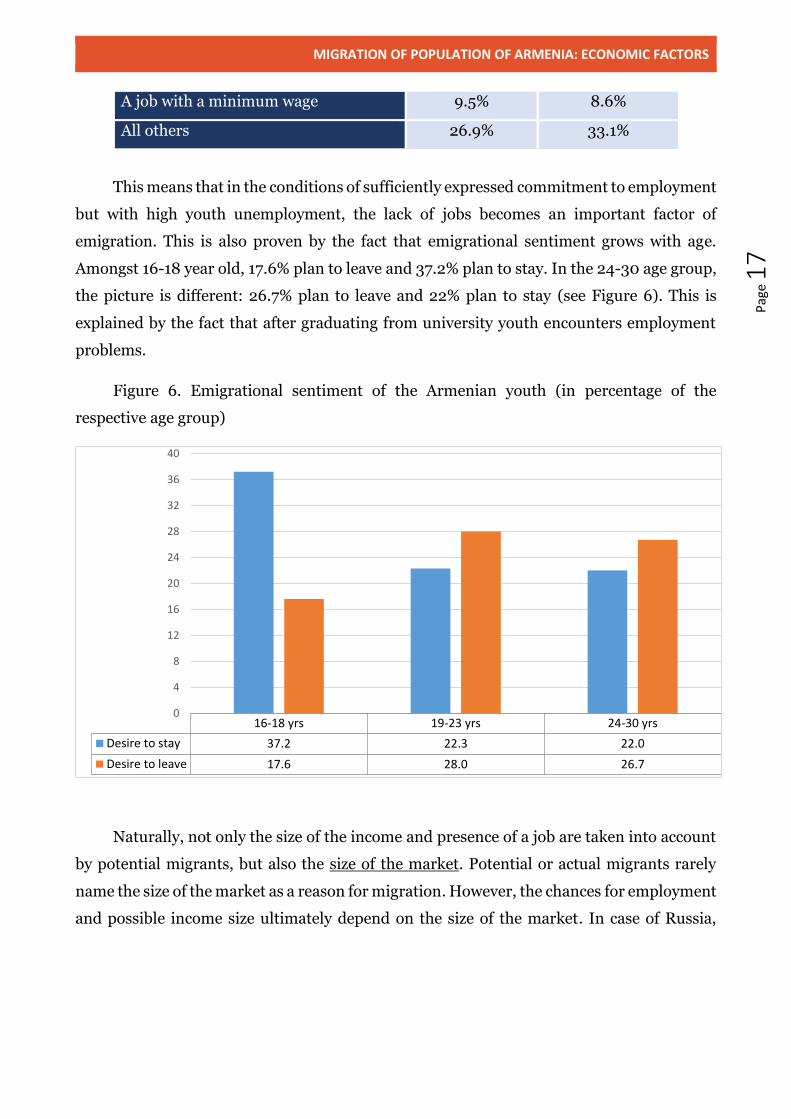
This means that in the conditions of sufficiently expressed commitment to employment
but with high youth unemployment, the lack of jobs becomes an important factor of
emigration. This is also proven by the fact that emigrational sentiment grows with age.
Amongst 16-18 year old, 17.6% plan to leave and 37.2% plan to stay. In the 24-30 age group,
the picture is different: 26.7% plan to leave and 22% plan to stay (see Figure 6). This is
explained by the fact that after graduating from university youth encounters employment
problems.
Figure 6. Emigrational sentiment of the Armenian youth (in percentage of the
respective age group)
Naturally, not only the size of the income and presence of a job are taken into account
by potential migrants, but also the size of the market. Potential or actual migrants rarely
name the size of the market as a reason for migration. However, the chances for employment
and possible income size ultimately depend on the size of the market. In case of Russia,
16-18 yrs 19-23 yrs 24-30 yrs
Desire to stay 37.2 22.3 22.0
Desire to leave 17.6 28.0 26.7
0
4
8
12
16
20
24
28
32
36
40
P
age 1
8
which is the main destination for Armenian migrants, the size of the market compensates
many other obstacles for the business, such as fuzzy legality and higher corruption level.27
Low competition level can also be one the reasons for emigration. The level of
monopolization and concentration of the capital in Armenia is quite high, the lack of
economic competition is clear. Although the social narrative often exaggerates the
seriousness of this problem. This problem is also widely connected with Armenia’s small
market size, where the possibilities in enterprise are limited by the objective size of the local
market and outlet (for local producers). It also limits the number of economic subjects able
to survive and be profitable in the conditions of economic competition.
27According to the Doing Business and Corruption Perception, as well as Economic Freedom rankings,
business environment in Armenia is more friendly than in Russia
MIGRATION OF POPULATION OF ARMENIA: ECONOMIC FACTORS
Pag
e 1
9
Does income inequality influence
emigration?
One of the often-named stated reasons for emigration income inequality. The
disproportion of the income level in Armenia is quite high, which resonates with the capital
concentration, low level of economic development and social security. Inequality is
especially visible for representatives of the older generation, as in 1970-1980s it was lower.
The R/P 10% (ratio of incomes of 10% richest households and 10% poorest) is 15 times
in income and 8 times in expenses.28 Nevertheless, it is unlikely that this fact is among major
“push” factors. In the countries of destination for the most of Armenian migrants (like
Russia or USA), the ratio is even higher. In general, commitment at equality in income in
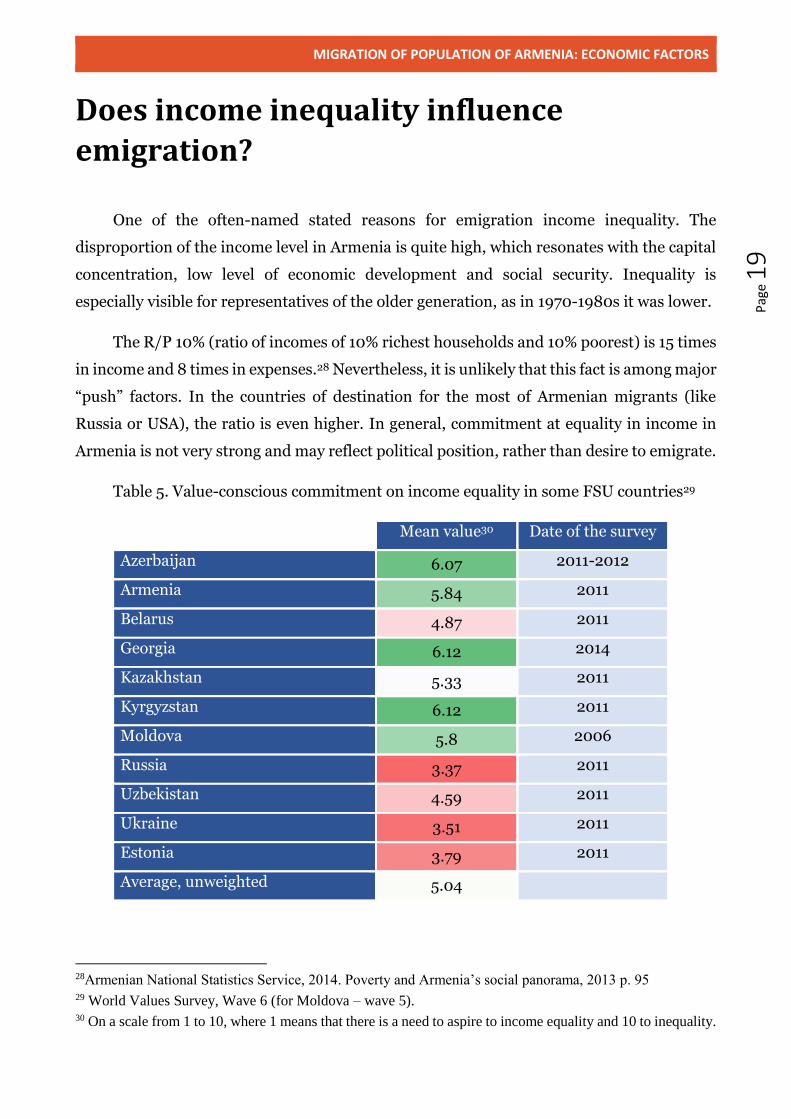
Armenia is not very strong and may reflect political position, rather than desire to emigrate.
Table 5. Value-conscious commitment on income equality in some FSU countries29
Mean value30 Date of the survey
Azerbaijan 6.07 2011-2012
Armenia 5.84 2011
Belarus 4.87 2011
Georgia 6.12 2014
Kazakhstan 5.33 2011
Kyrgyzstan 6.12 2011
Moldova 5.8 2006
Russia 3.37 2011
Uzbekistan 4.59 2011
Ukraine 3.51 2011
Estonia 3.79 2011
Average, unweighted 5.04
28Armenian National Statistics Service, 2014. Poverty and Armenia’s social panorama, 2013 p. 95 29 World Values Survey, Wave 6 (for Moldova – wave 5). 30 On a scale from 1 to 10, where 1 means that there is a need to aspire to income equality and 10 to inequality.
P
age 2
0
As we can see from the Table 5, the commitment to equality in Armenia is lower than
average among ex-Soviet countries. In Azerbaijan, Georgia and Kyrgyzstan, the commitment
to inequality is higher than in Armenia (although in all three cases the difference is
insignificant) and in the rest, it is lower, the difference is especially high in cases of Russia,
Ukraine and Estonia.
In most countries, including Armenia, opinions changed with age. Older people tended
towards a commitment to equality. Middle-aged and young people considered income
inequality quite tolerable, which is important in the context that young and middle-aged
people are those who migrate the most.
In such manner, inequality most probably cannot influence emigration. For some small
groups this can become an emigration factor, but even in this case this factor will not be the
only one. This is also proven true by the calculation of the Gini index with the migration
dynamics (period of 1991-2012). If this relation was significant, the correlation would tend
towards -1, while according to our calculations it is -0.06, which means it is insignificant or
doesn’t influence the migration dynamics at all.
MIGRATION OF POPULATION OF ARMENIA: ECONOMIC FACTORS
Pag
e 2
1
Conclusion
Summarizing the description of economic factors, affecting migration, we should note
that in comparison to Russia, the factors of living accommodations and relative access to
healthcare for potential migrants act against the decision to emigrate (see Table 3). The
factors of market size, unemployment level and size of wages in Russia act in favor of such a
decision.
In their turn, high-income OECD countries attract with their high level of social
security, a differentiated labor market and a large market size and in comparison to Russia,
the most noteworthy is the high level of social security and healthcare insurance where
available. At the same time, taking into account the values surveys in which Armenian
respondents expressed their opinion on ways to solve problems in their lives, we should
assume that the income size is one of the main motivating factors, especially when in some
sense social security can also be attributed to the income.
We have seen that in Russia’s case the current economic dynamics of the country of
destination is taken into account by the potential migrants, or, at least affects their decision
indirectly, through decrease in new jobs created in Russia. In the case of high-income OECD
countries, taking into account a bigger difference in GDP per capita and more obstacles in
migrating, such a connection is unclear. Constantly pulling factors are filtered by the
restrictive immigration policy, while the pushing factors from Armenia remain actually in
action.
As the goal of this research was to separate economic factors of Armenia’s population’s
migration and to describe the degree of influence of economics on Armenia’s migration
dynamics, we did not review Armenia’s socio-political migration factors and intervening
obstacles, which also might have a heavy impact on the migration dynamics in some periods.
The relation between migration and the socio-political narratives in the country requires an
additional study, so does the level of migration mobility of the population. However, this is
outside of the framework of this research.
Ultimately, we should state the limitations of this research. The presence of a
correlation of 0.7 or even 0.9 does not mean that migration is determined by the economic
dynamics by 70 or 90%. Except for individual coincident cases and the possibility of
inaccurate data, (although we aspired to minimize that chance) there may be some distorting
P
age 2
2
characteristics, third factors, which, for example, influence both migration and economics,
or are influenced by the economy and in their turn, influence migration.
The presence of correlation does not tell us anything about the possible sizes or
numbers of migration flows. It only tells us the trends and indicates about the interrelation:
the correlation would have stayed the same, if emigration from Armenia was two times less
or two times more. In such fashion, the economic situation can overlap other constant or
changing factors, which have close dynamics to the economic dynamics itself.
Hrant Mikaelian – Research fellow at the Caucasus Institute since 2010, author of more than 20
scientific publications.
The Caucasus Institute (CI) is one of the leading educational centers of Armenia and the South
Caucasus. The institute carries out research of the South and North Caucasus in the areas of political
science, social sciences and the media. CI is also engaged in regional studies in a broader sense.
Founded in Yerevan in 2002, the Caucasus Institute offers a neutral platform for impartial debates
on current issues of socio-political development of the region. Based on its own research, CI conducts
expert advice, roundtable discussion and conferences. The Caucasus Institute publishes in a variety of
formats, including the Caucasus Yearbook, which sums up the social, political and economic
development of the countries and regions of the North and South Caucasus each year.
The Caucasus Institute is special in that it combines research and debates with strong links to the
news media, actively involving the media in presenting the results of research to the society and
political elite of the region. Its broad scope enables CI to influence both the professional discourse and
the public opinion, as well as offer recommendations to decision-makers in Armenia and the region.
Since its foundation in 2002 and until mid-2008, the CI was called CMI (the Caucasus Media
Institute), emphasizing its links with the media. Its renaming to "Caucasus Institute" reflects the
expansion of its activity range and its focus on politics, economics and society in the wider Caucasus
region.
© 2002-2015
Caucasus Institute
31/4 Charents str., Yerevan, Armenia
www.c-i.am