Embed Size (px)
Citation preview
Migration and Speciation of Uranium in Terrestrial
Environment
By
Shri Sabyasachi Rout
(CHEM 01201204012)
Bhabha Atomic Research Centre, Mumbai
A thesis submitted to the
Board of Studies in Chemical Sciences
In partial fulfillment of requirements
for the Degree of
DOCTOR OF PHILOSOPHY
of
HOMI BHABHA NATIONAL INSTITUTE
March, 2017
ii | P a g e
iii | P a g e
Homi Bhabha National Institute
STATEMENT BY AUTHOR
This dissertation has been submitted in partial fulfillment of requirements for an advanced
degree at Homi Bhabha National Institute (HBNI) and is deposited in the library to be made
available to borrowers under rules of the HBNI.
Brief quotations from this dissertation are allowable without special permission, provided that
accurate acknowledgement of source is made. Requests for permission for extended quotation
from or reproduction of this manuscript in whole or in part may be granted by the Competent
Authority of HBNI when in his or her judgment the proposed use of the material is in the
interests of scholarship. In all other instances, however, permission must be obtained from the
author.
Sabyasachi Rout
iv | P a g e
DECLARATION
I, hereby declare that the investigation presented in the thesis has been carried out by me. The
work is original and has not been submitted earlier as a whole or in part for a degree/ diploma at
this or any other Institution / University.
Sabyasachi Rout
v | P a g e
List of Publications arising from the Thesis
Journal
1. Effects of CO2 infiltration on Migration and Speciation of Uranium at Mineral–Water
Interface, Sabyasachi Rout, P. M. Ravi, Ajay Kumar and R. M. Tripathi, J Radioanal Nucl
Chem, 2017, 1709–1717.
2. Understanding the solid phase chemical fractionation of uranium in soil and effect of
ageing, Sabyasachi Rout, Ajay Kumar, P.M. Ravi and R. M. Tripathi. Journal of Hazardous
Materials, 2016, 317, 457–465.
3. Study on speciation and salinity-induced mobility of uranium from soil, Sabyasachi Rout,
Pazhayath Mana Ravi, Ajay Kumar and Raj Mangal Tripathi. Environ Earth Sci., 2015, 74,
2273-2281.
4. Equilibrium isotherm and kinetics modeling of U(VI) adsorption by natural soil system,
Sabyasachi Rout, Pazhayath Mana Ravi, Ajay Kumar and Raj Mangal Tripathi. J Radioanal
Nucl Chem 2015, 303, 2193-2203.
5. Pseudo second order kinetic model for the sorption of U (VI) onto soil: A comparison of
linear and non-linear method Sabyasachi Rout, Pazhayath Mana Ravi, Ajay Kumar and Raj
Mangal Tripathi. Int. J Env. Sci., 2015, 6, 145-154.
6. Thermodynamic parameters of U (VI) sorption onto soils in aquatic systems, A. Kumar,
Sabyasachi Rout, M. Ghosh and P. M. Ravi, Spinger Plus, 2013, 2, 1-7.
7. Study on Speciation and Effect of Ionic strength on Uranium Migration in Mineral-Water
System. Sabyasachi Rout, Sarjan Singh, Ajay Kumar, P. M. Ravi, R. M. Tripathi. Int. J.
Env. Sci. (Accepted).
vi | P a g e
Conferences
1. Uranium Mobility and Speciation Study at Mineral-Water interface: Focus on Sensitivity
Analysis, Sabyasachi Rout, A. Kumar, P.M. Ravi and R. M. Tripathi, National
Symposium on Environment-19, Kottayam, Kerala, during 11-13 Dec., 2014.
2. Sorption Mechanism of U(VI) on to Natural soil System: A study using Intra-Particle
Diffusion Model, Sabyasachi Rout, A. Kumar, P.M. Ravi and R. M. Tripathi. Nuclear
and Radiochemistry Symposium, Mumbai during 9-23 Feb., 2015.
3. Impact of aging on the solid phase chemical fractionation of uranium in soil, Sabyasachi
Rout, A. Kumar, P.M. Ravi and R. M. Tripathi. Current Trends in Analytical Chemistry,
Mumbai during 26-29 May, 2015.
Others
1. A Review of the Studies on Environmental Transport and Speciation analysis of
Radionuclides in India, Pazhayath Mana Ravi, Sabyasachi Rout, Ajay Kumar, Raj
Mangal Tripathi, J Radioanal Nucl Chem, 2014, 300, 169-175.
2. Characterization of groundwater composition in Punjab state with special emphasis on
uranium content, speciation and mobility", Ajay Kumar, R. M. Tripathi, Sabyasachi Rout,
Manish K. Mishra, P. M. Ravi, and A. K. Ghosh, Radiochim. Acta 2014, 102, 239-254
3. Activity ratios of 234U/238U and 226Ra/228 Ra for transport mechanisms of elevated
uranium in alluvial aquifers of groundwater in south-western (SW) Punjab, India, Ajay
Kumar, Sabyasachi Rout, M. K. Mishra, D. G Mishra, P. M Ravi, R. M Tripathi, Journal
of Environmental Radioactivity, 2016, 151, 311-320.
vii | P a g e
4. Understanding and modeling of the vertical downward migration of 238U within the soil
profile of south-western (SW) Punjab, India, Ajay Kumar, Sabyasachi Rout, M. Pandey,
D. G. Mishra, M. K. Mishra, P. M. Ravi, R. M. Tripathi, Journal of Radio analytical and
Nuclear Chemistry, 2015, 308, 1043–1053.
Sabyasachi Rout

viii | P a g e
DEDICATED
To my Beloved Parents
ix | P a g e
ACKNOWLEDGEMENTS
First I would take this opportunity to express my sincere gratitude to my research adviser Dr. P. M
Ravi for the encouragement, guidance and support that he has provided during the course of this
thesis work. Invaluable suggestions emanating from several discussions and his able guidance have
finally ensured that this research work sees the light of the day. This work would have not been
possible without his enthusiastic involvement in every aspect of it.
I would thank Dr. R. M Tripathi, Head, Health Physics Division, BARC and member of
doctoral committee for encouraging me to purse this research work. He has been a source of great
inspiration who always advised me to maintain a balance between academic interest and the
application aspects of new research. I am also greatly indebted to Dr. P. K Sarkar former Head,
Health Physics Division and Dr. A. K Ghosh former Director Health Safety & Environment Group,
BARC for permitting me to purse this research work.
I greatly acknowledge the contributions of my doctoral committee members Prof. B. S Tomar,
Dr. R. K. Singhal and Dr. Pradeep Kumar who spared their valuable time for periodical critical
assessment of my work. Incorporation of their constructive suggestions has greatly enhanced the
technical level of my research work.
Though they may never know, I would like to thank my colleagues namely, Dr. Ajay Kumar, Shri.
Manish Kumar Mishra, Shri. D. G Mishra, Smt. Rupali C. Kharpe, Miss Mousumi Datta Choudhry
and Shri G. L. Teli for their constant support during the program.
Sabyasachi Rout
x | P a g e
CONTENTS
Page No.
Synopsis 1
List of Figures 13
List of Tables 16
Chapter 1
Introduction
1.1. Chemistry of Uranium 17
1.2. Aqueous Chemistry of Uranium 21
1.3. Sorption and Desorption of Uranium 23
1.4. Uranium Toxicological Profile 24
1.5. Issues Related to Uranium in World 27
1.6. Missing Area in Literature 30
1.7. Objective of study 32
1.8. Scope of the Study 33
Chapter 2
Experimental Methods and Techniques
2.1. Introduction 34
2.2. Techniques for Soil and Mineral Characterization 36
2.2.1. Mineralogical Study Using X-ray Diffraction (XRD) 36
2.2.2. Textural Analysis using Particle Size Analyzer (PSA) 38
2.2.3. Measurement of Soil Organic Carbon using CHNOS
Analyzer
39
2.2.4. Measurement of soil Cation Exchange Capacity (CEC) 40
xi | P a g e
2.2.5. Estimation of Fe and Mn 41
2.3. Physico-Chemical characterization of Aqueous Phase 42
2.3.1. Ion chromatography technique for estimation of Na+, K+,
Mg2+ , Ca2+ , F-, Cl- , SO42 -, PO4
3-
43
2.3.2. Measurement of alkalinity titrimetrically 45
2.4. Analytical method for Uranium estimation 46
2.4.1. Voltammetric determination of U using chloranilic acid: 47
2.4.2. U determination using Fluorimetry: 47
2.5. X-Ray Photoelectron Spectroscopy (XPS) 48
2.6 Sorption Study 49
2.6.1. Batch method: 49
2.6.2. Kinetics of Sorption 51
2.6.3. Thermodynamic of sorption 51
2.6.4. Sorption Equilibrium and Isotherms. 52
2.7. Speciation study 53
2.7.1. Fractionation of uranium in soil and sequential extraction 53
2.7.2. Aqueous Chemical Speciation 55
Chapter 3
Behavior of Uranium at Soil- Water interface
3.1. Introduction 58
3.2. Present work 59
3.3. Materials and Methods 59
3.3.1. Materials 59
3.3.2. Characterization of properties of Natural Soil 60
xii | P a g e
3.3.3. Sorption experiment 60
3.3.4. Measurement of U(VI) concentration and removal capacity 61
3.3.5. Theory of Adsorption isotherm 62
3.3.6. Adsorption kinetics 64
3.3.7. Adsorption mechanism 65
3.3.8. Thermodynamic parameters 65
3.3.9. Parameter Sensitivity 66
3.4. Results and Discussion 67
3.4.1. Characterization of Soils 67
3.4.2. Effect of U(VI) concentration 71
3.4.3. Effect of soil (adsorbent) dosage 71
3.4.4. Effect of Natural Organic Matter Content (NOM) 72
3.4.5. Adsorption isotherm 74
3.4.6. Kinetics of Adsorption 77
3.4.7. Adsorption Mechanism 80
3.4.8. Thermodynamic Parameters of Sorption 82
3.4.9. Role of Soil Parameters on Sorption 83
3.4.10. Role of Water parameters on Mobility of uranium 84
3.5. Summary
86
Chapter 4
Chemical Fractionation of Uranium in Soil
4.1. Introduction 87
4.2. Present Work 88
4.3. Methodology 88
4.3.1. Soil sample and its Characterization 88
xiii | P a g e
4.3.2. Preparation of amended soil 88
4.3.3. Sequential extraction 89
4.3.4. Methodology for XPS Analysis 90
4.4. Results and Discussion 90
4.4.1. Chemical Speciation of U 91
4.4.2. Rearrangement in Chemical Fractionation with ageing 92
4.4.3. Spectroscopic Study 95
4.5. Summary 100
Chapter 5
Effect of Salinity on Migration and speciation of Uranium at Soil-Water Interface
5.1. Introduction 102
5.2. Present Study 102
5.3. Experimental 103
5.3.1. Soil sample and its characterization: 103
5.3.2. Extraction of soil U(VI) by bicarbonate solution 104
5.3.3. Sequential extraction 104
5.3.4. Desorption experiment 105
5.4. Results and Discussion 105
5.4.1. Physicochemical characterization of soil 105
5.4.2. Uranium extraction and speciation in moderately
reduced (+395mV to +400.5mV) soil
108
5.4.3. Speciation of uranium in soil solution-Modeling
approach.
110
5.4. 4. Effect of ionic strength on Uranium migration 111
5.4.5. Migration of U in relation to the total uranium at 114
xiv | P a g e
exchangeable sites of soil
5.5 Summary 115
Chapter 6
Migration and Speciation of Uranium at Ore-water interface: Role of Ionic Strength,
Humic Acid, pH and Carbonate
6.1. Introduction 117
6.2. Present Work 117
6.3. Materials and Method 118
6.3.1. Characterization of Ore and binary phase: 118
6.3.2. Effect of variation of pH 119
6.3.3. Effect of Carbonate 119
6.3.4. Desorption Experiments using water of different ionic
strength
120
6.3.5. Desorption Experiment in ternary system (Uraninite-
Water- Humic acid)
120
6.4. Results and Discussion 121
6.4.1. Physico-Chemical Characterization of Ore 121
6.4.2. Speciation of Uranium in Ore and Binary Phase: 123
6.4.3. Role of Ionic Strength 124
6.4.4. Study of Ternary System 127
6.4.5. Effect of pH and CO32- 130
6.5. Summary 132
Chapter 7
Effects of Carbon Dioxide on Migration of Uranium
7.1. Introduction 133
7.2. Present Study 134
xv | P a g e
7.3. Methodology 134
7.3.1. Materials 134
7.3.2. Experimental approach 135
7.4. Results and Discussion 137
7.4.1. Migration of Uranium at Mineral water interface 143
7.4.2. Speciation of Uranium at mineral water interface 143
7.4.3. Speciation of Uranium at soil water interface 146
7.5. Summary 147
Chapter 8
Conclusions
148
Reference
154
1 | P a g e
Synopsis
Uranium is an important natural resource used in production of nuclear reactor fuel and nuclear
weapons. It is lithophilic naturally radioactive element, chemically and radiologically toxic, and
occurs in the earth’s crust reaching an average concentration almost 0.0003% by mass. About
5% percent of all known minerals contain uranium as an essential structural constituent, as a
result uranium minerals display a remarkable structure and chemical diversity [1]. The presence
of uranium (U) in earth can be attributed to natural and anthropogenic sources. Natural U sources
and its daughter products are present on the earth from the beginning of the formation of earth,
presumably being formed in the course of nucleo-synthesis and are called primordial
radionuclides.
In the geosphere, U chemical behavior is governed by redox reactions, complexation, colloid
formation and interactions with soil mineral surfaces [2, 3]. Water is recognized as the dominant
transport medium in the environment [4] and its chemical condition defines the oxidation state,
the prevailing species and solubility of the radionuclides. The redox potential of the system
influences the fate of uranium minerals, such as oxidation and dissolution leading to the growth
of its concentration in meteoric as well as hydrothermal fluids. Most natural waters have low
salinity, near neutral pH with a wide range of redox potentials (Eh) (from -300 to +700 mV) [5].
Under this natural condition of pH and Eh, U easily forms multiple oxidation states, which
complicates the prediction of their behavior in environment in comparison to single oxidation
state. Bicarbonate/carbonate and hydroxide are main inorganic complexing ligands present in
aquatic system. Many other inorganic ligands such as phosphate, nitrate, fluoride, sulfate and
silicate can also play a role by complexing with U. Organic chelating molecules present in the
2 | P a g e
environment range from molecular citrate, oxalate, etc., to macromolecular, poly-electrolytic
humic substances are important carrier of U in soil/mineral-water system. Uranium mobility in
soil and its migration to groundwater also depends on soil properties like, pH, redox potential,
particle size, soil mineralogy and amount of available water. Retention of U in soil is a result of
several processes such as adsorption, chemisorption, ion exchange or their combinations [6]. The
uranium sorption rate of soils with abundant clay, organic matter and iron content is generally
high. Therefore, normally uranium does not reach the groundwater unless and until there is
significant change in physiochemical properties of soil and water.
Recently it was observed that U concentration in drinking water sources of many countries round
the globe is more than the drinking water standards. Incidentally, in many locations where U
concentrations are high, salinity also was found to be high. High level of U has been reported in
many states of India, among which U in ground water of Punjab was most highlighted in the year
2009-2010. Changes in soil environmental conditions over time, such as the degradation of the
organic waste matrix, changes in pH, redox potential and soil solution composition, due to
various remediation schemes or to natural weathering processes, also may enhance U
concentration in soil and its migration to groundwater. In addition to this, long term climatic
changes also has a great impact on soil and water chemistry which may leads to change in
speciation of U and increased migration from soil/mineral to water. This leads to increased
bioavailability of U in terrestrial environment. Therefore, from environmental protection and
assessment point of view, it is very much important to study the migration of U in terrestrial
environment especially at soil-water and mineral-water interface. These observations motivated
us to carry out detailed studies on the speciation and migration of U from solid phase (soil and
minerals) to solution (water).
3 | P a g e
The objective of the present work is to understand the change in migration behavior and
speciation of U in terrestrial environment in response to changes in environmental conditions and
to identify the complexities involved in the process. Laboratory experiments were carried out to
understand the complex U behavior at soil-water and ore-water interface. An attempt has been
made to quantify the factors influencing the processes and the energy released or absorbed
during the process. At present increase in salinity is the major factor, while in future, increase in
CO2 partial pressure also may play important role on speciation and migration of U in ground
water systems. Hence, in the present study, effects of these parameters on speciation and
migration of U from soil/minerals to water were investigated.
The thesis has been divided into eight chapters and a brief description of each chapter is as
follows:
Chapter 1: Introduction
In this introductory chapter, a detailed literature survey on geochemistry of U, occurrence of U
in environment, its toxicology, its environmental chemistry, and sorption / desorption of U in
natural systems and the parameters influencing speciation and migration of U has been carried
out. The literature revealed that all U isotopes are radioactive, natural U is found in the
environment at 99.27% 238U, 0.71% 235U and 0.005% 234U by mass isotopic abundance and
economic U ore deposits range in concentration from about 300 to over 5000 mg/kg. The
principal ore minerals and their origin have been discussed in details [2]. Natural U is also found
in water systems like surface water, oceans, groundwater, and in trace amounts in any material of
terrestrial origin covering a wide range of oxidation states starting from +3 to +6. But out of
these +4 and +6 are stable in aqueous medium at reduced and oxidized environment respectively.
The U(VI) species, uranyl ion (UO22+) is generally mobile and form strong complexes with PO4
3-
4 | P a g e
and CO32- whereas, in absence of carbonate or phosphate it forms hydroxyl complexes and
responsible for contamination of ground water. On the other hand, U(IV) species concentration
in water system is very low due to its low solubility. In the section, issues related to U in the
world, possible sources of U contamination of soil and water systems, possible factors
influencing contamination and case studies related to U contaminations in different
environmental matrices were addressed. In addition to this, U in ground water of Punjab, India is
also discussed. The gap area with respect to the understanding the mechanism behind the
presence of U in ground water has been identified. This chapter also narrates how objectives of
this study have been designed to address the gap areas.
Chapter 2: Experimental Methods and Techniques
Brief descriptions of methodology of the experiments and instrumental techniques which have
been used during the present investigation have been provided in this chapter. The chapter
describes the mechanistic aspects of the interfacial sorption process along with steps of batch
sorption methodology used for kinetic, thermodynamic and equilibrium isotherms studies.
Experimental procedures involved in soil and ore mineral characterizations namely mineralogical,
particle size, elemental characterization, soil organic matter content, cation exchange capacity
(CEC) are addressed in detail. An in-depth discussion is carried out in this chapter regarding
analytical estimation of uranium in water and soil. Speciation of uranium in terms of chemical
fractionation of uranium in soil, steps involved in sequential extraction for estimation of U in
different fractions of soil prescribed by Scutz etal [7] are described. Working principles of the
instruments namely, XRD, Particle Size Analyzer, CHNS-O analyzer, Ion-Chromatography,
Voltammetry, Fluorimetry and X-ray Photo electron Spectroscopy are also discussed in this
5 | P a g e
chapter. The chemical speciation models namely PHREEQC I and MEDUSA used for speciation
studies of uranium in aqueous medium are also discussed in this chapter.
Chapter 3: Behavior of Uranium at Soil-Water Interface
This chapter gives a brief introduction followed by procedures used for the characterization of
soil and studies related to kinetics, thermodynamics and equilibrium isotherms of U sorption
onto soil. This chapter describes the effect of various parameters influencing the adsorption
capacity of soil for U. It was observed that adsorption capacity of soil for U increases with Fe,
Mn and naturally occurring organic matter (NOM) content in the soil. At circumneutral pH,
effect of NOM on sorption capacity of soil is negligible in Fe-Mn dominated soil. Water
parameters like pH, CO32- and Ca2+ are sensitive parameters which influence U(VI) migration at
soil water interface. Sorption followed pseudo-second order model with multi-step diffusion
process irrespective of soil types and the rate-limiting step is chemisorption involving valence
forces through sharing or exchange of electrons along with ion exchange. From the
thermodynamic parameters derived, it could be inferred that sorption is spontaneous,
endothermic in nature and follows dissociative mechanism. From these studies, it can be
concluded that, the geological setup with high ferro-manganese content offer one of the
candidate locations for waste disposal facilities or geological repository. Similarly, Fe or Mn
enriched soils are effective as backfill to mitigate migration of U. The sorption parameters
generated in these studies has potential application in predictive modeling of U transport in
terrestrial environment.
Chapter 4: Chemical Fractionation of Uranium in Soil
Chemical fractionation of uranium or fractionation of uranium in different pools of soil along
with effect of ageing has been reported in this chapter. When U come in contact with soil, it may
6 | P a g e
go to one or several fractions/pools in soil such as; Exchangeable, Carbonate, Reducible fraction
(Oxides and hydroxides of Fe, Mn), oxidizable fraction (Organic matter: OM), Acid leachable
fraction (Secondary minerals) and Residual fraction (Primary minerals). Three soils of different
origins were taken for the studies. Characterization of soil samples were carried out followed by
amendment of soil samples with known concentration of uranium by batch sorption method. In
order to study the impact of ageing on fractional distribution of U in different soil pools,
sequential extraction of U was carried out as per standard protocol [7], by taking desired amount
of sample from amended soil after one month and another one after 12th month. Characterization
of amended soil samples such as, pH, Eh, mineralogy, CEC, organic matter, Fe, Mn and total U
content were carried out in parallel to observe the effect of ageing on these parameters.
Spectroscopic investigation using X-Ray Photoelectron Spectroscopy (XPS) was carried out to
understand the governing mechanism behind the species distribution of uranium in soil matrix.
The studies indicated that the fate of U in soil is initially governed by concentration of
adsorbents (Such as carbonate, oxides of Fe/ Mn, OM etc.in respective fractions) but a
significant rearrangement of U in these fractions of soil was observed due to aging. This leads to
either increase or decrease in bioavailability of U. Further investigation using XPS revealed that
a part of total U (VI) is converted to less mobile U(IV). Concentration of U in soil surface is
mainly controlled by soil carbonates and organic matter content. Occlusion of U-Fe-Oxides
(Hydroxide) in to amorphous silica has been considered as plausible mechanism which leads to
decrease of U in reducible fraction. The bulk enrichment is due to fractionation of uranium in
reducible and residual fraction.
7 | P a g e
Chapter 5: Effect of Salinity on Migration and Speciation of Uranium at Soil–Water
Interface
This chapter focuses on the studies carried out on the effect of salinity on migration and
speciation of uranium at soil-water interface. The studies indicated that U is present in the
moderately reduced soil as a mixture of U(IV) and U(VI) with U(IV) as dominating (71%) state.
Sequential extraction of soil samples showed that major fraction is bound to clay mineral
(49.31%) followed by oxides and hydroxide of Fe/Mn (19.58%), organic phase (10.75%),
exchangeable (10.41%) and remaining to carbonate phase (9.96%). UO2CO3, (UO2)2CO3 (OH)3-,
UO2(CO3)22-, UO2OH+ and UO2(OH)2 has been reported as important species in the soil-solution
at ambient condition. The effects of salinity induced by CaCl2, MgCl2, NaCl, NaNO3 and
Na2SO4 on the migration of U were studied. It was observed that the increase in salinity
mobilizes U(VI) from soil exchangeable fraction, forcing it into solution. It is well known that
the desorption capacity of cations are directly proportional to ionic radius (Ca2+> Mg2+> Na+)
and charge on cation (Ca2+~ Mg2+> Na+) which can be correlated to the high desorption of U
induced by CaCl2 followed by MgCl2 and NaCl in chloride salts. Ion exchange mechanism is
predominant in the desorption of U from soil in the case of CaCl2, MgCl2,NaCl, Na2SO4 systems,
whereas ion exchange and oxidative dissolution of U(IV) seem to be the driving forces in NaNO3
system. These results can be used, for predicting the migration behavior of trace uranium in soil
and for impact assessment of the disposal of radioactive waste containing uranium.
Chapter 6: Migration and Speciation of Uranium at Ore-water interface: Role of Ionic
Strength, Humic Acid, pH and Carbonate
This chapter describes the studies carried out on the role of ionic strength (IS) of the water in U
migration from ore to water in contact and speciation in the ore water binary system.
8 | P a g e
Experiments were also carried out in ternary system (Uraninite-Water- Humic Acid) to
investigate the composite impact of humic acid (HA) on mobility of uranium at different Ionic
Strength (IS). Laboratory batch experiments were also carried out to investigate migration of
uranium at varying pH and carbonate concentrations. The results of the study indicated that
increase in the IS of the water accelerates the U migration from U bearing ore like uraninite at
ore/mineral–water interface. In binary systems, high Ca2+and NO3- concentration induces higher
U mobility. Investigation of ternary system (Ore-Water-HA) revealed that presence of HA
increases the U concentration in liquid phase at circumneutral pH, whereas presence of high Ca2+
ion content reduces the U concentration in solution. This is attributed to competition between
Ca2+ ion with uranyl ion (due to similar ionic radii) for HA followed by formation of more stable
Ca-Humato complex in comparison to U(VI)-Humato complex. As a result less number of Ca2+
ion is available in aqueous phase to induce the U desorption simultaneously less binding of U to
humic acid causes drop in U concentration in aqueous phase. Increase in carbonate concentration
of aqueous media induces migration of U irrespective of ore types but effect of pH depends on
the type of host rock containing U minerals. The outcome of these studies can be used for
predicting the migration behavior of uranium at mining, milling sites and for impact assessment
of the disposal of radioactive waste generated from mines.
Chapter 7: Effects of Carbon Dioxide on Migration of Uranium
This chapter mainly focuses on the study of impact of CO2 gas on migration of U at mineral
(Uraninite)-water and soil-water interface including mechanism and change in speciation. This
chapter describes the anticipated increase in concentration of CO2 in atmospheric and
hydrospheric environments consequent to the use of fossil fuels. This chapter also explains how
the increase in CO2 will affect the uranium speciation in soil –water and ore –water systems. Due
9 | P a g e
to rapid industrialization, CO2 concentration in the atmosphere has increased from 275 to 370
ppmv and by 2100 it is projected to be 750 ppmv [8]. Since aquatic system is in equilibrium with
atmospheric gases, increase in atmospheric CO2 level leads to increase in dissolve CO2 in aquatic
systems. This may cause change in physicochemical parameters of aquatic system which in turn
leads to change in the aqueous speciation of dissolved U species. It may initiate various
processes like, mineral dissolution, metal mobilization, and sorption/desorption and
precipitations etc., at mineral-water or soil- water interface. For the study, a shaker incubator has
been customized to carry out the experiment of infiltration of CO2 gas at 1 atm for a period of 30
days. The result and discussion section describes the comparison of physicochemical properties
of the system with respect to pre CO2 exposure system. The study was carried out in a phased
manner to understand the immediate impact and delayed impact. In Phase I experiment, sample
aliquot removed after 24 hrs of exposure to CO2 was analyzed while in phase II experiment,
sample aliquot removed after 30 days of exposure to CO2 was analyzed. Samples were also taken
at different time intervals during the experimental period and analyzed for all the
physicochemical parameters. Introduction of CO2 leads saturation of water at mineral-water and
soil-water interfaces with CO2 which initiate various reactions. Initial increase in cation
concentrations in aqueous phase suggest that mineral dissolution is driven by CO2 which is in
consistent with initial decrease in pH. The phase II experiment indicated an increase in cation
concentration as compared to initial concentration. However the increase did not follow any
correlation with time indicating influence of multiple parameters. In response to exposure of CO2,
U migration increases upto~150 times more than the pre exposed systems of ore-water system
within 2–3 days and again start to fall and achieve equilibrium at the end of experiment.
Observations were similar in soil-water system, where U concentration increased 325 times than
10 | P a g e
pre-exposed system. The increase in mobility of U in soil -water system, consequent to the
exposure to CO2, is attributed to the release of U bound in different fractions of soil. Though the
present studies present a trend on the effect of CO2 exposure on soil-water system, it may be
noted that amended soil was used in the present study, which may not represent quantitatively
age old soil-water system. More studies are required to address this issue.
Chapter 8: Conclusions
In this concluding chapter findings of the thesis work have been summarized and finally
presented all the result in a nutshell. The migration of U in terrestrial environment is very
complex and also complexities increase due to human activities such as mining, processing and
waste disposal practices along with issues like increased salinity and long term climatic change.
The batch sorption studies of U onto wide variety of soil types revealed that sorption follows
pseudo-second order kinetics with multi-step diffusion process irrespective of soil types. And the
rate-limiting step is chemisorption involving valence forces through sharing or exchange of
electrons along with ion exchange. Thermodynamically the process is endothermic in nature and
follows dissociative mechanism for sorption. Sorption and migration of U in soil-water system is
function of soil and water parameters among which soil Fe, Mn, OM content, water pH, CO32-,
Ca2+ are the most sensitive parameters. Chemical fractionation of U in soil initially depends on
the sorbents responsible for sorption in different fractions but with ages a significant
rearrangement takes place in different fractions and bioavailability decreases in soils containing
high Fe content. Increases in salinity of aquatic system accelerate the U migration from soil and
ore minerals to water in contact. Ca2+ and NO3- plays significant role in migration from solid
phase to solution. NO3- is identified as dissolve oxidant for U. Case studies like, high level of U
in ground water of Punjab, India along with high salinity, NO3- and pH can be correlated to the
11 | P a g e
salinity induced migration. Change in climate or environmental conditions brought changes in
terrestrial as well as subsurface aquatic systems like change in physicochemical properties of soil
and water which leads to change in speciation and increases in the migration of uranium.
Increased atmospheric CO2 will directly or indirectly affect uranium migration to aqueous phase.
Therefore all these parameters need to be taken in to consideration for development of remedial
techniques and planning of disposal facilities such as Near Surface disposal Facility (NSDF) or
Deep Geological Repository (DGR). This chapter also presents future scope for studies.
References
[1] Finch, R., Murakami, T.: Systematics and paragenesis of uranium minerals. In: Uranium:
Mineralogy, Geochemistry and the Environment (Eds. BURNS, P.C. and FINCH, R.).
Reviews in Mineralogy, 1999, 38,p. 91-180.
[2] Kim, J. I. Significance of actinide chemistry for the long-term safety of waste disposal, Nucl.
Eng. Technol. 38, 459-482, 2006.
[3] Silva, R. J. and Nitsche, H. Actinide environmental chemistry, Radiochim. Acta 70/71, 377 -
396, 1995.
[4] Stumm, W. and Morgan, J. J. Aquatic chemistry: Chemical equilibria and rates in natural
waters, Third edition, 996, John Wiley & Sons, New York, USA.
[5] Baas-Becking, L. G. M., Kaplan, I. R. and Moore, D. Limits of the natural environment in
terms of pH and oxidation-reduction potentials, J. Geol. 68, 243-284, 1960.
[6] Allard, B., Olofsson, U., Torstenfelt, B., Andersson, K. Sorption of actinides in well-defined
oxidation states on geologic media. Mater. Res. Soc. Symp. Proc., 1982, 11, p. 775-782.
[7] Schultz MK, Burnett WC, Inn KGW (1998) Evaluation of a sequential extraction method for
determining actinide fractionation in soils and sediments. J Environ Radioact 40:155–174.

12 | P a g e
[8] Albritton D.L, MeiraFilho LG. Climate Change 2001: The Scientific Basis; Contribution of
Working Group I tothe Third Assessment Report of the Intergovernmental Panel on Climate
Change––Technical Summary. Geneva: IPCC; 2001.
13 | P a g e
List of Figures
Page No.
Figure 2.1 Block diagram of CILAS 1190 Particle Size Analyzer 39
Figure 2.2 Chromatogram of major cations using 5.0 mg/L of mixed cations
standard solution.
43
Figure 2.3 Chromatogram of major anions using 5.0 mg/L of mixed anion standard
solution
44
Figure 2.4 Steps involved in chemical speciation calculation 56
Figure 3.1 Particle size distribution pattern of a) Soil A, b) Soil B, c) Soil C and d)
Soil D.
69
Figure 3.2 X-ray diffraction patterns of a) Soil A, b) Soil B, c) Soil C and c) Soil D 70
Figure 3.3 Effect of (a) initial U(VI) concentration and (b) Adsorbent dosage (g of
soil/20mL of Solution) on removal of U(VI) on all soil types (pH 7.2).
72
Figure 3.4 Change in sorption % in presence (+) and absence (-) of NOM for a) Soil
A, b) Soil B, c) Soil C and d) Soil D
73
Figure 3.5 Adsorption isotherm for adsorption of U(VI) on Natural Soils (a)
Freundlich and (b) Langmuir (c) D-R Isotherms
76
Figure 3.6 Adsorption kinetic for adsorption 100.0 µg/L (a) Pseudo-first order and
(b) Pseudo- second order
80
Figure 3.7 Intra-particle diffusion kinetic for adsorption of U(VI) on soil A, B, C
and D
81
Figure 3.8 Variation of UR with change in a) pH, b) CO32- and c) Ca2+ of system 85
Figure 4.1 Deconvulated XPS spectrum with original Spectrum in the U 4f region 97
14 | P a g e
for Soil: a) A (Metamorphic), b) B (Sedimentary) and c) C (Igneous
Basalt)
Figure 4.2 Deconvulated XPS spectrum with original Spectrum in The Fe 2p region
for Soil: a) A (Metamorphic), b) B (Sedimentary) and c) C (Igneous
Basalt)
98
Figure 4.3 Deconvulated XPS spectrum with original Spectrum in The C 1s region
for Soil: a) A (Metamorphic), b) B (Sedimentary) and c) C (Igneous
Basalt)
100
Figure 5.1 Particle size distribution of composite soil sample 106
Figure 5.2 X-ray Defractrogram of clay mineralogy present in soil where, S:
Smectite, P:Plagioclase (Albite& Labradorite) and Q: Quartz, C: Calcite.
106
Figure 5.3 Speciation of U(VI) in soil solution 110
Figure 5.4 Effect of salts: a) NaCl, b) NaNO3 c) Na2SO4 d) CaCl2 and e) MgCl2 on
uranium migration, from soil to solution (each point is the average of the
five soil samples)
112
Figure 5.5 Percentage of total Uranium migration as a function of strength of salt
solution (M)
113
Figure 5.6 Percentage of exchangeable U migration as a function of strength of salt
solution (M)
114
Figure 6.1 X-ray diffractogram of ore minerals 122
Figure 6.2 Speciation of Uranium in Binary phase: a) Ore-A- Water, b) Ore-B –
Water
123
Figure 6.3 Effect of I.S of ; a) NaCl, b) CaCl2 and c) NaNO3 on desorption of 126
15 | P a g e
Uranium from Ore in Ore-water system A
Figure 6.4 Effect of I.S of ; a) NaCl, b) CaCl2 and c) NaNO3 on desorption of
Uranium from Ore in Ore-water system A
127
Figure 6.5 Variation of U concentration in aqueous phase due to variation of I.S of:
a) NaCl, b) CaCl2 and c) NaNO3 in presence (+HA) and absence (-HA)
of humic acid in Ore (A)-water system.
128
Figure 6.6 Variation of U concentration in aqueous phase due to variation of I.S of:
a) NaCl, b) CaCl2 and c) NaNO3 in presence (+HA) and absence (-HA)
of humic acid in Ore(B)-water system
129
Figure. 6.7 Effect of pH on migration of U at ore-water interface 131
Figure. 6.8 Effect of HCO3-on migration of U at ore-water interface 131
Figure 7.1 Experimental Setup for CO2 gas exposure 136
Figure 7.2 Variation of major cations at a) Ore A-water, b) Ore B-water and c) Soil-
water System
140
Figure 7.3 Variation of pH with time a) Ore-water System and b) Soil-water System 141
Figure 7.4 Speciation of C(IV) in aqueous medium in equilibrium with 1 atm CO2 142
Figure 7.5 Aqueous speciation of U(VI) during pre-exposure period at mineral-
water system a) Ore A-Water, b) Ore B-Water
144
Figure 7.6 Aqueous speciation of U(VI) during post-exposure period at mineral-
water system a) Ore A- Water, b) Ore B-Water
145
Figure 7.7 Aqueous speciation of U(VI) at soil-water interface in a) pre-exposure
system and b) post- exposure system
146
16 | P a g e
List of Tables
Page No.
Table 1.0 Classification of uranium deposits 19
Table 3.1 Physical and chemical properties of Natural Soil 68
Table 3.2 Adsorption parameter of isotherm for the adsorption of 100µg /L of
U(VI) on Natural Soil
75
Table 3.3 Comparison of Kinetics of U(VI) sorption onto soil by Pseudo-First
Order and Pseudo-Second Order kinetic models for of 100µg /L of
U(VI)
78
Table 3.4 Comparison of Kinetics of U(VI) sorption onto soil by Pseudo-First
Order and Pseudo-Second Order kinetic models at different U(VI)
concentrations
79
Table 3.5 Thermodynamic parameters for U sorption onto soils 83
Table 3.6 Correlation matrix of soil parameters and sorption capacity 84
Table 4.1 Comparison of physiochemical parameters and Uranium fractionation in
different fractions of soil in the interval of One and 12 months
93
Table 5.1. Chemical Composition of the soil with measurement uncertainties 107
Table 5.2 U bound to different fraction of contaminated soil 109
Table 6.1 Physico-Chemical Characteristics of the Ore and Ore -Water Extract with
Measurement Uncertainties
121
Table 7.1 Change in Physico-chemical parameters of water in mineral-water
system
138
Table 7.2 Change in Physico-chemical parameters of water in soil-water system 139
17 | P a g e
CHAPTER 1
INTRODUCTION
Uranium (U) is ubiquitous throughout the environment as a primordial radionuclide. The
concentration of uranium in soil varies greatly from location to location and is found in the
earth’s crust with an average abundance of 2.7 g/ton [1]. Uranium has 14 isotopes; the atomic
masses of these isotopes range from 227 to 240. All uranium isotopes are radioactive. Natural
uranium is found in the environment at 99.3% 238U, 0.7% 235U and 0.006% 234 U by mass
isotopic abundance [2]. The half-lives of these isotopes are 4.51 x 10⁹ y, 7.1x 10⁸ y and 2.47 x
105 y respectively. Economic uranium ore deposits range in concentration from about 300 to
over 5000 mg/kg [2]. Natural uranium is also found in surface water, oceans, groundwater, and
in trace amounts in any material of terrestrial origin.
1.1 Chemistry of U
Uranium can exist in wide range of oxidation states starts from +3 to +6 oxidation states, of
which the +4 and +6 states are the most common states found in the environment. Uranium in
the +4 and+6 oxidation states exists in a variety of primary and secondary minerals. U(IV)
minerals chiefly includes uraninite (UO2 through UO2.25) and coffinite (USiO4) [3, 4]. Among
U(VI) minerals carnotite [(K2(UO2)2(VO4)2], schoepite (UO3.2H2O), rutherfordine (UO2CO3),
autunite [Ca(UO2)2(PO4)2], tyuyamunite [Ca(UO2)2(VO4)2], potassium autunite [K2(UO2)2(PO4)2]
and uranophane [Ca(UO2)2(SiO3OH)2] are important minerals [3,4]. Secondary phases minerals
which may form when sufficient uranium is leached from contaminated wastes or a disposal
system and migrates downstream. A high level of uranium is also found in phosphate rock and
lignite at concentrations that can be commercially recovered. In the presence of lignite and other
sedimentary carbonaceous substances, U enrichment takes place as a result of uranium reduction
18 | P a g e
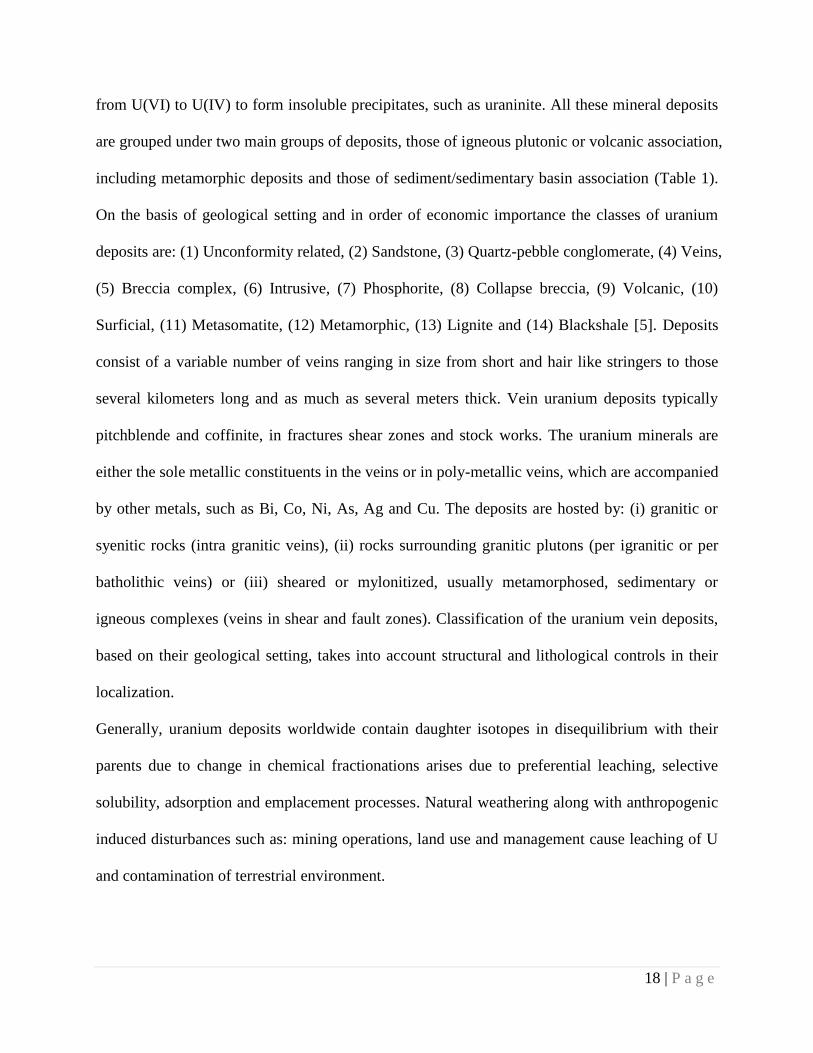
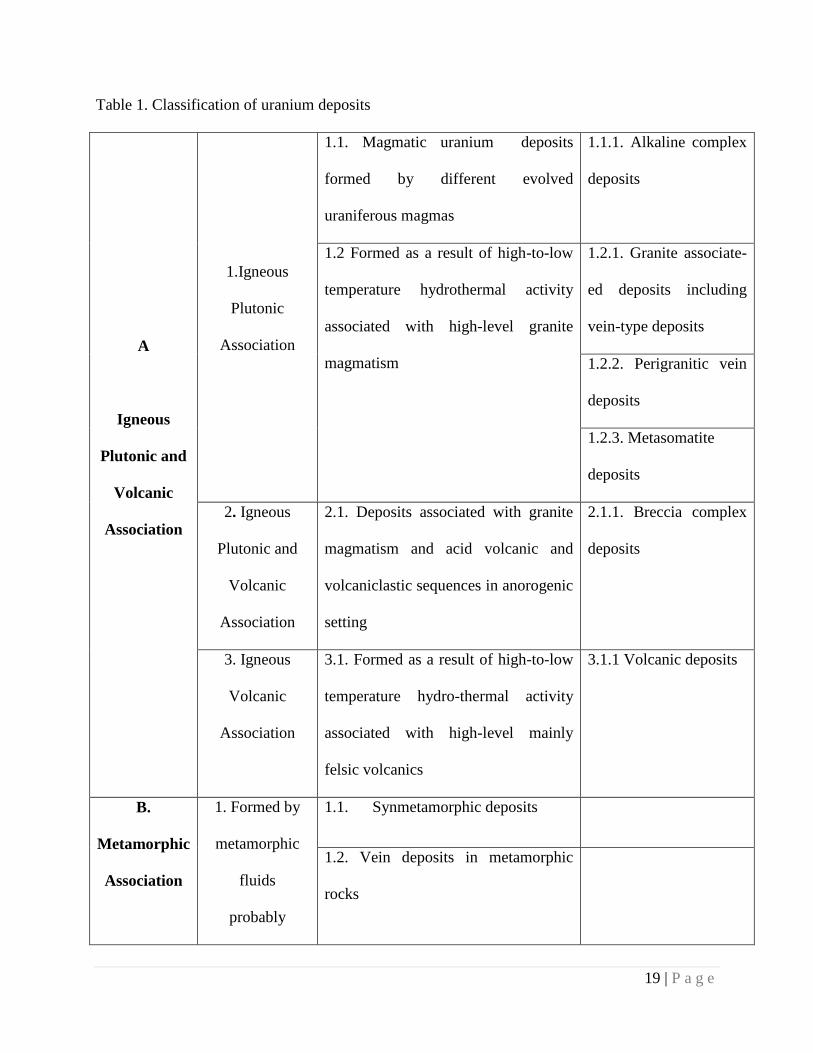
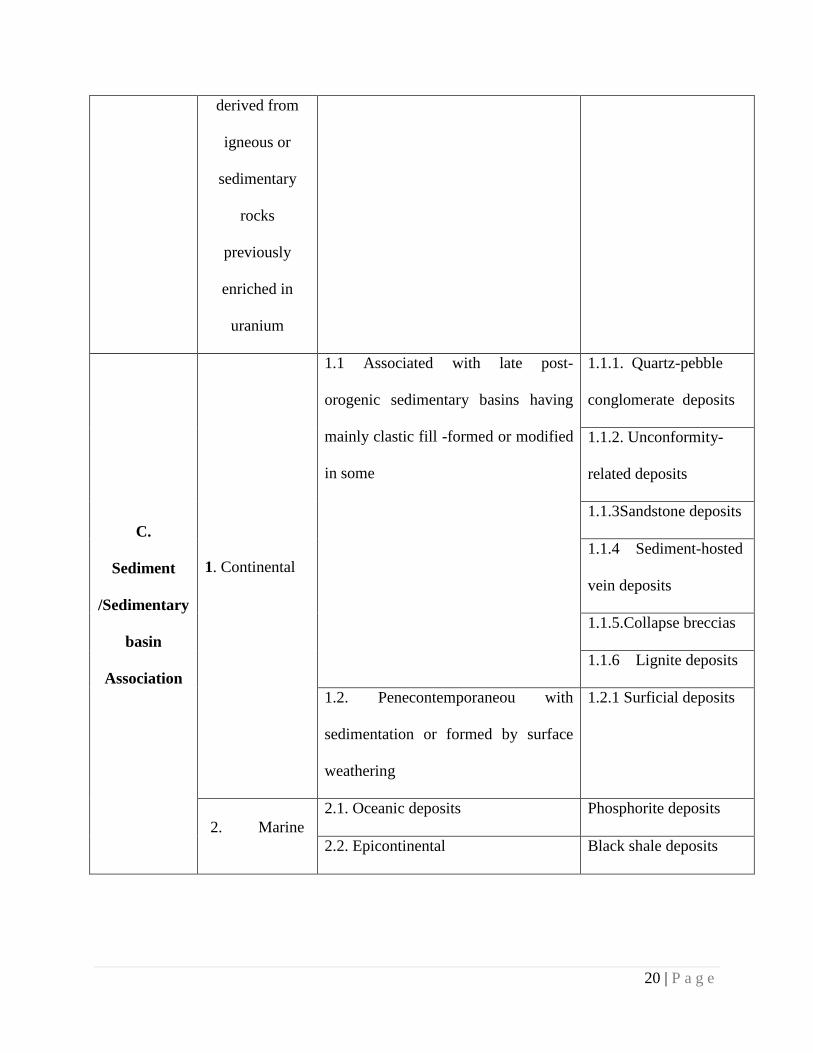
from U(VI) to U(IV) to form insoluble precipitates, such as uraninite. All these mineral deposits
are grouped under two main groups of deposits, those of igneous plutonic or volcanic association,
including metamorphic deposits and those of sediment/sedimentary basin association (Table 1).
On the basis of geological setting and in order of economic importance the classes of uranium
deposits are: (1) Unconformity related, (2) Sandstone, (3) Quartz-pebble conglomerate, (4) Veins,
(5) Breccia complex, (6) Intrusive, (7) Phosphorite, (8) Collapse breccia, (9) Volcanic, (10)
Surficial, (11) Metasomatite, (12) Metamorphic, (13) Lignite and (14) Blackshale [5]. Deposits
consist of a variable number of veins ranging in size from short and hair like stringers to those
several kilometers long and as much as several meters thick. Vein uranium deposits typically
pitchblende and coffinite, in fractures shear zones and stock works. The uranium minerals are
either the sole metallic constituents in the veins or in poly-metallic veins, which are accompanied
by other metals, such as Bi, Co, Ni, As, Ag and Cu. The deposits are hosted by: (i) granitic or
syenitic rocks (intra granitic veins), (ii) rocks surrounding granitic plutons (per igranitic or per
batholithic veins) or (iii) sheared or mylonitized, usually metamorphosed, sedimentary or
igneous complexes (veins in shear and fault zones). Classification of the uranium vein deposits,
based on their geological setting, takes into account structural and lithological controls in their
localization.
Generally, uranium deposits worldwide contain daughter isotopes in disequilibrium with their
parents due to change in chemical fractionations arises due to preferential leaching, selective
solubility, adsorption and emplacement processes. Natural weathering along with anthropogenic
induced disturbances such as: mining operations, land use and management cause leaching of U
and contamination of terrestrial environment.
19 | P a g e
Table 1. Classification of uranium deposits
A
Igneous
Plutonic and
Volcanic
Association
1.Igneous
Plutonic
Association
1.1. Magmatic uranium deposits
formed by different evolved
uraniferous magmas
1.1.1. Alkaline complex
deposits
1.2 Formed as a result of high-to-low
temperature hydrothermal activity
associated with high-level granite
magmatism
1.2.1. Granite associate-
ed deposits including
vein-type deposits
1.2.2. Perigranitic vein
deposits
1.2.3. Metasomatite
deposits
2. Igneous
Plutonic and
Volcanic
Association
2.1. Deposits associated with granite
magmatism and acid volcanic and
volcaniclastic sequences in anorogenic
setting
2.1.1. Breccia complex
deposits
3. Igneous
Volcanic
Association
3.1. Formed as a result of high-to-low
temperature hydro-thermal activity
associated with high-level mainly
felsic volcanics
3.1.1 Volcanic deposits
B.
Metamorphic
Association
1. Formed by
metamorphic
fluids
probably
1.1. Synmetamorphic deposits
1.2. Vein deposits in metamorphic
rocks
20 | P a g e
derived from
igneous or
sedimentary
rocks
previously
enriched in
uranium
C.
Sediment
/Sedimentary
basin
Association
1. Continental
1.1 Associated with late post-
orogenic sedimentary basins having
mainly clastic fill -formed or modified
in some
1.1.1. Quartz-pebble
conglomerate deposits
1.1.2. Unconformity-
related deposits
1.1.3Sandstone deposits
1.1.4 Sediment-hosted
vein deposits
1.1.5.Collapse breccias
1.1.6 Lignite deposits
1.2. Penecontemporaneou with
sedimentation or formed by surface
weathering
1.2.1 Surficial deposits
2. Marine
2.1. Oceanic deposits Phosphorite deposits
2.2. Epicontinental Black shale deposits
21 | P a g e
1.2. Aqueous Chemistry of Uranium
Uranium can exist in the +3, +4, +5, and +6 oxidation states in aqueous environments. Dissolved
U(III) easily oxidizes to U(IV) under most reducing conditions found in nature whereas U(V)
aqueous species (UO2+) readily disproportionate to U(IV) and U(VI).
2UO2+ → UO2
2++UO2
Consequently, U(IV) and U(VI) are the most common oxidation states of uranium in nature.
Uranium will exist in the +6 and +4 oxidation states, respectively, in oxidizing and more
reducing environments. Both uranium species, UO22+ and U4+, hydrolyze readily. The U4+ ion is
more readily hydrolyzed than UO22+ as would be expected from its higher ionic charge.
Langmuir calculated U(IV) speciation in a system containing typical natural water
concentrations of fluoride (0.2 mg/L), chloride (10 mg/L), sulfate (100 mg/L) and phosphate (0.1
mg/L) [4]. He observed that below pH 3, UF22+ was the dominant uranium species. Above pH 3
dissolved U(IV) preferably form hydrolytic species such as U(OH)3+ and U(OH)4(aq). Above pH
3 complexes with fluoride, chloride, phosphate and sulfate were not important. The total U(IV)
concentration in solution is generally quite low between 3 and 30 µg/L, attributes to its low
solubility [6,7]. Since Uranyl ions form polynuclear hydroxyl complexes, the hydrolysis of
uranyl ions under oxic conditions is dependent on the concentration of total dissolved uranium.
Most natural water system contains 0.1 to 10 µg/L dissolved uranium. This concentration may
rise to ≥ 1,000µg/L in the vicinity of uranium mining sites. In a carbonate free U(VI)-water
system, at pH values less than 5, UO22+is the dominant species, UO2(OH)2 (aq) at pH values
between 5 and 9 and UO2(OH)3 - at pH values between 9 and 10. This was true for dissolved
U(VI) concentrations in the range of 0.1 µg/L and 1,000 µg/L. Some poly-nuclear species such
as (UO2)3(OH)5+ and (UO2)2(OH)2
2+ are also dominated at dissolved U(VI) concentrations
22 | P a g e
≥1,000 µg/L [8]. In case of chemically more complicated systems, at pH values less than 5, the
UO2F+ species dominates the system, whereas at pH values greater than 5, carbonate complexes
[UO2CO3 (aq), UO2(CO3)22-, UO2(CO3)3
4-] and mixed hydroxo-carbonate complexes
(UO2)2CO3(OH)3- are dominating in the system. These calculations clearly indicate the
importance of carbonate chemistry on U(VI) speciation. UO22+ phosphate complexes [UO2HPO4
(aq) and UO2PO4- ] could be important in aqueous systems with a pH between 6 and 9 when the
total concentration ratio PO43-/CO3
2-> 0.1 [9]. Complexes with sulfate, fluoride, and possibly
chloride are potentially important uranyl species where concentrations of these anions are high.
Therefore, natural water systems, complexes with chloride, sulfate and phosphate were relatively
less important. However, their stability is considerably less than the carbonate and phosphate
complexes [10]. Organic ligands will also play important role in uranium aqueous speciation.
The un-complexed uranyl ion has a greater tendency to form complexes with fulvic and humic
acids than many other metals with a double positive charge [11]. This has been attributed to the
greater “effective charge” of the uranyl ion compared to other divalent metals. The effective
charge has been estimated to be about +3.3 for U(VI) in UO22+. This revealed that, relative
concentrations of hydroxide, carbonate and dissolved organic material determine the aqueous
speciation of U(VI) in ground water. Stability/ formation constant shows that tendency for U4+ to
form humic or fulvic-acid complexes is less than its tendency to hydrolyze or form carbonate
complexes [11]. Dissolution, precipitation and co-precipitation have a much greater effect on the
concentrations of U(IV) than on the concentration of U(VI) in ground waters. In general, these
processes are less effective in controlling the concentration of U(VI) in oxygenated ground
waters far from a uranium source. Near a uranium source, or in reduced environments, these
processes tend to become increasingly important and several (co) precipitates may form
23 | P a g e
depending on the environmental conditions [3, 12]. Carnotite, a U(VI) mineral, is found in the
oxidized zones of uranium ore deposits and uraninite, a U(IV) mineral, is a primary mineral in
reducing ore zones [3]. The best way to model the concentration of precipitated uranium is not
with the Kd construct, but through the use of solubility.
1.3. Sorption and Desorption of Uranium
Dissolved uranyl concentrations at solid (soil/ sediment/ Mineral/ clay)-water interface will
likely be controlled by cation exchange and sorption processes. It may adsorb onto clays [13, 14]
organics [15-17] and oxides [18, 19]. Sorption studies at different ionic strength indicate that
sorption decreases with increase in ionic strength which attributes to competition between the
uranyl ions with competing cations for exchange sites. Not only will other cations dominate over
the uranyl ion in competition for exchange sites, but carbonate ions will form strong soluble
complexes with the uranyl ion, further lowering the activity of this ion while increasing the total
amount of uranium in solution [20].
Some of the sorption processes to which uranyl ion is subjected are not completely reversible.
Oxides of iron and manganese act as a somewhat irreversible sink for uranium in soils [18, 19]
Uranium bound in these phases is not generally in isotopic equilibrium with dissolved uranium in
the same system, suggesting that the reaction rate mediating the transfer of the metal between the
2 phases is slow. Naturally occurring organic matter is another possible sink for U(VI) in soils
and sediments. The mechanisms by which uranium is sequestered by organic matter have not
been worked out in detail but plausible mechanism involves adsorption of uranium to humic
substances through rapid ion-exchange and complexation processes with carboxylic and other
acidic functional groups [17, 21-24]. These group scan form stable complexes coordinate with
the uranyl ion by displacing waters of hydration. A process such as this probably accounts for a
24 | P a g e
significant fraction of the organically bound uranium in surface and subsurface soils. In some
cases sedimentary organics may act to reduce dissolved U(VI) species to U(IV) [25]. Uranium
sorption to iron oxide minerals and smectite clay has been shown to be extensive in the absence
of dissolved carbonate [13, 18, 26]. A substantial reduction in sorption takes place in the
presence of carbonates and dissolved organic matters [18, 26]. Aqueous pH plays major role in
U(VI) sorption onto solids by influencing sorption uranium speciation and modifying the surface
of sorption medium. Most of the sorption studies reported in the literature are highly specific,
such as sorption on clay minerals, iron oxides or any synthetic adsorbent, where study of
different parameters effect are easy whereas study on heterogeneous surface such as soil is very
complicated.
1.4. Uranium Toxicological Profile
Biological effects of uranium are very similar to other heavy metals (Pb, Hg, Cd) and identified
as a nephrotoxine. Its nephrotoxic effects are more likely due to its chemical properties rather
than its radioactivity, although ingested uranium may have a radiological effect on other tissues
of deposition [27]. In general the chemical toxicity of soluble uranium compounds can even
surpass the potential radiotoxic effects. The public may be exposed to low level of uranium by
inhalation or through the diet. It may be also introduced into drinking water supplies through the
mining and milling of uranium ores [28]. Along with chemical toxicity, bio kinetics and
metabolism of uranium, including its toxic effects on kidney function, are well established.
However, there is scarcity of published observations on uranium-induced reproductive and
developmental toxic effects [29]. The latest experimental studies in mammals have demonstrated
that during pregnancy, maternal stress may enhance the metal-induced adverse effects on
embryo/fetal and postnatal development [30]. In addition to kidney brain could also be a
25 | P a g e
potential target organ after uranium exposure. Central effects were observed, even though
uranium levels in brain were very low [31]. Many isolated studies were published on the
mechanism for the toxic effects of uranium at moderate to high acute doses on experimental
animals. However, from the ethical point of view, only a few works were done on the bio-effects
of chronic uranium intakes by human [32]. The radiological hazard of depleted uranium is less
than that from natural and enriched uranium. Excess inhalation exposure to insoluble uranium
compounds, can lead to increased cancer risk due to internal exposure to radioactivity. In
contrast, insoluble compounds are poorly absorbed from the gastro-intestinal tract (GIT), hence
generally have low toxicity [28, 33, 34]. The renal and respiratory effects from exposure to
uranium by humans and animals are usually attributed to its chemical properties (chemotoxicity),
whereas theoretically potential excess cancers are usually attributed to its radiation properties
[35-37]. In general, large doses of ionizing radiation have the actual or theoretical potential of
being teratogenic, carcinogenic and mutagenic. DNA has been found to be the most
radiosensitive biological molecule, and ionizing radiation can damage individual chromosomes.
The main result from low level ionizing radiation exposure is the potential damage of DNA or
fragmentation. Practicable cells repair the damage but these errors can result in production gene
mutation or chromosomal aberrations. However, animal studies indicate that there is no
observable damage to the biological system below certain levels of exposure [38-40]. The recent
studies on animals suggest that large exposure to ionizing radiation can both initiate and promote
carcinogenesis, and interfere with reproduction and development [38-40]. The most sensitive
indicator of uranium toxicity to mammals is nephrotoxicity. While acute high level exposure to
uranium compounds can clearly cause kidney diseases in human beings, the evidence for similar
toxicity as the result of long-term lower level occupational exposure have not noted an increase
26 | P a g e
in deaths from uro-genital or renal diseases following occupational exposure to uranium [41, 42].
Most studies of respiratory diseases reported for uranium involve non cancerous damage of
alveolar epithelium cell, characterized by interstitial inflammation of the alveolar epithelium
leading eventually to serious diseases, which reduce respiratory function of lungs [37, 43].
Biogenetics of uranium mainly depends on the chemical form administrated or the route of
exposure. On the other hand, its uptake and retention by the kidney and skeleton is a function of
age, gender and the mass of uranium ingested [44]. The human body naturally contains
approximately 56 μg of uranium, 32 μg (56%) are in the skeleton, 11 μg in muscle tissue, 9 μg in
fat, 2 μg in blood and less than 1 μg in lung, liver and kidneys [45]. Absorption of uranium is
low by all exposure routes (inhalation, oral and dermal). Absorption of inhaled uranium
compounds takes place in the respiratory tract via transfer across cell membranes. The deposition
of inhaled uranium dust particles in the lungs depends on the particle size and its following
absorption used to be effected by its solubility in biological fluids. Estimates of systemic
absorption from inhaled uranium-containing dusts in occupational settings based on urinary
excretion range from 0.76 to 5%. Gastrointestinal absorption of uranium can vary from < 0.1 to
6% depending on the solubility of the uranium compound. Studies in volunteers indicate that
approximately 2% of the uranium from drinking water and dietary sources is absorbed in humans.
Another comprehensive review shows that the absorption is 0.2% for insoluble compounds and
2% for soluble hexavalent compounds [46-48]. Concerning dermal absorption, toxicity
experiments in animals indicate that water soluble uranium compounds are the most easily
absorbed ones. Once in the blood, uranium is distributed to the organs of the body. U in body
fluids generally exists as the uranyl ion complexed with anions such as citrate and bicarbonate.
27 | P a g e
Uranium preferentially distributes to bone, liver and kidney. Half-times for retention of uranium
are estimated to be 11 days in bone and 2 to 6 days in the kidney.
1.5. Issues Related to Uranium in World
There are strict regulatory policies for the management of radioactive waste, with international
standards, guidelines and recommendations (from the International Atomic Energy Agency).
However, during the early development civil applications of nuclear power and of military,
statutory regulations were weaker and poor working practices resulted in the contamination of
many sites of world. Controlled discharges and accidental leakage from plant buildings, waste
storage vaults, underground tanks, shallow unlined burial trenches and nuclear weapon tests
released radionuclides into the environment [49, 50]. Their subsequent migration through the
surrounding environment has resulted in a significant legacy of ground waters, soils and
sediments contaminated with complex mixtures of radionuclides [51]. Uranium is present in the
environment as a result of discharges from the nuclear industries, leaching from natural deposits,
releases from mill tailings, combustion of coal, other fuels and the use of phosphate fertilizers. U
existing in soil can be dissolved in solution, or ion exchanged in reaction, complex with soil
organics or precipitate as pure or mixed solids. They can move into the water, air and the food
supply. The immobility of uranium in upper most soil layers represents a problem for
environment and human health, since they can be easily integrated in the food chain.
Consequently, the major part of radionuclides released into the environment will finally
accumulate in either the upper layer of soils or interstitial system of sediments in aquatic systems.
As a consequence, a risk for ecosystems, agro-systems and health could be induced. In particular,
uranium mining and milling have caused enormous environmental effect by means of abandoned
waste accumulation and improper disposal of the radioactive material, waste dump after uranium
28 | P a g e
extraction, especially in the last 60 years. Large amounts of uranium-containing (both high and
low-level) waste are generated from activities such as fuel fabrication, fuel reprocessing,
research and development (R&D). All these negative impacts influenced the quality of the
environment and affect mainly surface and ground waters, soils and simultaneously polluted
great areas of land and endangered the catchments of drinking water. Uranium generates an
important issue against public perception on the risk that the environmental contamination poses
to the environmental and human health [52]. Therefore, it is strongly evident that the
contamination caused by uranium has negative biological effects on important groups of the soil
food web [53].The potential risk of uranium in soil contamination is a global problem about
every country can be affected by one or more activities mentioned above. For a long period of
time uranium was leached commercially in a large number of deposits using different in situ
technologies [54-56], either alkaline leaching using solutions containing carbonate and
bicarbonate, or acid leaching. The solubility of uranium in soil is dependent on several factors
such as: pH, redox potential, soil texture, organic and inorganic compounds, temperature,
moisture and microbial activities [57]. Several years ago, all commercial-scale operations for
uranium leaching were stopped due to a complex of different political, economic and
environmental reasons [58]. However, regardless of some preventive and remedial actions during
the uranium recovery, many natural ecosystems were heavily contaminated with radioactive
elements, mainly through the seepage of acid drainage waters [59-61]. Such waters are still a
persistent environmental problem for many abandoned mine sites, while soils around the water
flow path are polluted with radioactive elements becoming unsuitable for agricultural use.
Countries (e.g. Canada, Germany) where the annual rate of precipitation is higher than the
evaporation rate uranium tailing are frequently close to groundwater that connects with creeks,
29 | P a g e
rivers and lakes. Therefore, leaching of uranium can contaminate large volumes of water
followed by sediment. In countries with arid to semi-arid weather (e.g. Australia, western USA)
groundwater contamination is a serious problem as well because of the limited quantities of
water available for aquatic fauna, for irrigation and as drinking water [62]. Inappropriate
conditioning and disposal of mill tailings waste permit the contamination to spread into soil,
sediment, water bodies. Under aerobic and anaerobic conditions, dissolution or immobilization
of uranium is affected or can be affected by one or more of the following processes:
a) Changes in pH and redox that result in changes of the speciation and/or oxidation state,
b) Complexation such as chelation by siderophore and other microbial products and by
inorganic species such as carbonate and phosphate.
c) Change in soil and water quality parameters induced by climatic change is one of the
challenging factors for today.
However, uranium is known to occur at higher levels, frequently in smaller supplies. For
example, uranium concentrations of up to 700 μg/L have been found in private supplies in
Canada [63] Concentrations in excess of 20 μg/L have been reported in groundwater from parts
of central Australia [64, 65] and New Mexico, USA [66]. In a case study of 476 Norwegian
groundwater samples, about 18% had uranium concentrations in excess of 20 μg/L [67]. A study
in Finland examined a population receiving drinking-water containing uranium with a median
concentration of 28 μg/L [68]. In addition to this soil and sediment of most of the Department of
Energy (DOE) site of USA are heavily contaminated.
Uranium Related issue in India: As discussed in previous sections uranium is a ubiquitous
element, hence it is present in all environmental matrices such as water, soil, sediment, food
materials and biota. On a global basis, its concentration in soil varies from 1-5 mg/kg while in
30 | P a g e
water it varies from 1-3 µg/L. Major amount of uranium for Indian nuclear power is extracted
from mining operations in Jharkhand and Andhra Pradesh. These mining operations are carried
out safely as prescribed by the regulatory body ensuring that there is no damage to people or
environment around the mining sites.
As per Atomic Minerals Directorate (AMD) of India groundwater of many part of India contains
high level of uranium. Maximum uranium concentration was reported for Kadappa district (5.8
mg/L), Andhra Pradesh followed by Betul (5.2mg/L) of Madhya Pradesh and Sikar (5.1 mg/L) of
Rajasthan. But Uranium in groundwater issue was highlighted for Punjab in the year 2009 and
concentrations in excess (in the range of 2–644 μg/L with a mean value of 73.1 μg/L) have been
reported in groundwater. About 42% of total water samples were observed to be beyond
permissible limits (~60 μg/L) of India [69].
1.6. Missing Area in Literature
All over the world, plenty of literature are available related to uranium in environment and
related issues covering, geochemistry of uranium, migration of uranium in geosphere and
hydrosphere (specifically near mining sites), speciation of uranium in aqueous systems, sorption
of uranium onto different minerals, determination of partition coefficient (Kd) of uranium in
minerals and soil of local interest, case studies related to uranium in soil, water etc. Various
remediation techniques specifically recovery of uranium from contaminated soils and water by
bio-reduction, bio-accumulation, bio-sorption and phyto-remediation have been extensively
discussed in literature [70-71]. In addition to this development of analytical techniques for
estimation and quantification of uranium in different environmental matrices were also well
reported in literatures [72]. In India very few studies were carried out with respect to uranium in
environment, which mainly focused on speciation in ground water [69], chemo toxicity and radio
31 | P a g e
toxicity in terms of risk analysis [73], Uranium geochemistry study by isotopic ratio analysis [74]
etc.
As mentioned earlier, the major concern in the country with respect to uranium is its natural
existence as observed in Punjab and many other potential areas. It is reported that the source of
uranium is geogenic in nature. The observation of uranium in specific locations needs further
systematic investigation. Detailed lab studies need to be carried out to understand the migration
of uranium in different soil / mineral-water systems. These studies will help in understanding the
influential physico-chemical processes which leads to the leaching of uranium to the ground
water. The quantification of various parameters will also help in predicting the potential areas of
expected uranium contamination in other parts of the country. Physico-chemical properties of
both soil and water in contact will influence the kinetics of leaching of uranium and the
equilibrium concentration in water system. The properties of soil include the mineralogy, particle
size, anionic / cationic content and organic content. The influential properties of water include
pH, ionic strength and redox potential. The prediction also needs the information regarding the
long term changes in the above mentioned parameters due to build up of CO2 content, depletion
of ground water, etc. These studies will also help in safety assessment of uranium waste disposal
in Near Surface Disposal Facicities (NSDF) and Deep Geological Repositories (DGR).
From environmental protection point of view migration study of uranium from soil/ minerals to
aqueous phase and speciation of uranium in both the phases in terrestrial environment is a major
concern. Limited studies were reported regarding the migration of uranium along groundwater
pathways in terms of transport modeling and restricted to mining sites only. No study was found
regarding change in speciation and migration behavior of uranium with changing environmental
conditions (or climatic change) and following questions are still unanswered.
32 | P a g e
a) What is the mechanism by which uranium will remain bound to the soil or mobilized
from soil or from ore minerals?
b) What will happen to speciation and mobility of uranium in contaminated soil over time
scale?
c) What will be effect of changing environmental conditions (increased salinity, CO2, soil
and water parameters etc.) on mobility and speciation of uranium at soil water and ore-
water interface?
d) What are the important things to be included considering future environmental conditions
in safety assessment of uranium waste disposal in Near Surface Disposal Facilities
(NSDF) or Deep Geological Repositories (DGR).
1.7. Objective of study
From environmental protection and assessment point of view it is very much important to study
the migration of uranium in terrestrial environment especially at soil-water and mineral-water
interface. Uranium may behave differently with respect to different water types, soil types and
mineral types. Therefore, any change in soil/ mineral and water parameters significantly affect
the behavior of uranium in terms of speciation, mobility and toxicity. Current issue of climatic
change also significantly affects the soil and water physicochemical parameters, which may
accelerate or de-accelerate mobility of uranium in terrestrial environment. This contamination
may leads to an uncontrolled source of uranium in future. Looking at the missing area of
literature and considering current environmental scenario the research work was initiated to
understand the change in migration and speciation of uranium in terrestrial environment in
response to change in environmental conditions and to identify the complexities involved in the
process. Lab experiments were carried out to reveal the complexities of uranium behavior at soil-
33 | P a g e
water, ore-water interface in terms of mechanism of sorption and/or desorption, factor
influencing the process, energy released or absorbed during the process. In short the thesis aims
to fulfill missing area of the literature and answer the question.
1.8. Scope of the Study
The scope of this work encompasses a systematic study of the behavior of uranium in terrestrial
environment namely soil–water and ore–water interface with main focus on migration and
speciation. Though the laboratory study is site specific in nature, it has global application since
the experiments were carried out on varieties of soil types, uranium ore minerals. The
experimental results will be helpful for simulating migration of uranium in future environment
also. The thesis comprises,
a) Behavior of uranium at soil-water and ore-water interfaces and factors affecting the
migration and speciation at the interface.
b) Prediction of behavior of uranium at soil-water interface in terms of kinetics and
thermodynamics of uranium sorption, sorption mechanism, effect of soil parameters and
parameter sensitivity.
c) Speciation of uranium in contaminated soil and change in speciation with time.
d) Effect of salinity, CO2 and other soil parameters on migration and speciation of uranium at
soil-water interface.
e) Role of salinity, CO2 and water parameters on migration and speciation of uranium at ore-
water interface.
34 | P a g e
Chapter 2
Experimental Methods and Techniques
2.1. Introduction
Mechanistic description of migration of uranium from solid (Soil/ Minerals) to solution (Water)
phase in terrestrial environment requires an understanding of physico-chemical behavior of
uranium in environment. The parameters which are needed to be addressed in a terrestrial
environment include:
a. Sorption studies of uranium in varying soil types including estimation of Kd, kinetics and
thermodynamics of sorption, mechanism of sorption in terms of adsorption isotherms,
impact of soil parameters and water quality parameters on migration of uranium from soil
to water in contact.
b. Study of aqueous speciation of uranium at soil water interface and chemical fractionation
in different soil fractions.
c. Studies on the factors affecting migration of uranium at ore-water interface and change in
speciation at interface.
Fitting of sorption data to different kinetic models gives idea about kinetics of sorption, fitting to
isotherm models reveals the sorption mechanism. Similarly fitting of sorption data at two or
more temperatures reveals the thermodynamics of sorption, which is helpful for modeling the
sorption kinetics and thermodynamics. Most frequently used methodology to study sorption
kinetics and thermodynamics is batch sorption method and in this thesis work batch sorption
method was adopted.
35 | P a g e
Study of speciation of uranium in aqueous medium can be performed both analytical method
using advanced instrumental facilities and theoretical speciation modeling (analytical method in
conjunction with chemical speciation model). Among analytical ‘techniques synchrotron based
techniques such as; Extended X-Ray Absorption Fine Structure (EXAFS), Near Edge X-Ray
Absorption Fine Structure (NEXAFS) spectroscopies and laser based fluorescence technique:
Time Resolved Laser Induced Fluorescence (TRLIF) techniques are widely used. But the
limitation of synchrotron based technique is it requires high concentration (×100 ppm) of
analytes (Uranium) in sample. Therefore theoretical calculation using chemical speciation
modeling is most suited one at lower concentration in aqueous medium and is used in this
dissertation work.
Speciation of uranium in solid phase (soil/sediment/ minerals) can be performed: a) Chemical
extraction (sequential extraction and bicarbonate extract for U specially) and b) analytical
methods (especially spectroscopic techniques). In analytical techniques similarly, EXAFS,
NEXAFS and X-ray Photo electron spectroscopy (XPS), TRLIF are widely used. But all these
techniques are not successful at low concentrations except TRLIF. Here in this work chemical
extraction method along with XPS was used in some cases.
All these studies required a complete characterization of soil (or solid phase) and aqueous
medium (water). Characterization soils or ore minerals involve both physical and chemical
characterization. Physical characterization comprises study of mineralogical composition by
means of X-ray diffraction (XRD), Textural analysis by using particle size analyzer (PSA),
measurement of pH, Eh, cation exchange capacity (CEC) of the soil and ore minerals. Chemical
characterization involves the measurement of major elemental composition of interest by means
of Atomic absorption spectroscopy, voltammetry, CHNO-S analyzer etc. Physico-chemical
36 | P a g e
characterization of aqueous medium (water) mainly involves estimation of pH, Eh and major
ions and metal of interest. Concentration of major ions can be estimated by Ion-Chromatographic
techniques, carbonate and bicarbonate concentration by titrimetrically. Details of the techniques
used for the study are discussed in following sections.
2.2. Techniques for Soil and Mineral Characterization
2.2.1. Mineralogical Study Using X-ray Diffraction (XRD): XRD is one of the most powerful
non-destructive techniques for the study of crystal structures and mineralogical studies. It is
based on constructive interference of monochromatic X-rays and a crystalline material. The
following equation governed by Bragg’s Law relates the wavelength of electromagnetic radiation
(λ) to the diffraction angle and the spacing lattice in crystalline samples, which in turn used for
identification of mineral phases:
nλ=2d sinθ (2.1)
An XRD pattern obtained by scanning the sample through a 2θ angle-range contains all possible
diffraction directions of the lattice due to the random orientation of the sample. Position of the
diffracted peaks gives information about the atoms arrangement within the crystalline compound,
intensity can be used to evaluate the type and nature of the atoms and the FWHM peaks is used
to determine crystalline size and micro-strain in the sample. Quantitative analysis of crystalline
phases can also be performed.
Sample preparation: Sample preparation is an important aspect of soil mineralogical analysis by
XRD. Preparatory procedures must be judiciously selected according to the objectives. The
simplest preparation procedure is to grind the soil “as is” into a powder fine enough to mount in
the focal plane of the Diffractometer. The sample preparation of soil for XRD involves the
37 | P a g e
removal of interfering factors namely salts, carbonates, organic matter and amorphous iron etc.
The stepwise procedure used in XRD analysis of sample is as follows:
Take about 5g of milled/ grinded, homogenized soil sample in a centrifuge tube add 50 mL of
deionized water with continuous shaking and proceeds stepwise as mentioned below:
a) Removal of salt: if the EC of soil solution is in the greater then 2d Sm-1 wash the soil
with deionized water till the EC fall down to ≤ 1dS m-1. Then centrifuge and take residual
soil samples for next treatment.
b) Removal of Carbonate minerals: Add 50 mL of sodium acetate (1M) of pH 5 to the soil
keeping it in a water bath and stir continuously. Check for effervescence to confirm
destruction of carbonates. After the bubbling stops, place the bottle in the centrifuge and
centrifuge at about 1500 rpm for 5 min. Decant and discard the clear supernatant fluid.
Again wash the soil at least two times with deionized water and discard the washings
after centrifugation.
c) Removal of organic matter: Add approximately 20 mL of water to the soil sample
remaining in the centrifuge bottle. Heat the bottle to 80°C in a water bath or on a steam
table. Add approximately 1 mL of H2O2 to the centrifuge bottle. When the oxidation of
organic matter begins, as indicated by frothing, add a few drops of acetic acid or acetone
and stir constantly. Continue addition of H2O2 and acetic acid with stirring till frothing
subsided. Wash the soil with deionized water, centrifuge and discard washings.
d) Removal of Amorphous Iron: Add about 50 mL of citrate buffer solution and heat the
bottle to 75 to 80°C in a water bath. Then add approximately 1 g of Na2S2O4 to the bottle.
Stir continuously for 1 min, and then occasionally for 5 min. Add a 2 g of Na2S2O4 and
38 | P a g e
stir as described above. After 10 to 15 min, remove the bottle from the water bath and
cool. Place the bottle in the centrifuge and centrifuge at about 1500 rpm for 5 min.
Decant and discard the clear supernatant fluid. Then wash the soil with deionized water,
centrifuge and discard washings.
Now the sample is ready for XRD analysis. Mount the sample on sample holder and take
diffraction pattern. Mineralogical identification can be carried out by comparing the pattern with
the mineral data library In the current research work, for characterization of soil and mineral
samples APD 2000 PRO X-Ray Diffractometer (Make GNR, Italy) is used, in which Cu Kα is
used as X-Ray source. Finally identification of mineral were carried out by comparing the
diffraction pattern of sample with the ICDD mineral database
2.2.2. Textural Analysis using Particle Size Analyzer (PSA)
Particle size information is extremely important for studying the sorption kinetics and
thermodynamics. There are three techniques such as: a) low angle light scattering, b) dynamic
light scattering and c) photo sedimentation are available till today for PSA. Among these
techniques low angle light scattering also called laser diffraction is most commonly used
technique. From instrumentation point of view, beam from continuous wave (CW) laser, usually
He-Ne laser and fiber laser is collimated and passed through the sample, where scattering from
particles occurs. The beam is then focused on a detector array where scattering pattern, shown in
Fig. 2.1 as a diffraction pattern, is measured. The scattering pattern then analyzed according to
theoretical models to give the particle size distribution. The combination of two optimized
technologies (CILAS patent) enables the instrument to cover the whole range in one single
measure, without any mechanical adjustment or optical realignment. The fine particles are
measured by capturing the diffraction pattern, and applying Fraunhofer or Mie theory. The
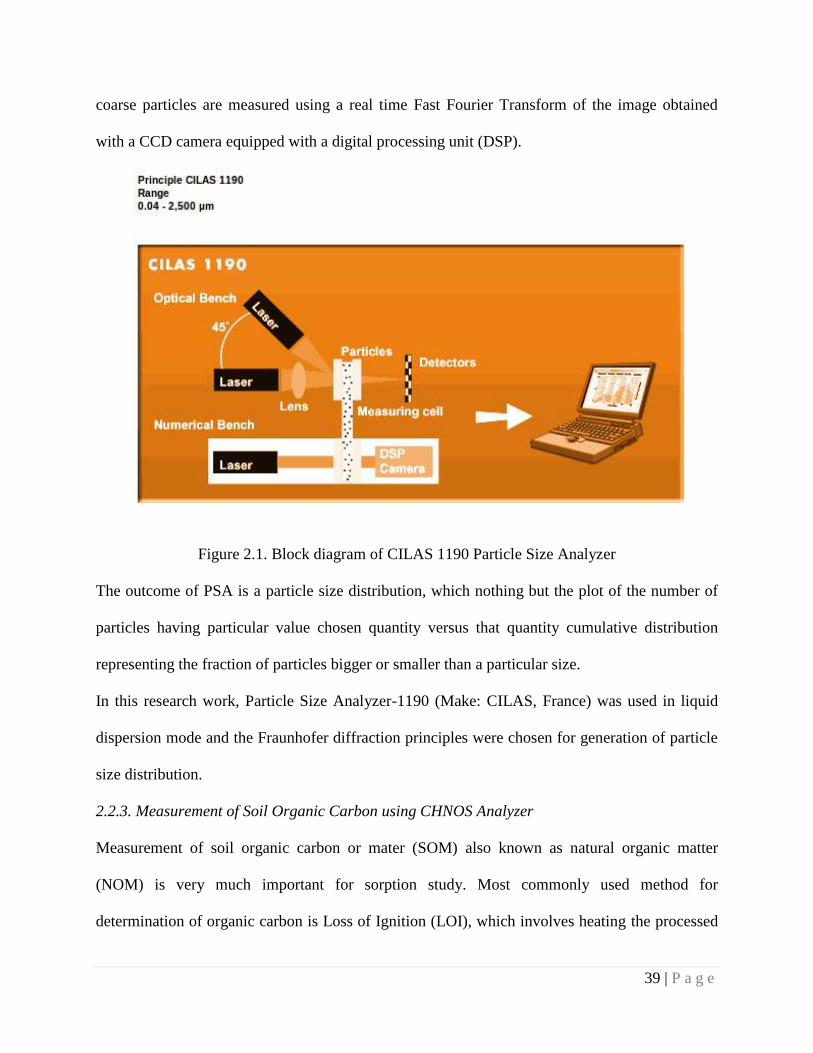
39 | P a g e
coarse particles are measured using a real time Fast Fourier Transform of the image obtained
with a CCD camera equipped with a digital processing unit (DSP).
Figure 2.1. Block diagram of CILAS 1190 Particle Size Analyzer
The outcome of PSA is a particle size distribution, which nothing but the plot of the number of
particles having particular value chosen quantity versus that quantity cumulative distribution
representing the fraction of particles bigger or smaller than a particular size.
In this research work, Particle Size Analyzer-1190 (Make: CILAS, France) was used in liquid
dispersion mode and the Fraunhofer diffraction principles were chosen for generation of particle
size distribution.
2.2.3. Measurement of Soil Organic Carbon using CHNOS Analyzer
Measurement of soil organic carbon or mater (SOM) also known as natural organic matter
(NOM) is very much important for sorption study. Most commonly used method for
determination of organic carbon is Loss of Ignition (LOI), which involves heating the processed
40 | P a g e
solid sample (soil) at 450 to 5000 C for two hours and measure the mass loss. In the other way it
can be estimated using CHNO-S elemental analyzer, which involves two steps:
a) Removal of inorganic carbon by acid treatment (1N HCl) followed by
b) Measurement of carbon using CHNOS elemental analyzer.
The analysis required high temperature combustion (9000C) in an oxygen- rich environment, in
the combustion ‘C’ is converted to CO2. The combustion products are swept out of the
combustion chamber by inert carrier gas such as helium and passed over heated (about 600oC)
high purity Cu. The function of Cu is to remove any oxygen not consumed in the initial
combustion and to convert any oxides of nitrogen to nitrogen gas. The detection of CO2 carried
out by gas chromatographic separation followed by quantification using thermal conductivity
detector (TCD).
2.2.4. Measurement of soil Cation Exchange Capacity (CEC)
The CEC of a soil is a measure of the quantity of -ve charged sites on soil surfaces that can retain
+ve charged ions or cations by electrostatic forces. Cations retained electrostatically are easily
exchangeable with cations in the soil solution so a soil with a higher CEC has a greater capacity
to maintain adequate quantities of cations than a soil with a low CEC. It is one of the important
soils parameter determines contaminate mobility. CEC is normally expressed in one of two
numerically equivalent sets of units: meq/100 g (milli equivalents of charge per 100 g of dry soil)
or cmolc/kg (centi-moles of charge per kilogram of dry soil). There are various methods are
available in literature for soil CEC measurement, but method proposed by Chapman, 1965 and
Bower et al.,1952, is most widely used [75,76]. Steps involved in CEC estimation is as follows.
41 | P a g e
a. Take 4 g of soil in a 50 mL falcon tube then add 33 mL of the 1M NaOAc (1 M, pH 7)
shake in a mechanical shaker for 10 minutes and centrifuge it until the supernatant
become clear.
b. Decant the supernatant and repeat the step ‘a’ at least two more times.
c. Add 33 mL of isopropyl alcohol to residue in the tube shake in a mechanical shaker for
10 minutes and centrifuge it until the supernatant become clear. Repeat the steps at least 2
times.
d. Add 33 mL of NHOAc solution, stopper the tube, shake it in a mechanical shaker for 5
min and centrifuge it until the supernatant liquid is clear. Decant the washing into a 100-
mL volumetric flask. Repeat the steps for two more times.
e. Dilute the combined washing to the 100-mL mark with ammonium acetate solution and
determine the sodium concentration by atomic absorption, emission spectroscopy, or an
equivalent method
Where Na+ is reported in mg (Na+)/L:
CEC (cmolc/kg) = (Na+ in extract) / 23 (2.2)
Cation Exchange Capacity (CEC) was calculated using following empirical relation described by
Breeeuwsma, 1986 [77].
CEC (meq/100g) = 0.7 (%clay) + 3.5 (% Organic carbon) (2.3)
2.2.5. Estimation of Fe and Mn
Fe and Mn play a major role in migration of uranium in terrestrial environment, hence it is very
much important for sorption/ migration study. Various techniques are used for estimation of Fe
and Mn in soil such as AAS, ICP-OES, ICP-MS and XRF etc. In the current research work AAS
42 | P a g e
was used, which is a destructive techniques and require sample in liquid form. Hence estimation
of Fe and Mn in soil involves two steps:
a) Acid Digestion of soil or minerals to bring it to liquid form
b) Analytical estimation
Conventionally digestion of soil or any mineral samples were carried out by taking soil in
mixture of HNO3, HF and H2O2 (3:2:1) heating on hotplate till complete digestion or destruction
of matrix (Per chloric acid also used). After complete dissolution liquid aliquot need to be diluted
to desired volume using 0.25% HNO3 followed by analysis using either of the techniques
discussed above. Now days Microwave assisted acid digestion is most widely used, since the
technique is efficient, low chemical and least time consuming.
In the present study microwave assisted acid digestion was carried out using Mile stone s. r. l
Ethos 1, followed by analysis using AAS calibrated for Fe and Mn.
2.3. Physico-Chemical characterization of Aqueous Phase
Physico-chemical characterization of water/aqueous phase in contact with soil/ minerals is very
important since it controls the behavior of U or any metals at soil/mineral-water interface. The
important parameters defines the physiochemical properties of aqueous phase are, pH, Eh,
alkalinity major ions (Na+, K+, Mg2+ , Ca2+ , F-, Cl- , NO3-, SO4
2 – and PO43-). In the present study
pH and Eh of water samples were directly measured using Aquaread-1000 meter, whereas in
case of soil and ore minerals, Soil/Mineral to water slurry 1:10(g/mL) was prepared followed by
measurement of parameters. Major ions; Na+, K+, Mg2+ , Ca2+ , F-, Cl- , NO3-, SO4
2 -, PO43- were
estimated using ion-chromatographic techniques whereas alkalinity ( CO32- and HCO3
- ) was
estimated titrimetrically using Auto tritrator (798 MPT Tritrino, Metrohm)
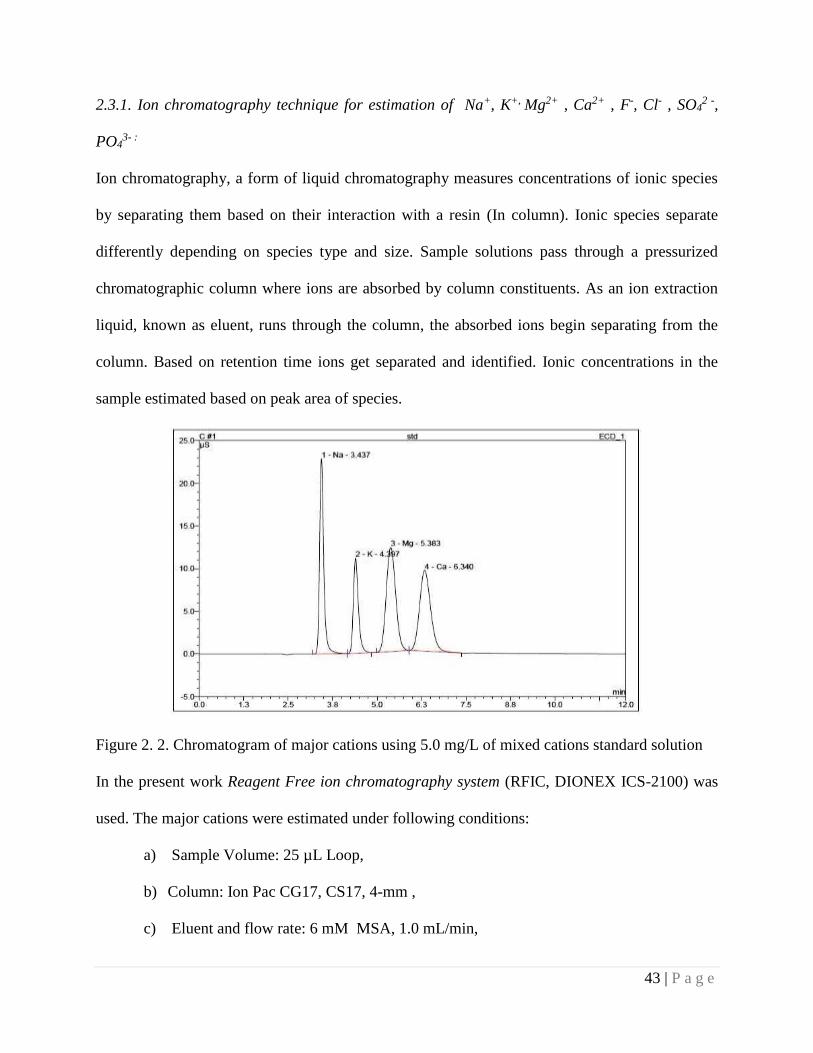
43 | P a g e
2.3.1. Ion chromatography technique for estimation of Na+, K+, Mg2+ , Ca2+ , F-, Cl- , SO42 -,
PO43- :
Ion chromatography, a form of liquid chromatography measures concentrations of ionic species
by separating them based on their interaction with a resin (In column). Ionic species separate
differently depending on species type and size. Sample solutions pass through a pressurized
chromatographic column where ions are absorbed by column constituents. As an ion extraction
liquid, known as eluent, runs through the column, the absorbed ions begin separating from the
column. Based on retention time ions get separated and identified. Ionic concentrations in the
sample estimated based on peak area of species.
Figure 2. 2. Chromatogram of major cations using 5.0 mg/L of mixed cations standard solution
In the present work Reagent Free ion chromatography system (RFIC, DIONEX ICS-2100) was
used. The major cations were estimated under following conditions:
a) Sample Volume: 25 µL Loop,
b) Column: Ion Pac CG17, CS17, 4-mm ,
c) Eluent and flow rate: 6 mM MSA, 1.0 mL/min,
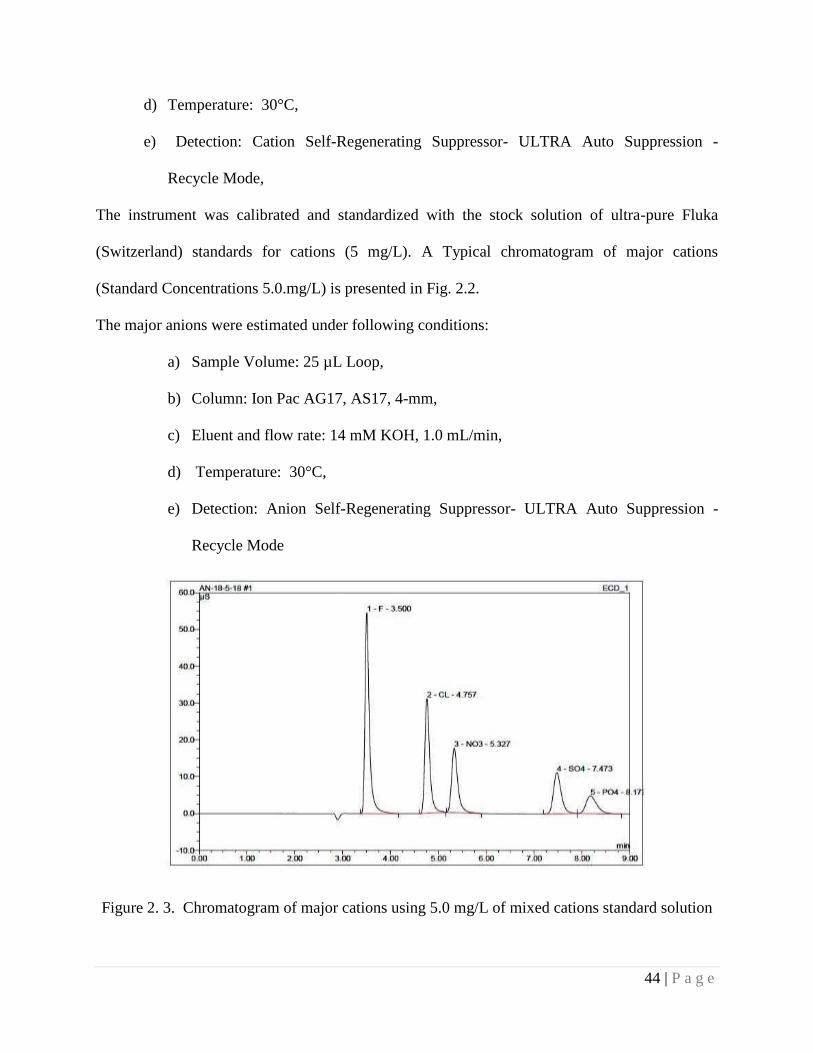
44 | P a g e
d) Temperature: 30°C,
e) Detection: Cation Self-Regenerating Suppressor- ULTRA Auto Suppression -
Recycle Mode,
The instrument was calibrated and standardized with the stock solution of ultra-pure Fluka
(Switzerland) standards for cations (5 mg/L). A Typical chromatogram of major cations
(Standard Concentrations 5.0.mg/L) is presented in Fig. 2.2.
The major anions were estimated under following conditions:
a) Sample Volume: 25 µL Loop,
b) Column: Ion Pac AG17, AS17, 4-mm,
c) Eluent and flow rate: 14 mM KOH, 1.0 mL/min,
d) Temperature: 30°C,
e) Detection: Anion Self-Regenerating Suppressor- ULTRA Auto Suppression -
Recycle Mode
Figure 2. 3. Chromatogram of major cations using 5.0 mg/L of mixed cations standard solution
45 | P a g e
The instrument was calibrated and standardized with the stock solution of ultra-pure Fluka
(Switzerland) standards for anions (5 mg/L). A Typical Chromatogram of major anions
(Standard Concentrations 5.0 mg/L) is presented in Fig. 2.3.
2.3.2. Measurement of alkalinity titrimetrically
Alkalinity is the measure of how much acid it takes to lower the pH of a water sample enough to
convert all bicarbonate (HCO3–) and carbonate (CO3
2–) to carbonic acid (H2CO3). Although total
alkalinity is equal to the stoichiometric sum of all bases in solution, it is mainly considered due
to carbonates and bicarbonates. To measure alkalinity, water sample is titrated with an acid to an
end point at which carbonate is converted to bicarbonate and bicarbonate is converted to
carbonic acid. Based on equilibrium chemistry of CO32- and HCO3
- in natural water system
CO32- is the dominating species controlling the alkalinity of the system above pH 8.3 to 10,
whereas 4.2 to 8.3 is due to bicarbonate. , volume (V1) of acid consumed to achieve pH 8.3 used
for calculation of CO32- concentration whereas, volume (V2) required to achieve pH 4.2 from 8.3
used for HCO3-calculation.
In the current study acid base (0.02N HCl) titration was carried out using Metrohm make auto-
tritrator. Volume of acid consumed to achieve pH 8.3 (V1) and then 8.3 to 4.2 (V2)
automatically registered, which is used for calculation of concentration of CO32- and HCO3
-
using following equation
(2.4)
Where,
T-Titre value in ml (V1: for Carbonate, V2: for Bicarbonate)
N - Normality of standard sulphuric acid (0.02N)
E - Equivalent weight of CaCO3 (50)
V
ENasCaCOLmgAlkalinity
1000(V1/V2) T)/( 3
46 | P a g e
V - Volume of sample taken in mL
2.4. Analytical method for Uranium estimation
Uranium is one of few naturally occurring radionuclides and can be determined by direct
radiometric techniques. These techniques, however, are limited in their applicability due to the
low specific activity and low concentrations at which it is typically found in nature. Among the
most frequently used techniques belong: spectrophotometry, radiometric methods (α -
spectrometry, γ- spectrometry), techniques of neutron activation analysis atomic spectrometric
techniques (AAS - atomic absorption spectrometry, AES - atomic emission spectrometry, ICP -
AES-inductively coupled plasma -atomic emission spectrometry, X - ray fluoresce), mass
spectrometry and numerous electrochemical methods. ICP-MS is an interesting alternative
method for uranium determination. This method has several advantages, e.g. short analysis
duration, low detection limits (ng/L), low sample consumption and minimum of spectral
interferences [78]. Voltammetric techniques are known to show unique advantages both
economical (low initial and running costs) and strictly analytical (the ability to determine low
levels of metal in different matrixes). In particular, stripping techniques are perfectly suited for
trace and ultra-trace metal determination [79]. Adsorptive cathodic stripping voltammetry
(AdCSV) is based upon adsorptive accumulation of metal ion complex with a suitable ligands
(mordant blue, catechol, oxine, cupferron, chloranilic acid (CCA), aluminon, PAR and
salicylidenimine) [80]. Determinations of uranium in solid matrix (soil) except γ- spectrometry
and NAA are destructive techniques and require complete digestion of soil using acid (HF,
HNO3 and HCl). In this work both Voltammetric and Fluorimetry technique were used for
determination of uranium, voltammetric techniques preferable used for determination of
uranium in digested soil and ore mineral sample.
47 | P a g e
2.4.1. Voltammetric determination of U using chloranilic acid:
Uranium determination using chloranilic acid involves; pre-concentration of U(VI)-CCA
complex at 50 mV at the hanging mercury drop electrode (HMDE) at a pH of about 1.8 to 2.4.
The determination of uranium (VI) is specific and selective, as the positive deposition potential
means that other metal-CAA complexes or organic matrix components of natural waters are
either not adsorbed at all or hardly adsorbed on the HMDE. All measurements were carried out
in the differential pulse (DP) mode using pulse amplitude ranged from −0.6 to −0.2 V, a pulse
time of 30 ms and a potential step of 4 mV. The concentration of the chloroanilic acid solution
was 1×10⁻⁴ mol/L. The pH of the sample in the reaction vessel was adjusted at 2 using supra-
pure 8N HNO3 and the method can be used very complex matrices with low detection limit of
0.1 µg/L [80].
2.4.2. U determination using Fluorimetry:
Fluorimetry technique using fluran (or Phosphate buffer at pH 7) is also one of the best methods
for determination of uranium in water samples and to achieve the low detection limits (detection
limit of 0.1 µg/L). The technique involves following steps:
a) Addition of phosphate buffer (pH 7) leads to preferential formation of single species,
uranyl phosphate.
b) This is excited by a light source in the range of 371 to 390 nm. The excited uranyl
phosphate emits luminescence at 496, 516 and 540 nm.
c) Intensity of peaks determines the concentration of uranium in the solution.
In this work uranium analyzer UA-2 (Quantalase, Indor, India) was used for determination of
uranium in water samples.
48 | P a g e
2.5. X-Ray Photoelectron Spectroscopy (XPS)
XPS is one of most advanced techniques used for surface speciation studies. However,
interpretation of XPS spectra for uranium species requires a thorough understanding of the
spectra. The U 4f peaks are the strongest and most resolved peaks in the XPS spectrum of U [81].
The U 4f peaks are commonly used to analyze the valence of U on the surface of materials, and,
due to their intensity, play an important role in the characterization of adsorbed aqueous uranium
species on the any surface [82-85]. The U 4f7/2 and 4f5/2 peaks occurs around 380 and 390 eV
respectively. The spin–orbit interaction separates these two levels by around ~ 11.0 eV for
uranium minerals. The U 4f7/2 peak position may vary as dictated by the crystal structure and
under the influence of nearest-neighbor ions. The chemical shift of the U4f peaks due to the
valence of uranium has been extensively described in the literature. Shake-up satellites are small
peaks that are produced by photoelectrons that have lost part of their initial energy to a valence-
band electron. When a core-level electron is expelled, an electrostatic potential is experienced by
the valence electrons. They are excited to a higher empty orbital or are knocked off to the
continuum almost at the same time. The energy difference between the ground state (g.s) and the
higher orbital defines the difference in position between the satellite peak and the photoelectron
peak. The positions of the satellite peaks are also function of the valence of the element and the
number of its nearest-neighbor ions. For uranium, both U4f core-level peaks show satellites at
higher binding energies: 6–7 eV for U4+ , 7.8–8.5 eV for U5+ and 4 and 10 eV for U6+ [81, 84,
86-88]. Some of the satellites of the U4f7/2 peak are buried in the intense U4f5/2 peak or may
appear as a shoulder, which may lead to incorrect interpretation regarding the occurrence and
fractions of the different bands. Hence, satellites of the U 4f5/2 peak and the U 4f7/2 peak are
49 | P a g e
normally not considered for spectral interpretation, and one instead uses the satellites of the U
4f5/2 peaks and the shape of the U4f7/2 peak for the determination of the U6+, U5+ and U4+ bands.
In this work all XPS spectra were collected on an ESCA apparatus (Make SPECS GmbH)
in constant analyzer energy mode. An Al Kα source of photons (1486.6 eV) was used for both
survey and narrow scans. The powdered samples in form of pellets were fixed on sample holder
with double sided carbon tape before being placed in the analysis chamber (10-10 mbar vacuum).
2.6. Sorption Study
2.6.1. Batch method:
Batch method is frequently used to study sorption kinetics and thermodynamics along with to
study the equilibrium distribution of contaminant (radionuclides) between the solid phase and the
aqueous phase under well-defined experimental conditions of temperature, pH, ionic strength
and solid/liquid ratio.
The sorption percentage (S %) can be expressed as:
(2.5)
Where, C0 and Ce are initial and equilibrium concentration of contaminant in aqueous phase.
Partitioning is expressed by the distribution coefficient, Kd (L/kg), defined as:
Kd= CS/CL (2.6)
Or
(2.7)
Where,
Cs is the concentration of the metal ion per Kg of the solid (mg/kg)
CL is the concentration of the metal ion present per ml of the aqueous phase (mg/L)
M
V
C
CCKd e
0
0
100%0
0
C
CCS e
50 | P a g e
C0 and Ce are initial and equilibrium concentration of contaminant in aqueous phase.
V is volume of aqueous phase
M is mass of adsorbent (soil)
Another parameter which is more frequently used in sorption study is sorption capacity, which
measure how much contaminant can hold by a particular adsorbent is known as sorption capacity
(qx) and defined as:
(2.8)
Where, ‘x’ can be t (Sorption capacity at particular time t), e (sorption capacity at equilibrium)
and max (maximum sorption capacity).
Study of kinetics, even in homogeneous system is complex, so attempt to study in heterogeneous
system such as soil and sediment, difficulties get magnified. This is largely due to complexities
of soil or sediment which is made of mixture of organic and inorganic minerals and of different
particle sizes. Both transport processes and chemical reactions can affect the reaction rates in
subsurface environment. Transport process includes, a) transport in solution b) transport across a
liquid film at the particle/liquid interface (Film diffusion) c) in liquid filled macropores, d)
particle diffusion etc.
There are two important reasons for investigating the kinetics is;
a) To determine how rapidly reactions attain equilibrium and
b) To infer information on reaction mechanisms.
Determination of kinetics of sorption is a two-step process, first is monitoring the sorption at
different time intervals then 2nd is fitting the sorption data with different sorption kinetic models.
The kinetic model to which the data is fitted well is considered as the kinetics of sorption. As
M
VCCq xx )( 0
51 | P a g e
per time is concerned sorption can take place from micro- second to months, so fast sorption
process (micro- scale process) can’t be monitored by batch processes. In general sorption of
metals on any solid sorbent follow either first order or second order reaction, since the sorption is
expressed in terms of adsorption capacity (qx), now days it is named as pseudo-1st order or
pseudo-2nd order kinetics. The details of sorption kinetics are explained in chapter 3.
2.6.3. Thermodynamic of sorption
In order to evaluate the risks that may be associated with the contamination of soil with uranium
disposal of waste, thermodynamic parameters of sorption need to be investigated. The
thermodynamic parameters such as change in enthalpy (∆H), free energy (∆G) and entropy (∆S)
will provide idea about spontaneity of reaction, endothermic or exothermic along with predicting
the mechanism of sorption also.
The most general equation for ∆G calculation is:
∆G=∆H-T∆S (2.9)
For spontaneous reaction ∆G need to be negative and whether the reaction is exothermic or
endothermic, that can be predicted from the ∆H of the reaction (exothermic: ∆H=-ve and
endothermic ∆H=+ve). These thermodynamic parameters can be determined from the
thermodynamic equilibrium constant, Kd (or the thermodynamic distribution coefficient) which
is defined as:
(2.10)
Where, ‘as’ is activity of adsorbed U on soil and ‘ae’ is activity of U in solution at equilibrium.
Now ΔG0 (kJ mol−1) at temperature T (in Kelvin) can be calculated as follows:
ΔG0 = -RT ln Kd (2.11)
Where, R is the gas constant (8.314 Jmol-1K-1), T is the temperature in Kelvin.
e
sd
a
aK
52 | P a g e
Moreover, since the adsorption isotherms have been measured at two temperatures, the heat of
adsorption can be calculated. The temperature dependency of distribution coefficient (kd) obeyed
the van’t Hoff equation which can be written in the form of ΔH0
(2.12)
Where, Kd1 and Kd2 are the distribution coefficients at two temperatures T1 and T2 (in Kelvin)
respectively.
Standard entropy change, ΔS0 (J mol-1 K-1) can be calculated from following equation
(2.13)
2.6.4. Sorption Equilibrium and Isotherm
Sorption equilibrium (the ratio between the adsorbed amount with the remaining in the solution)
is established when an adsorbate containing phase has been contacted with the adsorbent for
sufficient time, with its adsorbate concentration in the bulk solution is in a dynamic balance with
the interface concentration [89, 90].
In general, an adsorption isotherm is an invaluable curve describing the phenomenon governing
the retention (or release) or mobility of a substance (Uranium) from the aquatic environments to
a solid-phase (soil) at a constant temperature and pH [91, 92]. Typically, the mathematical
correlation, which constitutes an important role towards the modeling analysis, operational
design and applicable practice of the adsorption systems, is usually depicted by graphically
expressing the solid-phase against its residual concentration.
Over the years, a wide variety of equilibrium isotherm models (Freundlich, Langmuir,
Brunauer–Emmett–Teller, Dubinin–Radushkevich, Temkin, Toth, Koble–Corrigan, Redlich–
122
1 11ln
TTR
H
K
K
d
d
T
GHS
000
53 | P a g e
Peterson, Sips, Khan, Hill, Flory–Huggins and Radke–Prausnitz isotherm) have been formulated
in terms of three fundamental approaches [93]. Kinetic consideration is the first approach to be
referred. Hereby, adsorption equilibrium is defined being a state of dynamic equilibrium, with
rate of adsorption and desorption are equal [94]. Whereas, thermodynamics, being a base of the
second approach, can provide a framework of deriving numerous forms of adsorption isotherm
models [95], and finally potential theory, is the third approach, usually conveys the main idea in
the generation of characteristic curve [96]. However, an interesting trend in the isotherm
modeling is the derivation in more than one approach, thus directing to the difference in the
physical interpretation of the model parameters. Details of isotherm models used in the study are
described in chapter 3.
2.7. Speciation study
2.7.1. Fractionation of uranium in soil and sequential extraction
In soil, uranium may be found in one or more of several "pools" of the soil, as follows:
a. Dissolved in the soil solution or occupying exchange sites on inorganic soil constituents
(Exchangeable Fraction)
b. Specifically adsorbed on inorganic soil constituents (Carbonate fraction)
c. Associated with insoluble soil organic matter (Organic fraction)
d. Associated with oxides and hydroxide of Fe and Mn ( Fe/Mn-Oxide fraction)
e. present in the structure of secondary and primary minerals (Residual fraction)
Sometimes the last fraction is again divided to two fractions in terms of bound to secondary
minerals and bound to primary minerals. When metal introduced into the environment through
human activities, metals are associated with the first four pools. Native metals may be associated
with any of the pools depending on the geological history of the area. Metals bound to
54 | P a g e
exchangeable fraction are most bio-available fraction. There are several methods available in
literature for sequential extractions, but we followed method prescribed by Schultz et al. (1998),
which involves following steps [97].
Exchangeable fraction: Take 2 g of processed, homogenized soil samples in a 50 mL centrifuge
tube then add 20 mL of 0.4 M MgCl2 and shake for 1 h followed by centrifuged at 3000 rpm for
10 min. Collect supernatant (F1) and take the residue for 2nd step after washing with 5 mL of
MgCl2. Add the washing with supernatant.
Carbonate fraction: Treat the residues from first step with 20 mL of 1 M NaOAc in 25 % acetic
acid (pH=5). Shake for 2 h followed by centrifuged at 3000 rpm for 10 min. Collect the
supernatant (F2) and take the residue for 3rd step after washing with 5 mL of 1 M NaOAc. Add
the washing with supernatant.
Organic fraction: Treat the residues from 2nd step with 20 mL of 5-6% NaOCl and heat on a hot
plate at about 80 degree for 3h with continuous stirring. Then cool it to room temperature
followed by centrifuge at 3000 rpm for 10 min. Collect the supernatant (F3) and take the residue
for next step after washing with 5 ml NaOCl.
Fe-Mn oxides fraction: Treat the residues from 3rd step with 0.04 M NH2OH.HCl (pH 2) and
heat with continuous stirring for 5 h. Then cool it to room temperature, centrifuge at 3000 rpm.
Then collect the supernatant (F4) and take the residue for next step after washing with 5 mL of
0.04 M NH2OH.HCl and add the washing with F4.
Acid leachable &Residual fraction: Treat the residues from 4th and carry out microwave assisted
acid digestion followed by evaporation on hot plate. Finally collect the aliquots and dilute it to
25 mL using 0.25% nitric acid.
55 | P a g e
Note: All the supernatant collected in each steps along with washings were filtered using
0.45micron filter paper before analysis.
2.7.2. Aqueous Chemical Speciation
Chemical speciation is nothing but the distribution of an element (uranium in our case) amongst
chemical species in a system and it is very much important for understanding bioavailability,
chemical toxicity, remediation, environmental fate and transport. Despite the central importance
of knowing the full speciation of a chemical in order to predict its behavior in a system, it is
generally not possible to determine a speciation analysis using analytical techniques alone. Most
techniques are focused on detection of free metal ion concentrations [98-100] or total metal
concentrations [101]. Direct speciation measurement using traditional analytical methods
requires significant complexity and generally hyphenated techniques [102-104]. As already
discussed, because environmental concentrations of most metals of interest are low, and because
many relevant forms of metals cannot be measured directly, analytical techniques often are not
effective for determining overall speciation [105]. Thus chemical speciation determination
generally based on utilizing analytical techniques in conjunction with chemical speciation
models. Chemical speciation models rely on mass balance and thermodynamics to determine the
concentration of each species that contains a given component. Chemical speciation is usually
predicted with thermodynamic expressions, because the reactions involved take place in the bulk
aqueous phase and are generally fast. Hence, these models rely on the local equilibrium
assumption and on experimentally determined reaction constants. The local equilibrium
assumption (LEA) states that, because aqueous-based reactions are reversible and generally rapid
compared with other system processes, they may be assumed to reach equilibrium.
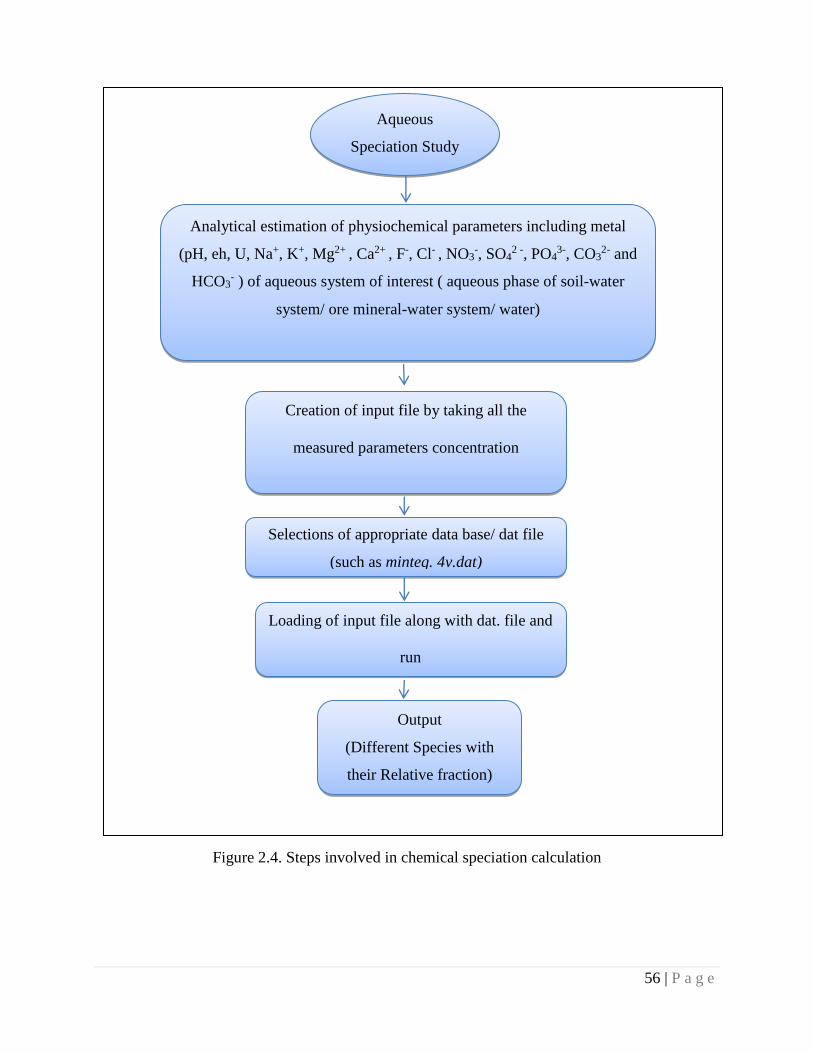
56 | P a g e
Figure 2.4. Steps involved in chemical speciation calculation
Aqueous
Speciation Study
Analytical estimation of physiochemical parameters including metal
(pH, eh, U, Na+, K+, Mg2+ , Ca2+ , F-, Cl- , NO3-, SO4
2 -, PO43-, CO3
2- and
HCO3- ) of aqueous system of interest ( aqueous phase of soil-water
system/ ore mineral-water system/ water)
Creation of input file by taking all the
measured parameters concentration
Selections of appropriate data base/ dat file
(such as minteq. 4v.dat)
Loading of input file along with dat. file and
run
Output
(Different Species with
their Relative fraction)
57 | P a g e
The thermodynamics of the system components will be predictive of the final state of the system
[106]. However, speciation models using the LEA generally neglect reaction kinetics, and for
some systems kinetics play a pivotal role [107-110]. There are various models are available for
speciation calculations such as, PHREEQC I, EQ3, MINEQL and MEDUSA etc. all are based on
one of these thermodynamic data base; wateq4f.dat, minteq. 4v.dat, pitzer.dat, sit.dat, llnl.dat,
iso.dat, amm.dat and phreeqc.dat. In our study we used PHREEQC I and MEDUSA code for
speciation calculation and the step involved presented in figure. 2.4.
58 | P a g e
Chapter 3
Behavior of Uranium at Soil- Water interface
3.1. Introduction
Like other metals, uranium at soil-water interface is also subject to movement with soil water,
and may be transported through the vadose zone to ground water. Immobilization of uranium, by
mechanisms of sorption and precipitation, will prevent movement of the metals to ground water.
Like metal-soil interaction when uranium is introduced at the soil surface, either by natural or
anthropogenic processes, downward transportation may not occur to any great extent unless the
uranium retention capacity of the soil is overloaded. Changes in soil environmental conditions
over time, such as the degradation of the organic waste matrix, changes in pH, redox potential, or
soil solution composition, also may enhance uranium migration to soil solution. The extent of
migration of U from soil to soil solution is directly related to the sorption kinetics and
thermodynamics which in turn is a function of soil types and physicochemical properties of soil
solution. Study of sorption of U(VI) onto soil is of great importance for the prediction of its fate
at soil-water interface, which is prerequisite to the long-term performance assessment of nuclear
waste repositories and migration of geogenic uranium from rocks to associated ground water
system. As sorption processes depend on soil mineralogy and water chemistry [110,111] the
physical and chemical properties of geological media (such clay minerals, soils and rocks) plays
an important role in the evaluation of migration of uranium in the environment. The most
important minerals in soil accelerate the retention of uranium are smectite, illite, vermiculite,
allophone and imogolite as well as the oxides and hydroxides of silica, aluminum, iron and
manganese [112]. Sorption of uranium by clay minerals has been extensively documented in the
literature [113-118]. However, all these studied were carried out on individual clay minerals. But
59 | P a g e
in natural environment clay minerals are one of component of the soil which composed of
various other minerals and not necessary it’s a clayey soil. As different soil types possess
different retention capacity, the soil type is also important to decide site for waste management
and predict fate. It is therefore, understandable that the study of sorption kinetics,
thermodynamics and isotherms is equally important as it provides valuable insights into the
reaction pathways and into the mechanism of sorption reactions to understand the behavior of
uranium at soil water interface.
3.2. Present work
In the present work, experiments were carried out to understand the behavior of uranium at soil
water interface by kinetics and thermodynamics means. Sorption efficiency of four types of soil
having different geological origin (from metamorphic, sedimentary and igneous rocks) was
estimated. Sorption kinetic models were employed to analyze the kinetics and mechanisms of
uranium sorption on the different soil types. Thermodynamic parameters of sorption were
estimated. The best-fit equilibrium isotherms were determined by Freundlich, D-R and Langmuir
isotherm models. The study also focused on evaluating how the process operation parameters of
initial U concentration, adsorbent dosage (soil mass), natural organic matters (NOM) content,
and change in soil water chemistry affect the adsorption capacity of the soil. This information
will be useful for further applications in waste treatment or disposal facility special dealing with
radioactive waste like uranium along with solving the issue of uranium contamination.
3.3. Materials and Methods
3.3.1. Materials
Four different soils (A, B, C and D) of different origin and chemical compositions were
employed to study their U (VI) sorption capacity to remove uranium at soil solution interface.
60 | P a g e
Where, Soil A: Metamorphic soil, Soil B: Sedimentary soil, Soil C: Basaltic soil and Soil D:
Basaltic saline soil. All soils were used as received without other treatment apart from drying at
1000 C for 1 h to remove excess moisture and then kept in a desiccator until analyzed. A part of
Soil samples from each soil types were heated at 5500C(±100C) for 2 hours in furnace to remove
NOM. Working solution uranium as prepared by appropriate dilution of the stock solutions
(10000 mg/L of Uranyl Nitrate, SEPEX Ltd.) immediately before use.
3.3.2. Characterization of properties of Natural Soil
Physico-chemical properties of each soil are given in Table 2.1. The soil texture analysis was
carried out using CILAS Particle Size Analyzer 1109 (Range: 40nm-2500µm) in liquid Mode
and the size distribution is presented in Fig. 3.1. X-ray diffraction (XRD) analysis was carried
out to determine the phases of the clay minerals. The measurements were performed using GNR,
APD 2000 PRO diffract meter (Cu-Kα X-rays:1.54 A0) over the range of 5–50◦, 2-theta for
processed soil samples. The XRD pattern for all the soils are presented in Fig. 3.2. The natural
organic content (NOM) was estimated using CHNO-S Analyzer (Flash EA-112, Thermo-
Fischer), Fe and Mn content in soil was estimated by microwave acid digestion followed by
spectro- photometric analysis using AAS (GBC, Avanta). Cation Exchange Capacity of soil was
estimated by sodium acetate method as discussed in chapter 2 [76]
3.3.3. Sorption experiment
Adsorption of U(VI) on the different soil was carried out in a batch system. 5 g of soil added to
50 mL of known concentration of U(VI) solution. The mixture was agitated at160 rpm in a rotary
shaker (SK-300, JIOTECH, Korea) at ambient temperature for 7 days. For kinetics study the
samples were withdrawn at pre-determined time (1h, 2 h…168h) intervals until sorption
equilibrium were achieved. Then the U(VI) solution was separated from the soil by
61 | P a g e
centrifugation (Eppendorf Centrifuge 5430R, Germany) at 7000 rpm for 15min. The
supernatants were then filtered using Millipore filter paper (0.45µm) to ensure the solutions were
free from particles before measuring the residual U(VI) concentration. Adsorption isotherms
study was carried out by varying initial conc. from 100.0, 500.0, 1000.0, 10000.0, 100000.0 µg/L.
All experiments were carried out in duplicate and again the measurements were carried out in
triplicate to ensure the repeatability in measurement. Finally, the average values were taken to
minimize random error.
For determination of thermodynamic parameters, 5 g of each dried soil was added to 50 mL of
10mg/L uranium solution and batch equilibrium experiment was conducted at 250 and 500C in a
shaker incubator. After 7 days of equilibration time the samples of each set were centrifuged,
filtered through 0.45 μm filter paper and concentration of U in the equilibrium solution was
determined using Uranium Analyzer UA2 (Quantalase Indore, India). The distribution
coefficients of uranium in all the four soils were determined at different temperature.
3.3.4. Measurement of U(VI) concentration and removal capacity
U(VI) concentration was determined by Uranium Analyzer UA-2 (Quantalase, Indor, India)
using phosphate buffer at pH 7 and standard addition technique was followed for quantification.
The reliability of analysis was cross checked by inter comparison with Voltammetric technique.
The sorption capacity at any time ‘t’ and removal rate/ sorption % of U (VI) was calculated using
following relation:
(3.1)
(3.2)
W
VCCq tt )( 0
0
0
100%
CCCS t
62 | P a g e
Where,
C0 is the initial U(VI) concentration (µg/L),
Ct is the concentration at any time (µg/L),
V is the volume of solution (mL), and
W is the weight of the adsorbents/ soil (g).
3.3.5. Theory of Adsorption isotherm
To optimize and model the adsorption, Freundlich, Langmuir and D–R isotherm isotherms [119]
were used which explains U(VI)- soil interaction at soil solution interface.
Freundlich isotherm
Freundlich model allows for several types of adsorption sites on the solid and intermediate
concentrations on heterogeneous surfaces can be defined by relation:
(3.3)
Eq. (3.3) can be rearranged to obtain a linear form by taking logarithms:
Log(qe)=log Kf +(1/n)log Ce (3.4)
Where, qe is the amount of U(VI) adsorbed per unit of adsorbent at equilibrium (µg/g), Ce is the
concentration of U(VI) in solution at equilibrium (µg/L), Kf (µg1-1/nLn/g ) and n are the called
Freundlich isotherm constants, which are indicator of the extent of the adsorption and the degree
of nonlinearity between solution concentration and adsorption respectively. Kf and 1/n values
can be calculated from intercept and slope of the linear plot between log Ce v’s log (qe).
Langmuir isotherm
Langmuir isotherm is based on the assumption that a structure of adsorbent is homogeneous,
where all sorption sites are identical and energetically equivalent. This means, each adsorption
n
efe CKq/1
63 | P a g e
mono-layer coverage of U(VI) molecule on the outer surface of clay adsorbents. And it is valid
for monolayer adsorption onto a surface containing a finite number of identical sites. The form of
Langmuir isotherm can be represented by the following equation:
(3.5)
The Eq.3.5 can be linearized to
(3.6)
Where,
qe is the equilibrium uptake (µg/g);
Ce is the equilibrium U(VI) concentration (µg/L)
qmax (µg/g) (saturated monolayer adsorption capacity) and
k (L/µg) (adsorption equilibrium constant) are the Langmuir constants.
Dubinin-Radushkevich Isotherm
The Dubinin-Radushkevich (D-R) isotherm model postulates that the mechanism for adsorption
in micro-pores is that of pore-filling rather than layer-by-layer surface coverage. It is applied to
the data in order to deduce the heterogeneity of the surface energies of adsorption and the
characteristic porosity of the adsorbent. It is generally applied to express the adsorption
mechanism [120] with a Gaussian energy distribution onto a heterogeneous surface [121]. The
linear form of the D-R isotherm is given in as follows in Eq. 3.7.
(3.7)
maxmax
1
q
C
kqq
C e
e
e
eL
eLe
CK
CKqq
1
max
2
maxlnln qqe
64 | P a g e
Where,
ɛ is the Polanyi potential
β is the activity coefficient related to mean sorption energy (mol2/kJ), which is equal to:
(3.8)
E=1/√2β (3.9)
E (kJ/mol) is defined as the free energy change required transferring 1.0 mol of ions from
solution to the solid surfaces and the magnitude of E is useful for estimating the type of sorption
reaction.
3.3.6. Adsorption kinetics
In order to examine the controlling mechanism of adsorption processes such as mass transfer and
chemical reaction, several kinetic models are used to test experimental data. A simple kinetic
analysis of adsorption is the pseudo-first-order equation [122, 123] in the form;
(3.10)
Where,
k1 is the rate constant of pseudo-1st-order adsorption and
qe denotes the amount of adsorption at equilibrium.
After definite integration by applying the initial conditions q= 0 at t= 0 and q= qt at t = t equation
(3.10) becomes:
(3.11)
In addition, a pseudo-second-order equation based on adsorption equilibrium capacity [123, 124]
may be expressed in the form:
(3.12)
tkqqq ete 1ln)ln(
)(1 te qqkdt
dq
2
2 )( te qqkdt
dq
eC
RT 11ln
65 | P a g e
Where,
k2 is the rate constant of pseudo-second-order adsorption.
Integrating equation (3.12) and applying the initial conditions, we have
(3.13)
It should be noted that, equation (3.13) has an advantage that k2 and qe can be obtained from the
intercept and slope of the plot of t/qt. vs. t and there is no need to know any parameter
beforehand.
3.3.7. Adsorption mechanism
As the above two equations cannot give definite mechanisms, another simplified model is tested
called Intra-particle diffusion model (IPD) which was proposed by Weber and Morris [125]. The
effect of intra-particle diffusion resistance on adsorption can be determined by the following
relationship
(3.14)
Where kid is the intra-particle diffusion rate constant (µg /(g.h1/2). To follow the intra-particle
diffusion model, a plot of qt against t1/2 should give a linear line where a slope is kid and intercept
I. Values of I provides information regarding the thickness of boundary layer, i.e. the higher the
‘I’ ‘value the greater is the boundary layer effect.
3.3.8. Thermodynamic parameters
The thermodynamic parameters were determined from the thermodynamic equilibrium constant,
Kd. Change in enthalpy was determined from distribution coefficient (Kd) at different
temperatures ( 25 and 50 0C) using Van’t Hoff equation as follows
(3.15)
Itkq idt 2/1)(
122
1 11ln
TTR
H
K
K
d
d
tqqkq
t
eet
112
2
66 | P a g e
Similarly change in free energy calculated from distribution coefficient using Gibbs free energy
equation,
ΔG0 = -RT ln Kd (3.16)
Finally the change in entropy can be calculated using following equation,
(3. 17)
3.3.9. Parameter Sensitivity
For sensitivity analysis, One-Factor-At-A-Time (OFT) direct approach was chosen and the
results of the sensitivity analysis are presented in terms of metrics called the uranium ratio (UR)
and the sensitivity index (SIUR) and defined by following relation:
(3.18)
(3.19)
Where,
UAQ: Uranium concentration in aqueous medium
UTot: Total Uranium concentration (solid phase + liquid phase)
URmin is UR at the minimum component concentration evaluated
URmax is UR at the maximum component concentration evaluated
URbaseline is UR at the baseline for the system
(SIUR >10%): those that had a significant effect; (1 < SIUR < 10%): moderate effect; (0.1 < SIUR <
1%): minor effect and (SIUR <0.1%): no apparent effect.
Simulation was carried out using hydro-geochemical code PHREEQCI ver.3 and WATEQ4F
thermodynamic database to see the effect of water parameters on mobility of uranium at soil –
water interface. Sorption controlled studies was carried out using Diffuse-double layer (DDL)
T
GHS
000
Tot
AQ
U
UUR
Baseline
MAXMINUR
UR
URURSI
67 | P a g e
model. And it is assumed that the ground water is in equilibrium with the soil containing hydrous
ferric oxide mineral. Simulation was carried out by varying pH (5 to 10), CO32- (0 to 6 mM),
SO42- (0 to 5mM), Ca2+(0 to 10mM) and Na+(0 to 25mM), Mg2+(0 to 5mM) and K+(0 to 1mM).
3.4. Results and Discussion
3.4.1. Characterization of Soils
Physico-chemical data with measurement uncertainties of all the four soil samples were
presented in Table 3.1. Fig. 3.1(a, b, c and d) presents particle size (soil texture) distribution of
all the four soils, it indicates that average soil textural distribution were in the order of
B(90µm)>A(80 µm)> C (36 µm)>D(4 µm) although order of clay content is D> C>B>A.
Analysis of total organic content in soil using CHNO-S analyzer revealed that Soil D contains
maximum organic matter (2.04%) followed by C(1.44%)> B(0.15%)> A(0.06%). Fe and Mn
content is maximum in soil C followed by D>A> B. Cation Exchange Capacity (CEC) indicates
that Soil D exhibits highest CEC (meq/100g) followed by B>C> A. XRD is the basic technique
to determine the bulk structure and composition of soil with crystalline structure. Fig 3.2 (a, b, c
and d) presents XRD pattern of soil A, B, C and D respectively. Interpretation of mineralogical
data indicates that soil A and B is dominated by quartz whereas C by plagioclase minerals and
Soil D by calcite and dolomite. The method extraction efficiency and quality of analysis were
checked against the certified reference material IAEA soil -7 for Fe and Mn with the recovery of
102 and 99 %, respectively at 95 % confidence interval.
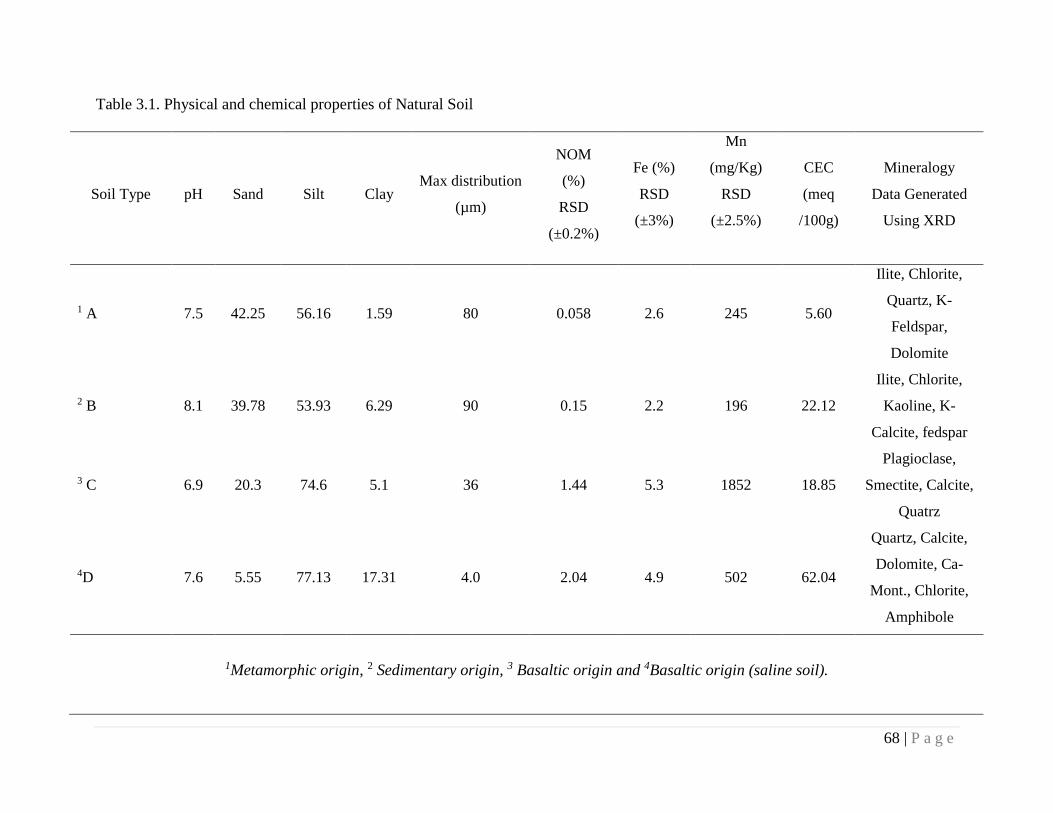
68 | P a g e
Table 3.1. Physical and chemical properties of Natural Soil
Soil Type pH Sand Silt Clay Max distribution
(µm)
NOM
(%)
RSD
(±0.2%)
Fe (%)
RSD
(±3%)
Mn
(mg/Kg)
RSD
(±2.5%)
CEC
(meq
/100g)
Mineralogy
Data Generated
Using XRD
1 A 7.5 42.25 56.16 1.59 80 0.058 2.6 245 5.60
Ilite, Chlorite,
Quartz, K-
Feldspar,
Dolomite
2 B 8.1 39.78 53.93 6.29 90 0.15 2.2 196 22.12
Ilite, Chlorite,
Kaoline, K-
Calcite, fedspar
3 C 6.9 20.3 74.6 5.1 36 1.44 5.3 1852 18.85
Plagioclase,
Smectite, Calcite,
Quatrz
4D 7.6 5.55 77.13 17.31 4.0 2.04 4.9 502 62.04
Quartz, Calcite,
Dolomite, Ca-
Mont., Chlorite,
Amphibole
1Metamorphic origin, 2 Sedimentary origin, 3 Basaltic origin and 4Basaltic origin (saline soil).
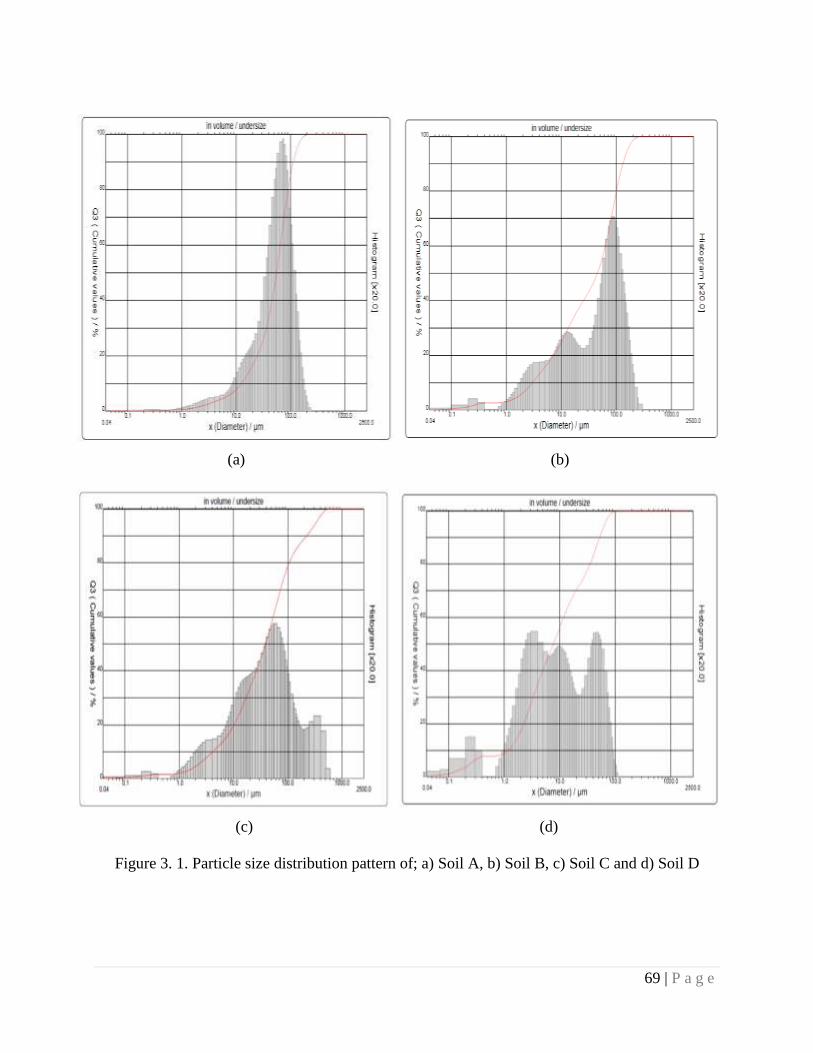
69 | P a g e
(a) (b)
(c) (d)
Figure 3. 1. Particle size distribution pattern of; a) Soil A, b) Soil B, c) Soil C and d) Soil D
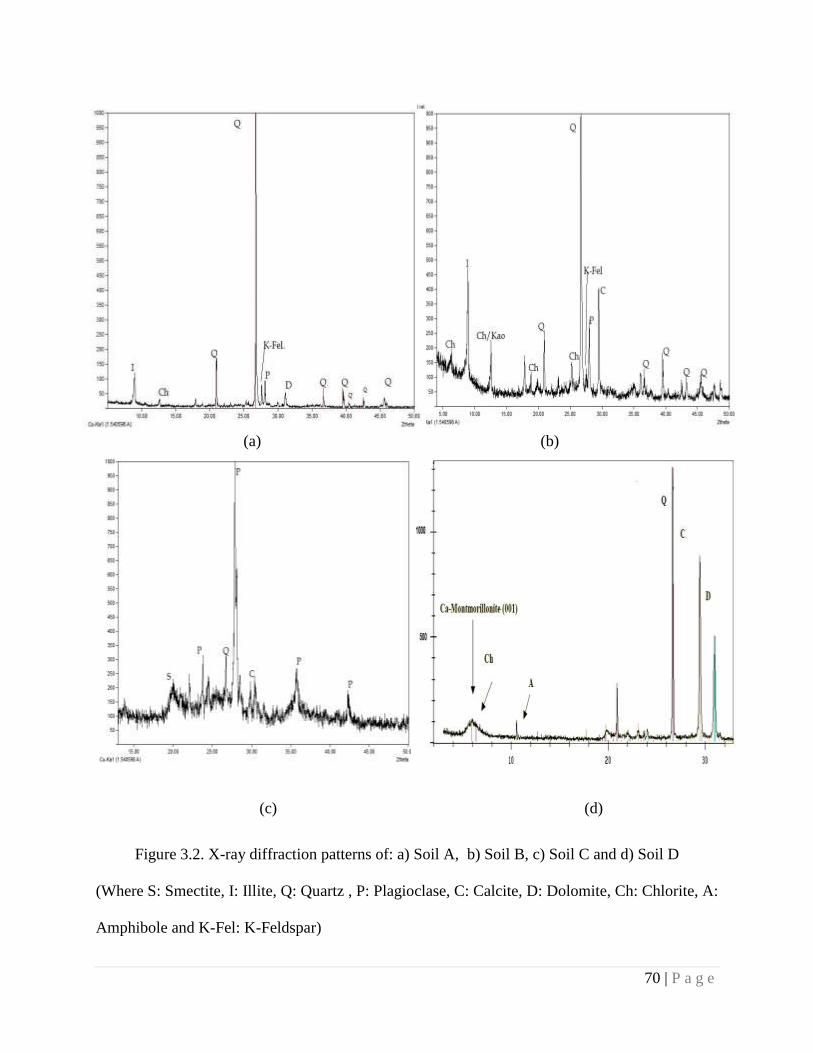
70 | P a g e
(a) (b)
(c) (d)
Figure 3.2. X-ray diffraction patterns of: a) Soil A, b) Soil B, c) Soil C and d) Soil D
(Where S: Smectite, I: Illite, Q: Quartz , P: Plagioclase, C: Calcite, D: Dolomite, Ch: Chlorite, A:
Amphibole and K-Fel: K-Feldspar)
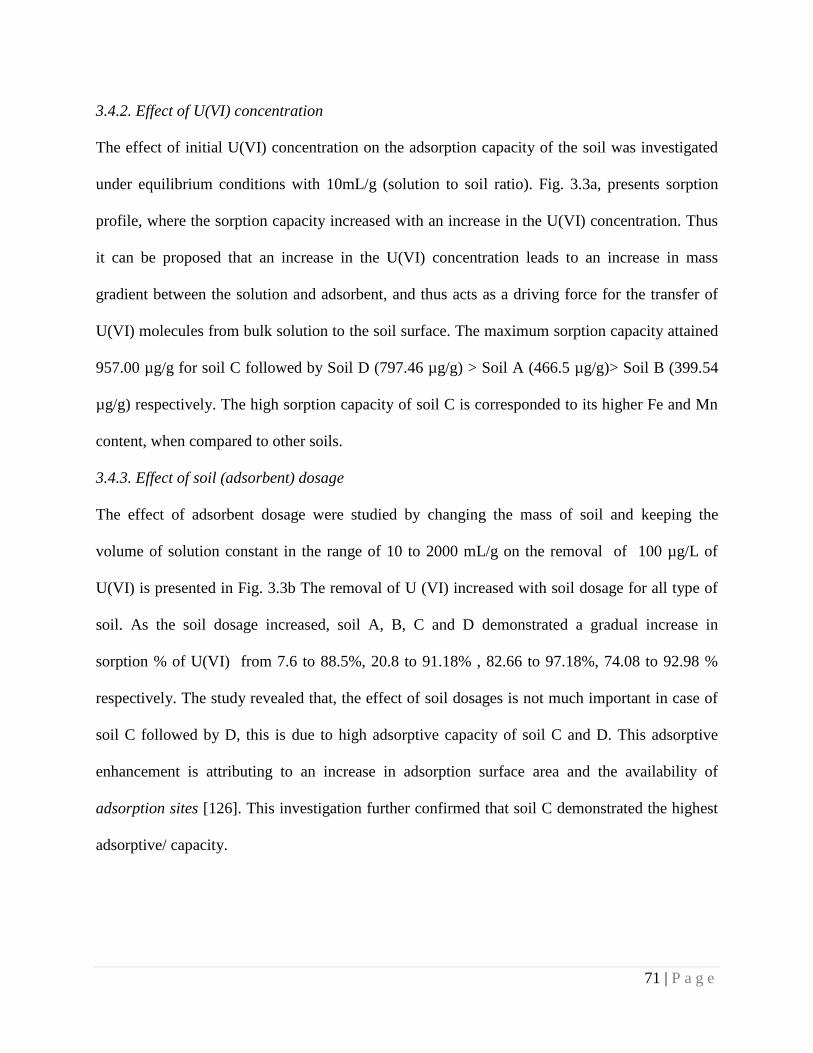
71 | P a g e
3.4.2. Effect of U(VI) concentration
The effect of initial U(VI) concentration on the adsorption capacity of the soil was investigated
under equilibrium conditions with 10mL/g (solution to soil ratio). Fig. 3.3a, presents sorption
profile, where the sorption capacity increased with an increase in the U(VI) concentration. Thus
it can be proposed that an increase in the U(VI) concentration leads to an increase in mass
gradient between the solution and adsorbent, and thus acts as a driving force for the transfer of
U(VI) molecules from bulk solution to the soil surface. The maximum sorption capacity attained
957.00 µg/g for soil C followed by Soil D (797.46 µg/g) > Soil A (466.5 µg/g)> Soil B (399.54
µg/g) respectively. The high sorption capacity of soil C is corresponded to its higher Fe and Mn
content, when compared to other soils.
3.4.3. Effect of soil (adsorbent) dosage
The effect of adsorbent dosage were studied by changing the mass of soil and keeping the
volume of solution constant in the range of 10 to 2000 mL/g on the removal of 100 µg/L of
U(VI) is presented in Fig. 3.3b The removal of U (VI) increased with soil dosage for all type of
soil. As the soil dosage increased, soil A, B, C and D demonstrated a gradual increase in
sorption % of U(VI) from 7.6 to 88.5%, 20.8 to 91.18% , 82.66 to 97.18%, 74.08 to 92.98 %
respectively. The study revealed that, the effect of soil dosages is not much important in case of
soil C followed by D, this is due to high adsorptive capacity of soil C and D. This adsorptive
enhancement is attributing to an increase in adsorption surface area and the availability of
adsorption sites [126]. This investigation further confirmed that soil C demonstrated the highest
adsorptive/ capacity.
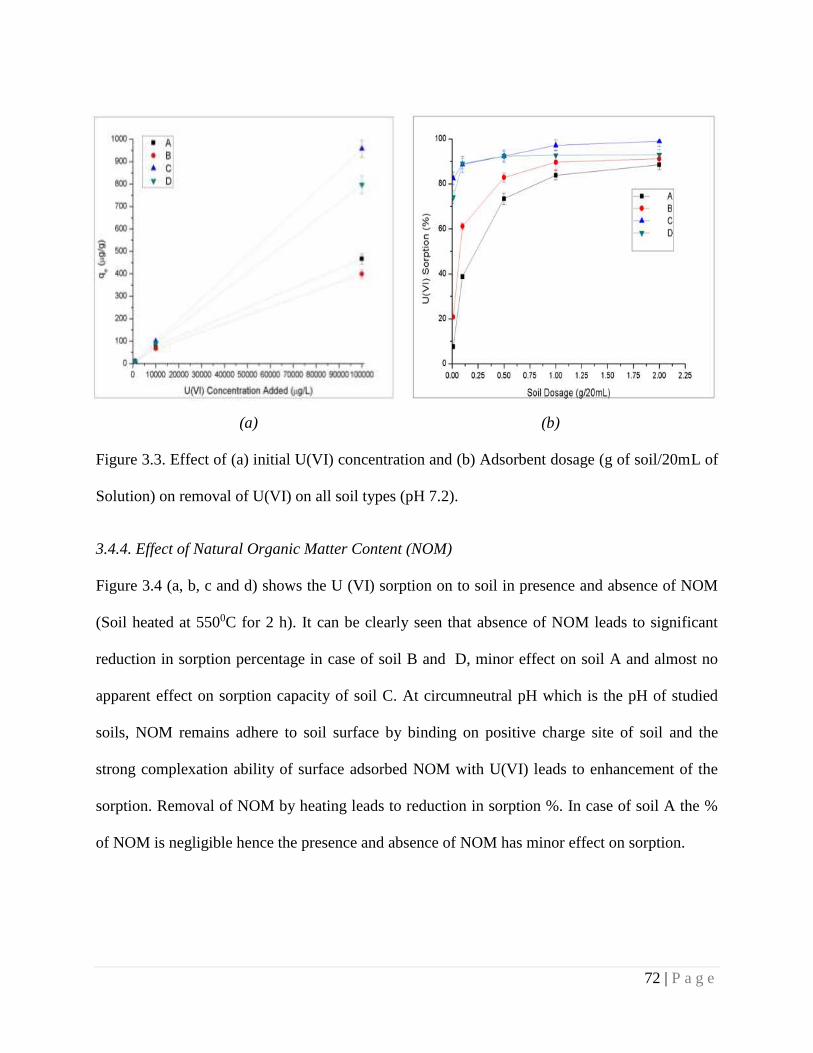
72 | P a g e
(a) (b)
Figure 3.3. Effect of (a) initial U(VI) concentration and (b) Adsorbent dosage (g of soil/20mL of
Solution) on removal of U(VI) on all soil types (pH 7.2).
3.4.4. Effect of Natural Organic Matter Content (NOM)
Figure 3.4 (a, b, c and d) shows the U (VI) sorption on to soil in presence and absence of NOM
(Soil heated at 5500C for 2 h). It can be clearly seen that absence of NOM leads to significant
reduction in sorption percentage in case of soil B and D, minor effect on soil A and almost no
apparent effect on sorption capacity of soil C. At circumneutral pH which is the pH of studied
soils, NOM remains adhere to soil surface by binding on positive charge site of soil and the
strong complexation ability of surface adsorbed NOM with U(VI) leads to enhancement of the
sorption. Removal of NOM by heating leads to reduction in sorption %. In case of soil A the %
of NOM is negligible hence the presence and absence of NOM has minor effect on sorption.
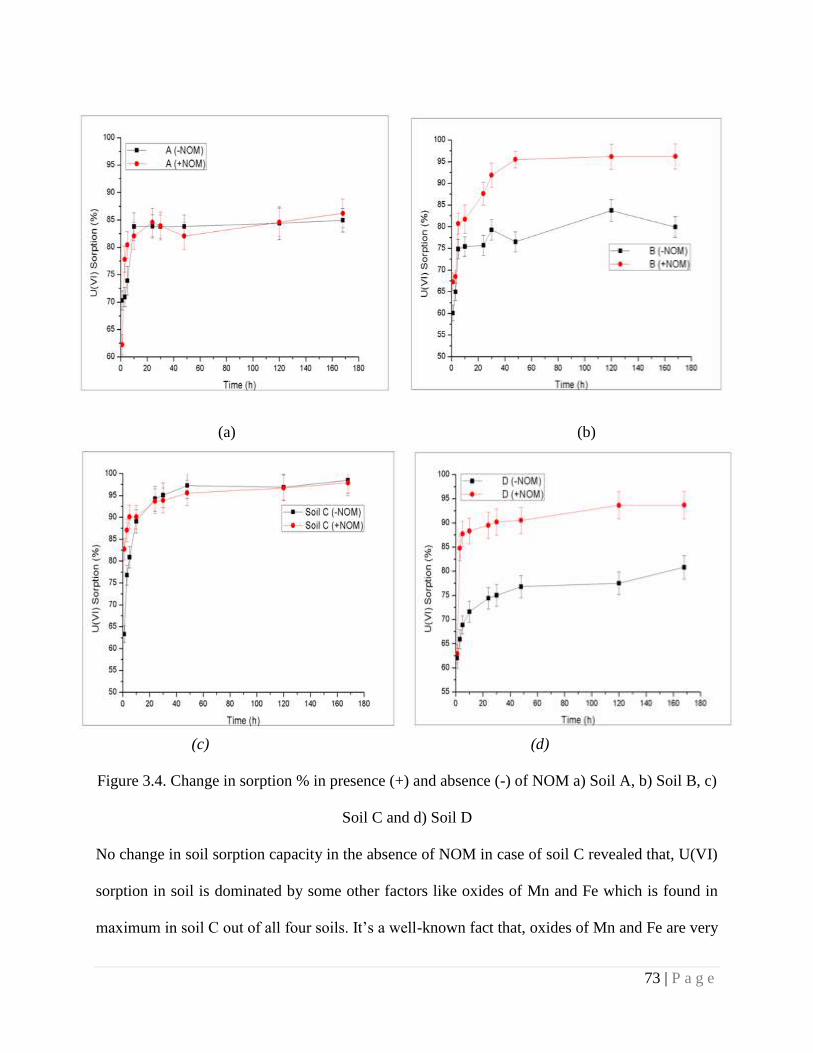
73 | P a g e
(a) (b)
(c) (d)
Figure 3.4. Change in sorption % in presence (+) and absence (-) of NOM a) Soil A, b) Soil B, c)
Soil C and d) Soil D
No change in soil sorption capacity in the absence of NOM in case of soil C revealed that, U(VI)
sorption in soil is dominated by some other factors like oxides of Mn and Fe which is found in
maximum in soil C out of all four soils. It’s a well-known fact that, oxides of Mn and Fe are very
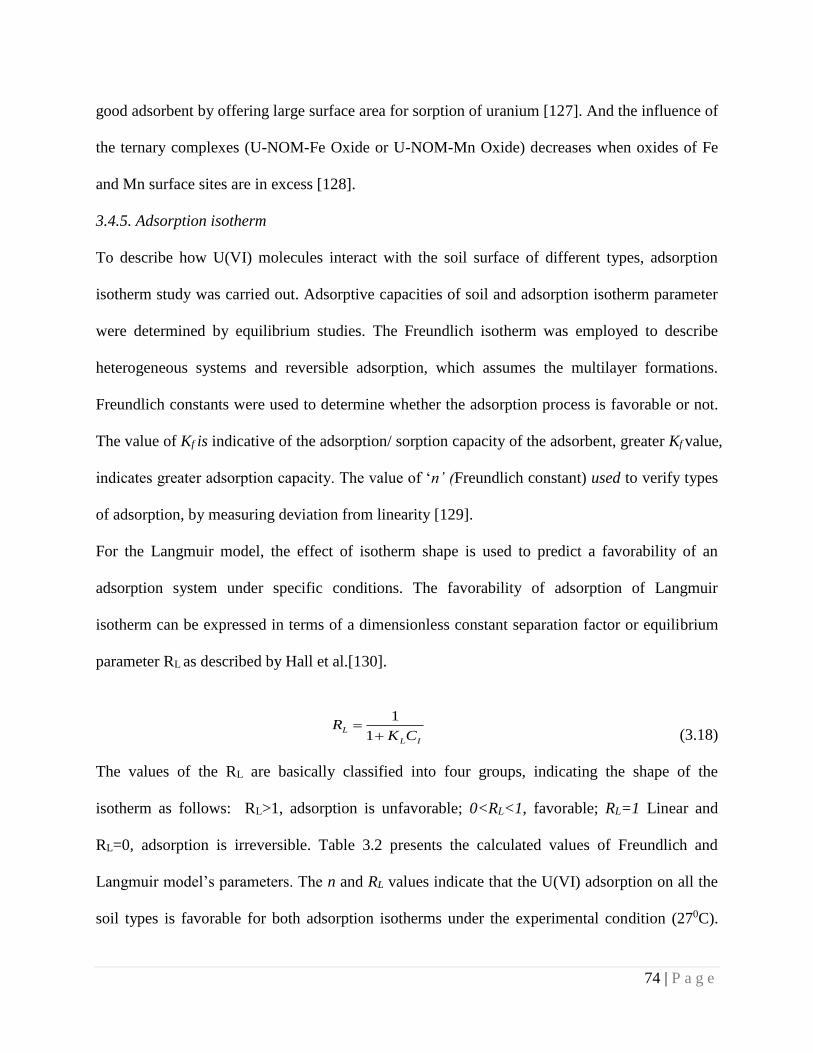
74 | P a g e
good adsorbent by offering large surface area for sorption of uranium [127]. And the influence of
the ternary complexes (U-NOM-Fe Oxide or U-NOM-Mn Oxide) decreases when oxides of Fe
and Mn surface sites are in excess [128].
3.4.5. Adsorption isotherm
To describe how U(VI) molecules interact with the soil surface of different types, adsorption
isotherm study was carried out. Adsorptive capacities of soil and adsorption isotherm parameter
were determined by equilibrium studies. The Freundlich isotherm was employed to describe
heterogeneous systems and reversible adsorption, which assumes the multilayer formations.
Freundlich constants were used to determine whether the adsorption process is favorable or not.
The value of Kf is indicative of the adsorption/ sorption capacity of the adsorbent, greater Kf value,
indicates greater adsorption capacity. The value of ‘n’ (Freundlich constant) used to verify types
of adsorption, by measuring deviation from linearity [129].
For the Langmuir model, the effect of isotherm shape is used to predict a favorability of an
adsorption system under specific conditions. The favorability of adsorption of Langmuir
isotherm can be expressed in terms of a dimensionless constant separation factor or equilibrium
parameter RL as described by Hall et al.[130].
(3.18)
The values of the RL are basically classified into four groups, indicating the shape of the
isotherm as follows: RL>1, adsorption is unfavorable; 0<RL<1, favorable; RL=1 Linear and
RL=0, adsorption is irreversible. Table 3.2 presents the calculated values of Freundlich and
Langmuir model’s parameters. The n and RL values indicate that the U(VI) adsorption on all the
soil types is favorable for both adsorption isotherms under the experimental condition (270C).
IL
LCK
R
1
1
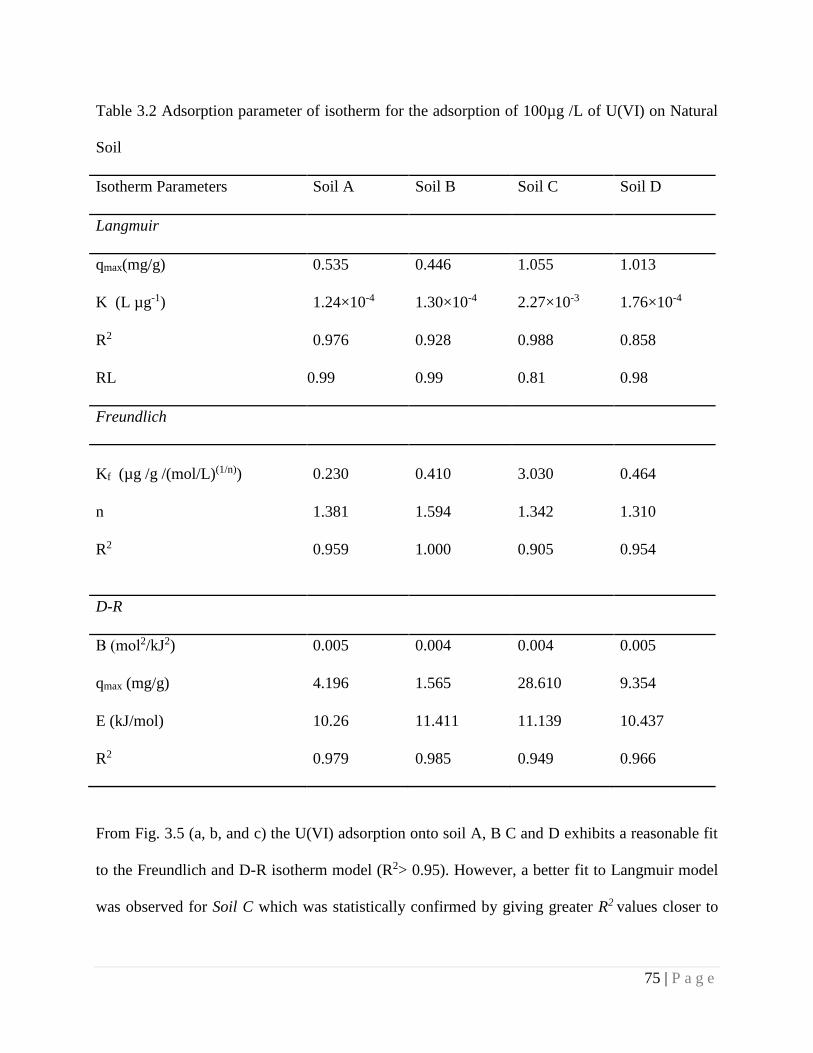
75 | P a g e
Table 3.2 Adsorption parameter of isotherm for the adsorption of 100µg /L of U(VI) on Natural
Soil
Isotherm Parameters Soil A Soil B Soil C Soil D
Langmuir
qmax(mg/g) 0.535 0.446 1.055 1.013
K (L µg-1) 1.24×10⁻⁴ 1.30×10⁻⁴ 2.27×10⁻³ 1.76×10⁻⁴
R2 0.976 0.928 0.988 0.858
RL 0.99 0.99 0.81 0.98
Freundlich
Kf (µg /g /(mol/L)(1/n)) 0.230 0.410 3.030 0.464
n 1.381 1.594 1.342 1.310
R2 0.959 1.000 0.905 0.954
D-R
Β (mol2/kJ2) 0.005 0.004 0.004 0.005
qmax (mg/g) 4.196 1.565 28.610 9.354
E (kJ/mol) 10.26 11.411 11.139 10.437
R2 0.979 0.985 0.949 0.966
From Fig. 3.5 (a, b, and c) the U(VI) adsorption onto soil A, B C and D exhibits a reasonable fit
to the Freundlich and D-R isotherm model (R2> 0.95). However, a better fit to Langmuir model
was observed for Soil C which was statistically confirmed by giving greater R2 values closer to
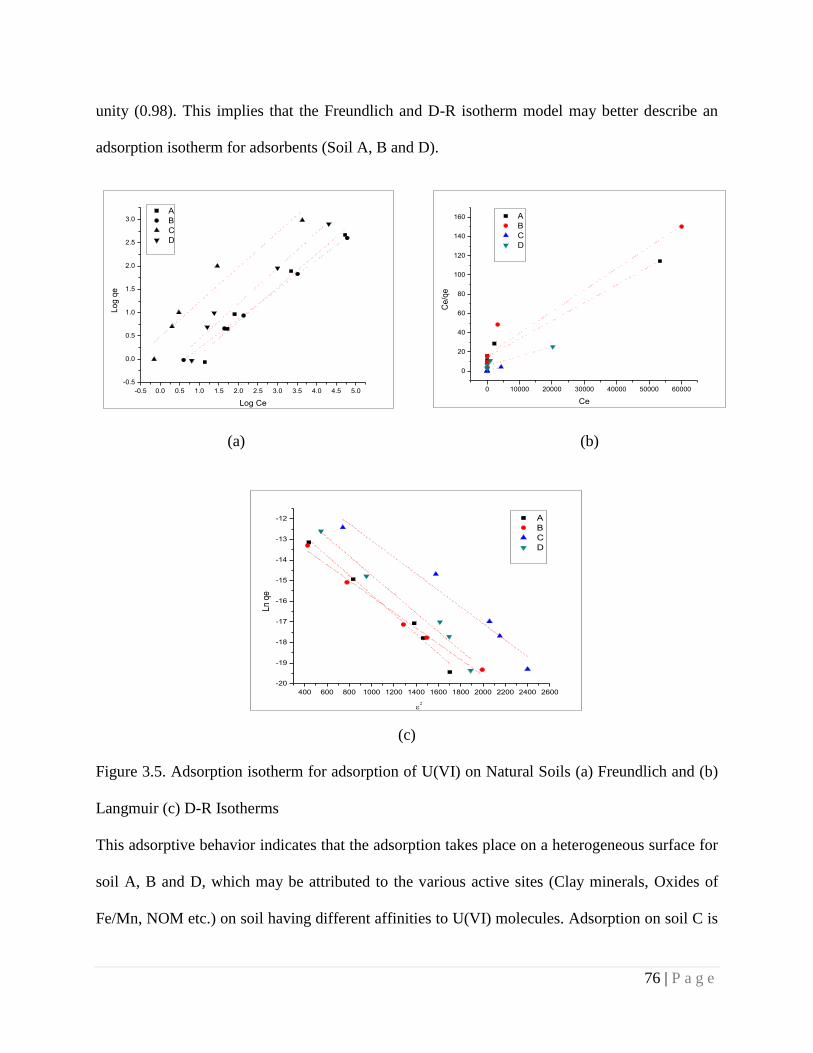
76 | P a g e
unity (0.98). This implies that the Freundlich and D-R isotherm model may better describe an
adsorption isotherm for adsorbents (Soil A, B and D).
(a) (b)
(a) (b)
(c)
(c)
Figure 3.5. Adsorption isotherm for adsorption of U(VI) on Natural Soils (a) Freundlich and (b)
Langmuir (c) D-R Isotherms
This adsorptive behavior indicates that the adsorption takes place on a heterogeneous surface for
soil A, B and D, which may be attributed to the various active sites (Clay minerals, Oxides of
Fe/Mn, NOM etc.) on soil having different affinities to U(VI) molecules. Adsorption on soil C is
-0.5 0.0 0.5 1.0 1.5 2.0 2.5 3.0 3.5 4.0 4.5 5.0
-0.5
0.0
0.5
1.0
1.5
2.0
2.5
3.0
Lo
g q
e
Log Ce
A
B
C
D
0 10000 20000 30000 40000 50000 60000
0
20
40
60
80
100
120
140
160 A
B
C
D
Ce
/qe
Ce
400 600 800 1000 1200 1400 1600 1800 2000 2200 2400 2600
-20
-19
-18
-17
-16
-15
-14
-13
-12 A
B
C
D
Ln
qe
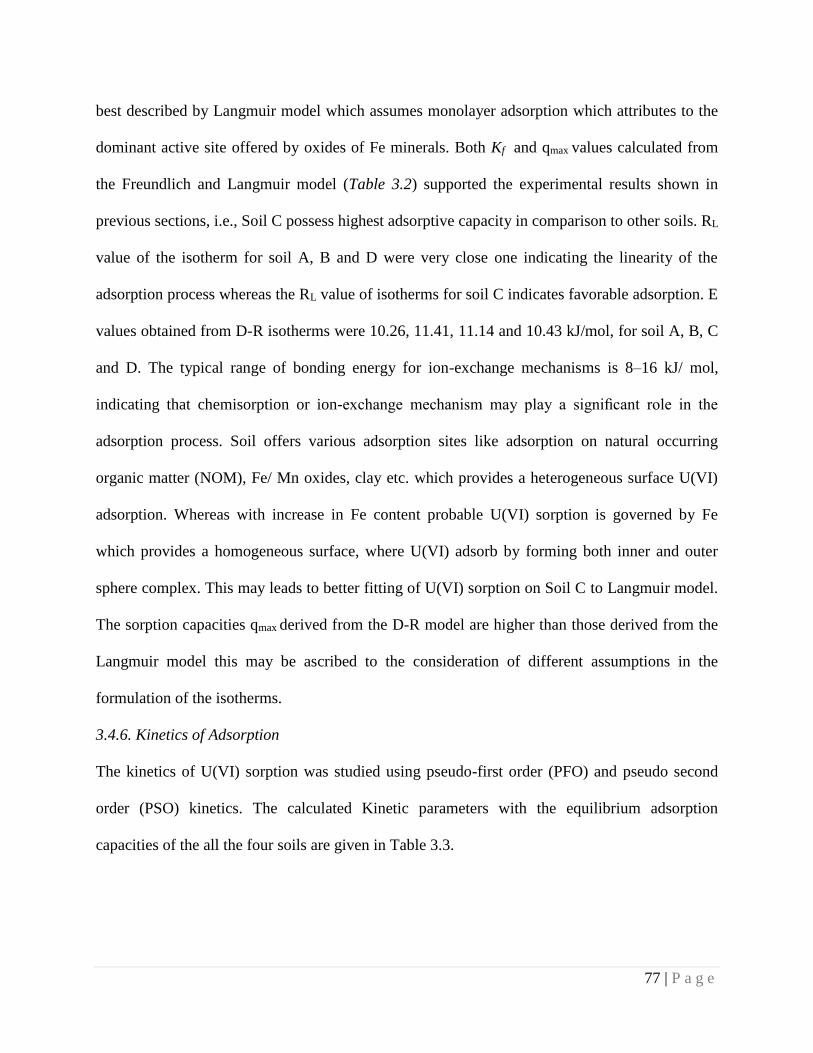
77 | P a g e
best described by Langmuir model which assumes monolayer adsorption which attributes to the
dominant active site offered by oxides of Fe minerals. Both Kf and qmax values calculated from
the Freundlich and Langmuir model (Table 3.2) supported the experimental results shown in
previous sections, i.e., Soil C possess highest adsorptive capacity in comparison to other soils. RL
value of the isotherm for soil A, B and D were very close one indicating the linearity of the
adsorption process whereas the RL value of isotherms for soil C indicates favorable adsorption. E
values obtained from D-R isotherms were 10.26, 11.41, 11.14 and 10.43 kJ/mol, for soil A, B, C
and D. The typical range of bonding energy for ion-exchange mechanisms is 8–16 kJ/ mol,
indicating that chemisorption or ion-exchange mechanism may play a significant role in the
adsorption process. Soil offers various adsorption sites like adsorption on natural occurring
organic matter (NOM), Fe/ Mn oxides, clay etc. which provides a heterogeneous surface U(VI)
adsorption. Whereas with increase in Fe content probable U(VI) sorption is governed by Fe
which provides a homogeneous surface, where U(VI) adsorb by forming both inner and outer
sphere complex. This may leads to better fitting of U(VI) sorption on Soil C to Langmuir model.
The sorption capacities qmax derived from the D-R model are higher than those derived from the
Langmuir model this may be ascribed to the consideration of different assumptions in the
formulation of the isotherms.
3.4.6. Kinetics of Adsorption
The kinetics of U(VI) sorption was studied using pseudo-first order (PFO) and pseudo second
order (PSO) kinetics. The calculated Kinetic parameters with the equilibrium adsorption
capacities of the all the four soils are given in Table 3.3.
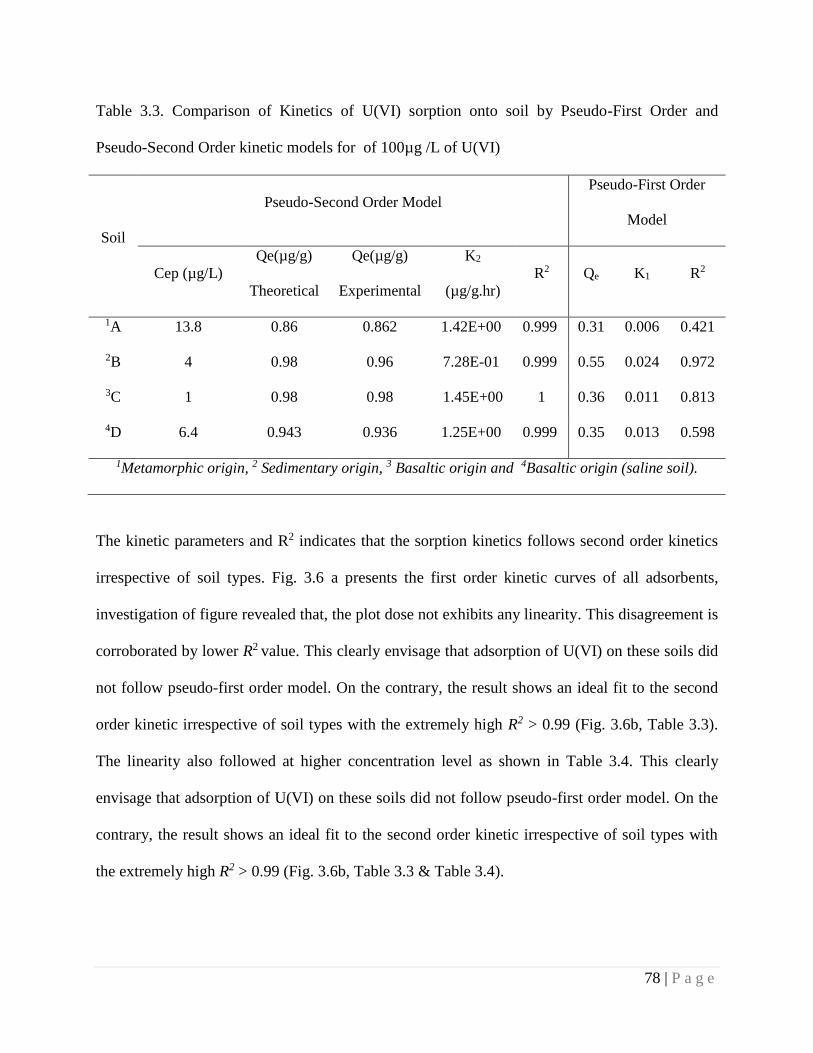
78 | P a g e
Table 3.3. Comparison of Kinetics of U(VI) sorption onto soil by Pseudo-First Order and
Pseudo-Second Order kinetic models for of 100µg /L of U(VI)
Soil
Pseudo-Second Order Model
Pseudo-First Order
Model
Cep (µg/L)
Qe(µg/g)
Theoretical
Qe(µg/g)
Experimental
K2
(µg/g.hr)
R2 Qe K1 R2
1A 13.8 0.86 0.862 1.42E+00 0.999 0.31 0.006 0.421
2B 4 0.98 0.96 7.28E-01 0.999 0.55 0.024 0.972
3C 1 0.98 0.98 1.45E+00 1 0.36 0.011 0.813
4D 6.4 0.943 0.936 1.25E+00 0.999 0.35 0.013 0.598
1Metamorphic origin, 2 Sedimentary origin, 3 Basaltic origin and 4Basaltic origin (saline soil).
The kinetic parameters and R2 indicates that the sorption kinetics follows second order kinetics
irrespective of soil types. Fig. 3.6 a presents the first order kinetic curves of all adsorbents,
investigation of figure revealed that, the plot dose not exhibits any linearity. This disagreement is
corroborated by lower R2 value. This clearly envisage that adsorption of U(VI) on these soils did
not follow pseudo-first order model. On the contrary, the result shows an ideal fit to the second
order kinetic irrespective of soil types with the extremely high R2 > 0.99 (Fig. 3.6b, Table 3.3).
The linearity also followed at higher concentration level as shown in Table 3.4. This clearly
envisage that adsorption of U(VI) on these soils did not follow pseudo-first order model. On the
contrary, the result shows an ideal fit to the second order kinetic irrespective of soil types with
the extremely high R2 > 0.99 (Fig. 3.6b, Table 3.3 & Table 3.4).
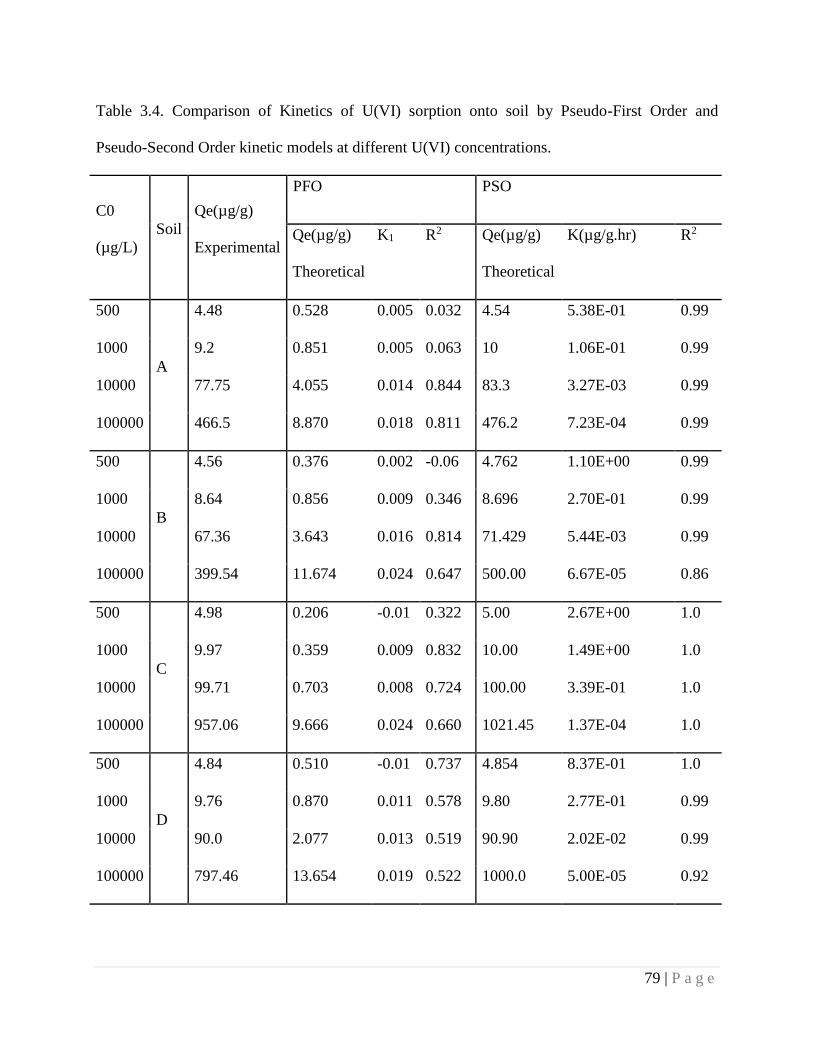
79 | P a g e
Table 3.4. Comparison of Kinetics of U(VI) sorption onto soil by Pseudo-First Order and
Pseudo-Second Order kinetic models at different U(VI) concentrations.
C0
(µg/L)
Soil
Qe(µg/g)
Experimental
PFO PSO
Qe(µg/g)
Theoretical
K1 R2 Qe(µg/g)
Theoretical
K(µg/g.hr) R2
500
A
4.48 0.528 0.005 0.032 4.54 5.38E-01 0.99
1000 9.2 0.851 0.005 0.063 10 1.06E-01 0.99
10000 77.75 4.055 0.014 0.844 83.3 3.27E-03 0.99
100000 466.5 8.870 0.018 0.811 476.2 7.23E-04 0.99
500
B
4.56 0.376 0.002 -0.06 4.762 1.10E+00 0.99
1000 8.64 0.856 0.009 0.346 8.696 2.70E-01 0.99
10000 67.36 3.643 0.016 0.814 71.429 5.44E-03 0.99
100000 399.54 11.674 0.024 0.647 500.00 6.67E-05 0.86
500
C
4.98 0.206 -0.01 0.322 5.00 2.67E+00 1.0
1000 9.97 0.359 0.009 0.832 10.00 1.49E+00 1.0
10000 99.71 0.703 0.008 0.724 100.00 3.39E-01 1.0
100000 957.06 9.666 0.024 0.660 1021.45 1.37E-04 1.0
500
D
4.84 0.510 -0.01 0.737 4.854 8.37E-01 1.0
1000 9.76 0.870 0.011 0.578 9.80 2.77E-01 0.99
10000 90.0 2.077 0.013 0.519 90.90 2.02E-02 0.99
100000 797.46 13.654 0.019 0.522 1000.0 5.00E-05 0.92
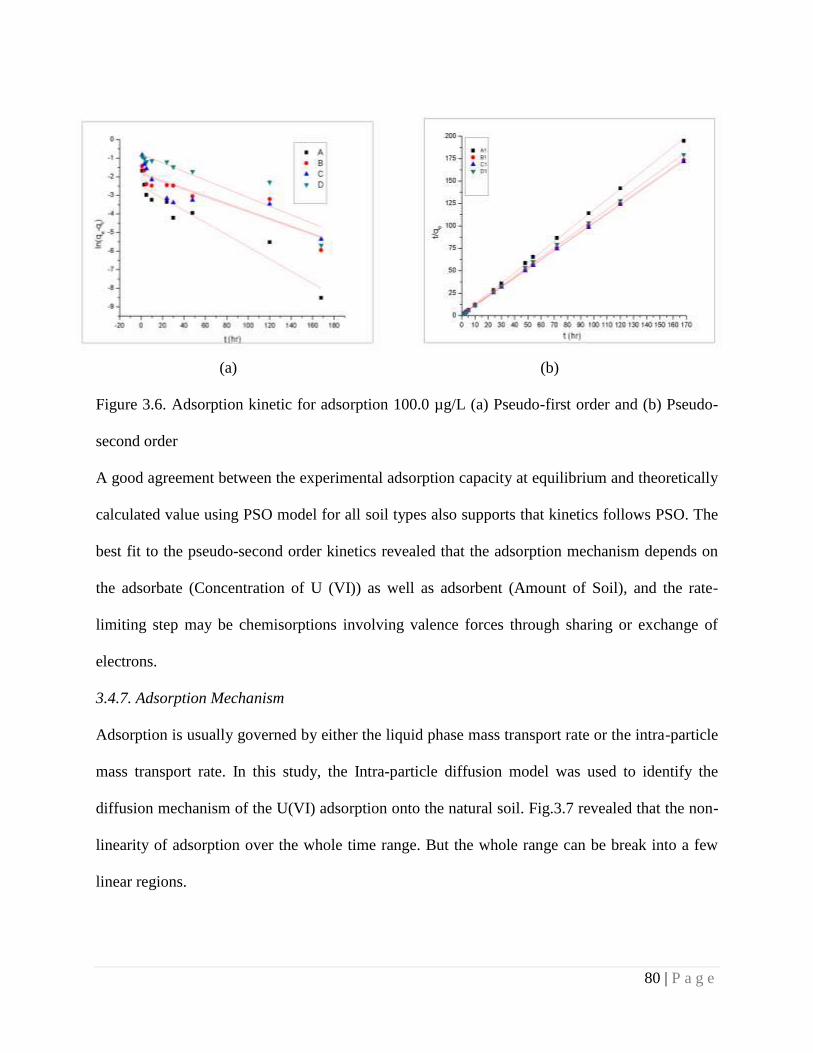
80 | P a g e
(a) (b)
Figure 3.6. Adsorption kinetic for adsorption 100.0 µg/L (a) Pseudo-first order and (b) Pseudo-
second order
A good agreement between the experimental adsorption capacity at equilibrium and theoretically
calculated value using PSO model for all soil types also supports that kinetics follows PSO. The
best fit to the pseudo-second order kinetics revealed that the adsorption mechanism depends on
the adsorbate (Concentration of U (VI)) as well as adsorbent (Amount of Soil), and the rate-
limiting step may be chemisorptions involving valence forces through sharing or exchange of
electrons.
3.4.7. Adsorption Mechanism
Adsorption is usually governed by either the liquid phase mass transport rate or the intra-particle
mass transport rate. In this study, the Intra-particle diffusion model was used to identify the
diffusion mechanism of the U(VI) adsorption onto the natural soil. Fig.3.7 revealed that the non-
linearity of adsorption over the whole time range. But the whole range can be break into a few
linear regions.
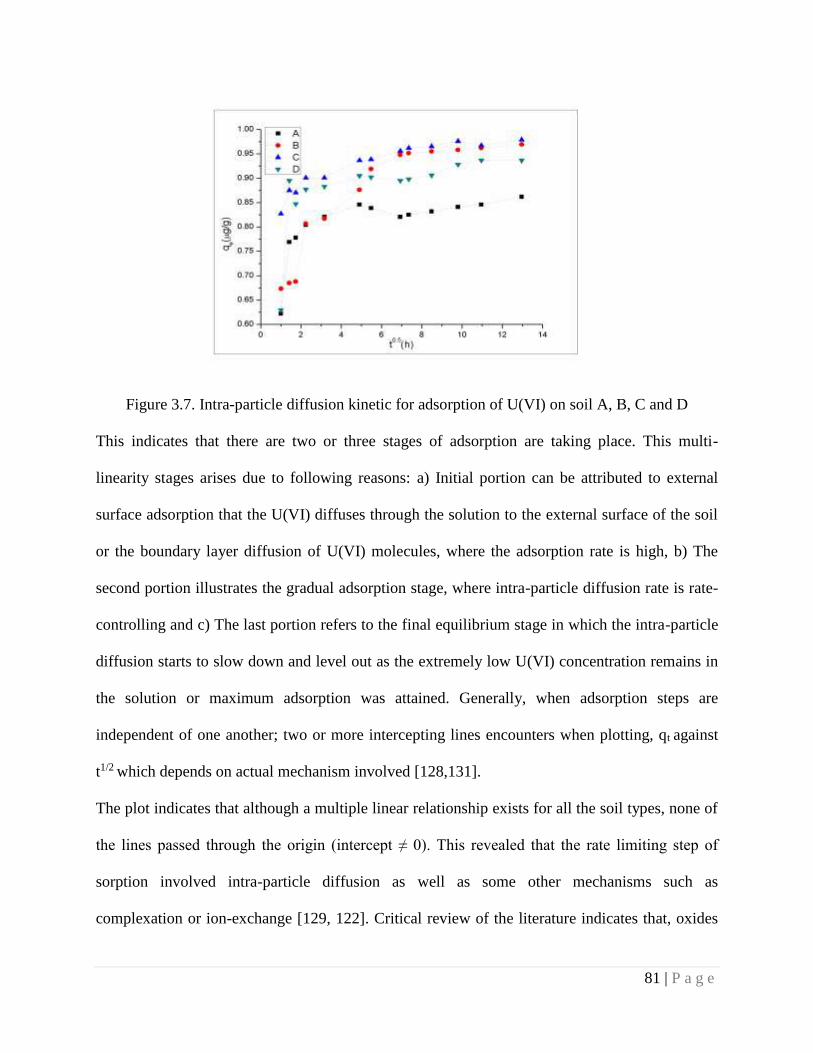
81 | P a g e
Figure 3.7. Intra-particle diffusion kinetic for adsorption of U(VI) on soil A, B, C and D
This indicates that there are two or three stages of adsorption are taking place. This multi-
linearity stages arises due to following reasons: a) Initial portion can be attributed to external
surface adsorption that the U(VI) diffuses through the solution to the external surface of the soil
or the boundary layer diffusion of U(VI) molecules, where the adsorption rate is high, b) The
second portion illustrates the gradual adsorption stage, where intra-particle diffusion rate is rate-
controlling and c) The last portion refers to the final equilibrium stage in which the intra-particle
diffusion starts to slow down and level out as the extremely low U(VI) concentration remains in
the solution or maximum adsorption was attained. Generally, when adsorption steps are
independent of one another; two or more intercepting lines encounters when plotting, qt against
t1/2 which depends on actual mechanism involved [128,131].
The plot indicates that although a multiple linear relationship exists for all the soil types, none of
the lines passed through the origin (intercept ≠ 0). This revealed that the rate limiting step of
sorption involved intra-particle diffusion as well as some other mechanisms such as
complexation or ion-exchange [129, 122]. Critical review of the literature indicates that, oxides
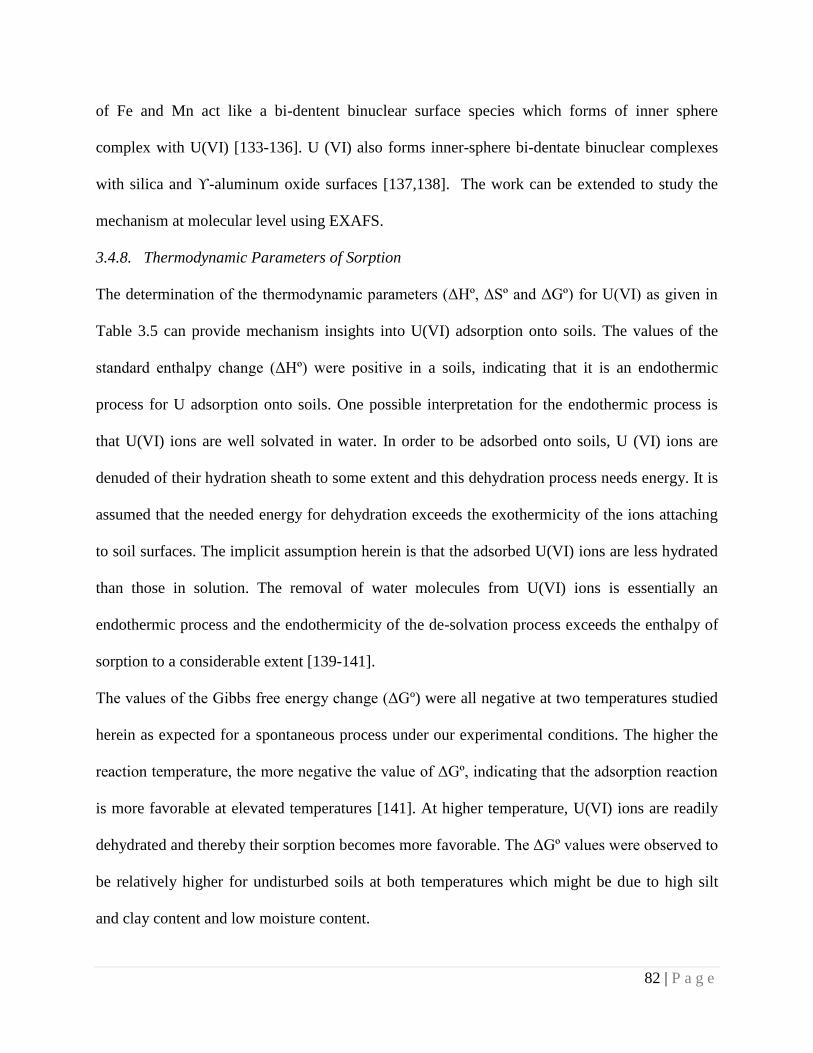
82 | P a g e
of Fe and Mn act like a bi-dentent binuclear surface species which forms of inner sphere
complex with U(VI) [133-136]. U (VI) also forms inner-sphere bi-dentate binuclear complexes
with silica and ϒ-aluminum oxide surfaces [137,138]. The work can be extended to study the
mechanism at molecular level using EXAFS.
3.4.8. Thermodynamic Parameters of Sorption
The determination of the thermodynamic parameters (ΔHº, ΔSº and ΔGº) for U(VI) as given in
Table 3.5 can provide mechanism insights into U(VI) adsorption onto soils. The values of the
standard enthalpy change (ΔHº) were positive in a soils, indicating that it is an endothermic
process for U adsorption onto soils. One possible interpretation for the endothermic process is
that U(VI) ions are well solvated in water. In order to be adsorbed onto soils, U (VI) ions are
denuded of their hydration sheath to some extent and this dehydration process needs energy. It is
assumed that the needed energy for dehydration exceeds the exothermicity of the ions attaching
to soil surfaces. The implicit assumption herein is that the adsorbed U(VI) ions are less hydrated
than those in solution. The removal of water molecules from U(VI) ions is essentially an
endothermic process and the endothermicity of the de-solvation process exceeds the enthalpy of
sorption to a considerable extent [139-141].
The values of the Gibbs free energy change (ΔGº) were all negative at two temperatures studied
herein as expected for a spontaneous process under our experimental conditions. The higher the
reaction temperature, the more negative the value of ΔGº, indicating that the adsorption reaction
is more favorable at elevated temperatures [141]. At higher temperature, U(VI) ions are readily
dehydrated and thereby their sorption becomes more favorable. The ΔGº values were observed to
be relatively higher for undisturbed soils at both temperatures which might be due to high silt
and clay content and low moisture content.
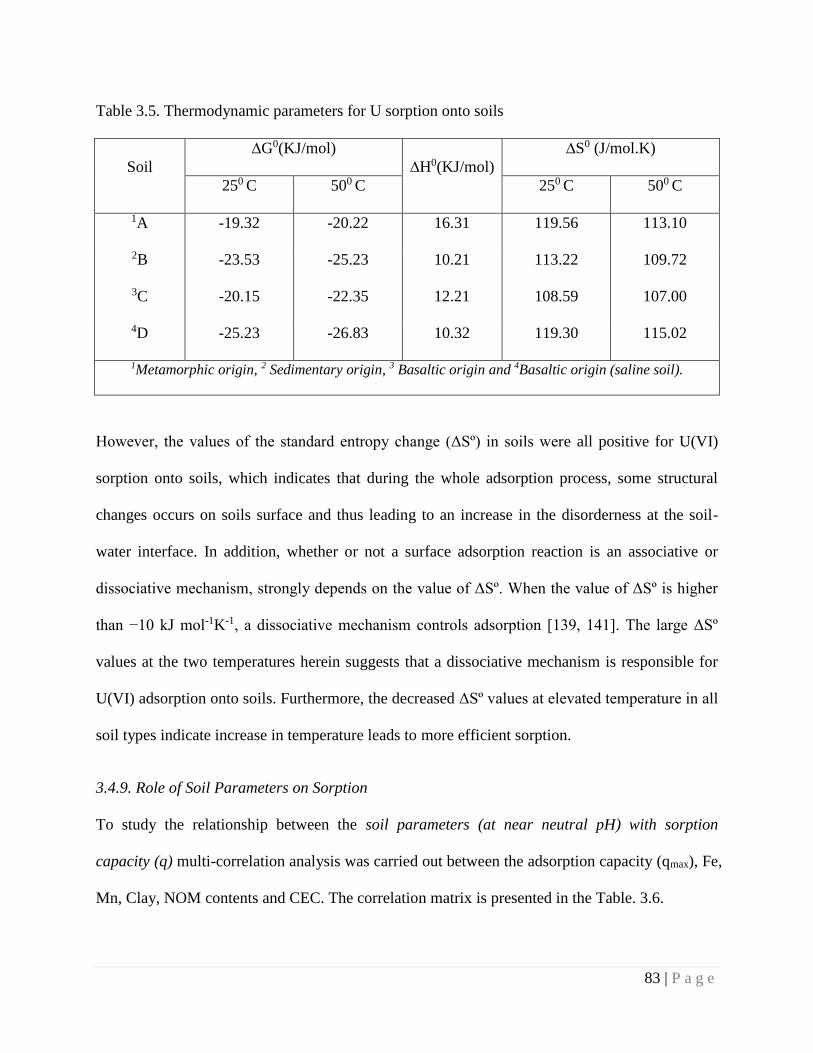
83 | P a g e
Table 3.5. Thermodynamic parameters for U sorption onto soils
Soil
∆G0(KJ/mol)
∆H0(KJ/mol)
∆S0 (J/mol.K)
250 C 500 C 250 C 500 C
1A -19.32 -20.22 16.31 119.56 113.10
2B -23.53 -25.23 10.21 113.22 109.72
3C -20.15 -22.35 12.21 108.59 107.00
4D -25.23 -26.83 10.32 119.30 115.02
1Metamorphic origin, 2 Sedimentary origin, 3 Basaltic origin and 4Basaltic origin (saline soil).
However, the values of the standard entropy change (ΔSº) in soils were all positive for U(VI)
sorption onto soils, which indicates that during the whole adsorption process, some structural
changes occurs on soils surface and thus leading to an increase in the disorderness at the soil-
water interface. In addition, whether or not a surface adsorption reaction is an associative or
dissociative mechanism, strongly depends on the value of ΔSº. When the value of ΔSº is higher
than −10 kJ mol-1K-1, a dissociative mechanism controls adsorption [139, 141]. The large ΔSº
values at the two temperatures herein suggests that a dissociative mechanism is responsible for
U(VI) adsorption onto soils. Furthermore, the decreased ΔSº values at elevated temperature in all
soil types indicate increase in temperature leads to more efficient sorption.
3.4.9. Role of Soil Parameters on Sorption
To study the relationship between the soil parameters (at near neutral pH) with sorption
capacity (q) multi-correlation analysis was carried out between the adsorption capacity (qmax), Fe,
Mn, Clay, NOM contents and CEC. The correlation matrix is presented in the Table. 3.6.
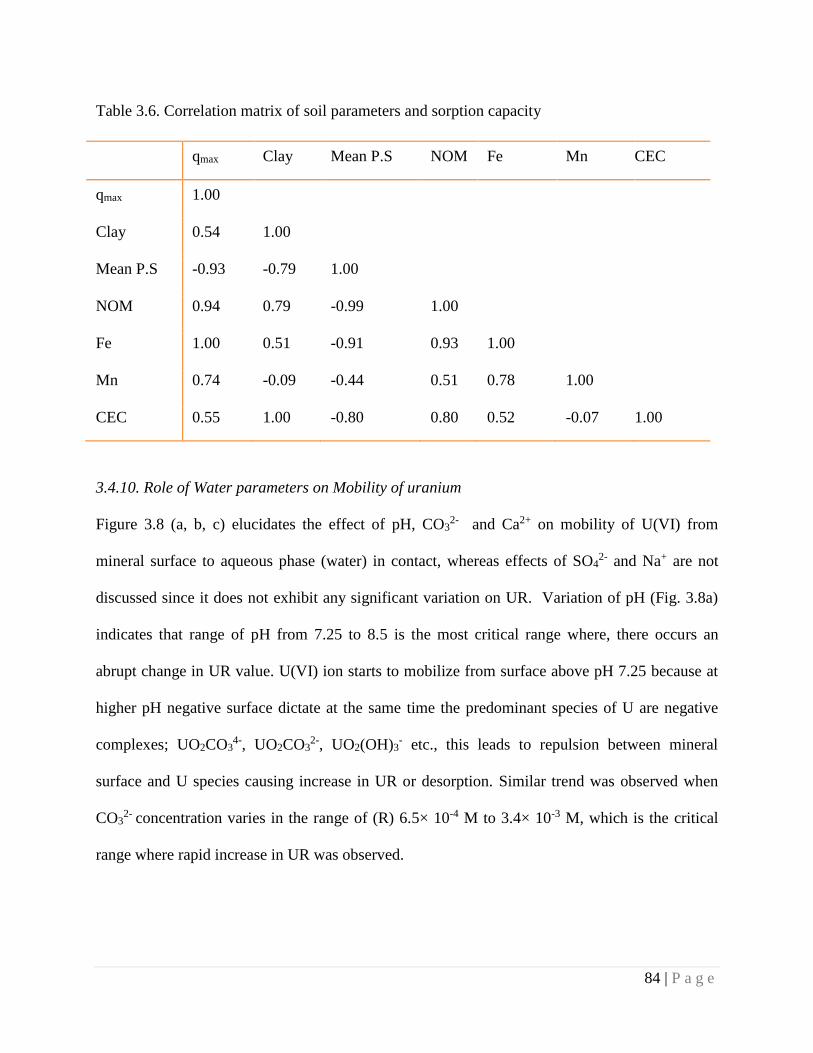
84 | P a g e
Table 3.6. Correlation matrix of soil parameters and sorption capacity
3.4.10. Role of Water parameters on Mobility of uranium
Figure 3.8 (a, b, c) elucidates the effect of pH, CO32- and Ca2+ on mobility of U(VI) from
mineral surface to aqueous phase (water) in contact, whereas effects of SO42- and Na+ are not
discussed since it does not exhibit any significant variation on UR. Variation of pH (Fig. 3.8a)
indicates that range of pH from 7.25 to 8.5 is the most critical range where, there occurs an
abrupt change in UR value. U(VI) ion starts to mobilize from surface above pH 7.25 because at
higher pH negative surface dictate at the same time the predominant species of U are negative
complexes; UO2CO34-, UO2CO3
2-, UO2(OH)3- etc., this leads to repulsion between mineral
surface and U species causing increase in UR or desorption. Similar trend was observed when
CO32- concentration varies in the range of (R) 6.5× 10⁻⁴ M to 3.4× 10⁻³ M, which is the critical
range where rapid increase in UR was observed.
qmax Clay Mean P.S NOM Fe Mn CEC
qmax 1.00
Clay 0.54 1.00
Mean P.S -0.93 -0.79 1.00
NOM 0.94 0.79 -0.99 1.00
Fe 1.00 0.51 -0.91 0.93 1.00
Mn 0.74 -0.09 -0.44 0.51 0.78 1.00
CEC 0.55 1.00 -0.80 0.80 0.52 -0.07 1.00
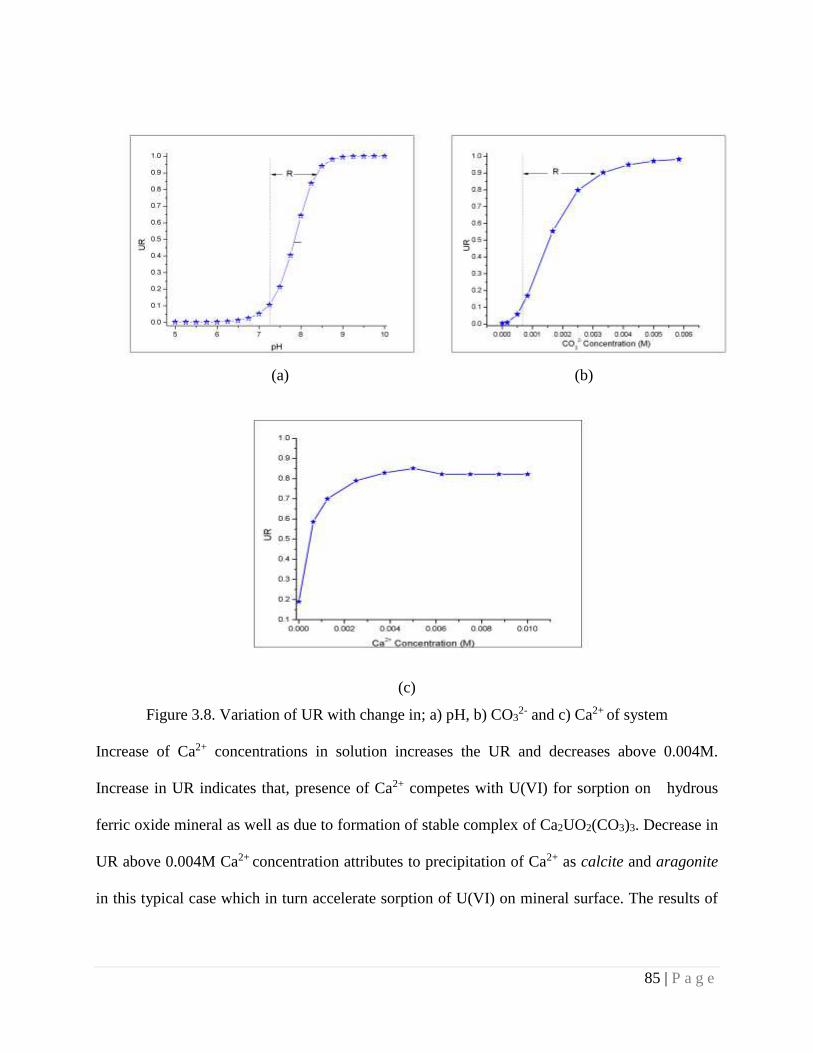
85 | P a g e
(a) (b)
(c)
Figure 3.8. Variation of UR with change in; a) pH, b) CO32- and c) Ca2+ of system
Increase of Ca2+ concentrations in solution increases the UR and decreases above 0.004M.
Increase in UR indicates that, presence of Ca2+ competes with U(VI) for sorption on hydrous
ferric oxide mineral as well as due to formation of stable complex of Ca2UO2(CO3)3. Decrease in
UR above 0.004M Ca2+ concentration attributes to precipitation of Ca2+ as calcite and aragonite
in this typical case which in turn accelerate sorption of U(VI) on mineral surface. The results of
86 | P a g e
the sensitivity analysis is presented in terms sensitivity index (SIUR) and it was found that, SIUR
for pH, CO32-, SO4
2- Ca2+ and Na+ are -1.55,-1.43,-0.001,-0.85 and -0.02, respectively.
This shows pH and CO32-extremely affecting followed by moderately by Ca2+and affected up to
miner level by Na+ and SO42-. The –ve sign indicates that with increase in the concentrations of
the said parameters UR increases i.e., aqueous U(VI) increases due to competitive sorption on
hydrous ferric oxide mineral surface as well as due to formation of stable soluble complexes.
3.5. Summary
The study of uranium behavior at soil-water interface is highly complex. Sorption study revealed
that adsorption/sorption capacity of soil for uranium, increases with Fe, Mn and NOM content.
The Fe-Mn controlled sorption system is least affected by organic content (NOM) at
circumneutral pH. Among water parameters pH, CO32- and Ca2+ are sensitive parameters which
influence U(VI) mobility at soil water interface. Sorption followed pseudo-second order model
with multi-step diffusion process irrespective of soil types and the rate-limiting step is
chemisorptions involving valence forces through sharing or exchange of electrons along with ion
exchange. The Freundlich and D-R isotherm model were found to be the best describe the
adsorption of U(VI) onto soil A, B and D whereas Langmuir model describe the adsorption of
U(VI) on soil C. Presence of High Fe and Mn content provides a homogeneous surface which
accelerate the monolayer sorption. Thermodynamic parameters infer that sorption is spontaneous,
endothermic in nature and follows dissociative mechanism. The study also revealed that
geological setup with high ferro-manganese content is best location for waste disposal facilities
or geological repository. Thus the Fe or Mn enriched soils can be used as backfill to mitigate
migration of U.
87 | P a g e
Chapter 4
Chemical Fractionation of Uranium in Soil
4.1. Introduction
U concentrations can be found in all environmental matrices, inevitably leading to the exposure
of human and non-human biota. From chapter 3 it is clear that geochemical behavior of soil
plays important role as it immobilizes the uranium in different soil pools till not subjected to any
natural or anthropogenic disturbances. To better assess the environmental impact of U, more
information relating to its migration and bio-availability in soils is necessary. U may be present
in soil as precipitated, sorbed, complexed and reduced forms, which impact its mobility and fate
in the surface as well as subsurface soil environment. Behavior and bioavailability of U in a soil
is a function of U speciation/ association in soil which in turn depends on soil properties.
Important soil properties that influence the chemical and physical behavior of U includes pH,
oxides (and hydroxides) of Fe, Mn, Al and Si, carbonate minerals and organic matter (OM)
contents [142-146]. It is already discussed that, when U comes in contact with soil it may go to
one or several fractions/pools in soil such as, Exchangeable, Carbonate, Reducible fraction
(Oxides and hydroxides of Fe, Mn), Oxidizable fraction (Organic matter: OM), Acid leachable
fraction (Secondary minerals) and Residual fraction (Primary minerals). And the mobility and
bioavailability of U in the environment depend not only on total concentration but also on their
association with the solid phase (fractions) to which it is bound. It is very important to study the
solid phase chemical fractionation of U in soil. In addition to this if there is a chance of
rearrangement of the U within different pools of soil with time, this may lead to another question
on safety of radioactive waste management. There are many research articles on the solid phase
88 | P a g e
chemical fractionation of uranium in soil, which encompass mainly, case studies for pollution
status enquiry and development or modification of analytical methods for sequential extraction
only [147-149]. What will happen to the bound uranium with time is not found in literature.
4.2. Present Work
Work was carried out to understand the chemical fractionation of U in soils from different origin
and impact of ageing on chemical fractionation. This study integrated batch experiments of U(VI)
adsorption to soil, study of U in different soil fractions, ageing impact on fractionation of U and
spectroscopic investigation of adsorbed U(VI) using X-ray Photoelectron Spectroscopy (XPS).
This integrated approach of studying both wet chemistry and spectroscopic investigation will
come out with valuable information, which may be helpful to predict the bioavailability of U in
soil and design of remediation technique.
4.3. Methodology
4.3.1. Soil sample and its Characterization
For the study, soil A (Metamorphic origin), B (Sedimentary origin) and C (Igneous Basalt origin)
were chosen. Physico-chemical characteristic of the pre-amended soil is already discussed in
chapter 3 (Table 3.1, Sec 3.4). Further soil characterization was carried out in amended soil, just
after amendment, after one month and after twelve months to investigate any change in soil
physico-chemical parameters. U content in soil was estimated in digested samples using
voltammetry.
4.3.2. Preparation of amended soil
To investigate the effect of ageing on fractionation of U in different soil fractions it is necessary
to know the initial date of contamination, which can be only possible by taking amended soil.
For the study all the three soils were amended with the water containing 100mg/L of U(VI) in
89 | P a g e
the ratio of 1:10 (g/mL: soil to solution). The mixture was agitated at 160 rpm in a rotary shaker
(SK-300, JIOTECH, Korea) at ambient temperature for 7 days. The 7 days of equilibration time
fixed based on our previous experience [147]. After 7 days the supernatant was removed by
centrifugation and the soil was allowed to dry at room temperature. Then soil samples were kept
as such undisturbed in the falcon tubes with regular opening, in order to provide an ambient
environment. The characterization of the soil samples was carried out as described in previous
section in order to monitor any change in properties of amended soil but no noticeable change
was observed except the U was detected in the amended soil.
4.3.3. Sequential extraction
Sequential extraction for U was carried out two times, at an interval of one month and 12 months.
For extraction, processed homogenized soil samples (2 g) were subjected to a sequential
extraction method optimized for the quantification of actinides bound to soil to determine the soil
fraction to which U is bound [97] with little modification in method as discussed in Chapter 2
(Section 2.7.1). Total U was measured by complete digestion of the same samples. A
solution/sample ratio of 10 (mL/g) was used for extraction in each step. After extraction, the
leachate was separated from the solid residue by centrifugation at 3000 rpm for 20 min. Before
next step, the residue was rinsed with deionized water (18.2 MΩ cm-1) with a water/sample ratio
of 5 (mL/g) under stirring for 10 min, then the washing water was combined with leachate after
centrifugation. The combined solution was filtered through 0.45 µm Millipore filter paper to
remove the small particles. The remaining solid on the membrane was combined with the residue
for the leaching of next step. All reaction steps were done in duplicates and aliquots from each
step were analyzed for U using voltammetry.
90 | P a g e
4.3.4. Methodology for XPS Analysis
XPS analysis of 12th month aged samples was carried out to have a better understanding of
rearrangements of U in different soil fractions. All XPS spectra were collected on an ESCA
apparatus (Make SPECS GmbH) in constant analyzer energy mode. The powdered samples in
form of pellets were fixed on sample holder with double sided carbon tape before being placed in
the analysis chamber (10-10 mbar vacuum). As the studied compounds were electric insulators,
the obtained spectra were corrected from the charge effect using as internal reference the C 1s
line from adventitious aliphatic carbon (284.6 eV). The recorded lines in the spectral regions
corresponding to U 4f, Fe 2p and C 1s were fitted using the XPSPEAK 3.0 program after
subtraction of the background (Shirley baseline).
4.4. Results and Discussion
As the physiochemical parameters of soil and the interaction of U with various soil components
determines the dynamics and chemical fractionation of U in the soil, important characteristics
were determined in all the three soils after amendment. The physicochemical parameter data
generated were compared with the physicochemical parameters of pre-amended soil which were
discussed in chapter 3 (Table 3.1, Sec. 3.4). Study revealed that, there is no change in soil
properties after amendment except the U was detected in amended soil. The total U content was
found to be maximum in soil C (797.5 mg/kg) followed by 466.5 mg/kg in A and 399 mg/kg in
B. The highest adsorption capacity of C can be correlated to its properties, such as high content
of OM, Fe and Mn as well as minimum particle size distribution. The lower adsorption capacity
of B in comparison to the A although both are chemically not significantly different attributes to
higher pH (8.2) which decreases the adsorption of U(VI) on soil during the equilibration period.
In amended soil, particle size distribution indicates that average soil textural distribution were in
91 | P a g e
the order of 36 µm for soil C followed by 80 and 90 µm for A and B respectively. The highest
organic content was measured for C (1.44%) followed by B (0.15%) and A (0.06%). The Fe and
Mn content in the soil were found to be maximum in C (Fe: 5.3% and Mn: 1852 mg/kg), A (Fe:
2.6% and Mn: 246 mg/kg) and B (Fe: 2.2% and Mn:196 mg/kg). The highest cation exchange
capacity was evaluated for B (22.12 meq/100g) followed by C (18.8 meq/100g) and A
(5.6meq/100g) respectively. The mineralogical data generated by XRD revealed that C
dominated by minerals from the family of plagioclase and mica, whereas B and A mainly
dominated by quartz with a small percentage of carbonate and mica mineral family.
4.4.1. Chemical Speciation of U
When studying the solid phase chemical fractionation of U in different fractions or pools of soil
samples using sequential extraction after one month (Table 4.1), it was observed that U is not
uniformly distributed in all fractions. The first fraction (F1) extracted (Exchangeable) is the
water soluble and exchangeable fraction which contains water soluble species such as the free
uranyl ion and weakly adsorbed U species. As such it represents the most mobile and potentially
most available U species in the environment and for the soil C and A, a very small portion (<5%)
of total uranium associated with this phase, whereas in case of B which is alkaline in nature
about 54 % is associated to exchangeable fraction (F1). The Second fraction (F2), which contains
U in carbonate, shows that about 32.19 % of total U exists in this phase for B followed by
17.51% in A and 4.52% in C. Formation of these complexes is dependent on the pH and
increases the solubility and availability of U [146, 148]. The association of U to this fraction may
be attributed to the high carbonate content which favors the formation of stable Uranly –
carbonate complex [145]. An attempt was made to find correlations of the percentage U
extracted by the exchangeable fraction (F1) with the clay content or with the CEC of the three
92 | P a g e
soils. This was done based on the Pearson and Spearman correlation coefficients, but no
dependence was observed (r2~0.62). For the percentage U extracted by the carbonate fraction
(F2), a good correlation was found with the CaCO3 content of the soils (r2~0.82). The third
fraction (F3) is the reducible fraction which includes the oxides of Fe and Mn. Uranium can be
scavenged by these oxides through adsorption and/or co-precipitation [149]. The highest relative
amounts of U associated with reducible fraction (F3) is for soil C (61.1%) followed by B (6.35%)
and A (4.13%). The relative amount of U extracted by the reducible fraction can however be
related to the total Fe and Mn content of the soils (r2~0.98). According to Schultz the fourth
fraction (F4) comprises the U associated to soil organic matter which is called as oxidizable
phase. The highest U associated to oxidizable phase for C followed by A and B. The correlation
between the relative U content and OM was found to be 0.83. The last fraction (F5) which
consists of both acid leachable and residual was extracted by complete digestion and it was
found that about 69.0 % of total U bound to this fraction in A followed by 23.74 in C and 5.72 in
B.
4.4.2. Rearrangement in Chemical Fractionation with ageing
Comparison of physiochemical properties of soil after an interval of 12 months indicates that
there is no significant change in any parameters, any change in the parametric value attributes to
the measurement uncertainty. But a very interesting result was observed when chemical
fractionation of U obtained by sequential extraction were compared (Table 4.1). The comparison
of the chemical fractionation of U in between one and 12 months aged soil samples revealed a
significant rearrangement occurred among the different fractions, where total U concentration is
remained unaltered (Fig. 4.1 a, b and c). This is expected as its closed system no chance of
removal of uranium from the system.
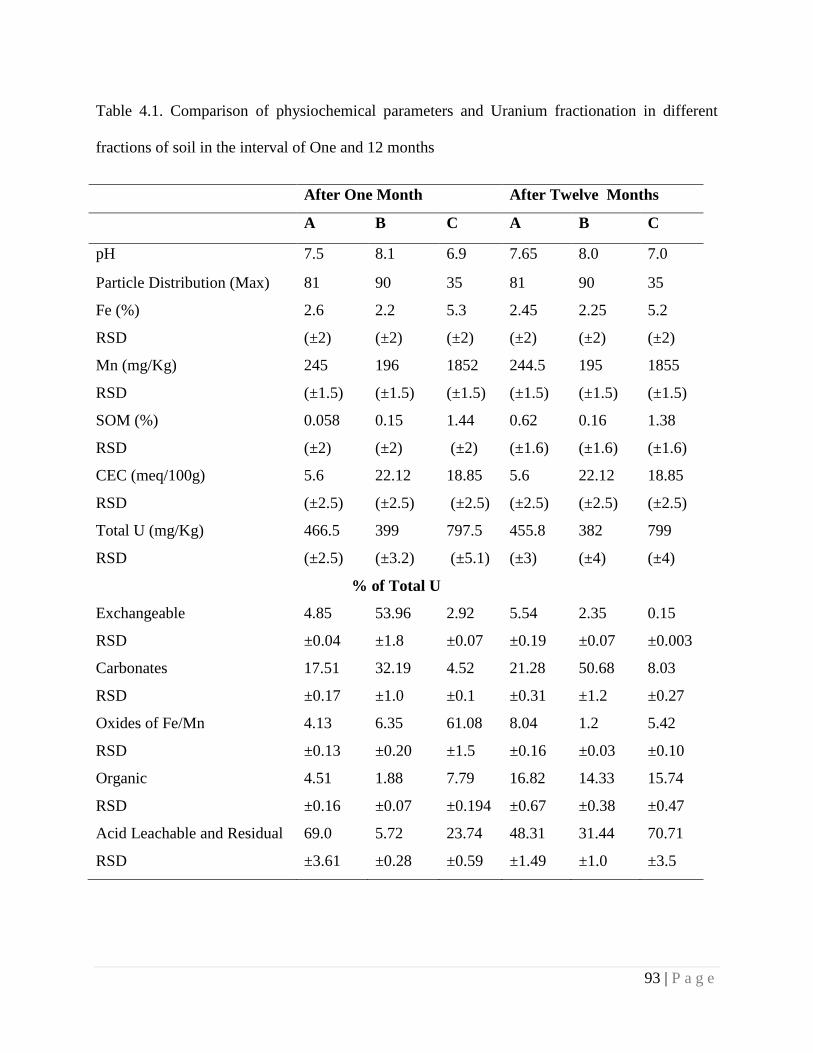
93 | P a g e
Table 4.1. Comparison of physiochemical parameters and Uranium fractionation in different
fractions of soil in the interval of One and 12 months
After One Month After Twelve Months
A B C A B C
pH 7.5 8.1 6.9 7.65 8.0 7.0
Particle Distribution (Max) 81 90 35 81 90 35
Fe (%)
RSD
2.6
(±2)
2.2
(±2)
5.3
(±2)
2.45
(±2)
2.25
(±2)
5.2
(±2)
Mn (mg/Kg)
RSD
245
(±1.5)
196
(±1.5)
1852
(±1.5)
244.5
(±1.5)
195
(±1.5)
1855
(±1.5)
SOM (%)
RSD
0.058
(±2)
0.15
(±2)
1.44
(±2)
0.62
(±1.6)
0.16
(±1.6)
1.38
(±1.6)
CEC (meq/100g)
RSD
5.6
(±2.5)
22.12
(±2.5)
18.85
(±2.5)
5.6
(±2.5)
22.12
(±2.5)
18.85
(±2.5)
Total U (mg/Kg)
RSD
466.5
(±2.5)
399
(±3.2)
797.5
(±5.1)
455.8
(±3)
382
(±4)
799
(±4)
% of Total U
Exchangeable
RSD
4.85
±0.04
53.96
±1.8
2.92
±0.07
5.54
±0.19
2.35
±0.07
0.15
±0.003
Carbonates
RSD
17.51
±0.17
32.19
±1.0
4.52
±0.1
21.28
±0.31
50.68
±1.2
8.03
±0.27
Oxides of Fe/Mn
RSD
4.13
±0.13
6.35
±0.20
61.08
±1.5
8.04
±0.16
1.2
±0.03
5.42
±0.10
Organic
RSD
4.51
±0.16
1.88
±0.07
7.79
±0.194
16.82
±0.67
14.33
±0.38
15.74
±0.47
Acid Leachable and Residual
RSD
69.0
±3.61
5.72
±0.28
23.74
±0.59
48.31
±1.49
31.44
±1.0
70.71
±3.5
94 | P a g e
Comparison revealed that there is increase in the U concentration in carbonate phase (F2) in all
the soil types and organic phase (F4) whereas decrease in the concentration of U in F3 (Oxides
of Fe and Mn). Comparison of U exchangeable fraction revealed that there is major decrease in
case of C and B, whereas a slight increase in case of A, which can be neglected considering
uncertainty in measurement.
Study of change in F5 (Acid leachable and residual) with ageing indicates that, there is an
increase in this fraction for C and B whereas decrease for A from 69% to 48%. This variation in
different soil types plausibly arises due to variability in mineralogical compositions: soil B and C
compose of smectite and illite respectively as important constituents whereas it’s a miner
constituent in case of soil A. And U(VI) forms structurally more bound (inner-sphere) complexes
with smectite and illite. Interestingly no correlation was derived between the U concentration in
different fraction and properties of that fraction except in F2, i.e., there exist a good correlation
between concentration of U in F2 and carbonate concentration. Looking at this significant
rearrangement of U in different fractions we assume a complex interplay between various soil
properties is going on with ageing and following assumptions were derived.
a) Decrease in the exchangeable fraction attributes to formation of more stable complex of
U with carbonates and organic matter or adsorption/co precipitation of U on oxides of Fe
and Mn.
b) Decreases in F3 (oxides of Fe and Mn) may be attribute to mobilization U in reducible
fraction due to re-oxidation [150] and this can be accelerated by carbonate, bicarbonate
complexation [151] and/ or occlusion of U-Fe(oxides/hydroxide) complex on amorphous
silica [152]. However, soil re-oxidation may not lead to complete removal of U from this
fraction because, during U mobilization from Fe-rich soil limited by sorption of U(VI) to
95 | P a g e
the secondary Fe(III) mineral [153]. But possibility of change in surface sites of Fe(III)
minerals with ages resulting U release from binding site can’t be ignored [154]. As per
occlusion is concerned it arises due to different in reaction time i.e., U adsorption to Fe-
(oxides/hydroxides) is relatively rapid, occurring within minutes to hour while, the
observed precipitation of silica occurred over several weeks or months. This sequence of
reaction (Uranium adsorption to iron bearing mineral such as ferrihydrite, followed by
precipitation of silica coating on ferrihydrite) leads to occlusion.
c) Increase in relative percentage of U in F4 (OM) attributed to micro-pore diffusion which
follows slow kinetics hence increases over period of time [155].
d) Increase in U concentration in the F5 (Acid leachable and Residual) may be correlated to
the occlusion of U to silica or increase in complexation (Inner sphere) with clay mineral
[156]. Decrease in case of A is probably from acid leachable fraction because the U
trapped in residual fraction only removes by complete destruction of alumino-silicate
structure.
4.4.3. Spectroscopic Study
The XPS study of 12th month soil samples were carried out to understand the process occurred
with ages. The overall XPS Spectrum of soil samples for U4f spectra is illustrated in figure 4.1.
The U 4f7/2 and 4f5/2 peaks occur around 380 and 390 eV, respectively. The spin–orbit interaction
separates these two levels by ~10-12 eV for U. The peak position varies in a narrow range as it is
dictated by the crystal structure, the influence of which is due to the nearest-neighbor ions.
Shake-up satellites are small peaks that are produced by photoelectrons that have lost part of
their initial energy to a valence-band electron. When a core-level electron is expelled, an
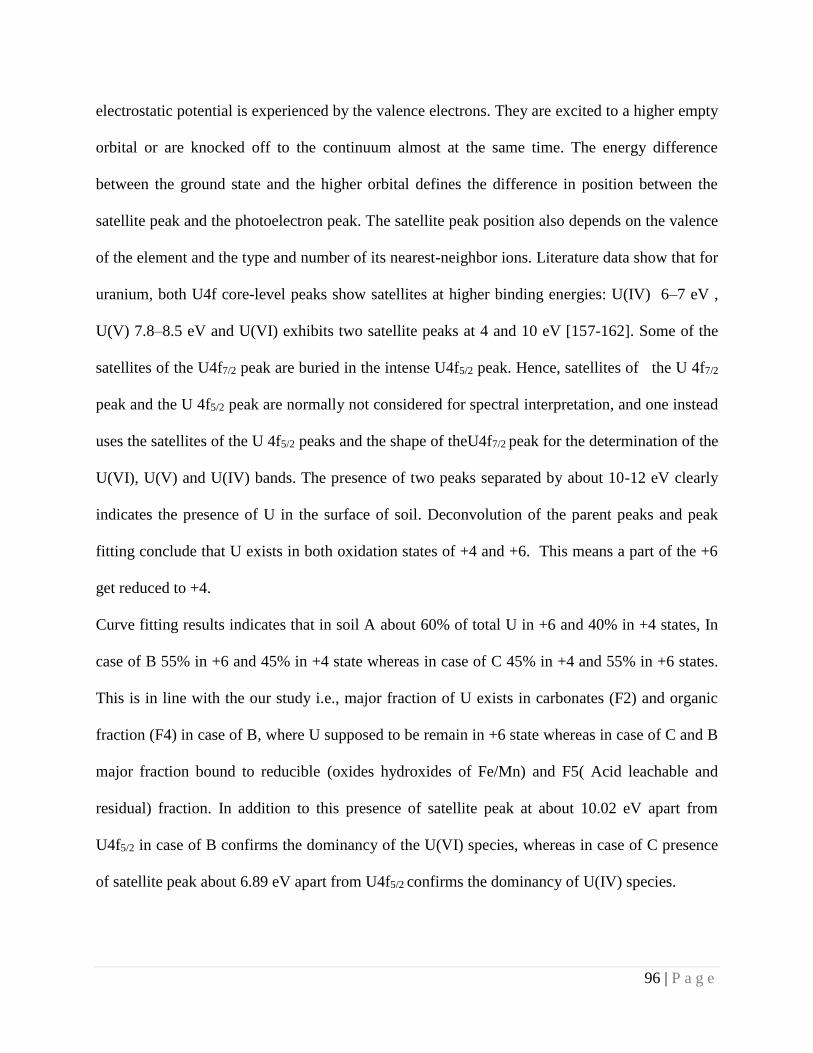
96 | P a g e
electrostatic potential is experienced by the valence electrons. They are excited to a higher empty
orbital or are knocked off to the continuum almost at the same time. The energy difference
between the ground state and the higher orbital defines the difference in position between the
satellite peak and the photoelectron peak. The satellite peak position also depends on the valence
of the element and the type and number of its nearest-neighbor ions. Literature data show that for
uranium, both U4f core-level peaks show satellites at higher binding energies: U(IV) 6–7 eV ,
U(V) 7.8–8.5 eV and U(VI) exhibits two satellite peaks at 4 and 10 eV [157-162]. Some of the
satellites of the U4f7/2 peak are buried in the intense U4f5/2 peak. Hence, satellites of the U 4f7/2
peak and the U 4f5/2 peak are normally not considered for spectral interpretation, and one instead
uses the satellites of the U 4f5/2 peaks and the shape of theU4f7/2 peak for the determination of the
U(VI), U(V) and U(IV) bands. The presence of two peaks separated by about 10-12 eV clearly
indicates the presence of U in the surface of soil. Deconvolution of the parent peaks and peak
fitting conclude that U exists in both oxidation states of +4 and +6. This means a part of the +6
get reduced to +4.
Curve fitting results indicates that in soil A about 60% of total U in +6 and 40% in +4 states, In
case of B 55% in +6 and 45% in +4 state whereas in case of C 45% in +4 and 55% in +6 states.
This is in line with the our study i.e., major fraction of U exists in carbonates (F2) and organic
fraction (F4) in case of B, where U supposed to be remain in +6 state whereas in case of C and B
major fraction bound to reducible (oxides hydroxides of Fe/Mn) and F5( Acid leachable and
residual) fraction. In addition to this presence of satellite peak at about 10.02 eV apart from
U4f5/2 in case of B confirms the dominancy of the U(VI) species, whereas in case of C presence
of satellite peak about 6.89 eV apart from U4f5/2 confirms the dominancy of U(IV) species.
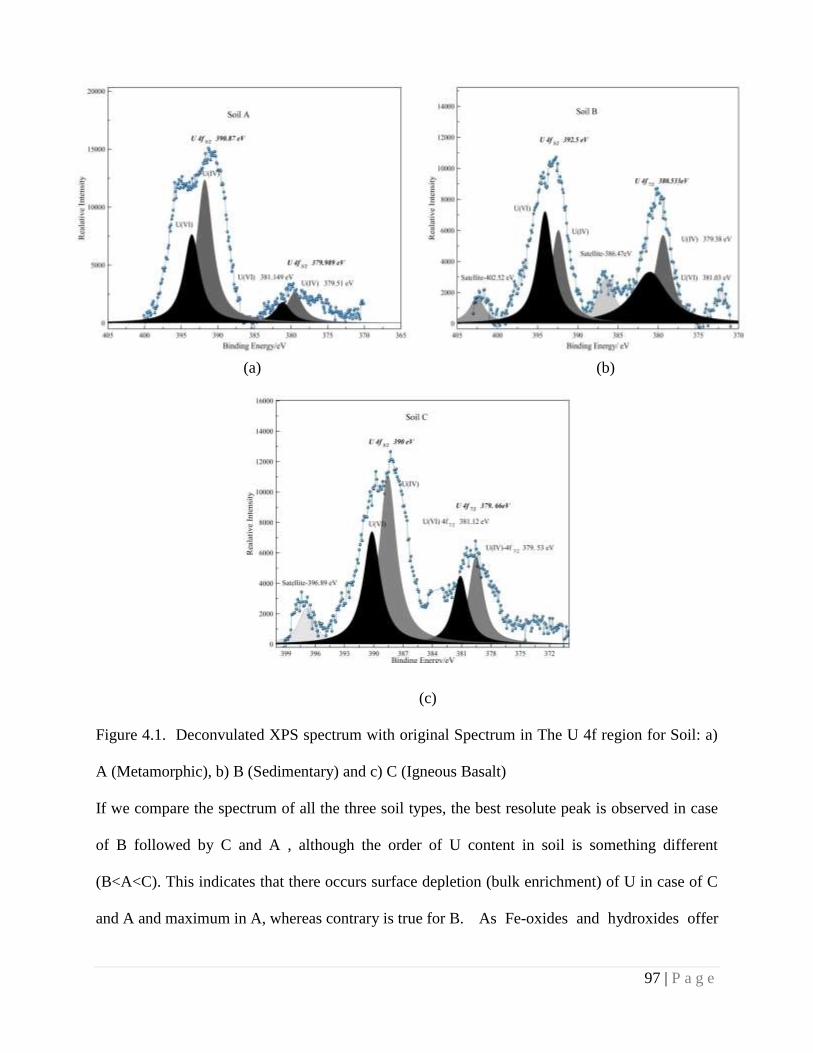
97 | P a g e
(a) (b)
(c)
Figure 4.1. Deconvulated XPS spectrum with original Spectrum in The U 4f region for Soil: a)
A (Metamorphic), b) B (Sedimentary) and c) C (Igneous Basalt)
If we compare the spectrum of all the three soil types, the best resolute peak is observed in case
of B followed by C and A , although the order of U content in soil is something different
(B<A<C). This indicates that there occurs surface depletion (bulk enrichment) of U in case of C
and A and maximum in A, whereas contrary is true for B. As Fe-oxides and hydroxides offer
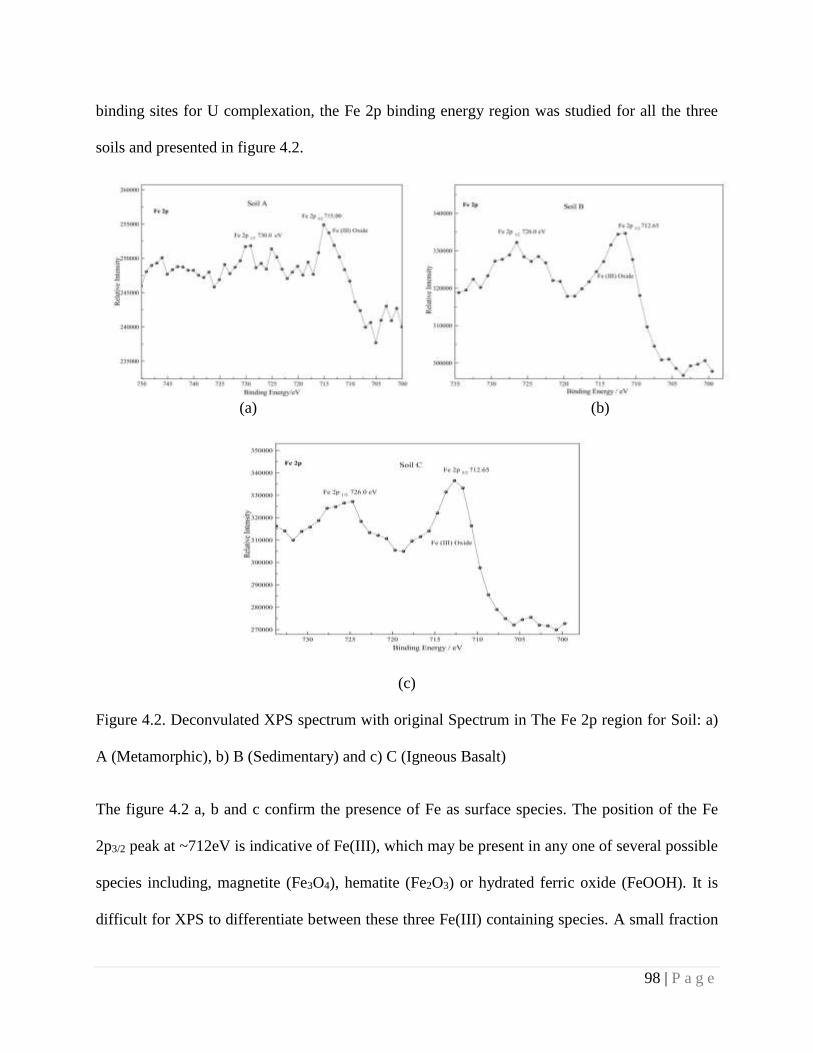
98 | P a g e
binding sites for U complexation, the Fe 2p binding energy region was studied for all the three
soils and presented in figure 4.2.
(a) (b)
(c)
Figure 4.2. Deconvulated XPS spectrum with original Spectrum in The Fe 2p region for Soil: a)
A (Metamorphic), b) B (Sedimentary) and c) C (Igneous Basalt)
The figure 4.2 a, b and c confirm the presence of Fe as surface species. The position of the Fe
2p3/2 peak at ~712eV is indicative of Fe(III), which may be present in any one of several possible
species including, magnetite (Fe3O4), hematite (Fe2O3) or hydrated ferric oxide (FeOOH). It is
difficult for XPS to differentiate between these three Fe(III) containing species. A small fraction
99 | P a g e
of Fe(II) may be present in Fe coupon but was not identified by deconvulation. Very weak Fe 2p
peak in case of soil A indicates depletion of surface Fe. Dominancy of Fe(III) ion on surface
indicates that our assumption of re-oxidative may not be the case, whereas occlusion of U-
Fe(oxides/hydroxide) complex on amorphous silica may be responsible for decrease in the U
level in reducible (F3) fraction.
Study of carbon binding region is also important, as both organic (COO-) and inorganic carbon
(CO32-) form stable complexes with U in carbonate (F2) and oxidizable (F4) fractions of soil.
Unfortunately it is difficult to deconvulate the carbon spectrum for inorganic and organic C in
soil like complex matrix, as both the peak lies in the range of 288-290eV.
Figure 4,3, peak at ~286 eV (-C-O-Al) i.e., binding of OM on aluminum oxides of soil, with the
supporting peaks of aliphatic and aromatic carbon confirms that soil is coated with organic
matter and provides binding sites for sorption of U. Presence of carbonate minerals were
confirmed by the XRD spectrum and presence of U in carbonate fractions confirms the U
association with the soil carbonate. The deconvulation of U4f7/2 peak of C and B does not
produce any peak correspond to U(VI)-SiO2 ( not presented here) whereas it is identified for A at
383.33 eV which is in line with XRD data of A. The spectroscopic as well as wet chemistry
study revealed that the U fractionation between surface and bulk of soil, where surface
concentration is governed by carbonate, organic matter and uncoated or exposed site of oxides of
Si and Al, whereas bulk concentration is mainly controlled by oxides of Al, Si. Enrichment of
Oxides of Fe/ Mn in surface or bulk phase decides the fate of U in reduced fraction, to be in
surface or in bulk soil.
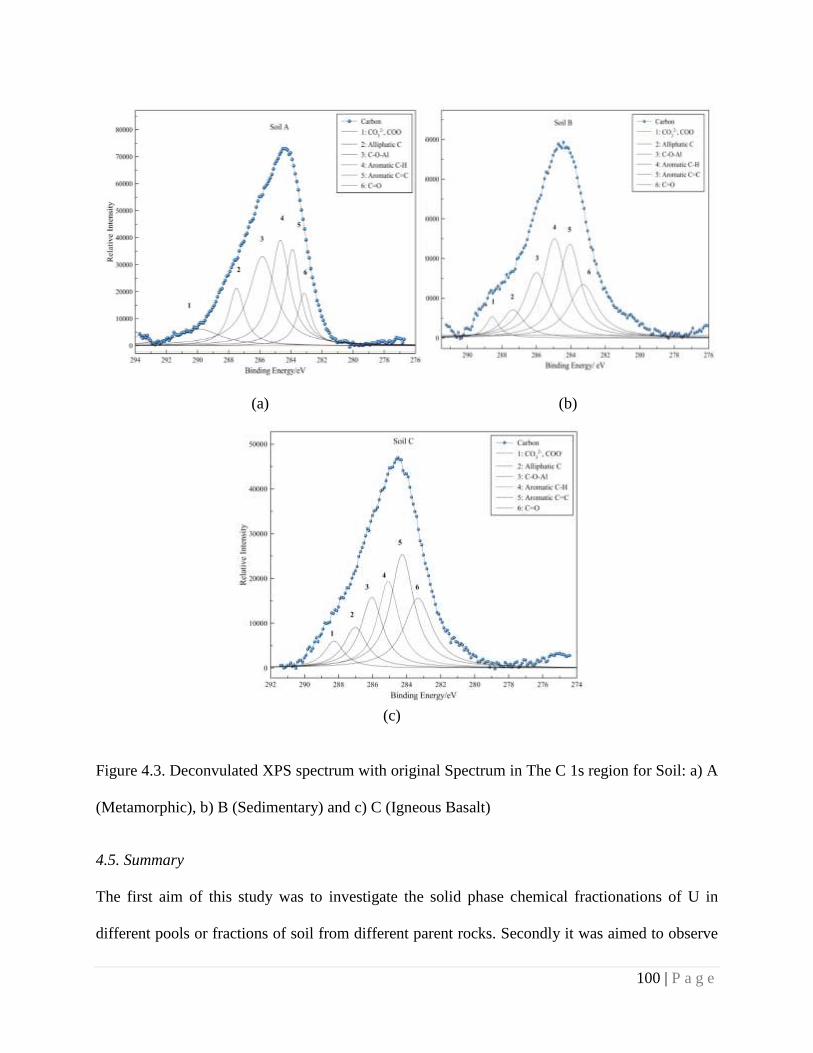
100 | P a g e
(a) (b)
(c)
Figure 4.3. Deconvulated XPS spectrum with original Spectrum in The C 1s region for Soil: a) A
(Metamorphic), b) B (Sedimentary) and c) C (Igneous Basalt)
4.5. Summary
The first aim of this study was to investigate the solid phase chemical fractionations of U in
different pools or fractions of soil from different parent rocks. Secondly it was aimed to observe
101 | P a g e
the effect of ageing on these chemical fractionations and spectroscopic study to predict the
mechanism involved. It can be concluded that although the fate of U in soil initially governed by
concentration of adsorbents (Such as carbonate, oxides of Fe/ Mn, OM etc.in respective fractions)
but with ageing there occurs a significant rearrangement of U in these fractions of soil. This
leads to either increase or decrease in bioavailability of U, which depends on soil properties as
well as environmental conditions. Spectroscopic investigation envisage that a part of total U (VI)
is converted to less mobile U(IV), Concentration of U in soil surface is mainly controlled by soil
carbonate and organic matter content and up to some extend by exposed site of oxides and
hydroxides of Si, Al. Decrease in U in reducible fraction was due to occlusion of U-Fe-Oxides
(Hydroxide) in to amorphous silica rather than the mobilization due to oxidation. Hence U in
reducible (F3) and residual (F5) are responsible for U enrichment in bulk soil and may be
considered as the irreversible sink for U in soil. Although U associated with the oxidizable
fraction of the soil are assumed to remain immobilized for longer periods, they can become
available through decomposition processes.
102 | P a g e
Chapter 5
Effect of Salinity on Migration and speciation of Uranium at
Soil-Water Interface
5.1. Introduction
The ground water level has considerably sunk due to the increased demand for drinking, and
agricultural uses and reduced re-charging consequent to climate changes. This led to increased
salinity of inland ground water system due to low-recharge and intrusion of saline water to
ground water system at coastal areas. This may lead to increased leaching of minerals from rocks
in contact with the ground water. Elevated levels of uranium and heavy metals were observed in
Punjab. This prompted us to study the impact of salinity on the leaching of uranium from soil.
Simulation studies using PHREEQC I revealed that pH, CO32- and Ca2+ ions are critical water
parameters influencing uranium migration at mineral-water interface. Effect of salinity or ionic
strength on migration and speciation of uranium at mineral water interface are also very
important. The increased salinity may induce increased migration from soil to water in contact
due to: (a) competition of cations present in the solution with positively charged U species for
sorption sites on the solid phase and (b) competition of anions present in the solution for
complexation sites with anionic uranium species.
5.2. Present Study
From the above it is evident that fate of uranium and soil is complicated and also sensitive to salt
content. The objectives of present work to investigate effect of salinity on migration and
speciation of uranium at soil-water interface. These results can be used, to quantify the change in
migration behavior of uranium from soil to soil solution due to the increased salinity of soil
103 | P a g e
solution. This has application to assess the environmental impact assessment in natural migration
of uranium from soil to water as well as in migration of uranium from nuclear waste disposal
sites.
5.3. Experimental
5.3.1. Soil sample and its characterization:
Five contaminated soil samples of same geo-referred location were chosen. Physicochemical
characterization was carried out as per standard protocols. Natural organic matter (NOM) content
was estimated by loss of ignition technique by heating the soil at 5500 C (±100 C) for 2h in
muffle furnace. Clay mineralogy study of composite soil sample was carried out using X-ray
diffract meter over the range of 5–500 2θ as per standard protocol discussed in chapter 2. The
textural analysis of undisturbed composite soil was carried out using particle size analyzer (make
CILAS 1109, France, range: 40 nm to 2500 µm) in liquid mode. pH and Eh of soil solutions
(10:1 mL: g) were measured using aqua-meter with aqua probe-1000 (UK) , whereas major ions
(Na+, K+, Ca2+, Mg2+, Cl-, NO3- and SO42- ) were estimated by using Ion-Chromatography (ICS
2100, Dionex RFIC, USA).
Soil samples (0.2g) were subjected to microwave assisted complete digestion using HNO3, HCl
and HF in a ratio of 3:1:1. Total U in digested solution was determined by voltammetry
(Metrohm Auto Lab, Switzerland) using dropping mercury electrode (DME), whereas total Fe
and Mn content were analyzed using AAS (GBC Avanta, France). The method extraction
efficiency and quality of analysis were checked against the certified reference material (IAEA-
312) for U and IAEA soil-7 for Fe and Mn with the recovery of 98%, 102% and 99%
respectively at 95% confidence interval.
104 | P a g e
5.3.2. Extraction of soil U(VI) by bicarbonate solution
To quantify the U(VI) and U(IV ) content in the soil, a bicarbonate extraction was performed.
Bicarbonate extraction of U(VI) was carried out under both aerobic and anaerobic conditions as
described by Zhou and Gu., [163] to see the effect of oxygen on extraction of U(VI). For
anaerobic extraction homogenized soil samples (2g) was handled in the anaerobic chamber (95%
N2/5% H2) and treated with 20 mL of anoxic 1M NaHCO3 in falcon tubes. The samples were
placed in a shaker and vigorously stirred for 7 days in anaerobic conditions. For aerobic
extraction, experiment was carried out in open environment. After 7 days both the tubes were
centrifuged and supernatant were filtered (using 0.45 µm Celulose acetate Millipore filter) and
filtrate was taken for U analysis using voltammetry. Since U(VI) is extracted by bicarbonate
extract (both in aerobic and anaerobic condition) the measured U in filtrate represents total U(VI)
present in soil. The amount of U(IV) present in the soil was estimated by taking difference of
total U (estimated by complete digestion) and U(VI).
5.3.3. Sequential extraction
Dried, homogenized soil samples (2g) were subjected to a sequential extraction method
optimized for the quantification of actinides proposed by Schultz et al (1998) with small
modification [97]. Total U was measured by complete digestion of the same samples as
described above. A solution/sample ratio of 10 (mL/g) was used for extraction in each step. After
extraction, the leachate was separated from the solid residue by centrifugation at 3000 rpm for 20
min. The residue was rinsed with deionized water (18.2 MΩ•cm-1) with a water/sample ratio of
5 (mL/g) under stirring for 10 min., then the washing water was combined with leachate after
centrifugation. The combined solution was filtered through 0.45 μm Millipore filter paper to
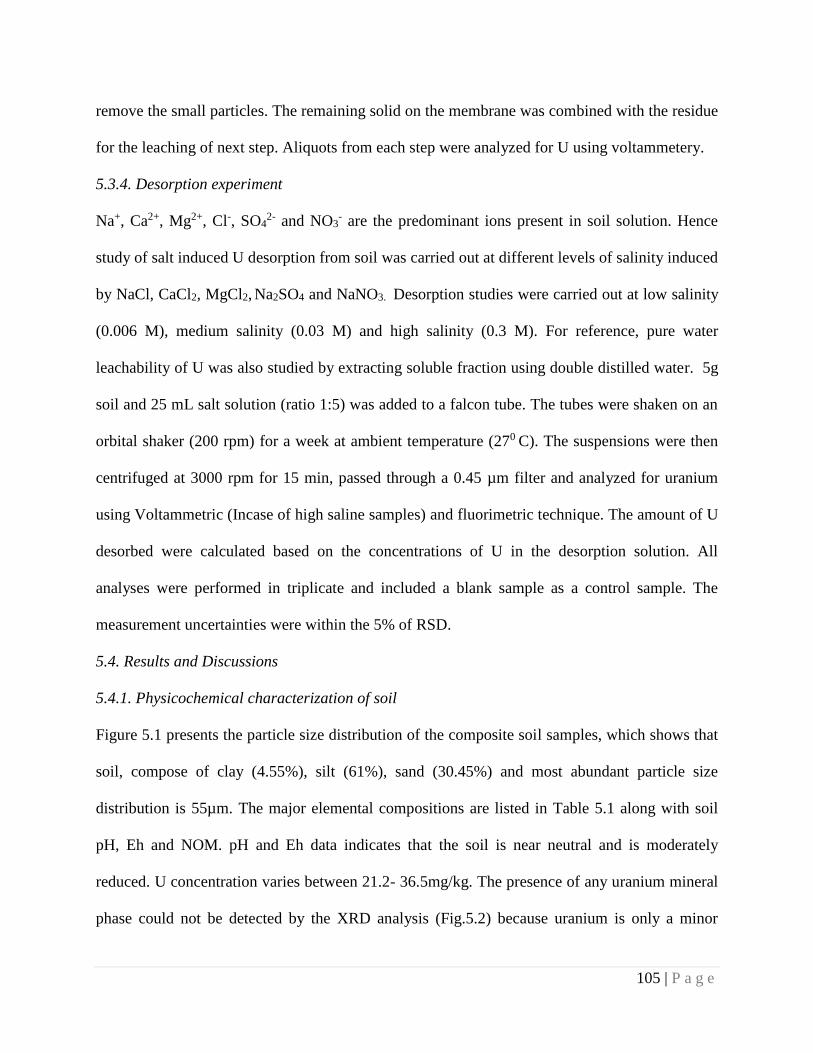
105 | P a g e
remove the small particles. The remaining solid on the membrane was combined with the residue
for the leaching of next step. Aliquots from each step were analyzed for U using voltammetery.
5.3.4. Desorption experiment
Na+, Ca2+, Mg2+, Cl-, SO42- and NO3
- are the predominant ions present in soil solution. Hence
study of salt induced U desorption from soil was carried out at different levels of salinity induced
by NaCl, CaCl2, MgCl2, Na2SO4 and NaNO3. Desorption studies were carried out at low salinity
(0.006 M), medium salinity (0.03 M) and high salinity (0.3 M). For reference, pure water
leachability of U was also studied by extracting soluble fraction using double distilled water. 5g
soil and 25 mL salt solution (ratio 1:5) was added to a falcon tube. The tubes were shaken on an
orbital shaker (200 rpm) for a week at ambient temperature (270 C). The suspensions were then
centrifuged at 3000 rpm for 15 min, passed through a 0.45 µm filter and analyzed for uranium
using Voltammetric (Incase of high saline samples) and fluorimetric technique. The amount of U
desorbed were calculated based on the concentrations of U in the desorption solution. All
analyses were performed in triplicate and included a blank sample as a control sample. The
measurement uncertainties were within the 5% of RSD.
5.4. Results and Discussions
5.4.1. Physicochemical characterization of soil
Figure 5.1 presents the particle size distribution of the composite soil samples, which shows that
soil, compose of clay (4.55%), silt (61%), sand (30.45%) and most abundant particle size
distribution is 55µm. The major elemental compositions are listed in Table 5.1 along with soil
pH, Eh and NOM. pH and Eh data indicates that the soil is near neutral and is moderately
reduced. U concentration varies between 21.2- 36.5mg/kg. The presence of any uranium mineral
phase could not be detected by the XRD analysis (Fig.5.2) because uranium is only a minor
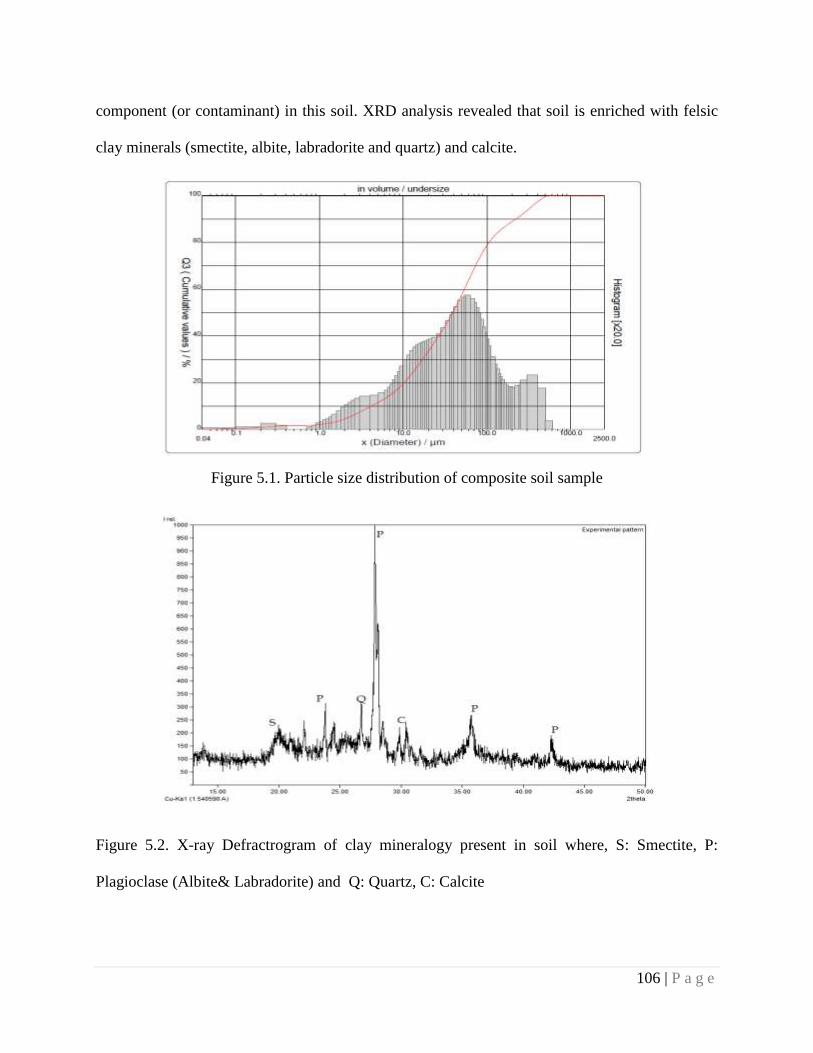
106 | P a g e
component (or contaminant) in this soil. XRD analysis revealed that soil is enriched with felsic
clay minerals (smectite, albite, labradorite and quartz) and calcite.
Figure 5.1. Particle size distribution of composite soil sample
Figure 5.2. X-ray Defractrogram of clay mineralogy present in soil where, S: Smectite, P:
Plagioclase (Albite& Labradorite) and Q: Quartz, C: Calcite
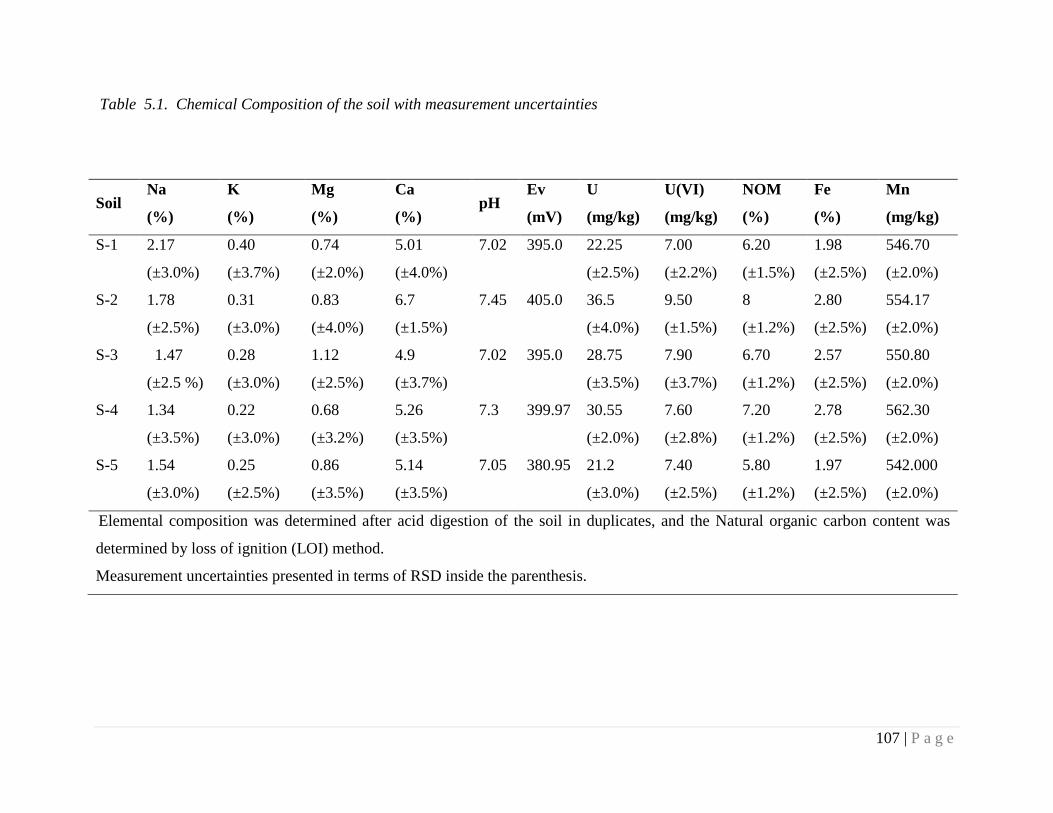
107 | P a g e
Table 5.1. Chemical Composition of the soil with measurement uncertainties
Soil Na
(%)
K
(%)
Mg
(%)
Ca
(%) pH
Ev
(mV)
U
(mg/kg)
U(VI)
(mg/kg)
NOM
(%)
Fe
(%)
Mn
(mg/kg)
S-1 2.17
(±3.0%)
0.40
(±3.7%)
0.74
(±2.0%)
5.01
(±4.0%)
7.02 395.0 22.25
(±2.5%)
7.00
(±2.2%)
6.20
(±1.5%)
1.98
(±2.5%)
546.70
(±2.0%)
S-2 1.78
(±2.5%)
0.31
(±3.0%)
0.83
(±4.0%)
6.7
(±1.5%)
7.45 405.0 36.5
(±4.0%)
9.50
(±1.5%)
8
(±1.2%)
2.80
(±2.5%)
554.17
(±2.0%)
S-3 1.47
(±2.5 %)
0.28
(±3.0%)
1.12
(±2.5%)
4.9
(±3.7%)
7.02 395.0 28.75
(±3.5%)
7.90
(±3.7%)
6.70
(±1.2%)
2.57
(±2.5%)
550.80
(±2.0%)
S-4 1.34
(±3.5%)
0.22
(±3.0%)
0.68
(±3.2%)
5.26
(±3.5%)
7.3 399.97 30.55
(±2.0%)
7.60
(±2.8%)
7.20
(±1.2%)
2.78
(±2.5%)
562.30
(±2.0%)
S-5 1.54
(±3.0%)
0.25
(±2.5%)
0.86
(±3.5%)
5.14
(±3.5%)
7.05 380.95 21.2
(±3.0%)
7.40
(±2.5%)
5.80
(±1.2%)
1.97
(±2.5%)
542.000
(±2.0%)
Elemental composition was determined after acid digestion of the soil in duplicates, and the Natural organic carbon content was
determined by loss of ignition (LOI) method.
Measurement uncertainties presented in terms of RSD inside the parenthesis.
108 | P a g e
Soil carbonate and bicarbonate was estimated in 10:1 soil solution by titrimetric method. The
soil composition data also revealed that there exists a good correlation between total uranium
content with total Fe (r = 0.99) and with NOM (r = 0.94) content. This indicates U may be
preferentially bound to oxides of Fe and NOM. This indicates U may be preferentially bound
to oxides of Fe and NOM.
5.4.2. Uranium extraction and speciation in moderately reduced (+395mV to +400.5mV) soil
The results of analysis of speciation of uranium in soil are presented in the Table 5.2. Result
indicates that about 29% (Range: 25-35%) of the total U exist as U(VI) and remaining exists
in reduced state (U(IV)), whereas under anaerobic condition about 23% of total U extracted
as U(VI). Although there is no significant difference between extraction under oxic and
anoxic conditions the increases in U(VI) extraction under aerobic condition could not be
denied. Leaching of U(VI) by carbonates appears to involve processes like:
a) dissolution of U(VI) bound to soil mineral phases,
b) dissolution of U(VI) bound to NOM at high pH,
c) and oxidation of U(IV) under oxic conditions followed by leaching with
bicarbonate solution.
All these three processes may act concurrently or independently. Since first two processes
are independent of oxic or anoxic conditions, the third process attributed to the slight
increases in U(VI) concentration in aerobic condition in comparison to anaerobic condition.
U bound to different chemical fractions of soil estimated by sequential extraction is
presented in table 5.2.The sequential extraction data revealed that maximum (49.7%) uranium
exists in acid leachable and residual fraction and remaining U exists in the following order:
Bound to oxides/ hydroxides of Fe or Mn (19.58%) > organic phase (10.89%)>
Exchangeable (10.56%)> Carbonate phase (10.13%).
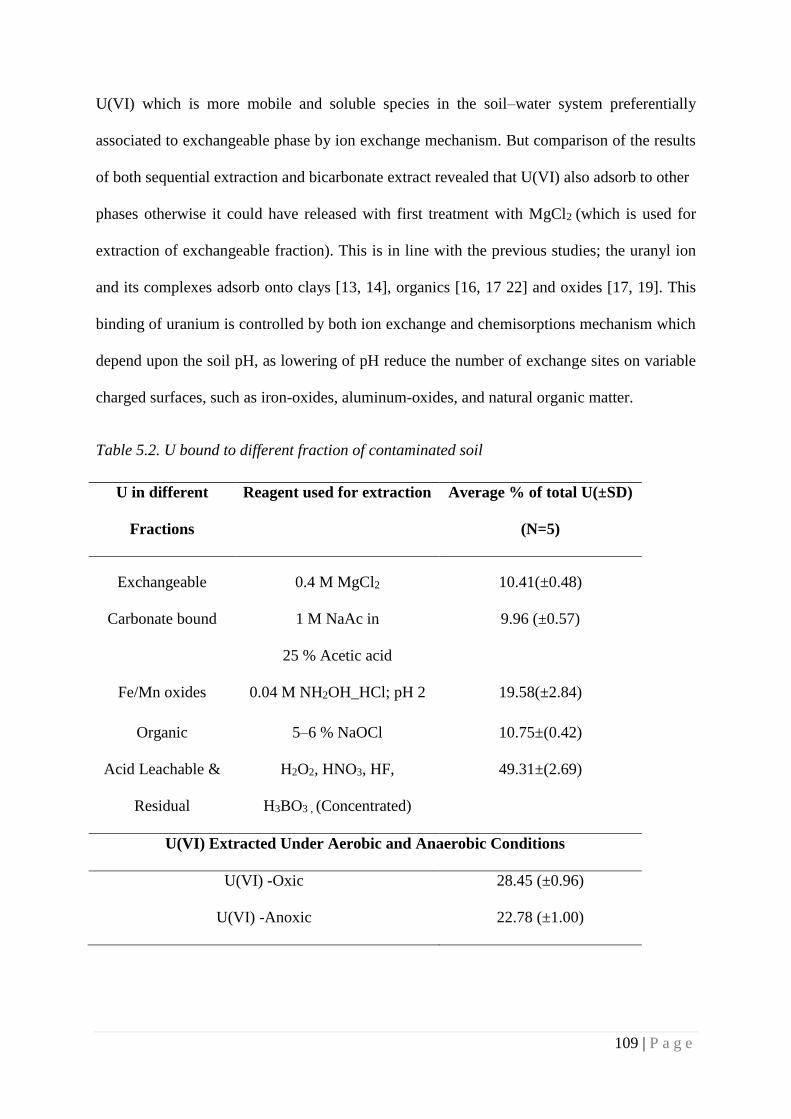
109 | P a g e
U(VI) which is more mobile and soluble species in the soil–water system preferentially
associated to exchangeable phase by ion exchange mechanism. But comparison of the results
of both sequential extraction and bicarbonate extract revealed that U(VI) also adsorb to other
phases otherwise it could have released with first treatment with MgCl2 (which is used for
extraction of exchangeable fraction). This is in line with the previous studies; the uranyl ion
and its complexes adsorb onto clays [13, 14], organics [16, 17 22] and oxides [17, 19]. This
binding of uranium is controlled by both ion exchange and chemisorptions mechanism which
depend upon the soil pH, as lowering of pH reduce the number of exchange sites on variable
charged surfaces, such as iron-oxides, aluminum-oxides, and natural organic matter.
Table 5.2. U bound to different fraction of contaminated soil
U in different
Fractions
Reagent used for extraction
Average % of total U(±SD)
(N=5)
Exchangeable 0.4 M MgCl2 10.41(±0.48)
Carbonate bound 1 M NaAc in
25 % Acetic acid
9.96 (±0.57)
Fe/Mn oxides 0.04 M NH2OH_HCl; pH 2 19.58(±2.84)
Organic 5–6 % NaOCl 10.75±(0.42)
Acid Leachable &
Residual
H2O2, HNO3, HF,
H3BO3 , (Concentrated)
49.31±(2.69)
U(VI) Extracted Under Aerobic and Anaerobic Conditions
U(VI) -Oxic 28.45 (±0.96)
U(VI) -Anoxic 22.78 (±1.00)
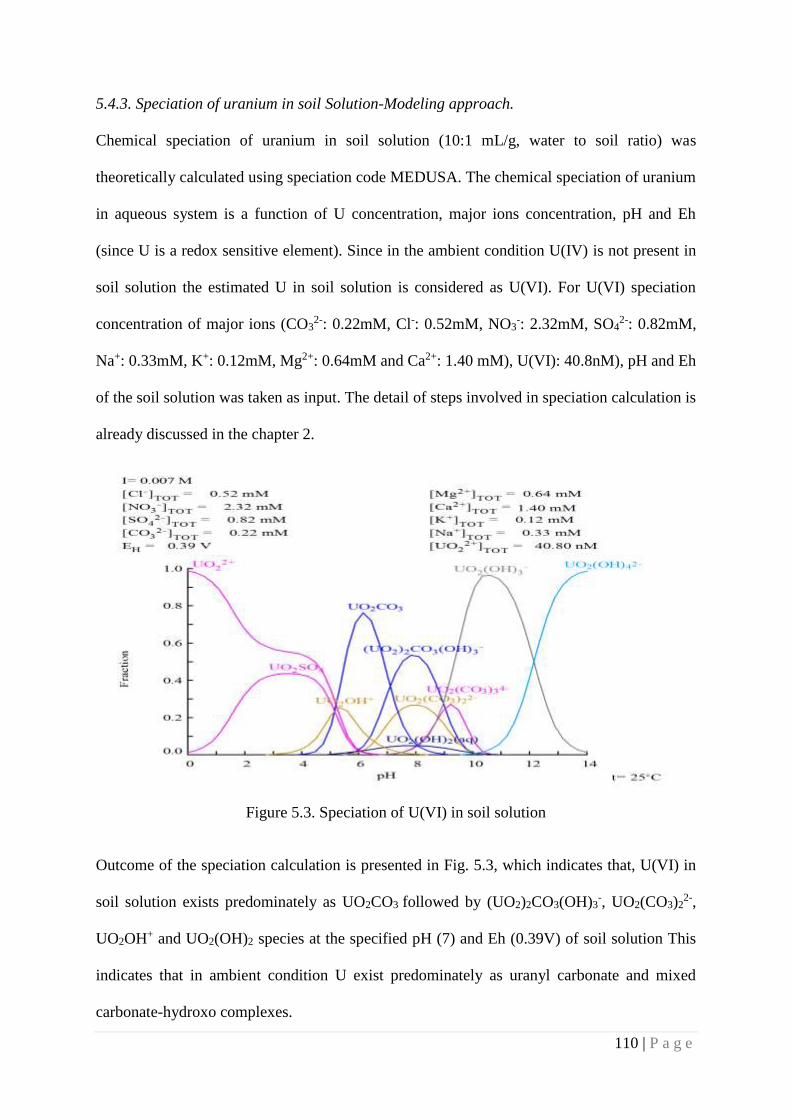
110 | P a g e
5.4.3. Speciation of uranium in soil Solution-Modeling approach.
Chemical speciation of uranium in soil solution (10:1 mL/g, water to soil ratio) was
theoretically calculated using speciation code MEDUSA. The chemical speciation of uranium
in aqueous system is a function of U concentration, major ions concentration, pH and Eh
(since U is a redox sensitive element). Since in the ambient condition U(IV) is not present in
soil solution the estimated U in soil solution is considered as U(VI). For U(VI) speciation
concentration of major ions (CO32-: 0.22mM, Cl-: 0.52mM, NO3
-: 2.32mM, SO42-: 0.82mM,
Na+: 0.33mM, K+: 0.12mM, Mg2+: 0.64mM and Ca2+: 1.40 mM), U(VI): 40.8nM), pH and Eh
of the soil solution was taken as input. The detail of steps involved in speciation calculation is
already discussed in the chapter 2.
Figure 5.3. Speciation of U(VI) in soil solution
Outcome of the speciation calculation is presented in Fig. 5.3, which indicates that, U(VI) in
soil solution exists predominately as UO2CO3 followed by (UO2)2CO3(OH)3-, UO2(CO3)2
2-,
UO2OH+ and UO2(OH)2 species at the specified pH (7) and Eh (0.39V) of soil solution This
indicates that in ambient condition U exist predominately as uranyl carbonate and mixed
carbonate-hydroxo complexes.
111 | P a g e
5.4. 4. Effect of ionic strength on Uranium migration
Fig. 5.4 a, b, c, d & e shows the percentage of uranium brought into soluble form when
extracted with MgCl2, NaNO3, NaCl, CaCl2 and Na2SO4 solutions respectively of different
ionic strengths. It can be see that there occurs a significant release of U from soil with
increasing the ionic strength of the salt solution and a strong linear relationship (r2≈0.9)
exist between amount of U desorbed and ionic strength of salt solution except in the case of
CaCl2 and Na2SO4. The % total U desorbed from soil matrix as a function of salinity is
presented in fig. 5.5. Investigation of the figure revealed that at different level of salinity, U
migration follows the order as shown below.
Low salinity (0.006M); CaCl2 > MgCl2>Na2SO4> NaCl> NaNO3
Medium Salinity (0.03M); CaCl2 > Na2SO4> MgCl2 > NaNO3> NaCl
High salinity (0.3M); NaNO3> CaCl2 > MgCl2> NaCl> Na2SO4
Effect of cations: For the same anion (Cl-), the migration of U from soil phase to aqueous
phase, induced by cations, are in the order of: Ca2+ > Mg2+ > Na+. Same trend was observed
for low salinity (0.006M), medium salinity (0.03M) and at high salinity (0.3M). This can be
attributed to the double charge of Ca2+ and Mg2+ compared with the single charge of Na+.
However, the difference between Ca2+ and Mg2+ induced migration was likely due to
differences in size and atomic mass of these cations; Ca2+ is heavier and larger than Mg2+.
This trend is followed at all the three salinity level for chloride salts. At low and medium
salinity level Na2SO4 induces more U desorption than NaCl and NaNO3,this attributes to high
ionic strength of Na2SO4 in comparison to NaCl and NaNO3, whereas at high salinity level
Na2SO4 induces least desorption of U although the ionic strength is the same as ionic strength
of Ca and Mg salt (0.9 M).
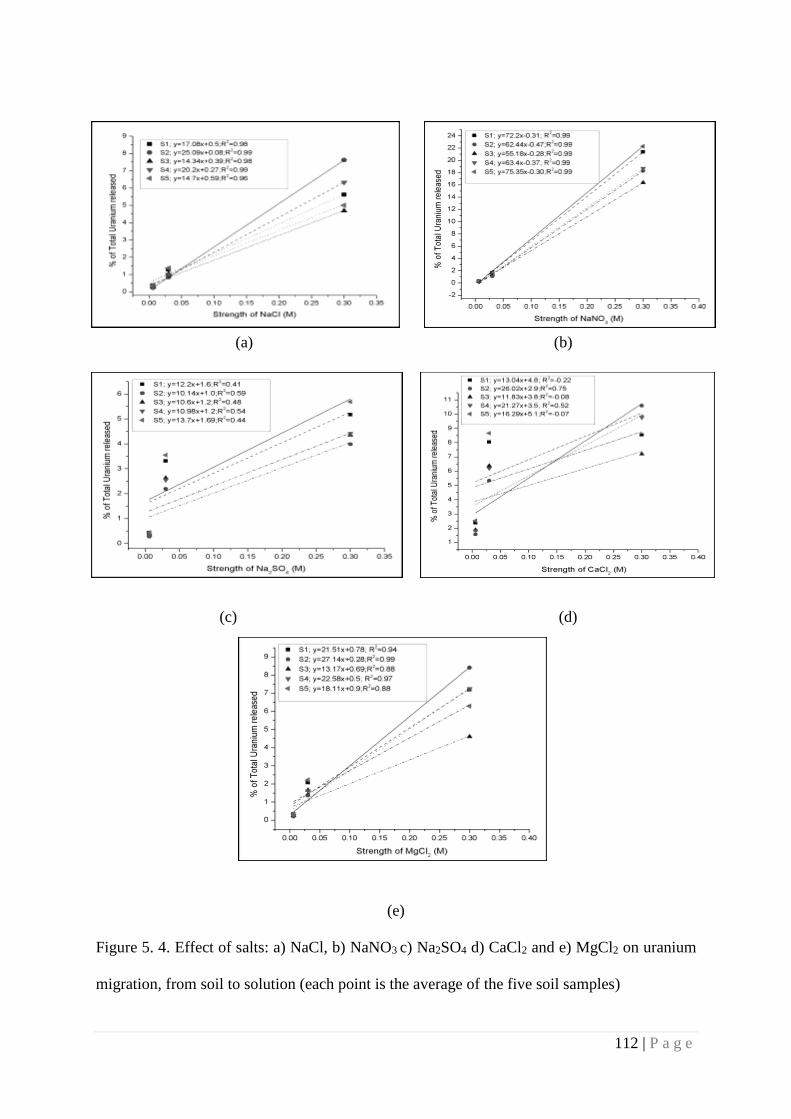
112 | P a g e
(a) (b)
(c) (d)
(e)
Figure 5. 4. Effect of salts: a) NaCl, b) NaNO3 c) Na2SO4 d) CaCl2 and e) MgCl2 on uranium
migration, from soil to solution (each point is the average of the five soil samples)
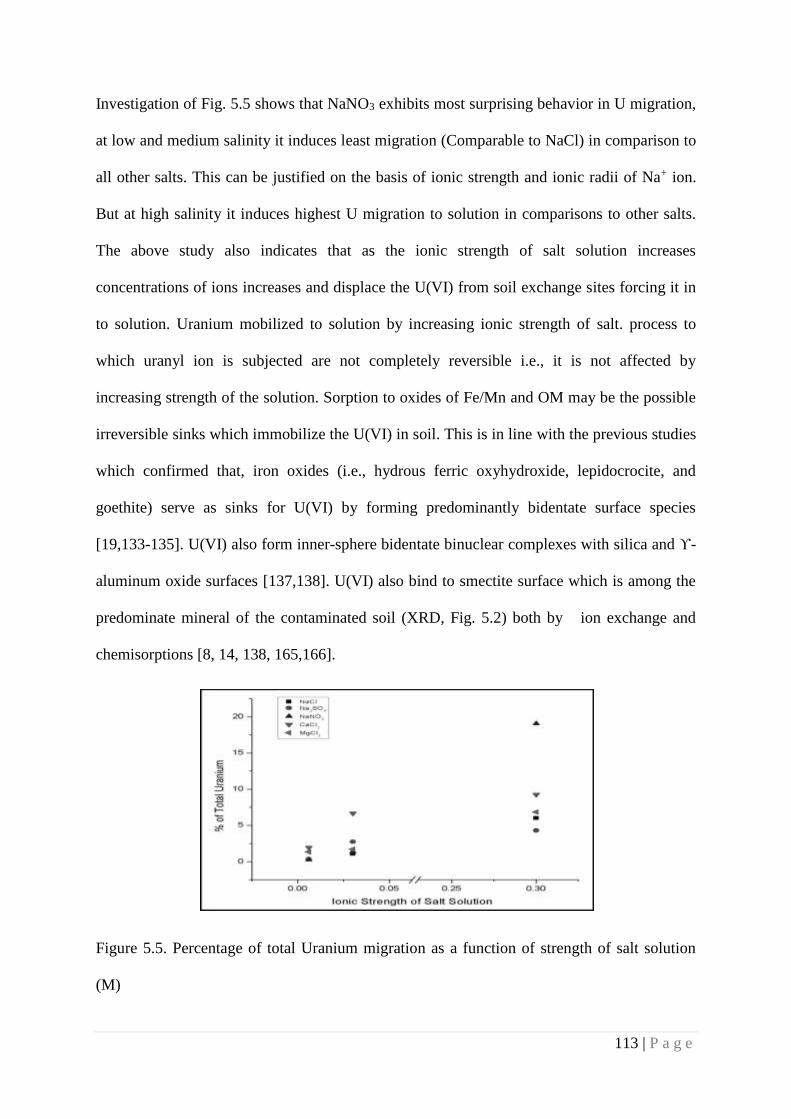
113 | P a g e
Investigation of Fig. 5.5 shows that NaNO3 exhibits most surprising behavior in U migration,
at low and medium salinity it induces least migration (Comparable to NaCl) in comparison to
all other salts. This can be justified on the basis of ionic strength and ionic radii of Na+ ion.
But at high salinity it induces highest U migration to solution in comparisons to other salts.
The above study also indicates that as the ionic strength of salt solution increases
concentrations of ions increases and displace the U(VI) from soil exchange sites forcing it in
to solution. Uranium mobilized to solution by increasing ionic strength of salt. process to
which uranyl ion is subjected are not completely reversible i.e., it is not affected by
increasing strength of the solution. Sorption to oxides of Fe/Mn and OM may be the possible
irreversible sinks which immobilize the U(VI) in soil. This is in line with the previous studies
which confirmed that, iron oxides (i.e., hydrous ferric oxyhydroxide, lepidocrocite, and
goethite) serve as sinks for U(VI) by forming predominantly bidentate surface species
[19,133-135]. U(VI) also form inner-sphere bidentate binuclear complexes with silica and ϒ-
aluminum oxide surfaces [137,138]. U(VI) also bind to smectite surface which is among the
predominate mineral of the contaminated soil (XRD, Fig. 5.2) both by ion exchange and
chemisorptions [8, 14, 138, 165,166].
Figure 5.5. Percentage of total Uranium migration as a function of strength of salt solution
(M)
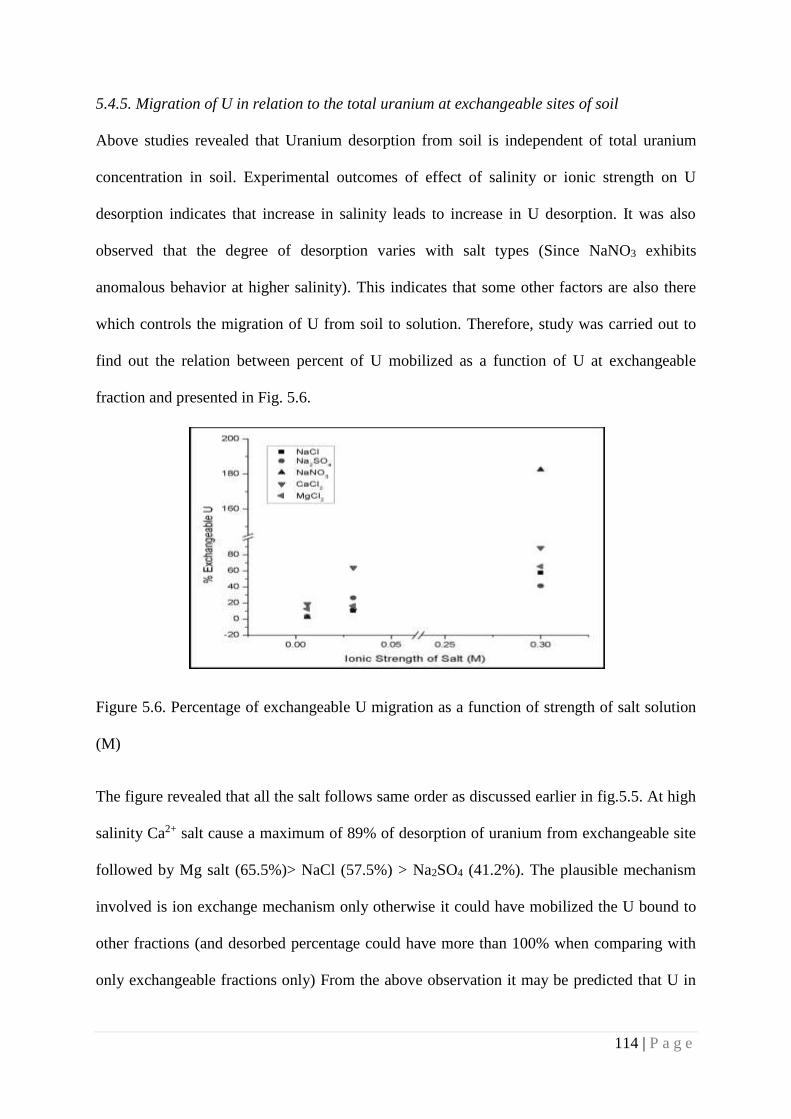
114 | P a g e
5.4.5. Migration of U in relation to the total uranium at exchangeable sites of soil
Above studies revealed that Uranium desorption from soil is independent of total uranium
concentration in soil. Experimental outcomes of effect of salinity or ionic strength on U
desorption indicates that increase in salinity leads to increase in U desorption. It was also
observed that the degree of desorption varies with salt types (Since NaNO3 exhibits
anomalous behavior at higher salinity). This indicates that some other factors are also there
which controls the migration of U from soil to solution. Therefore, study was carried out to
find out the relation between percent of U mobilized as a function of U at exchangeable
fraction and presented in Fig. 5.6.
Figure 5.6. Percentage of exchangeable U migration as a function of strength of salt solution
(M)
The figure revealed that all the salt follows same order as discussed earlier in fig.5.5. At high
salinity Ca2+ salt cause a maximum of 89% of desorption of uranium from exchangeable site
followed by Mg salt (65.5%)> NaCl (57.5%) > Na2SO4 (41.2%). The plausible mechanism
involved is ion exchange mechanism only otherwise it could have mobilized the U bound to
other fractions (and desorbed percentage could have more than 100% when comparing with
only exchangeable fractions only) From the above observation it may be predicted that U in
115 | P a g e
contaminated soil bound to other fractions (Fe/Mn –Oxides, Organic phase etc.) by surface
complexation preferably rather than by ion-exchange mechanism only. The maximum
desorption of uranium by calcium salt is attributed to its high ionic radii followed by
formation of stable aqueous complex like Ca2UO2(CO3)3(aq) at circumneutral to alkaline pH
conditions which accelerate desorption. The nonlinear relation between ionic strength of
CaCl2 and U desorption discussed in previous section arises because of limitation of Ca ion to
desorb the uranium by ion exchange mechanism only. Fig 5.6 presents that at high salinity
NaNO3 induces U migration about 182.5% of exchangeable fraction which is not possible.
This clearly envisages that at high ionic strength, NaNO3 has ability to mobilize the U
associated with other fractions. This may be attributed to its oxidizing properties which leads
to uranium migration occurred concomitant with nitrite formation, suggesting nitrate-
dependent, iron-accelerated oxidation of U(IV) to U(VI) [167, 168]. The migration of
organically bound U(VI) by decomposition of OM induced by nitrate can’t be denied. Hence
the degree of migration of U, upon addition of five salts under study revealed that ion
exchange mechanism is the prime mechanism. However, in the case of NaNO3 mechanism
seems different.
5.5. Summary
The above study revealed that salinity increases U migration from solid to solution phase.
The extent of increase in migration depends upon both speciation of uranium in soil as well
as the type of salt responsible for the increase in salinity. In moderately reduced soil, major
fraction of uranium exists in U(IV) state. It is observed that exchangeable uranium as well as
uranium bound with NOM and Fe/Mn gets leached into solution when treated with 1M
sodium carbonate solution in aerobic condition. This study indicates that, U migration from
soil by salts (CaCl2, MgCl2, Na2SO4 and NaCl) is independent of the total U content of soil
rather it is depends upon % of total U in exchangeable sites. NaNO3 induced uranium

116 | P a g e
migration involves ion exchange as well as oxidative dissolution of U(IV) bound to Fe/Mn-
oxides and NOM. Migration study also indicates that the fraction of U(VI) bound to Fe/Mn-
oxides and NOM by some mechanism other than ion exchange. The study provides an
important message that high level of NO3- in ground water is potential to mobilize the soil
U(VI) by changing the redox potential of environment. The comparatively higher levels of
uranium present in ground water, including those in Punjab, should be viewed in the light of
present studies.
117 | P a g e
Chapter 6
Migration and Speciation of Uranium at Ore-water interface:
Role of Ionic Strength, Humic Acid, pH and Carbonate
6.1. Introduction
The geogenic uranium present in mineralized rock may migrate to water in contact. The
migration rate depends upon the pH and redox condition of the ore water binary system, the
contact time and water quality parameters of water in contact. The observed high
concentration of uranium in ground water from Punjab area can be attributed to the migration
from mineralized rock surfaces. The study of the process of migration of uranium from ore to
ground water will help in locating potential areas of uranium in the country which in turn is
important in regulatory point of view. The study of ore-water system is limited in literature
and almost no data available in Indian conditions. Changes in environmental conditions and
water quality due to various remediation schemes, natural weathering processes and due to
climate change also may enhance uranium migration form mineral to water system in contact.
Uranium minerals in different host rocks behave differently with these changing conditions.
Previous chapter elucidate that increase in the salinity at soil-water interface highly influence
the migration of uranium along with speciation. This may influence migration and speciation
of uranium at ore-water interface also. In addition, change in carbonate concentration, pH and
temperature also influence migration of uranium
6.2. Present Work
The work is focused on the role of ionic strength of the water in uranium migration from ore
mineral to water in contact and speciation in the binary system (ore-water). Experiments were
also carried out in ternary system (Uraninite-Water- Humic Acid) to investigate the impact of
humic acid on migration of uranium at different ionic strength. Laboratory batch experiments
118 | P a g e
were also carried out to investigate migration of uranium at varying pH and carbonate
concentration.
6.3. Materials and Method
6.3.1. Characterization of Ore and binary phase:
Mineralogical study using XRD: For the study, two representative ore samples were collected
from the different mining site differing in host rocks (Ore A: Quartz based, Ore B: Carbonate
based). The samples were air dried, ground, homogenized and sieved through a 2 mm sieve
and immediately sealed in plastic bags for future experiments. Mineralogy study of both the
ores was carried out using GNR (Italy) APD 2000 PRO X-ray diffractometer as per standard
procedure discussed in chapter 2.
Elemental Analysis: Powdered ore samples (0.2 g) were subjected to microwave-assisted
complete digestion using HNO3, HCl and HF in a ratio of 3:1:1 with few drops of H3BO3.
Total U in digested solution was determined by voltammetry (Metrohm VA Stand 663 Auto
Lab, Switzerland) using dropping mercury electrode (DME), whereas total Fe, Pb, Cu content
were analyzed using AAS (GBC Avanta, France). The method extraction efficiency and
quality of analysis were checked against the certified reference material (IAEA-312) for U
and IAEA soi-7 for Fe, Pb, Cu content.
Extraction of U(VI) by bicarbonate solution: In order to study the speciation of uranium
(U(VI)/U(IV) in the ore, a bicarbonate extraction was performed under anoxic conditions as
described by Zhou and Gu., 2005 [157]. Homogenized ore samples (2 g) were treated with 1
M NaHCO3 and shaken for 24 hours in a shaker in a special reactor in which anaerobic
atmosphere is maintained by passing a mixture of gas (95 % N2/5 % H2). Subsequently, the
leachate was separated by centrifugation and filtered using 0.45 µm cellulose acetate filter
paper. The filtrate was analyzed for uranium using voltammetry, which represents total U(VI)
119 | P a g e
concentration. The amount of U(IV) present in the ore was obtained by taking difference
between total U and U(VI).
Chemistry of Binary Phase (Ore-Water): An ore-water binary system was prepared by
mixing ore with synthetic water (IS. 0.0001M) in the ratio of 1: 10 (g/mL). The mixture was
shaken for 24 hours at room temperature followed by separation of leachate by centrifugation.
The pH and Eh of leachate were measured using aqua-meter with aqua probe-1000 (UK). The
major ions (Na+, K+, Ca2+, Mg 2+,, Cl-, NO3- and SO4
2-) were estimated using ion
chromatography (ICP2100, Dionex, RFIC, USA). The carbonate and bicarbonate in the
solution were measured titrimetrically using Metrohm Auto- tritator (Tritrino).
6.3.2. Effect of variation of pH
To study the effect of variation of pH on migration of uranium from ore to water, batch
experiment was carried out in ore-water system (1:10 g/mL). Solutions with pH ranging
from3, 4, 5,6,7,8 and 9 were prepared using ultrapure HCl (1M) and NaOH (0.5 M) with
continuous agitation. The solutions were equilibrated for seven days, pH being monitored
every day to check any change in pH due to buffering action of minerals in host rock. After 7
days, samples were centrifuged, aliquots from the supernatant were taken and U
concentration measured using voltammetry.
6.3.3. Effect of Carbonate
To study the effect of variation of CO32- concentration, batch experiment was carried out for
both the ore types at four different concentrations, 0.05, 0.1, 0.5 and 1M of Na2CO3 at same
ore to water ratio (1: 10g/mL). After seven days of continuous shaking, solutions were
separated by centrifugation followed by filtration using Millipore filter paper. Uranium
concentration in the leachate (Aqueous Phase) was measured using voltammetry.
120 | P a g e
6.3.4. Desorption Experiments using water of different ionic strength
Desorption experiments of uranium from both the ores (A and B- using synthetic water made
of three different salt and at four different ionic strengths (total 24 no of sample in batch)
were carried out. Synthetic water of different ionic strengths (0.001, 0.01, 0.1 and 1.0M) were
prepared in deionized water (18.2 µS/cm, TKA Smart 2 pure, Germany) and salts CaCl2,
NaNO3 and NaCl (99.9% assay, Merck, Mumbai). Prepared synthetic water was kept in
anaerobic chamber (under Nitrogen Atmosphere) for future experiments. 4 g of powdered ore
was added to 40 mL of synthetic water in falcon tubes and the tubes were agitated at 160 rpm
in a rotary shaker (SK-300, JIOTECH, and Korea) at ambient temperature for 7 days. The
leachate was separated from the ore by centrifugation (Eppendorf Centrifuge 5430 R,
Germany) at 4000 rpm for 15 min followed by filtered using Millipore filter paper (0.45µm)
to ensure the solutions were free from particles. The U concentration in the supernatants was
analyzed using voltammetry in DPAdCSV mode. The pH, Eh, concentrations of major ions
of each leachate was also measured concurrently. Each experiments and measurements were
carried out in duplicate.
6.3.5. Desorption Experiment in ternary system (Uraninite-Water- Humic acid)
A stock solution of Humic acid (200mg/L) was prepared by taking required weight of Humic
acid and diluting it in a 100 mL standard flask. Then 3 mL of humic acid (from stock solution)
was spiked to each tube so that the final concentration of humic acid in each tube is 15mg/L
and solid (Ore) to solution (water) ratio 1: 10 (g/mL) maintained. The mixture was agitated at
160 rpm in a rotary shaker (SK-300, JIOTECH, Korea) at ambient temperature for 7 days.
Then the solution was separated from the ore by centrifugation (Eppendorf Centrifuge 5430
R, Germany) at 4000 rpm for 15 min. The supernatants were then filtered using Millipore
filter paper (0.45 µm) to ensure that solutions were free from particles before measuring the
U concentration. Level of uranium in the leachate was analyzed using Voltametry in
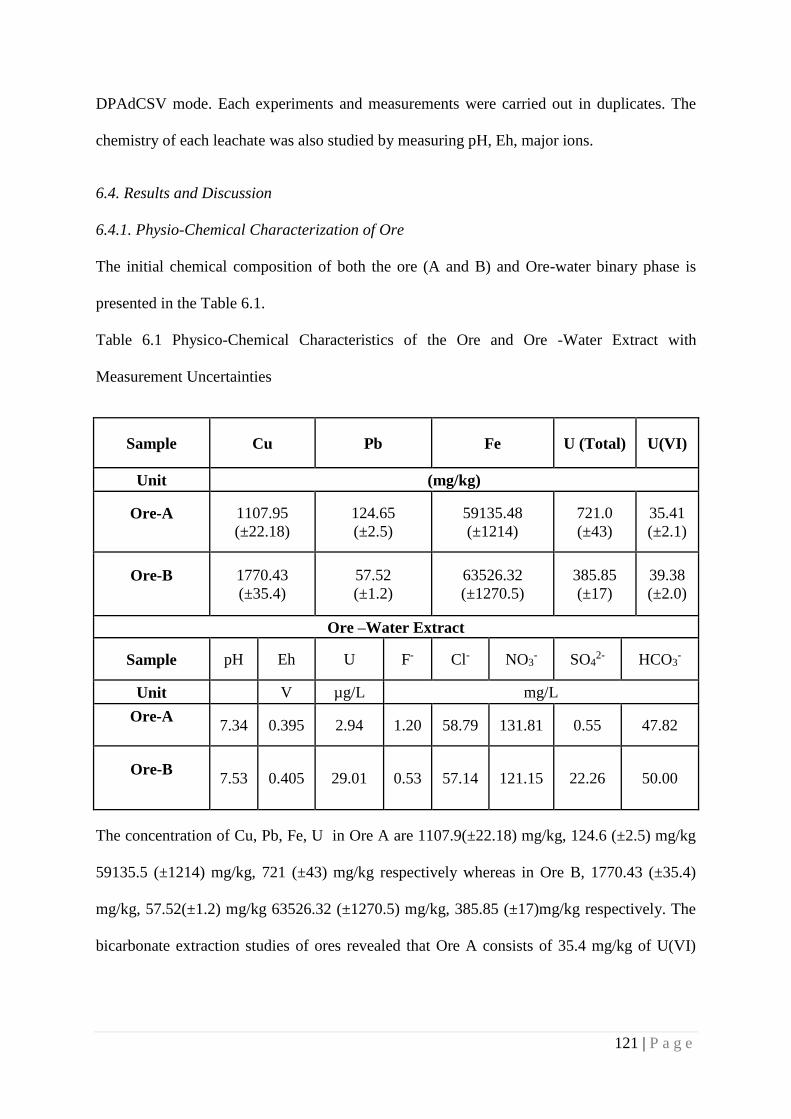
121 | P a g e
DPAdCSV mode. Each experiments and measurements were carried out in duplicates. The
chemistry of each leachate was also studied by measuring pH, Eh, major ions.
6.4. Results and Discussion
6.4.1. Physio-Chemical Characterization of Ore
The initial chemical composition of both the ore (A and B) and Ore-water binary phase is
presented in the Table 6.1.
Table 6.1 Physico-Chemical Characteristics of the Ore and Ore -Water Extract with
Measurement Uncertainties
The concentration of Cu, Pb, Fe, U in Ore A are 1107.9(±22.18) mg/kg, 124.6 (±2.5) mg/kg
59135.5 (±1214) mg/kg, 721 (±43) mg/kg respectively whereas in Ore B, 1770.43 (±35.4)
mg/kg, 57.52(±1.2) mg/kg 63526.32 (±1270.5) mg/kg, 385.85 (±17)mg/kg respectively. The
bicarbonate extraction studies of ores revealed that Ore A consists of 35.4 mg/kg of U(VI)
Sample Cu Pb Fe U (Total) U(VI)
Unit (mg/kg)
Ore-A
1107.95
(±22.18)
124.65
(±2.5)
59135.48
(±1214)
721.0
(±43)
35.41
(±2.1)
Ore-B
1770.43
(±35.4)
57.52
(±1.2)
63526.32
(±1270.5)
385.85
(±17)
39.38
(±2.0)
Ore –Water Extract
Sample pH Eh U F- Cl- NO3- SO4
2- HCO3-
Unit
V µg/L mg/L
Ore-A
7.34 0.395 2.94 1.20 58.79 131.81 0.55 47.82
Ore-B
7.53 0.405 29.01 0.53 57.14 121.15 22.26 50.00
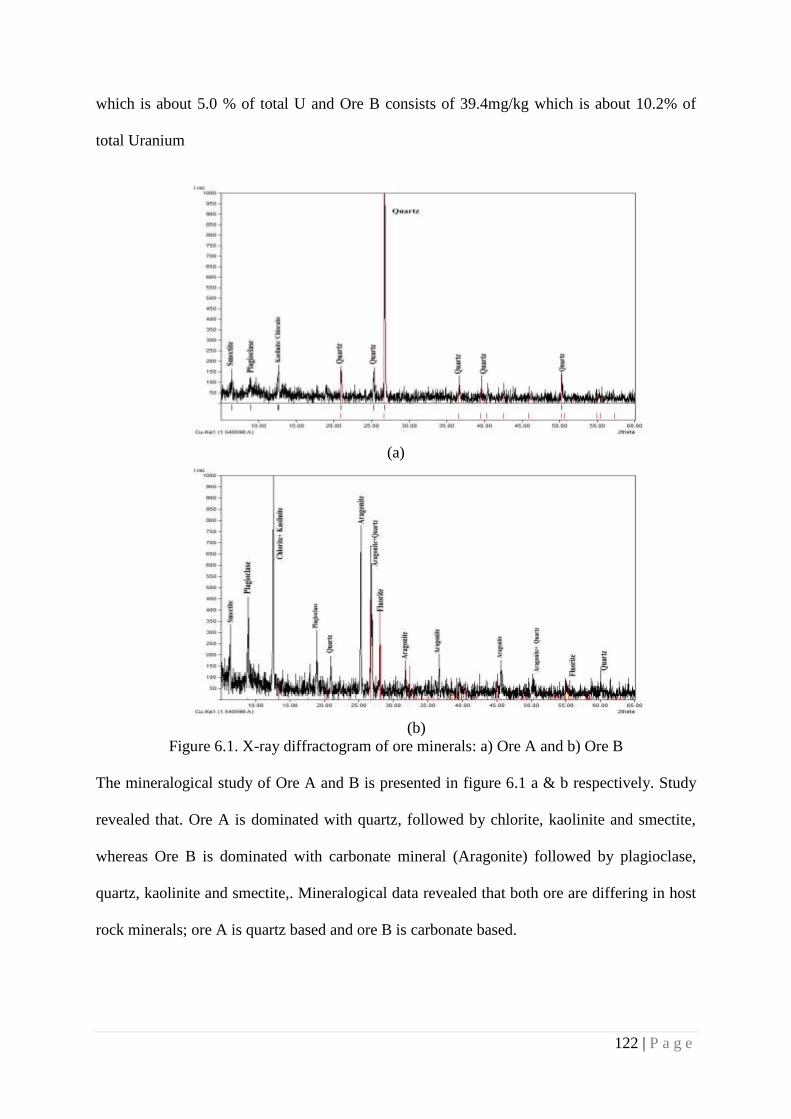
122 | P a g e
which is about 5.0 % of total U and Ore B consists of 39.4mg/kg which is about 10.2% of
total Uranium
(a)
(b)
Figure 6.1. X-ray diffractogram of ore minerals: a) Ore A and b) Ore B
The mineralogical study of Ore A and B is presented in figure 6.1 a & b respectively. Study
revealed that. Ore A is dominated with quartz, followed by chlorite, kaolinite and smectite,
whereas Ore B is dominated with carbonate mineral (Aragonite) followed by plagioclase,
quartz, kaolinite and smectite,. Mineralogical data revealed that both ore are differing in host
rock minerals; ore A is quartz based and ore B is carbonate based.
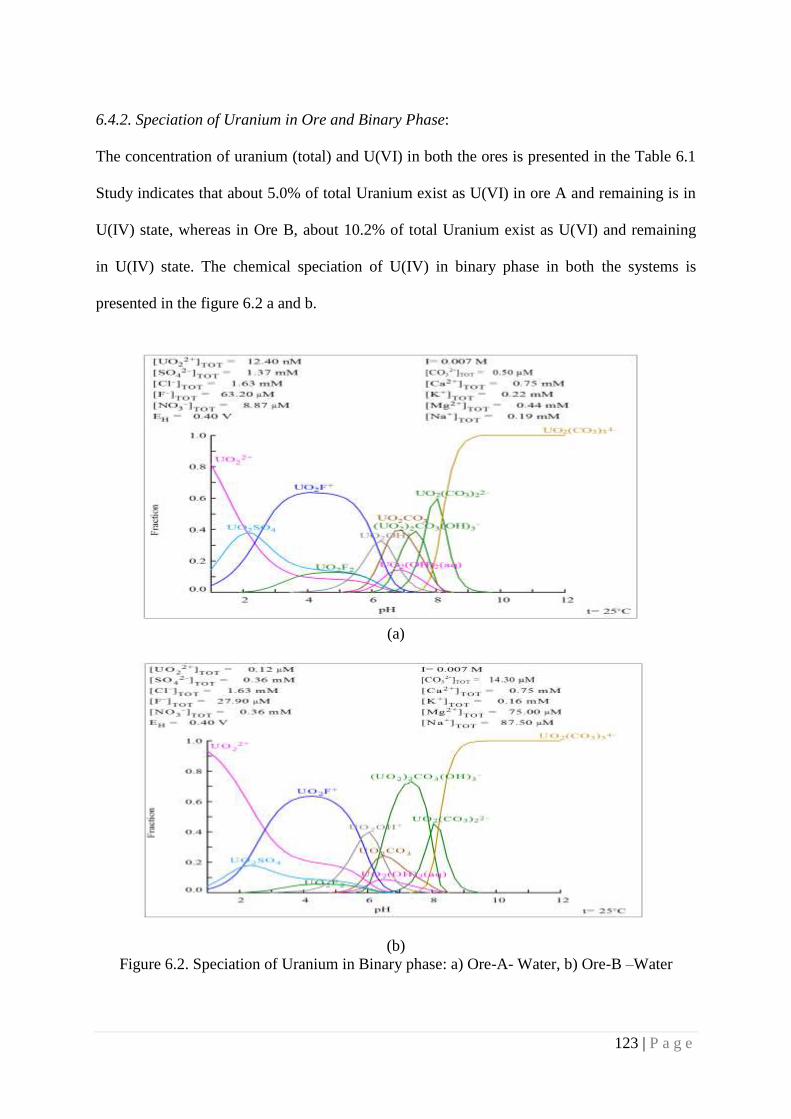
123 | P a g e
6.4.2. Speciation of Uranium in Ore and Binary Phase:
The concentration of uranium (total) and U(VI) in both the ores is presented in the Table 6.1
Study indicates that about 5.0% of total Uranium exist as U(VI) in ore A and remaining is in
U(IV) state, whereas in Ore B, about 10.2% of total Uranium exist as U(VI) and remaining
in U(IV) state. The chemical speciation of U(IV) in binary phase in both the systems is
presented in the figure 6.2 a and b.
(a)
(b)
Figure 6.2. Speciation of Uranium in Binary phase: a) Ore-A- Water, b) Ore-B –Water
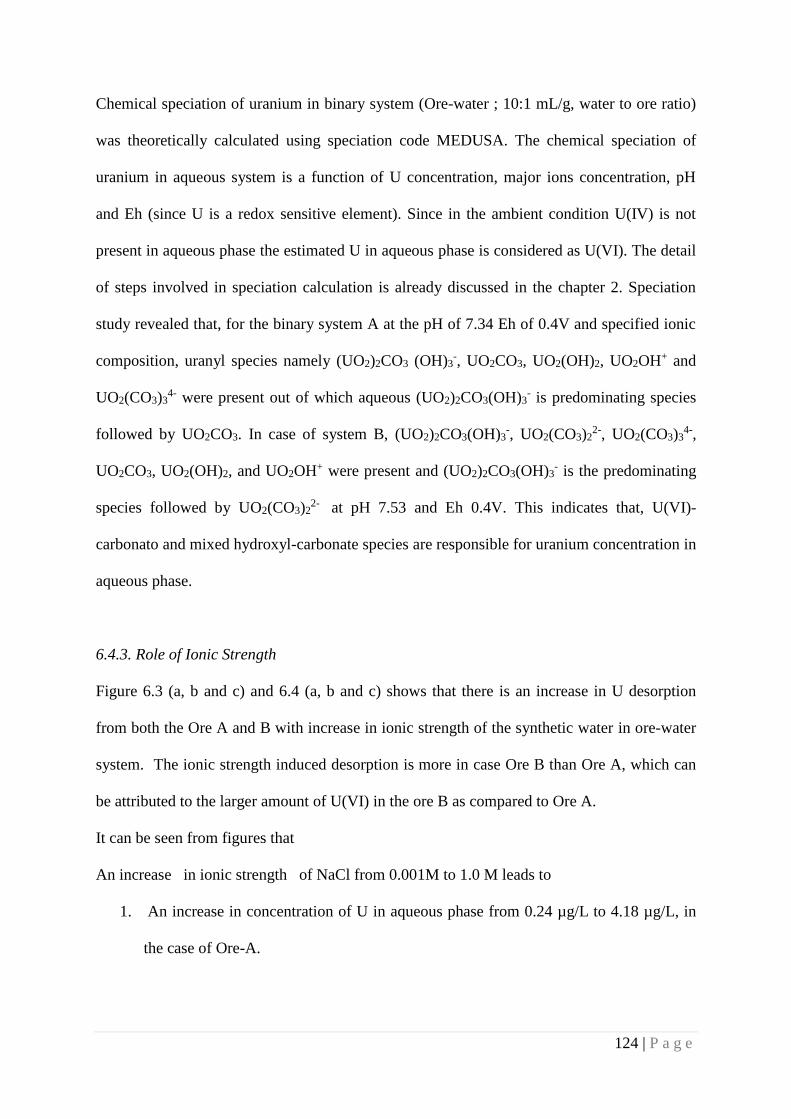
124 | P a g e
Chemical speciation of uranium in binary system (Ore-water ; 10:1 mL/g, water to ore ratio)
was theoretically calculated using speciation code MEDUSA. The chemical speciation of
uranium in aqueous system is a function of U concentration, major ions concentration, pH
and Eh (since U is a redox sensitive element). Since in the ambient condition U(IV) is not
present in aqueous phase the estimated U in aqueous phase is considered as U(VI). The detail
of steps involved in speciation calculation is already discussed in the chapter 2. Speciation
study revealed that, for the binary system A at the pH of 7.34 Eh of 0.4V and specified ionic
composition, uranyl species namely (UO2)2CO3 (OH)3-, UO2CO3, UO2(OH)2, UO2OH+ and
UO2(CO3)34- were present out of which aqueous (UO2)2CO3(OH)3
- is predominating species
followed by UO2CO3. In case of system B, (UO2)2CO3(OH)3-, UO2(CO3)2
2-, UO2(CO3)34-,
UO2CO3, UO2(OH)2, and UO2OH+ were present and (UO2)2CO3(OH)3- is the predominating
species followed by UO2(CO3)22-
at pH 7.53 and Eh 0.4V. This indicates that, U(VI)-
carbonato and mixed hydroxyl-carbonate species are responsible for uranium concentration in
aqueous phase.
6.4.3. Role of Ionic Strength
Figure 6.3 (a, b and c) and 6.4 (a, b and c) shows that there is an increase in U desorption
from both the Ore A and B with increase in ionic strength of the synthetic water in ore-water
system. The ionic strength induced desorption is more in case Ore B than Ore A, which can
be attributed to the larger amount of U(VI) in the ore B as compared to Ore A.
It can be seen from figures that
An increase in ionic strength of NaCl from 0.001M to 1.0 M leads to
1. An increase in concentration of U in aqueous phase from 0.24 µg/L to 4.18 µg/L, in
the case of Ore-A.
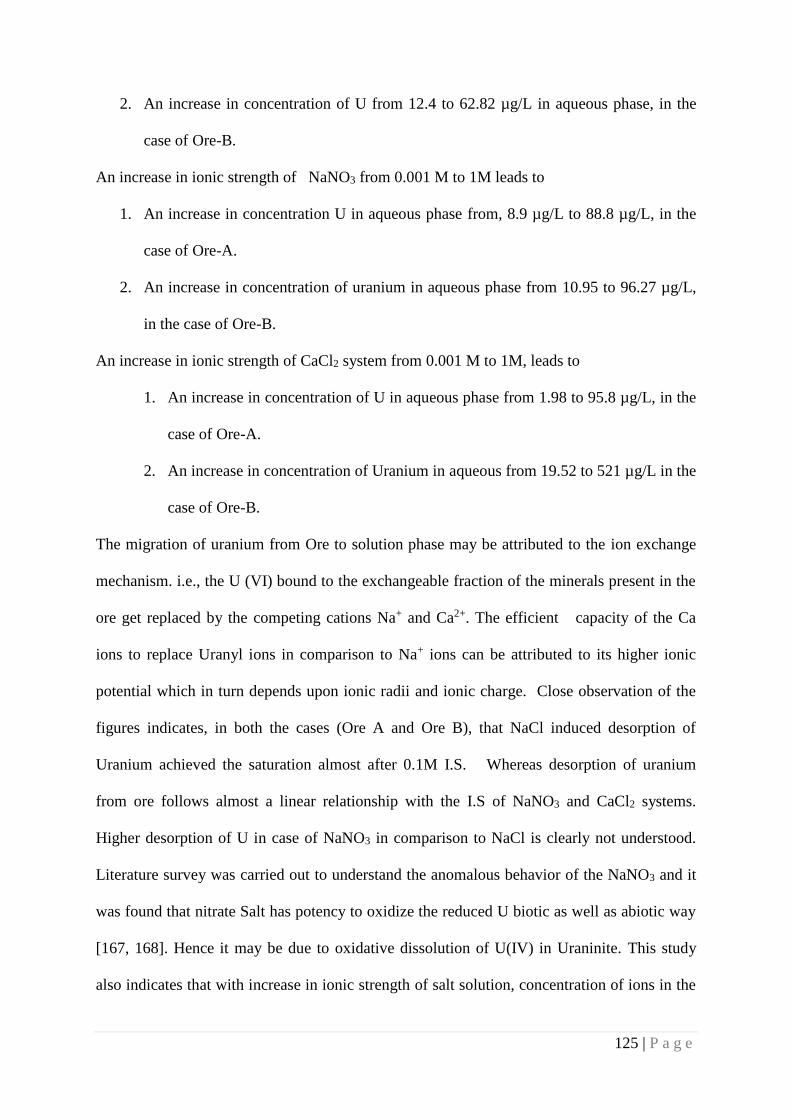
125 | P a g e
2. An increase in concentration of U from 12.4 to 62.82 µg/L in aqueous phase, in the
case of Ore-B.
An increase in ionic strength of NaNO3 from 0.001 M to 1M leads to
1. An increase in concentration U in aqueous phase from, 8.9 µg/L to 88.8 µg/L, in the
case of Ore-A.
2. An increase in concentration of uranium in aqueous phase from 10.95 to 96.27 µg/L,
in the case of Ore-B.
An increase in ionic strength of CaCl2 system from 0.001 M to 1M, leads to
1. An increase in concentration of U in aqueous phase from 1.98 to 95.8 µg/L, in the
case of Ore-A.
2. An increase in concentration of Uranium in aqueous from 19.52 to 521 µg/L in the
case of Ore-B.
The migration of uranium from Ore to solution phase may be attributed to the ion exchange
mechanism. i.e., the U (VI) bound to the exchangeable fraction of the minerals present in the
ore get replaced by the competing cations Na+ and Ca2+. The efficient capacity of the Ca
ions to replace Uranyl ions in comparison to Na+ ions can be attributed to its higher ionic
potential which in turn depends upon ionic radii and ionic charge. Close observation of the
figures indicates, in both the cases (Ore A and Ore B), that NaCl induced desorption of
Uranium achieved the saturation almost after 0.1M I.S. Whereas desorption of uranium
from ore follows almost a linear relationship with the I.S of NaNO3 and CaCl2 systems.
Higher desorption of U in case of NaNO3 in comparison to NaCl is clearly not understood.
Literature survey was carried out to understand the anomalous behavior of the NaNO3 and it
was found that nitrate Salt has potency to oxidize the reduced U biotic as well as abiotic way
[167, 168]. Hence it may be due to oxidative dissolution of U(IV) in Uraninite. This study
also indicates that with increase in ionic strength of salt solution, concentration of ions in the
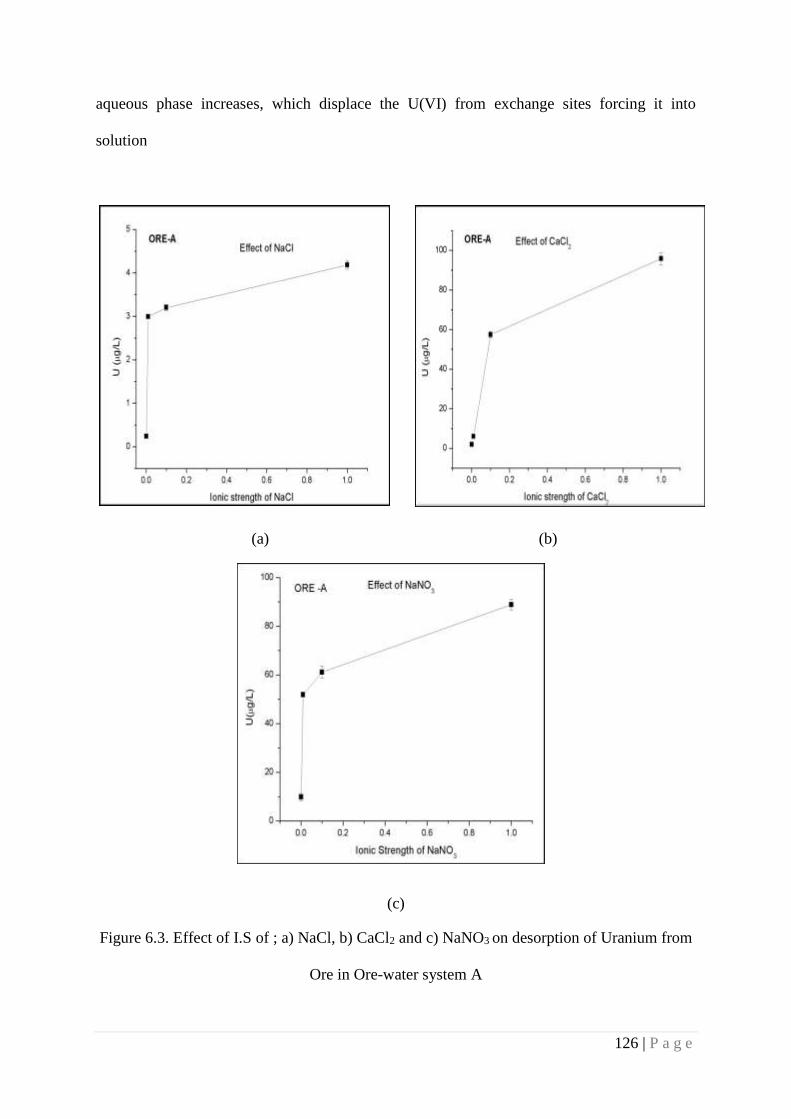
126 | P a g e
aqueous phase increases, which displace the U(VI) from exchange sites forcing it into
solution
(a) (b)
(c)
Figure 6.3. Effect of I.S of ; a) NaCl, b) CaCl2 and c) NaNO3 on desorption of Uranium from
Ore in Ore-water system A
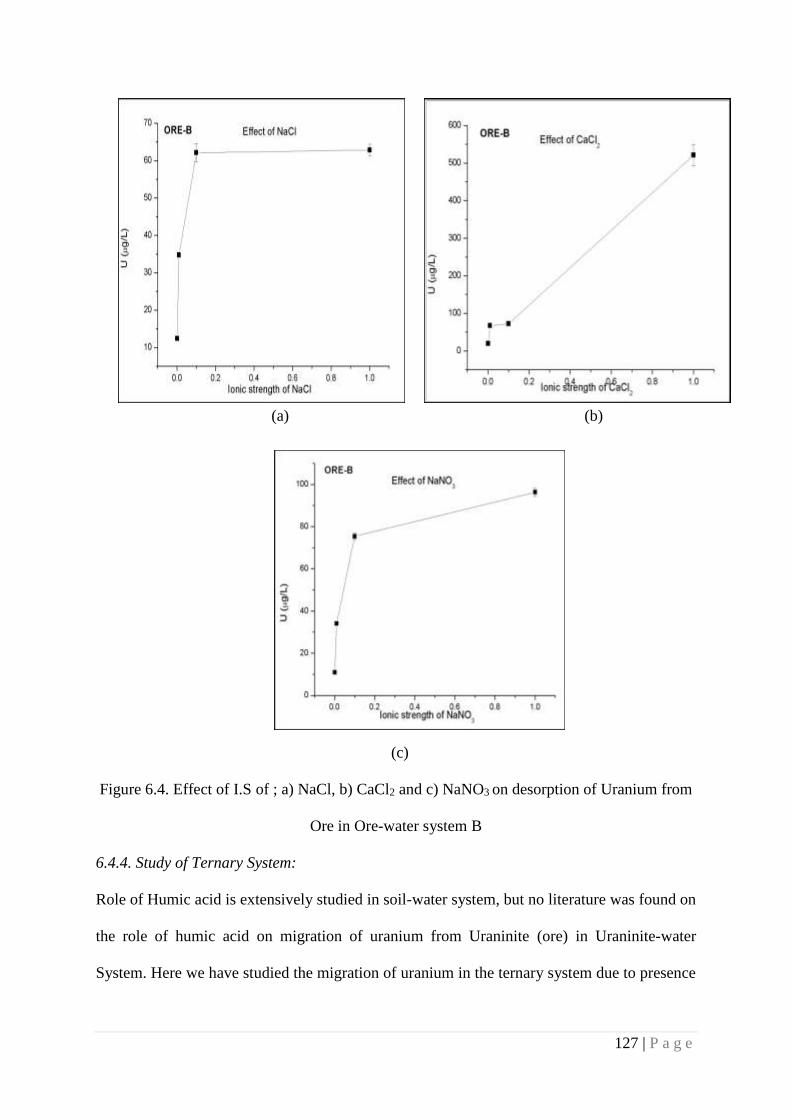
127 | P a g e
(a) (b)
(c)
Figure 6.4. Effect of I.S of ; a) NaCl, b) CaCl2 and c) NaNO3 on desorption of Uranium from
Ore in Ore-water system B
6.4.4. Study of Ternary System:
Role of Humic acid is extensively studied in soil-water system, but no literature was found on
the role of humic acid on migration of uranium from Uraninite (ore) in Uraninite-water
System. Here we have studied the migration of uranium in the ternary system due to presence
128 | P a g e
and absence of humic acid (Presented in figure 6.5. a, b and c; Ore A and Figure 6.6. a, b and
c: Ore B)
(a)
(b) (c)
Figure 6.5. Variation of U concentration in aqueous phase due to variation of I.S of: a) NaCl,
b) CaCl2 and c) NaNO3 in presence (+HA) and absence (-HA) of humic acid in Ore(A)-water
system
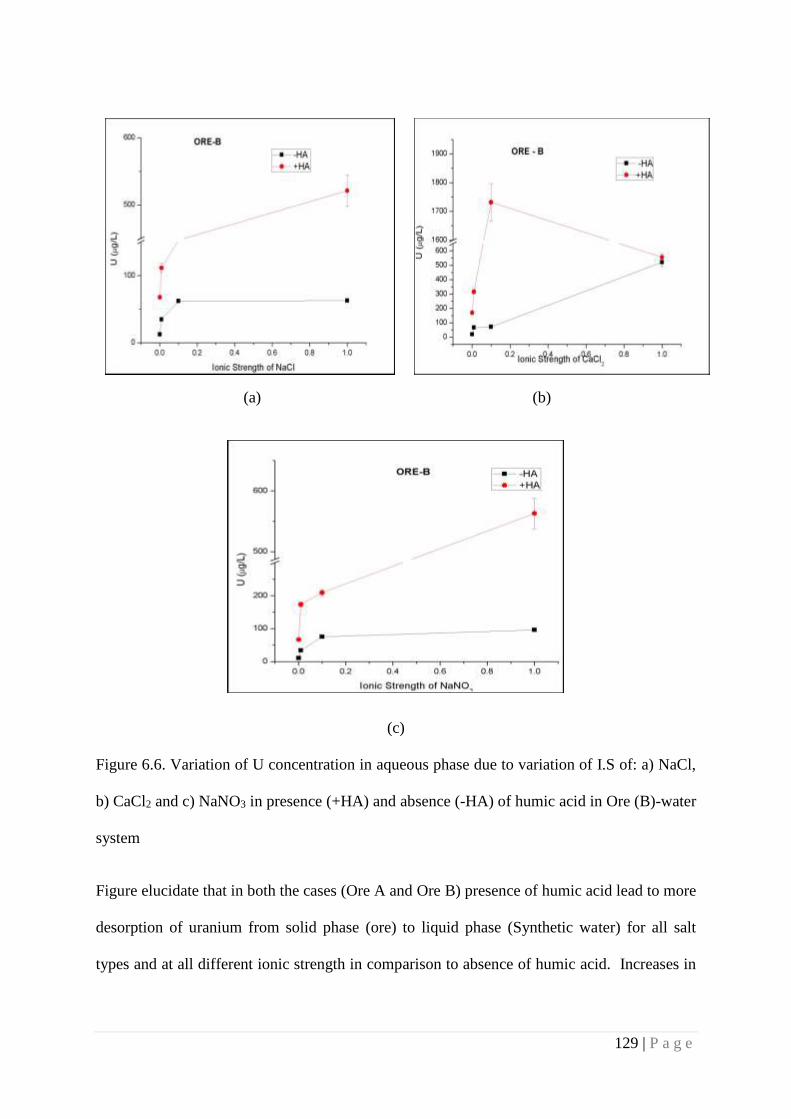
129 | P a g e
(a) (b)
(c)
Figure 6.6. Variation of U concentration in aqueous phase due to variation of I.S of: a) NaCl,
b) CaCl2 and c) NaNO3 in presence (+HA) and absence (-HA) of humic acid in Ore (B)-water
system
Figure elucidate that in both the cases (Ore A and Ore B) presence of humic acid lead to more
desorption of uranium from solid phase (ore) to liquid phase (Synthetic water) for all salt
types and at all different ionic strength in comparison to absence of humic acid. Increases in
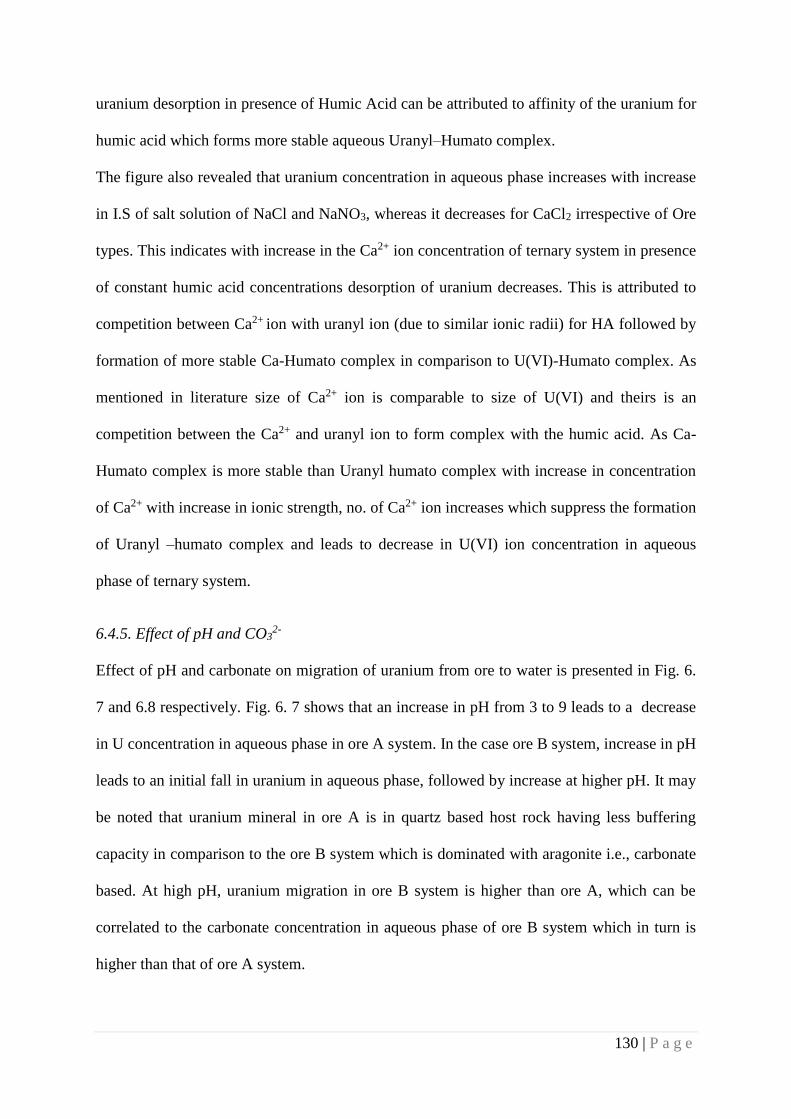
130 | P a g e
uranium desorption in presence of Humic Acid can be attributed to affinity of the uranium for
humic acid which forms more stable aqueous Uranyl–Humato complex.
The figure also revealed that uranium concentration in aqueous phase increases with increase
in I.S of salt solution of NaCl and NaNO3, whereas it decreases for CaCl2 irrespective of Ore
types. This indicates with increase in the Ca2+ ion concentration of ternary system in presence
of constant humic acid concentrations desorption of uranium decreases. This is attributed to
competition between Ca2+ ion with uranyl ion (due to similar ionic radii) for HA followed by
formation of more stable Ca-Humato complex in comparison to U(VI)-Humato complex. As
mentioned in literature size of Ca2+ ion is comparable to size of U(VI) and theirs is an
competition between the Ca2+ and uranyl ion to form complex with the humic acid. As Ca-
Humato complex is more stable than Uranyl humato complex with increase in concentration
of Ca2+ with increase in ionic strength, no. of Ca2+ ion increases which suppress the formation
of Uranyl –humato complex and leads to decrease in U(VI) ion concentration in aqueous
phase of ternary system.
6.4.5. Effect of pH and CO32-
Effect of pH and carbonate on migration of uranium from ore to water is presented in Fig. 6.
7 and 6.8 respectively. Fig. 6. 7 shows that an increase in pH from 3 to 9 leads to a decrease
in U concentration in aqueous phase in ore A system. In the case ore B system, increase in pH
leads to an initial fall in uranium in aqueous phase, followed by increase at higher pH. It may
be noted that uranium mineral in ore A is in quartz based host rock having less buffering
capacity in comparison to the ore B system which is dominated with aragonite i.e., carbonate
based. At high pH, uranium migration in ore B system is higher than ore A, which can be
correlated to the carbonate concentration in aqueous phase of ore B system which in turn is
higher than that of ore A system.
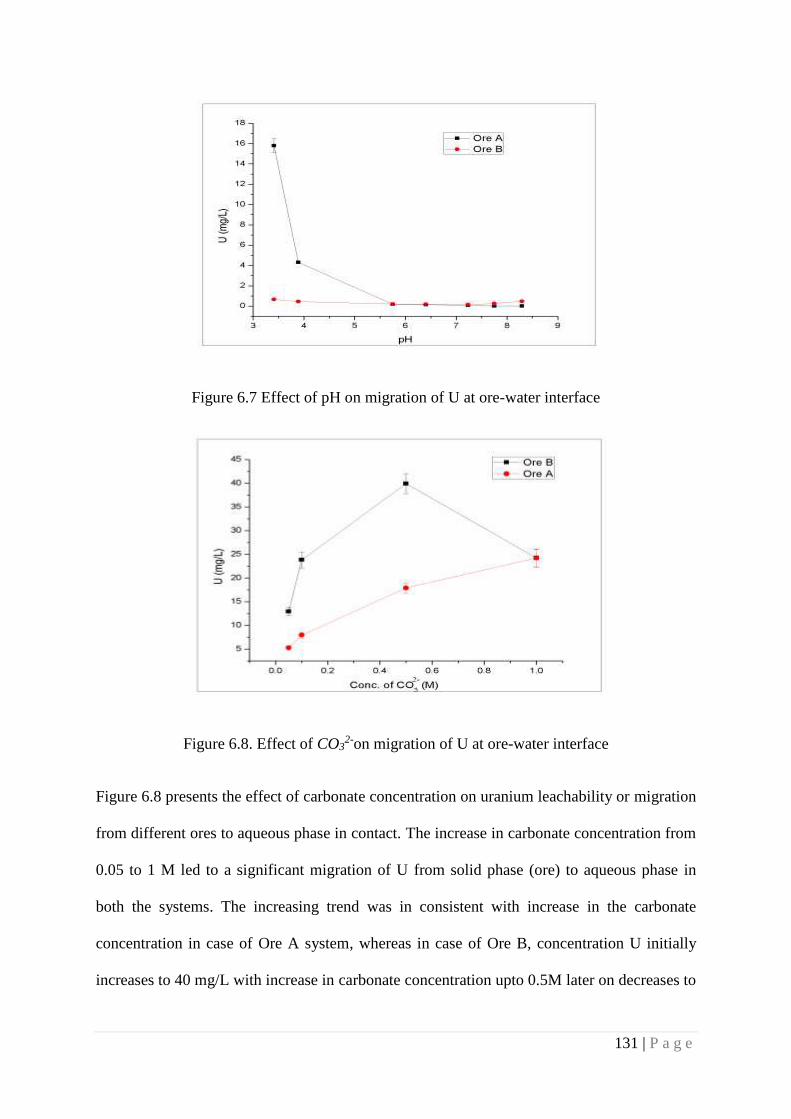
131 | P a g e
Figure 6.7 Effect of pH on migration of U at ore-water interface
Figure 6.8. Effect of CO32-on migration of U at ore-water interface
Figure 6.8 presents the effect of carbonate concentration on uranium leachability or migration
from different ores to aqueous phase in contact. The increase in carbonate concentration from
0.05 to 1 M led to a significant migration of U from solid phase (ore) to aqueous phase in
both the systems. The increasing trend was in consistent with increase in the carbonate
concentration in case of Ore A system, whereas in case of Ore B, concentration U initially
increases to 40 mg/L with increase in carbonate concentration upto 0.5M later on decreases to
132 | P a g e
22.5mg/L. The decrease in U concentration in aqueous phase may be attributes to the
precipitation of dissolved U as Na2U2O7 due to saturation of aqueous phase with U and
saturation concentration of U in the Ore-bicarbonate binary system is above 40 mg/L at ore to
water ratio of 1:10 g/mL.
6.5. Summary
The above study revealed that increase in the ionic strength of the water accelerates the
uranium migration from uranium bearing ore like, Uraninite at Ore –Water interface to water.
The extent of migration depends upon various factors like the type of host rock, speciation of
uranium in the ore, type of salt dominated in the aqueous phase, temperature and also
presence of any humic like substances. In general, an increase in ionic strength led an
increase in migration from solid (ore) phase to aqueous phase. Ca2+ ion was found to have
more potency to desorb the uranium from the ore as compared to sodium ion. . Nitrate
concentration also accelerated the uranium desorption by presumably acting as a dissolved
oxidant. In ternary system of ore-water- humic acid, presence of humic acid increases the
uranium concentration in liquid phase. However, a competitions between Ca2+ ion and uranyl
ion retarded the desorption at higher concentrations of Ca2+. Increase in carbonate
concentration accelerates migration of uranium irrespective of ore types but effect of pH
depends on the type of host rock containing uranium minerals. The results will be extremely
useful in predicting the uranium migration from mineralized ores to ground water and
subsequent impact assessment. The results also will be useful in impact assessment of
disposal options of uranium.
133 | P a g e
Chapter 7
Effects of Carbon Dioxide on Migration of Uranium
7.1. Introduction
Climate modeling studies and long term observations have indicated that the concentration of
carbon dioxide (CO2), one of the main greenhouse gases, is mainly responsible for global
warming [169]. From the era when the industrial revolution began, CO2 concentration in the
atmosphere has increased from 275 to 370 ppm and by 2100 it is projected to go up to 750
ppm [170]. An increase in atmospheric CO2 level may also lead to an increase in dissolved
CO2 in aquatic system which may cause changes in physicochemical properties of aquatic
system. This may also trigger a change in pH and aqueous speciation of dissolved species. It
may initiate various processes like, mineral dissolution, metal mobilization, sorption,
desorption and precipitations etc., at mineral-water or soil-water interface. In an attempt to
control CO2 emissions into the atmosphere, researchers have been trying to identify different
ways to collect and store/dispose of CO2 in geological systems, such as deep ocean waters,
sediments, and aquifers. One of the consequences of this option is the possibility of some
fraction of the stored CO2 being leaked into overlaying aquifers. Thus, attention in evaluating
the environmental impacts of CO2 leakage into potable aquifers should focus on the
secondary effects, namely the geochemical changes caused by the increased CO2 dissolution
in these systems. Dissolved into groundwater, CO2 increases the concentration of total
carbonate, including H2CO3 (aq), HCO3- and CO3
2- which may cause a decrease in pH. Such
acidic condition can affect the dissolution and sorption processes which in turn may cause
detrimental effects on groundwater quality by enhancing dissolution and/or desorption of
potentially hazardous trace metals [171]. A number of studies were reported in the literature
134 | P a g e
on the mobility of metals at sediment-water interface; Mobilization of the metals Al, Fe, Zn,
Co, Pb and Cu increases with acidifications [172]. Trace metal mobilization is already been
observed during experiments on the controlled release of CO2 from saline and freshwater
aquifers [173, 174]. The mobilization of trace elements can result from the dissolution of
carbonates, sulphides and iron oxy-hydroxide minerals, by adsorption/desorption reactions at
the sediment–water interface and by ion exchange processes [173]. However, detailed
information about the impacts of CO2 leakage is essential for risk assessments; the
consequences of such incidents are still largely unknown for mineral-water interface.
7.2. Present Study:
The objectives of this study includes the assessment of the impact of CO2 on migration of
Uranium at mineral (Uraninite)-water interface and soil-water interface to determine what
processes affect these changes and over what time scale they might occur. To this end, we
tried to investigate the change in speciation of U due to CO2 infiltration and geochemical
indicator to identify the CO2 infiltration.
7.3. Methodology:
7.3.1. Materials
To study the impact of CO2 infiltration to ore-mineral-water system, milled U ore (Ore A and
B) were collected from two different mining sites differing by their host rock compositions.
Detailed compositions of ore samples are discussed in chapter 6 (Table 6. 1 and Fig. 6.1a&b).
Natural rock samples were chosen because it allows for a realistic prediction of reactions
when CO2 comes in contact with natural systems. This study is focused to understand the
changes in physicochemical parameters of water in contact with ore with time and to interpret
mobility and speciation of U during experimental period.
135 | P a g e
Similarly for study of impact of CO2 at soil-water interface, soil amended with U (total U
content: 797mg/Kg) was taken.
For this study, synthetic water was used in order to reduce the corrosiveness of the DI water
which was prepared by amending DI water with 2mg/L of NaCl.
7.3.2. Experimental approach
For the study 20 g of milled, unwashed samples of ore A, B and soil sample taken in reactors
(Duran Bottles having hose connection) in duplicates and were equilibrated with 200 mL of
synthetic water (solid to water; 1: 10 g/mL). To minimize microbial influences in the reaction
vessels, glassware and fittings were acid cleaned and then heated to 250 °C for 5 h. Amber
color bottles were chosen for reactor to minimize photo sensitive reactions. The experiment
was conducted in two steps.
Step I (Pre exposure period): Reactors containing the ore mineral and water were kept inside
the shaker incubator at 250C for two weeks to allow water–mineral and water -soil systems to
approach equilibrium with respect to major elements and U. At the end of the 2nd week, 4 mL
of water were collected from each reactor.
Step II (Exposure period): 2nd week onwards, a stream of 99.8% pure CO2 was bubbled at
atmospheric pressure through each bottle using flow-regulated channels at a constant flow
rate for 30 days. Each channel is coupled to the bottle through a double holed rubber stopper.
One hole is used to deliver the CO2 into the bottles via a plastic bubble diffuser while the
other hole in the stopper is connected to an exhaust tube leading from the headspace of each
incubation bottle. Each bottle has an independent CO2 delivery and exit system. The
schematic diagram of experimental setup is presented in Fig. 7.1. To maintain gas pressure,
two cylinders were connected in parallel with an auto-changeover and pressure was
monitored continuously using pressure gauge.
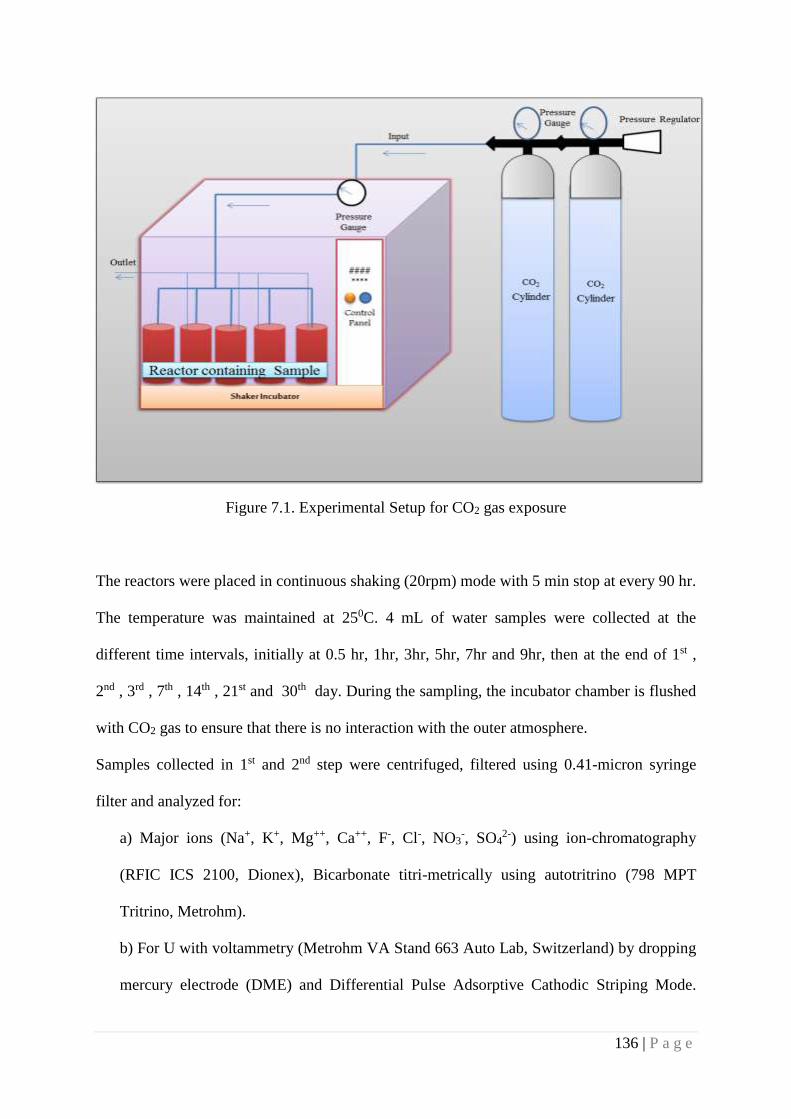
136 | P a g e
Figure 7.1. Experimental Setup for CO2 gas exposure
The reactors were placed in continuous shaking (20rpm) mode with 5 min stop at every 90 hr.
The temperature was maintained at 250C. 4 mL of water samples were collected at the
different time intervals, initially at 0.5 hr, 1hr, 3hr, 5hr, 7hr and 9hr, then at the end of 1st ,
2nd , 3rd , 7th , 14th , 21st and 30th day. During the sampling, the incubator chamber is flushed
with CO2 gas to ensure that there is no interaction with the outer atmosphere.
Samples collected in 1st and 2nd step were centrifuged, filtered using 0.41-micron syringe
filter and analyzed for:
a) Major ions (Na+, K+, Mg++, Ca++, F-, Cl-, NO3-, SO4
2-) using ion-chromatography
(RFIC ICS 2100, Dionex), Bicarbonate titri-metrically using autotritrino (798 MPT
Tritrino, Metrohm).
b) For U with voltammetry (Metrohm VA Stand 663 Auto Lab, Switzerland) by dropping
mercury electrode (DME) and Differential Pulse Adsorptive Cathodic Striping Mode.
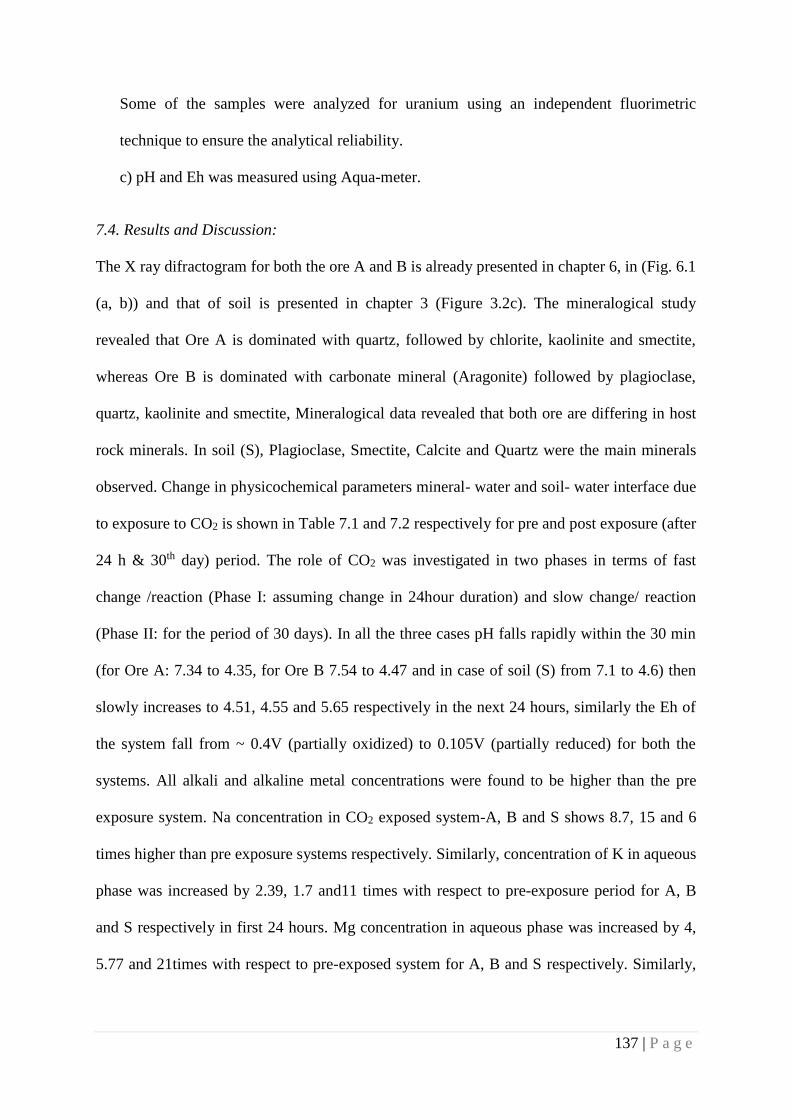
137 | P a g e
Some of the samples were analyzed for uranium using an independent fluorimetric
technique to ensure the analytical reliability.
c) pH and Eh was measured using Aqua-meter.
7.4. Results and Discussion:
The X ray difractogram for both the ore A and B is already presented in chapter 6, in (Fig. 6.1
(a, b)) and that of soil is presented in chapter 3 (Figure 3.2c). The mineralogical study
revealed that Ore A is dominated with quartz, followed by chlorite, kaolinite and smectite,
whereas Ore B is dominated with carbonate mineral (Aragonite) followed by plagioclase,
quartz, kaolinite and smectite, Mineralogical data revealed that both ore are differing in host
rock minerals. In soil (S), Plagioclase, Smectite, Calcite and Quartz were the main minerals
observed. Change in physicochemical parameters mineral- water and soil- water interface due
to exposure to CO2 is shown in Table 7.1 and 7.2 respectively for pre and post exposure (after
24 h & 30th day) period. The role of CO2 was investigated in two phases in terms of fast
change /reaction (Phase I: assuming change in 24hour duration) and slow change/ reaction
(Phase II: for the period of 30 days). In all the three cases pH falls rapidly within the 30 min
(for Ore A: 7.34 to 4.35, for Ore B 7.54 to 4.47 and in case of soil (S) from 7.1 to 4.6) then
slowly increases to 4.51, 4.55 and 5.65 respectively in the next 24 hours, similarly the Eh of
the system fall from ~ 0.4V (partially oxidized) to 0.105V (partially reduced) for both the
systems. All alkali and alkaline metal concentrations were found to be higher than the pre
exposure system. Na concentration in CO2 exposed system-A, B and S shows 8.7, 15 and 6
times higher than pre exposure systems respectively. Similarly, concentration of K in aqueous
phase was increased by 2.39, 1.7 and11 times with respect to pre-exposure period for A, B
and S respectively in first 24 hours. Mg concentration in aqueous phase was increased by 4,
5.77 and 21times with respect to pre-exposed system for A, B and S respectively. Similarly,
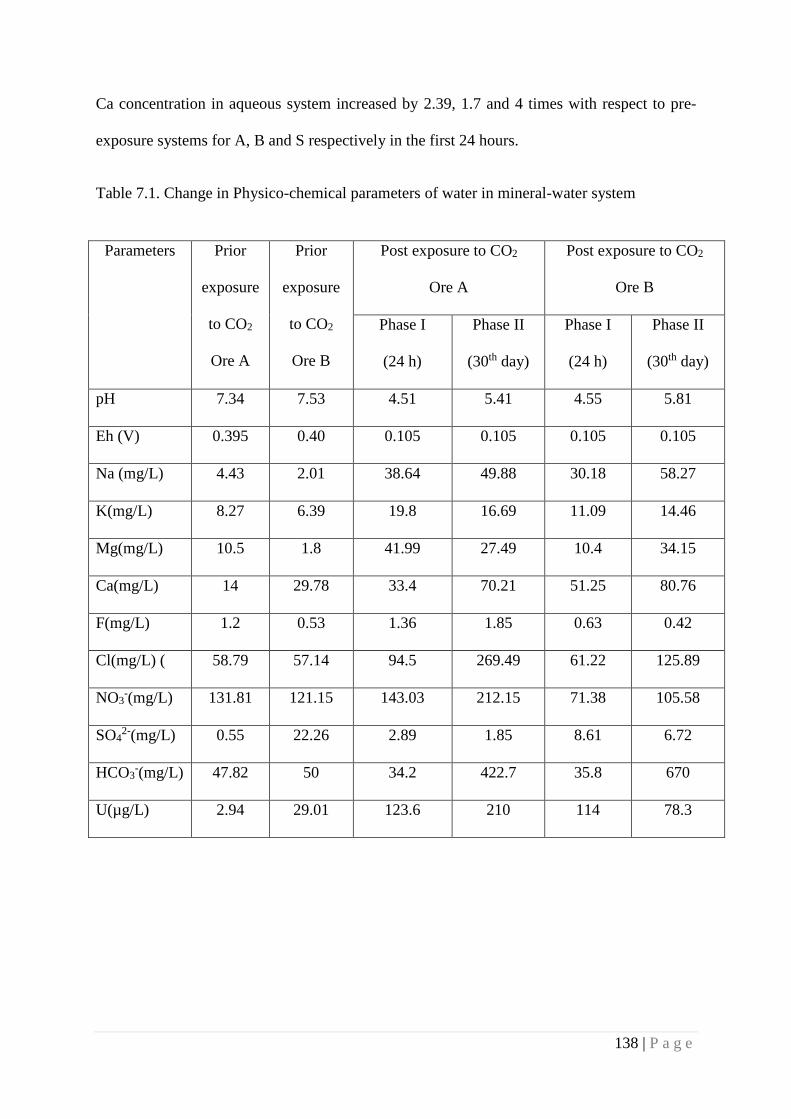
138 | P a g e
Ca concentration in aqueous system increased by 2.39, 1.7 and 4 times with respect to pre-
exposure systems for A, B and S respectively in the first 24 hours.
Table 7.1. Change in Physico-chemical parameters of water in mineral-water system
Parameters Prior
exposure
to CO2
Ore A
Prior
exposure
to CO2
Ore B
Post exposure to CO2
Ore A
Post exposure to CO2
Ore B
Phase I
(24 h)
Phase II
(30th day)
Phase I
(24 h)
Phase II
(30th day)
pH 7.34 7.53 4.51 5.41 4.55 5.81
Eh (V) 0.395 0.40 0.105 0.105 0.105 0.105
Na (mg/L) 4.43 2.01 38.64 49.88 30.18 58.27
K(mg/L) 8.27 6.39 19.8 16.69 11.09 14.46
Mg(mg/L) 10.5 1.8 41.99 27.49 10.4 34.15
Ca(mg/L) 14 29.78 33.4 70.21 51.25 80.76
F(mg/L) 1.2 0.53 1.36 1.85 0.63 0.42
Cl(mg/L) ( 58.79 57.14 94.5 269.49 61.22 125.89
NO3-(mg/L) 131.81 121.15 143.03 212.15 71.38 105.58
SO42-(mg/L) 0.55 22.26 2.89 1.85 8.61 6.72
HCO3-(mg/L) 47.82 50 34.2 422.7 35.8 670
U(µg/L) 2.94 29.01 123.6 210 114 78.3
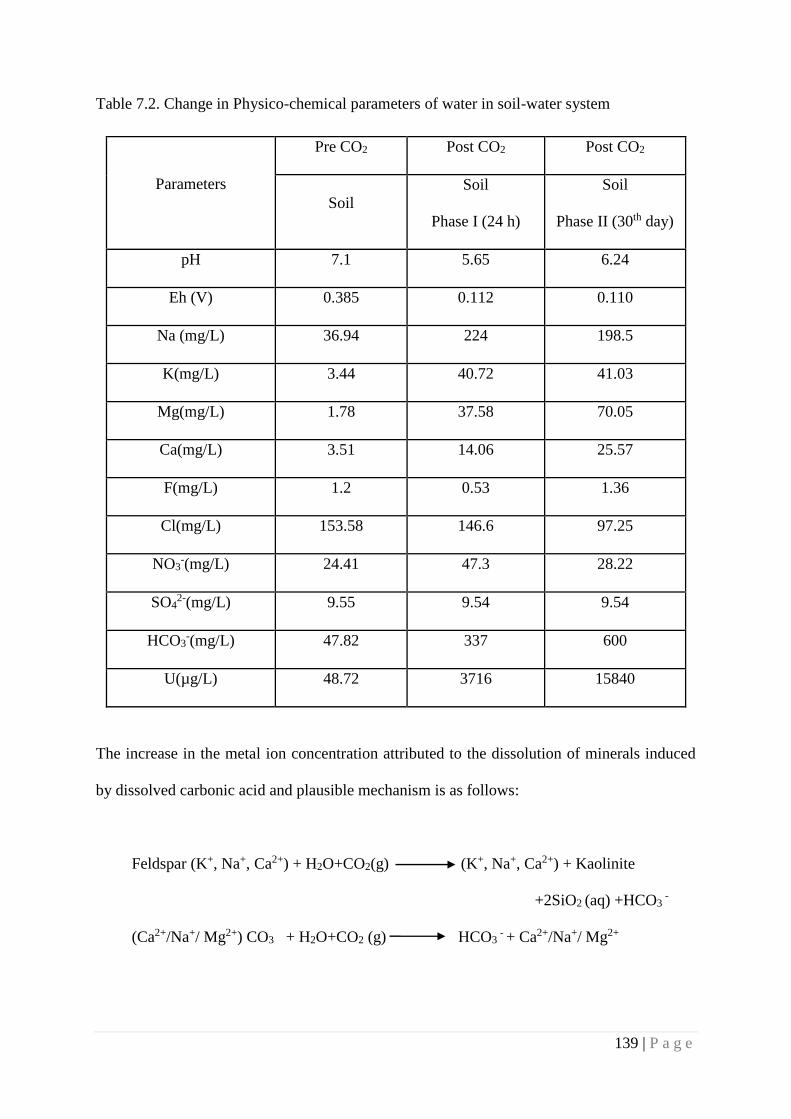
139 | P a g e
Table 7.2. Change in Physico-chemical parameters of water in soil-water system
The increase in the metal ion concentration attributed to the dissolution of minerals induced
by dissolved carbonic acid and plausible mechanism is as follows:
Feldspar (K+, Na+, Ca2+) + H2O+CO2(g) (K+, Na+, Ca2+) + Kaolinite
+2SiO2 (aq) +HCO3 -
(Ca2+/Na+/ Mg2+) CO3 + H2O+CO2 (g) HCO3 - + Ca2+/Na+/ Mg2+
Parameters
Pre CO2 Post CO2 Post CO2
Soil
Soil
Phase I (24 h)
Soil
Phase II (30th day)
pH 7.1 5.65 6.24
Eh (V) 0.385 0.112 0.110
Na (mg/L) 36.94 224 198.5
K(mg/L) 3.44 40.72 41.03
Mg(mg/L) 1.78 37.58 70.05
Ca(mg/L) 3.51 14.06 25.57
F(mg/L) 1.2 0.53 1.36
Cl(mg/L) 153.58 146.6 97.25
NO3-(mg/L) 24.41 47.3 28.22
SO42-(mg/L) 9.55 9.54 9.54
HCO3-(mg/L) 47.82 337 600
U(µg/L) 48.72 3716 15840
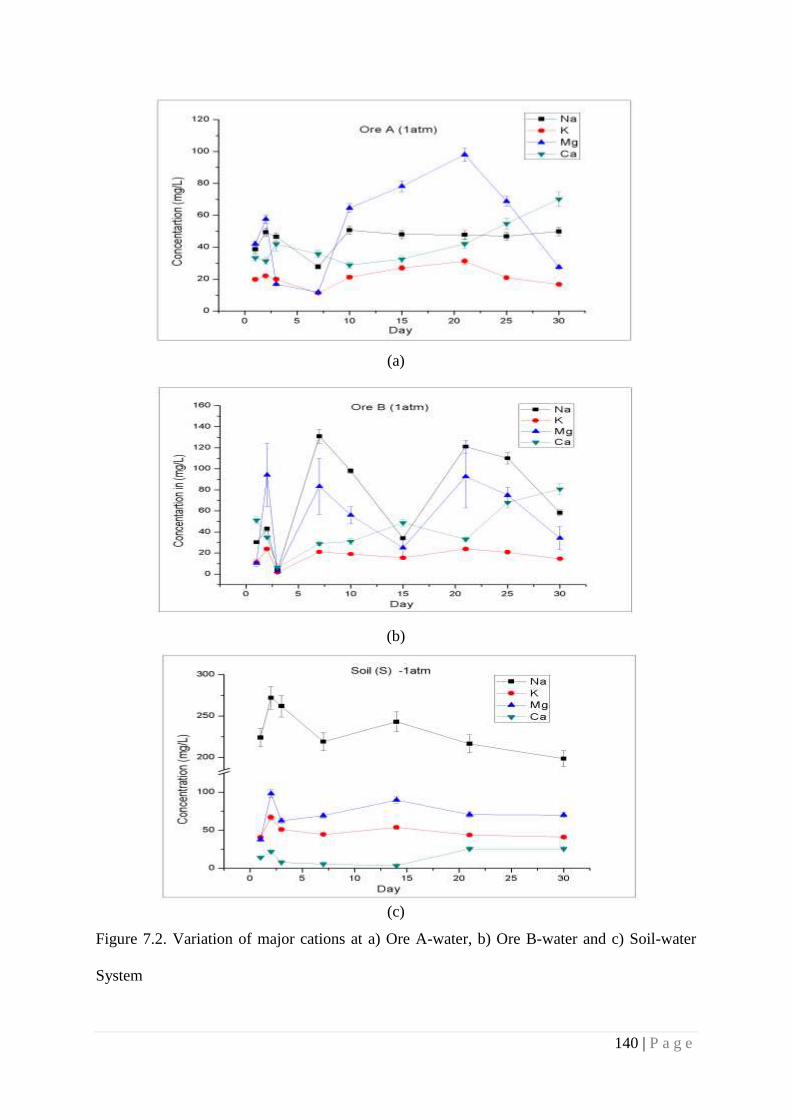
140 | P a g e
(a)
(b)
(c)
Figure 7.2. Variation of major cations at a) Ore A-water, b) Ore B-water and c) Soil-water
System
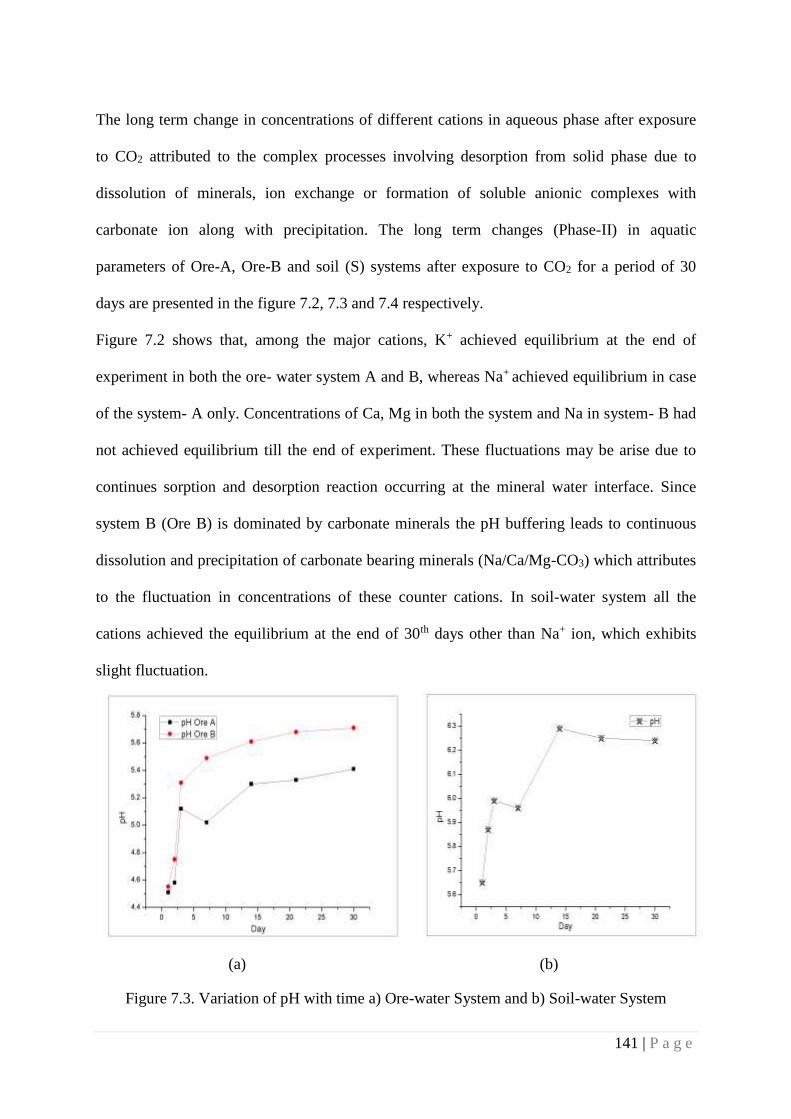
141 | P a g e
The long term change in concentrations of different cations in aqueous phase after exposure
to CO2 attributed to the complex processes involving desorption from solid phase due to
dissolution of minerals, ion exchange or formation of soluble anionic complexes with
carbonate ion along with precipitation. The long term changes (Phase-II) in aquatic
parameters of Ore-A, Ore-B and soil (S) systems after exposure to CO2 for a period of 30
days are presented in the figure 7.2, 7.3 and 7.4 respectively.
Figure 7.2 shows that, among the major cations, K+ achieved equilibrium at the end of
experiment in both the ore- water system A and B, whereas Na+ achieved equilibrium in case
of the system- A only. Concentrations of Ca, Mg in both the system and Na in system- B had
not achieved equilibrium till the end of experiment. These fluctuations may be arise due to
continues sorption and desorption reaction occurring at the mineral water interface. Since
system B (Ore B) is dominated by carbonate minerals the pH buffering leads to continuous
dissolution and precipitation of carbonate bearing minerals (Na/Ca/Mg-CO3) which attributes
to the fluctuation in concentrations of these counter cations. In soil-water system all the
cations achieved the equilibrium at the end of 30th days other than Na+ ion, which exhibits
slight fluctuation.
(a) (b)
Figure 7.3. Variation of pH with time a) Ore-water System and b) Soil-water System
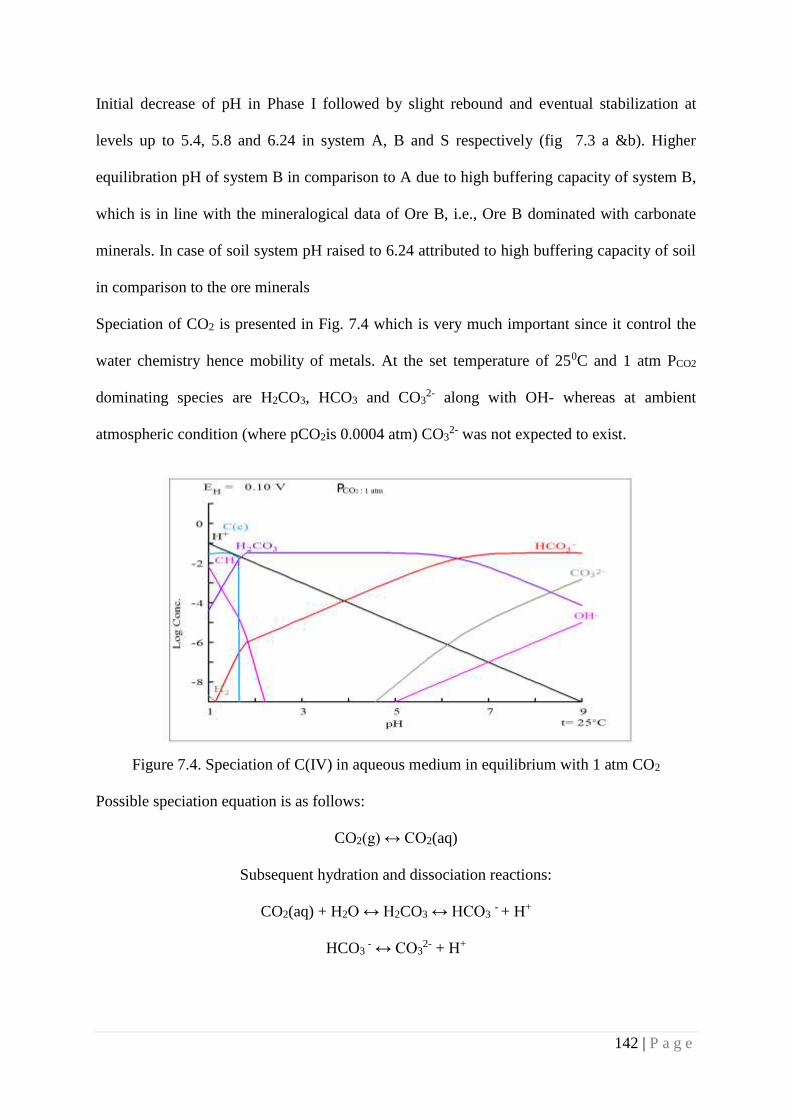
142 | P a g e
Initial decrease of pH in Phase I followed by slight rebound and eventual stabilization at
levels up to 5.4, 5.8 and 6.24 in system A, B and S respectively (fig 7.3 a &b). Higher
equilibration pH of system B in comparison to A due to high buffering capacity of system B,
which is in line with the mineralogical data of Ore B, i.e., Ore B dominated with carbonate
minerals. In case of soil system pH raised to 6.24 attributed to high buffering capacity of soil
in comparison to the ore minerals
Speciation of CO2 is presented in Fig. 7.4 which is very much important since it control the
water chemistry hence mobility of metals. At the set temperature of 250C and 1 atm PCO2
dominating species are H2CO3, HCO3 and CO32- along with OH- whereas at ambient
atmospheric condition (where pCO2is 0.0004 atm) CO32- was not expected to exist.
Figure 7.4. Speciation of C(IV) in aqueous medium in equilibrium with 1 atm CO2
Possible speciation equation is as follows:
CO2(g) ↔ CO2(aq)
Subsequent hydration and dissociation reactions:
CO2(aq) + H2O ↔ H2CO3 ↔ HCO3 - + H+
HCO3 - ↔ CO3
2- + H+
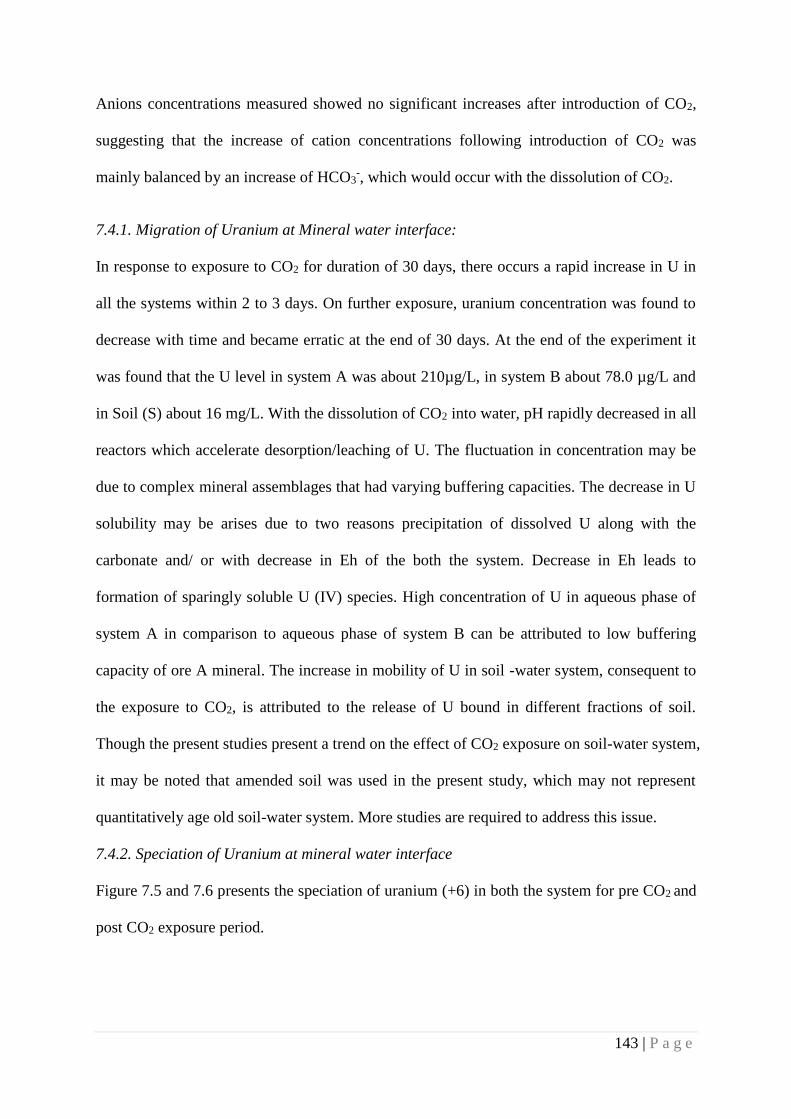
143 | P a g e
Anions concentrations measured showed no significant increases after introduction of CO2,
suggesting that the increase of cation concentrations following introduction of CO2 was
mainly balanced by an increase of HCO3-, which would occur with the dissolution of CO2.
7.4.1. Migration of Uranium at Mineral water interface:
In response to exposure to CO2 for duration of 30 days, there occurs a rapid increase in U in
all the systems within 2 to 3 days. On further exposure, uranium concentration was found to
decrease with time and became erratic at the end of 30 days. At the end of the experiment it
was found that the U level in system A was about 210µg/L, in system B about 78.0 µg/L and
in Soil (S) about 16 mg/L. With the dissolution of CO2 into water, pH rapidly decreased in all
reactors which accelerate desorption/leaching of U. The fluctuation in concentration may be
due to complex mineral assemblages that had varying buffering capacities. The decrease in U
solubility may be arises due to two reasons precipitation of dissolved U along with the
carbonate and/ or with decrease in Eh of the both the system. Decrease in Eh leads to
formation of sparingly soluble U (IV) species. High concentration of U in aqueous phase of
system A in comparison to aqueous phase of system B can be attributed to low buffering
capacity of ore A mineral. The increase in mobility of U in soil -water system, consequent to
the exposure to CO2, is attributed to the release of U bound in different fractions of soil.
Though the present studies present a trend on the effect of CO2 exposure on soil-water system,
it may be noted that amended soil was used in the present study, which may not represent
quantitatively age old soil-water system. More studies are required to address this issue.
7.4.2. Speciation of Uranium at mineral water interface
Figure 7.5 and 7.6 presents the speciation of uranium (+6) in both the system for pre CO2 and
post CO2 exposure period.
144 | P a g e
(a)
(b)
Figure 7. 5. Aqueous speciation of U(VI) during pre-exposure period at mineral-water system;
a) Ore A-Water, b) Ore B-Water
Based on equilibrium concentration of different dissolved species, uranium, pH and Eh of
systems the speciation diagram was drawn. In pre exposure study, figure revealed that for the
binary system of A at the pH of 7.34 Eh of 0.4V and specified ionic composition, uranyl
species namely (UO2)2CO3 (OH)3-, UO2CO3, UO2(OH)2, UO2OH+ and UO2(CO3)3
4- were
present out of which aqueous (UO2)2CO3(OH)3- is predominating species followed by
UO2CO3. In case of system B, (UO2)2CO3(OH)3-, UO2(CO3)2
2-, UO2(CO3)34-, UO2CO3,
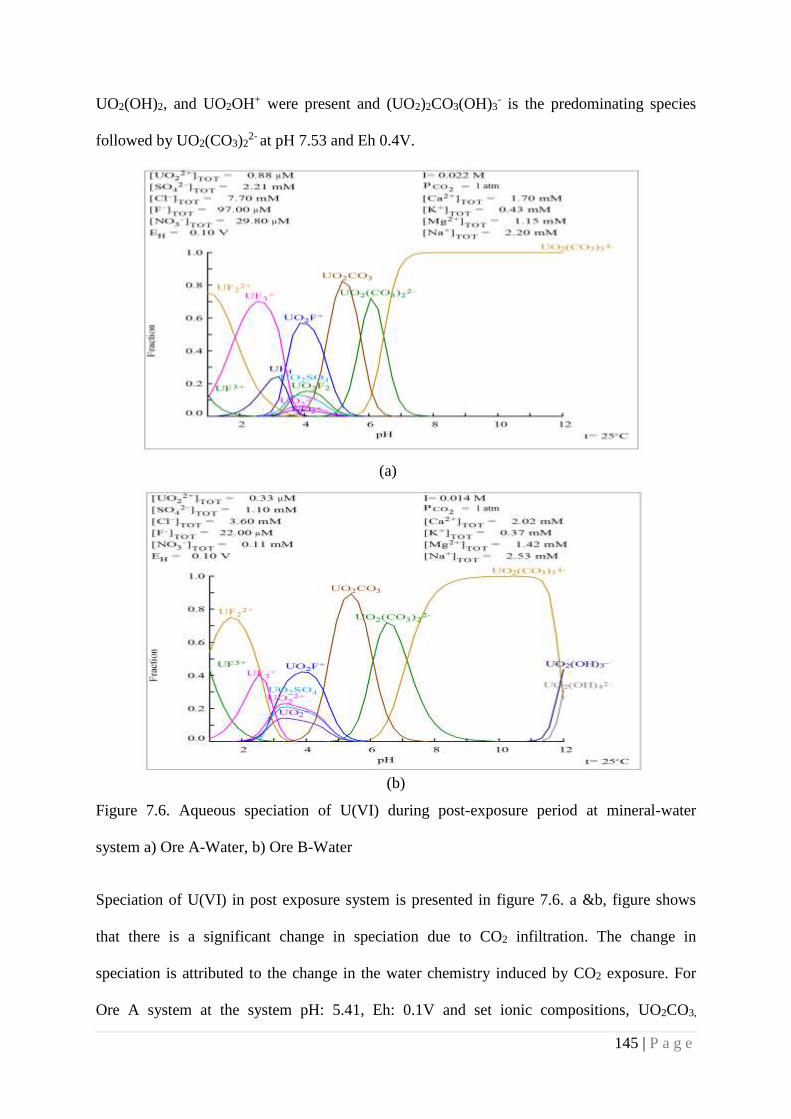
145 | P a g e
UO2(OH)2, and UO2OH+ were present and (UO2)2CO3(OH)3- is the predominating species
followed by UO2(CO3)22-
at pH 7.53 and Eh 0.4V.
(a)
(b)
Figure 7.6. Aqueous speciation of U(VI) during post-exposure period at mineral-water
system a) Ore A-Water, b) Ore B-Water
Speciation of U(VI) in post exposure system is presented in figure 7.6. a &b, figure shows
that there is a significant change in speciation due to CO2 infiltration. The change in
speciation is attributed to the change in the water chemistry induced by CO2 exposure. For
Ore A system at the system pH: 5.41, Eh: 0.1V and set ionic compositions, UO2CO3,
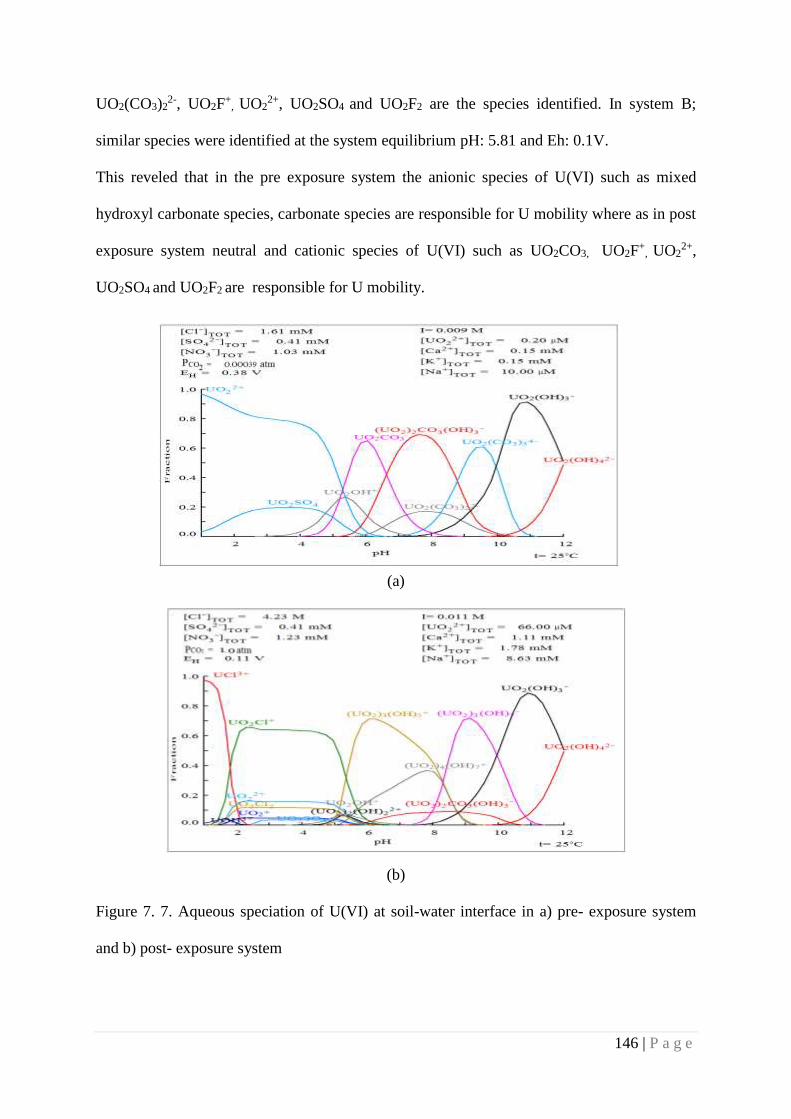
146 | P a g e
UO2(CO3)22-, UO2F
+, UO2
2+, UO2SO4 and UO2F2 are the species identified. In system B;
similar species were identified at the system equilibrium pH: 5.81 and Eh: 0.1V.
This reveled that in the pre exposure system the anionic species of U(VI) such as mixed
hydroxyl carbonate species, carbonate species are responsible for U mobility where as in post
exposure system neutral and cationic species of U(VI) such as UO2CO3, UO2F+
, UO22+,
UO2SO4 and UO2F2 are responsible for U mobility.
(a)
(b)
Figure 7. 7. Aqueous speciation of U(VI) at soil-water interface in a) pre- exposure system
and b) post- exposure system
147 | P a g e
7.4.3. Speciation of Uranium at soil water interface
Figure 7.7 (a) revealed that in pre exposure period at the pH of 7.1 (UO2)2CO3(OH)3- is the
predominate species followed by UO2CO3 and UO2(CO3)22- whereas, after CO2 exposure (Fig
7.7 b) the speciation significantly changed and positive uranium species became dominated
out of which (UO2)3(OH)5+ is dominating species followed by (UO2)4(OH)7
+ due to change in
system pH to 6.24 , Eh: 0.1V and ion chemistry of system.
U(IV) is not considered for speciation calculation in both ore-water and soil-water system
since the concentration of U(IV) is negligible in comparison to U(VI) in the above systems.
7.5. Summary
Introduction of CO2 into ore water and soil water binary systems leads to saturation of water
at mineral/soil-water interface with CO2. Initial elevated cation concentrations suggest that
mineral dissolution was driven by CO2 which is consistent with initial decreases in pH. The
phase II experiment documented increase, stabilization, and/or decline of concentrations with
fluctuation. In response to exposure of CO2, U solid to aqueous phase mobility increases 15
times more than the pre exposed systems of A and B within 2–3 days, subsequently the
mobility starts to fall and achieve equilibrium at the end of 30 days. The trend was same in
soil-water system, where U concentration increased 325 times than pre-exposed system. The
higher degree of mobility of uranium in soil water system can be attributed to U bound in
different fractions of soil whereas in ore minerals it is mainly residual fraction. pH and HCO3-
can be used as geochemical indicator for CO2 induced metal/ U mobility. Though the reaction
rates in laboratory-batch experiments tend to be higher by orders of magnitude than those in
field conditions, use of natural ore samples may help represent more realistic reaction
timescales.
148 | P a g e
Chapter 8
Conclusions
The issue of high-level of U in drinking water sources of many countries round the globe as
well as in many states of India is one of the important environmental concerns. This increase
in migration of U from geological system (soil and minerals) to aquatic systems in terrestrial
environment may be due to long-term change in environmental condition of soil/minerals and
ground water systems. The migration of U depends upon several complex parameters such as
water quality, soil (and mineral) characteristics, U speciation in solid phase and redox
potential of the system etc. A detailed study of these parameters is essential for understanding
the mechanism of migration from solid to solution in geological systems. This motivated us
to carry out detailed studies on the speciation and migration of U from solid phase (soil and
minerals) to solution (water) in terrestrial environment. This study also will be useful in
carrying out environmental impact assessment of waste disposal sites. As part of the
dissertation work, batch sorption and desorption experiments, aqueous and solid phase
speciation studies and spectroscopic investigations were carried out to explore migration
behavior of uranium in terrestrial environment with special focus on soil-water and mineral-
water systems. Aspects delineated in these studies were (1) sorption kinetics and
thermodynamics along with studies of sorption isotherms to understand behavior of U at soil-
water interface, (2) Speciation of uranium in contaminated soil and effect of ageing on its
bio-availability and speciation, (3) effect of salinity on migration of uranium at soil/mineral-
water system and (4) effect of CO2 on solid to aqueous phase migration of uranium in
mineral-water and soil-water binary systems. The major findings and conclusions from this
work are summarized below.
149 | P a g e
a) The batch sorption studies of U in wide variety of soil types revealed that sorption
follows pseudo-second order kinetics with multi-step diffusion process irrespective of
soil types. The rate-determining step is chemisorption involving valence forces
through sharing or exchange of electrons along with ion exchange sites. Soil
parameters like Fe, Mn and Organic Matter (OM) were found to increase the U
sorption to the solid phase. Soil with high iron and manganese content showed high
adsorption capacity for uranium. Change in soil organic content did not exhibit
significant change in sorption capacity of such soils at circumneutral pH. Fe and Mn
rich soils followed Langmuir sorption isotherms in comparison to other type of soil
which followed Freundlich and D-R isotherms. Among water parameters pH, CO32-
and Ca2+ were found to be the sensitive parameters influencing solid to aqueous phase
mobility and aqueous phase speciation of U at soil water interface. Thermodynamic
parameters derived from the experimental data, indicated that the sorption is
spontaneous, endothermic in nature and follows dissociative mechanism. The study
also revealed that geological setup with high ferro-manganese content offers least
mobile environment for Uranium. Such geological set up offers candidate sites for
waste disposal facilities or geological repository of uranium. Fe or Mn enriched soils
can also be used as a backfill to mitigate migration of U. This opens a wide scope for
research in modified materials and selection of natural matrix for immobilization of U.
b) The study on speciation of uranium in soil of different types revealed that, in
moderately reduced soil, major fraction of uranium exist as completely immobile
U(IV) state whereas in aerobic condition it sparingly soluble to sodium bicarbonate
solution due to partial oxidation of U(IV) to U(VI). The increase in bicarbonate in
soil/mineral water system in aerobic environment leads to mobilization of bound
150 | P a g e
U(IV) from soil exchangeable sites as well as from OM due to formation of soluble
uranyl carbonate complexes.
The sequential extraction experiments were carried out to understand the chemical
fractionation uranium in soil matrix and change in chemical fractionation with ageing.
Spectroscopic investigation (using XPS) was also carried out to understand the
process involved during ageing. The study revealed that, even though the fate of U in
soil initially governed by concentration of adsorbents (Such as carbonate, oxides of
Fe/ Mn, OM etc. in respective fractions) but with change in time there occur a
significant rearrangement of U in among all the fractions However there was no
difference in total uranium in soil matrix before and after aging process.
Spectroscopic investigation envisages that, surface speciation of uranium is mainly
controlled by soil carbonate and organic matter content. A significant decrease of U in
reducible fraction was observed after aging. The apparent decrease in concentration of
reducible U in soil matrix with aging can be attributed to the occlusion of U-Fe-
Oxides (Hydroxide) in to amorphous silica. The study can be extended to see the
effect of ageing on uranium speciation in different environmental condition which
will be helpful for predicting long term behavior of U in terrestrial environment.
c) Study of effect of salinity on migration of uranium from solid to solution at soil-water
and mineral-water interface conclude that increase in salinity induced increased
uranium migration from solid phase to aqueous phase. Study in soil-water system
revealed that, extent of mobilization depends upon both speciation of uranium in soil
as well as type of salt. This study indicated that, U mobilization from soil by salts
(CaCl2, MgCl2, Na2SO4 and NaCl) is independent of the total U content of soil rather
it depends upon % of total U in exchangeable sites. This indicates that the migration
151 | P a g e
process of U induced by these salts is driven by ion exchange mechanism. The present
study indicated that NaNO3 mobilizes the larger fraction of U (VI) from solid phase.
This may be because of fact that NaNO3 induced uranium mobilization involves ion
exchange as well as oxidative dissolution of U(IV) bound to different fractions of soil.
Study of effect of salinity on mineral-water indicated that, the extent of mobilization
depends upon various factors like the type of host rock, speciation of uranium in the
ore, type of salt dominated in the aqueous phase and also presence of any humic like
substances. Like soil-water system, water dominated with Ca2+ ion has more potency
to desorb the uranium from the ore and water with high nitrate concentration also
accelerate the uranium desorption. In ternary system of ore-water- humic acid,
presence of humic acid increased the uranium concentration in liquid phase. However,
in presence higher concentration of Ca2+ ion uranium desorption was suppressed due
to formation of more stable Ca-Humato complex in comparison to Uranyl-Humato
Complex. Increase in bicarbonate concentration accelerated mobility of uranium
irrespective of ore types but effect of pH was found to depend on the type of host rock
containing uranium minerals. The outcome of study opens a scope for research in the
field of nitrate induced abiotic oxidative dissolution of U(IV) to U(VI).
d) Experiments were carried out to investigate the effect of infiltration of CO2 to
mineral/soil-water interface initiates various reactions. The studies were carried out in
a carbonate based ore water system, quartz based ore water system and a soil water
system. A rapid decrease in pH was observed consequent to CO2 to mineral water and
soil water systems. This triggered dissolution of rock minerals and soil minerals
leading to an increase in cation concentrations at soil/mineral-water interface within
24 hour. In response to exposure of CO2, U mobility increases up to maximum ~150
times more than the pre exposed mineral-water systems within 2–3 days and again
152 | P a g e
started to fall and achieve equilibrium at the end of 30 days. . The extent of
mobilization was found to depend upon the type of host rock containing uranium
minerals. Similar observations were made in soil-water system, where in U
concentration in aqueous phase increased by 325 times than pre-exposed system. The
increase in migration of U in soil -water system, consequent to the exposure to CO2, is
attributed to the release of U bound in different fractions of soil. Though the present
studies present a trend on the effect of CO2 exposure on soil-water system, it may be
noted that amended soil was used in the present study, which may not represent
quantitatively age old soil-water system. More studies are required to address this
issue. pH and HCO3- can be used as geochemical indicator for CO2 induced metal/ U
mobility. The study can be extended to see the effects CO2 infiltration on the mobility
and speciation of heavy metals at mineral-water and soil water system as well as
effect of CO2 on.
In a nutshell study of migration of uranium in terrestrial environment is very complex and
also complexities increase due to human activities such as mining, processing and waste
disposal practices along with current issue of climatic change. Change in climate or
environmental conditions and wrong human practices directly or indirectly brought
changes in terrestrial as well as subsurface aquatic systems like change in
physicochemical properties of soil and water which increases the uranium (any metal also)
migration from soil/mineral to water in contact. Case studies like, high level of uranium
in ground water of Punjab, India along with high salinity and pH can be correlated to the
salinity induced mobilization. Study of speciation of uranium in soil or minerals are very
much essential to assess its migration behavior. Uranium associated with residual fraction
are least or not affected by any change in physicochemical properties of soil/mineral–
water system. Increased in atmospheric CO2 will directly or indirectly affect uranium

153 | P a g e
migration. The present study gives a basic insight to the process of migration of uranium
to aqueous stream from ore and soil system. This knowledge will be extremely useful in
carrying out the assessment of long term impact of uranium waste disposal facilities such
as Near Surface disposal Facility (NSDF) or Deep Geological Repository (DGR). The
knowledge also will be useful in predicting the salinity induced migration of uranium and
other heavy metals from rocks to drinking water systems.
154 | P a g e
Reference
1. Langmuir, D (1997). Aqueous Environmental Geochemistry. Upper Saddle River:
Prentice Hall, Inc.
2. Cochran, RG & Tsoulfanidis, N (1999). The Nuclear Fuel Cycle: Analysis and
Management (2nd ed). Lagrange Park, IL: American Nuclear Society.
3. Frondel, C. (1958). Systematic Mineralogy of Uranium and Thorium. Geological
Survey Bulletin 1064, U.S. Geological Survey, Washington, D.C.
4. Langmuir, D. (1978). Uranium Solution-mineral Equilibria at Low Temperatures with
Applications to Sedimentary Ore Deposits.” Geochimica et Cosmochimica Acta,
42:547-569.
5. Plant, J.A., Simson, P.R., Smith, B., Windley, B.F. (1999) Uranium ore deposits –
products of the radioactive Earth. In: Uranium: Mineralogy, Geochemistry and the
Environment (Eds. BURNS, P.C. and FINCH, R.). Reviews in Mineralogy, 38, p. 255-
320.
6. Bruno, J., Casas, I., Puigdomenech, I. (1988). The Kinetics of Dissolution of UO2 (s)
Under Reducing Conditions.” Radiochimica Acta, 11:44-45.
7. Bruno, J., Casas, I., Puigdomenech, I. (1991). The Kinetics of Dissolution of UO2
Under Reducing Conditions and the Influence of an Oxidized Surface Layer (UO2+x):
Application of a Continuous Flow-through Reactor.” Geochimica et Cosmochimica
Acta, 55:647-658.
8. Morris, D. E., Chisholm-Brause, C. J., Barr, M. E., Conradson, S. D., Eller. P. G.
(1994). Optical Spectroscopic Studies of the Sorption of UO22+ Species on a
Reference Smectite. Geochimica et Cosmochimica Acta, 58:3613-3623.
155 | P a g e
9. Sandino, A., Bruno, J. (1992). The Solubility of (UO2)3(PO4)2.4H2O(s) and the
Formation of U(VI) Phosphate Complexes: Their Influence in Uranium Speciation in
Natural Waters.” Geochimica et Cosmochimica Acta, 56:4135-4145.
10. Wanner, H., Forest, I. (eds.), (1992). Chemical Thermodynamics Series, Volume 1:
Chemical Thermodynamics of Uranium. North-Holland, Elsevier Science Publishing
Company, Inc., New York, New York.
11. Kim, J. J. (1986) Chemical Behavior of Transuranic Elements in Aquatic Systems.” In
Handbook on the Physics and Chemistry of the Actinides, A. J. Freeman and C. Keller
(eds.), pp. 413-455, Elsevier Science Publishers, Amsterdam, Holland.
12. Falck, W. E.(1991) CHEMVAL Project. Critical Evaluation of the CHEMVAL
Thermodynamic Database with Respect to its Contents and Relevance to Radioactive
Waste Disposal at Sellafield and Dounreay. DoE/HMIP/RR/92.064, Department of
Environment, Her Majesty’s Stationary Office, London, England.
13. Ames, L. L., McGarrah, J. E., Walker, B. A., Salter. P. F. (1982). Sorption of Uranium
and Cesium by Hanford Basalts and Associated Secondary Smectites.” Chemical
Geology, 5:205-225.
14. Chisholm-Brause, C., Conradson, S. D., Buscher, C. T., Eller, P. G., Morris, D. E.
(1994) Speciation of Uranyl Sorbed at Multiple Binding Sites on Montmorillonite.
Geochimica et Cosmochimica Acta, 58:3625-2631.
15. Borovec, Z., B. Kribek, and V. Tolar. (1979). Sorption of Uranyl by Humic Acids.”
Chemical Geology, 27:39-46.
16. Read, D., Lawless, T. A., Sims, R. J., Butter, K. R. (1993). Uranium Migration
Through Intact Sandstone Cores. Journal of Contaminant Hydrology, 13:277-289.
17. Shanbhag, P. M., Choppin, G. R. (1981). Binding of Uranyl by Humic Acid. Journal of
Inorganic Nuclear Chemistry, 43:3369-3372.
156 | P a g e
18. Hsi, C-K. D., and Langmuir, D. (1985). Adsorption of Uranyl onto Ferric
Oxyhydroxides, Application of the Surface Complexation Site-binding Model.”
Geochimica et Cosmochimica Acta, 49:1931-1941.
19. Waite, T. D., Davis, J. A. Payne, T. E., Waychunas G. A., Xu, N. (1994). Uranium
(VI) Adsorption to Ferrihydrite: Application of a Surface Complexation Model.
Geochimica et. Cosmochimica Acta, 24: 5465-5478.
20. Yeh, G., Tripathi, V. S. (1991). A Model for Simulating Transport of Reactive
Multispecies Components: Model Development and Demonstration. Water Resources
Research, 27: 3075-3094.
21. Boggs, S. Jr., Livermore, D., Seitz, M. G. (1985). Humic Substances in Natural Waters
and Their Complexation with Trace Metals and Radionuclides: A Review. ANL-84-78,
Argonne National Laboratory, Argonne, Illinois.
22. Borovec, Z., Kribek, B., Tolar. V. (1979). Sorption of Uranyl by Humic Acids.”
Chemical Geology, 27:39-46.
23. Idiz, E. F., D. Carlisle, and I. R. Kaplan. (1986). Interaction Between Organic Matter
and Trace Metals in a Uranium Rich Bog, Kern County, California, U.S.A. Applied
Geochemistry, 1:573-590.
24. Szalay, A. 1964. “Cation Exchange Properties of Humic Acids and their Importance in
the Geochemical Enrichment of UO2 2+ and Other Cations.” Geochimica et
Cosmochimica Acta, 28:1605-1614.
25. Nash, K., Fried, S. Freidman, A. M. Sullivan. J. C. (1981). Redox Behavior,
Complexing, and Adsorption of Hexavalent Actinides by Humic Acid and Selected
Clays.” Environmental Science and Technology, 15:834-837.
157 | P a g e
26. Kent, D. B., Tripathi, V. S., Ball, N. B. Leckie, J. O. Siegel, M. D (1988). Surface-
Complexation Modeling of Radionuclide Adsorption in Subsurface Environments.
NUREG/CR-4807, U.S. Nuclear Regulatory Commission, Washington, D.C.
27. Limson Z, Tracy, M., Zielinski, B.L., Meyerhof, J. M., Moss, M.A. (1998). Chronic
ingestion of uranium in drinking water: A study of kidney bioeffects in humans.
Toxicol. Sci., 1998, 43, p. 68-77.
28. Domingo J. L. (2001). Reproductive and developmental toxicity of natural and
depleted uranium: a review. Reprod. Toxicol., 15, 603-609.
29. Domingo J.L (1995). Chemical toxicity of uranium. Toxicol. Ecotoxicol. News, 2, 74-
78.
30. Domingo J.L., Domingo A., Colomina M.T. (2004). Influence of maternal stress on
metal-induced and postnatal effects in mammals: a review. Biol. Trace Elem. Res., 98,
193-207.
31. Linares V., Sanchez, D.J., Belle S, M., Albina, L., Gomez M., Domingo J.L., (2007).
Pro-oxidant effects in the brain of rats concurrently exposed to uranium and stress.
Toxicology, 236, 82-91.
32. Blantz, R.C., Pelayo, J.C., Gushwa, L.C., Myers, R., Evan, A.P(1985). Functional
basis for glomerular alterations in uranyl nitrate acute renal failure. Kidney Int. 228,
733-743.
33. ATSDR (1999) Toxicological Profile for Uranium. Washington: US Public Health
Services, pp 398.
34. Cantaluppi C., Deggeto, S. (2000). Civillian and military uses of depleted uranium:
environmental and health problems. Ann. Chim., 90, 665-676.
158 | P a g e
35. Ballou, J.E., Gies, R.A., Case, A.C., Haggard, D.L., Buschbom, R.L., Ryan, J.L.(1986).
Deposition and early disposition of inhaled uranium-233 uranyl nitrate and uranium-
232 uranyl nitrate in the rat. Health Phys., 51, 755-772.
36. Dockery, D.W., Arden, P., Xu, X. (1993). An association between air pollution and
mortality in six US cities. New Engl. J. Med., 329, 1753-1759.
37. Dungworth, D.L. (1989) Non carcinogenic responses of respiratory tract to inhaled
toxicants. In: Concepts in Inhalation Toxicology (Eds. McClellan, R.O., Henderson,
R.F.). New York (USA): Hemisphere Publishing Corporation.
38. Morris, K.J., Khanna, P., Batchelor, A.L., (1990). Long-term clearance of inhaled UO2
particles from the pulmonary region of the rat. Health Phys., 58, 477-485.
39. Sanders, C.L. (1986). Radiological Health. Toxicological Aspects of Energy
Production. Columbus (Ohio, USA): Battelle Press, pp 253-284.
40. UNSCEAR (1988) Sources and Effects of Ionizing Radiation: Sources, Effects and
Risks of Ionizing Radiation. Report to the General Assembly. New York: UNSCEAR,
41. Brown, D.P.; Bloom, T.(1999). Mortality among uranium enrichment workers. In:
Toxicological Profile for Uranium (Eds. KEITH, S., SPOO, W., CORCORAN, J.).
Atlanta (USA): Agency for Toxic Substances and Disease Registry, 462 p.
42. Checkoway, H., Pearce, N., Crawford-Brown, D.J., Cragle, D.L (1988). Radiation
doses and causes specific mortality among workers at a nuclear materials fabrication
plant. Am. J. Epidemiology., 127, 255-266.
43. Wedeen, R.P (1992), Renal diseases of occupational origin. Occup. Med. 7, p. 449-63.
44. Leggett, R.W., Pellmar, T.C. (2003). The biokinetics of uranium migrating from
embedded DU fragments. J. Environ. Radioact., 64, 205-225.
45. Fisenne, I.M., Perry, P.M., Harley, N.H. (1988). Uranium in humans. Radiat. Prot.
Dosim., 24, 127-131.
159 | P a g e
46. ICRP (1996). Age-dependent Doses to Members of the Public from Intake of
Radionuclides: Part 4, Inhalation Dose Coefficients. In: ICRP Publication 71. Oxford:
Pergamon Press.
47. Leggett, R.W., Harrison, J.D (1995) Fractional absorption of ingested uranium in
humans. Health Phys., 68, 484-498.
48. Spncer, H., Osis, D., Isabel, M. (1990), Measured intake and excretion patterns of
naturally occurring 234U, 238U, and calcium in humans. Radiat. Res., 124, 90-95.
49. Pace, M. N., Mayes, M. A., Jardine, P. M., McKay, L. D., Yin, X. L., Mehlhorn, T. L.,
Liu, Q. and Gürleyük, H. (2007). Transport of Sr2+ and SrEDTA2- in partially-saturated
and heterogeneous sediments. Journal of Contaminant Hydrology 91, 267-287.
50. Hartman, M. J., Richie, V. S. and Rediker, J. A. (2009). Hanford site groundwater
monitoring for the fiscal year 2008. D. o. Energy. Richland, Washington (US).
51. Riley, R. G. and Zachara, J. M. (1992). Chemical contaminants on DOE lands and
selection of contaminant mixtures for subsurface science research. Other Information:
PBD: Apr Medium: ED; Size: 77 p.
52. Gongalsky, K. B.(2003). Impact of Pollution Caused by Uranium Production on Soil
Macrofauna, Environ. Monit. Assess. 89, 197–21.
53. IAEA, Environmental contamination from uranium production facilities and their
remediation, in: Proceedings of an International Workshop on Environmental
Contamination from Uranium Production Facilities and Their Remediation organized
by The International Atomic Energy Agency in Lisbon, February 11–13, 2004, Vienna,
2005, On line at: http://wwwpub. iaea.org/MTCD/publications/PDF/Pub1228 web.pdf.
54. IAEA, Manual of Acid In situ Leach Uranium Mining Technology, IAEATECDOC-
1239, Nuclear Fuel Cycle and Materials Section, IAEA-International Atomic Energy
Agency, Vienna, Austria, 2001.
160 | P a g e
55. IAEA, Technologies for the treatment of effluents from uranium mines, mills and
tailings, in: Proceedings of a Technical Committee Meeting Held in Vienna, November
1–4, 1999, IAEA-TECDOC-1296, Nuclear Fuel Cycle and Materials Section, IAEA-
International Atomic Energy Agency, Vienna, Austria, 2002.
56. IAEA, Non-technical Factors Impacting on the Decision Making Processes in
environmental Remediation, IAEA-International Atomic Energy Agency TECDOC-
1279, IAEA, Vienna, Austria, 2002.
57. Rivas, M. C., Interactions Between Soil Uranium Contamination and Fertilization
with N, P and S on the Uranium Content and Uptake of Corn, Sunflower and Beans,
and Soil Microbiological Parameters (Special Issue), Landbauforschung Völkenrode–
FAL Agricultural Research, Braunschweig, Germany, 2005.
58. IAEA, Status and Trends in Spent Fuel Reprocessing, Nuclear Fuel Cycle and
Materials Section International Atomic Energy Agency, IAEA-TECDOC-1467,
Vienna, 2005, On line at: http://www-pub.iaea.org/MTCD/publications/ PDF/te 1467
web.pdf.
59. M.K. Hill, Understanding Environmental Pollution: A primer, Cambridge University
Press, 2004.
60. Savchenko, V.K. (1996) The Ecology of the Chernobyl Catastrophe. Scientific
Outlines of An International Programme of Collaborative Research, Man and
Biosphere Series, vol. 16, Informa Health Care Publisher.
61. Gupta, C.K. (2003). Chemical Metallurgy: Principles and Practice, Wiley-VCH Verlag
GmbH & Co, KGaA, Weinheim.
62. Abdelouas, A., Lutze, W., Nuttall, H.E. (1999). Uranium contamination in the
subsurface: Characterization and remediation. In: Uranium: Mineralogy, Geochemistry
161 | P a g e
and the Environment (Eds. BURNS, P.C. and FINCH, R.). Reviews in Mineralogy, 38,
433-474.
63. Moss MA et al. (1983) Uranium in drinking water report on clinical studies in Nova
Scotia. In: Brown SS, Savory J, eds. Chemical toxicology and clinical chemistry of
metals. London, Academic Press, pp. 149–152
64. Hostetler S, Wischusen J, Jacobson G (1998) Groundwater quality in the Papunya-
Kintore region, Northern Territory. Canberra, Australian Geological Survey
Organisation.
65. Fitzgerald J et al. (1999) Groundwater quality in the Anangu Pitjantjatjara Lands,
South Australia. Canberra, Bureau of Rural Sciences.
66. Hakonson-Hayes AC, Fresquez PR, Whicker FW (2002) Assessing potential risks
from exposure to natural uranium in well water. Journal of Environmental
Radioactivity, 59, 29–40.
67. Frengstad B et al. (2000) The chemistry of Norwegian ground waters: III. The
distribution of trace elements in 476 crystalline bedrock ground waters, as analysed by
ICP–MS techniques. The Science of the Total Environment, 31, 21–40.
68. Kurttio P et al. (2002) Renal effects of uranium in drinking water. Environmental
Health Perspectives, 110, 337–342.
69. Kumar, A., Rout, S., Narayana, U., Mishra, M.K, Tripathi, R.M, Singh, J., Kumar, S.,
Kushwaha, H. S., (2011) Geochemical modeling of uranium speciation in the
subsurface aquatic environment of Punjab state in India. Journal of Geology and
Mining Research 3, 137–146.
70. Madden, A.S., Smith, A.C., Balkwill, D.L., Fagan, L.A., Phelps, T.J. (2007). Microbial
uranium immobilization independent of nitrate reduction. Environ. Microbiol. 9, 2321–
2330.
162 | P a g e
71. Williams, K.H., Bargar, J.R., Lloyd, J.R., Lovley, D.R. (2012). Bioremediation of
uranium contaminated groundwater: a systems approach to subsurface
biogeochemistry. Curr. Opin. Biotechnol. 24, 489–497
72. Wolf, S.F.(1999). Analytical methods for the determination of uranium in geological
and environmental materials. In: Uranium: Mineralogy, Geochemistry and the
Environment (Eds. BURNS, P.C., FINCH, R.). Reviews in Mineralogy, 38,. 623-651
73. Kumar, A., Usha, N., Sawant, P. D., Tripathi, R. M., Raj. S. Mishra, M, Rout, S.,
Supreeta, P., Singh, J., Kushwaha, H. S. (2011) Risk assessment for natural uranium in
subsurface water of Punjab State, India Hum. Ecol. Risk Assess., 17, 381– 393
74. Kumar, A., Tripathi, R. M., Rout, S., Mishra, M. K., Ravi, P.M, Ghosh, A. K. (2014).
Characterization of groundwater composition in. Punjab state with special emphasis on
uranium content, speciation and mobility. Radiochim. Acta; 102, 239–254.
75. Chapman, H. D. (1965) Cation exchange capacity. In Methods of Soil Analysis (Edited
by Black, C. A.) Part 2, pp. 891-901. Number 9 in the seriesAgronomy: Am. Inst.
Agronomy, Madison, Wisconsin.
76. Bower, C.A., Reitemeier, R.F. and Fireman, M. (1952) Exchangeable Cation Analysis
of Saline and Alkali Soils. Soil Science, 73, 251-261.
77. Breeuwsma A, Wosten JHM, Vleeshouwer JJ, Slobbe AM, Bouma J (1986) Derivation
of land qualities to assess environmental problems from soil surveys. Soil Sci Soc Am
J 50:186–190.
78. Himari EL, Pastor M., Dela Guardia A, M.: Determination of uranium in tap water by
ICP-MS. Fressenius’ J. Anal. Chem., 2000, 367, 151.
79. Monticelli, D., Ciceri, C., Dossi, C.: Optimization and validation of an automated
Voltammetric stripping technique for ultratrace metal analysis. Anal. Chim. Acta, 2007,
594, 192-198.
163 | P a g e
80. Gholivand, M.B., Rashidi, Nassab, H., Fazeli, H.(2005). Cathodic adsorptive stripping
Voltammetric determination of uranium (VI) complexed with 2,6-pyridinedicarboxylic
acid. Talanta, 65, 62-66.
81. Teterin Y. A., Kulakov V. M., Baev A. S., Nevzorov N. B., Melnikov I. V., Streltsov
V. A., Mashirov L. G., Suglobov D. N. and Zelenkov A. G., (1981). A study of
synthetic and natural uranium oxides by X-ray photoelectron spectroscopy. Phys.
Chem. Miner., 7, 151–158.
82. Drot R., Simoni E., Alnot M. and Ehrhardt J. J. (1998) Structural environment of
uranium (VI) and europium (III) species sorbed onto phosphate surfaces: XPS and
optical spectroscopy studies. J. Colloid Interf. Sci. 205, 410–416.
83. Froideval A., Del Nero M., Barillon R., Hommet J. and Mignot G. (2003) PH
dependence of uranyl retention in a quartz/solution system: an XPS study. J. Colloid
Interf. Sci. 266, 221–235.
84. Ilton E. S., Boily J. F. and Bagus P. S. (2007) Beam induced reduction of U(VI) during
X-ray photoelectron spectroscopy: The utility of the U 4f satellite structure for
identifying uranium oxidation states in mixed valence oxides. Surf. Sci. 601, 908–916.
85. Scott T. B., Allen G. C., Heard P. J. and Randell M. G. (2005) Reduction of U(VI) to
U(IV) on the surface of magnetite. Geochim. Cosmochim. Acta 69, 5639–5646.
86. Keller C. and Jorgensen C. K. (1975) Photoelectron spectra of uranium (V) in mixed
oxides showing characteristic satellite signals. Chem. Phys. Lett. 32, 397–400.
87. Bera S., Sali S. K., Sampath S., Narasimhan S. V. and Venugopal V. (1998) Oxidation
state of uranium: an XPS study of alkali and alkaline earth uranates. J. Nucl. Mater.
255, 26–33.
164 | P a g e
88. Santos B. G., Nesbitt H. W., Noe¨l J. J. and Shoesmith D. W. (2004) X-ray
photoelectron spectroscopy study of anodically oxidized SIMFUEL surfaces.
Electrochim. Acta 49, 1863–1873.
89. K.V. Kumar, S. Sivanesan (2007). Sorption isotherm for safranin onto rice husk:
comparison of linear and non-linear methods, Dyes Pigments 72, 130–133.
90. Ghiaci, M. Abbaspur, A. Kia, R., Seyedeyn A. F., (2004). Equilibrium isotherm
studies for the sorption of benzene, toluene, and phenol onto organo-zeolites and as-
synthesized MCM-41, Sep. Purif. Technol. 40, 217–229.
91. Limousin, G. Gaudet, J.P. L. Charlet, S. Szenknect, V. Barthes, Krimissa, M. (2007)
Sorption isotherms: a review on physical bases, modeling and measurement, Appl.
Geochem. 22 249–275.
92. Allen, S.J., Mckay, G., Porter, J.F. (2004) Adsorption isotherm models for basic dye
adsorption by peat in single and binary component systems, J. Colloid Interface Sci.
280, 322–333.
93. Malek, A. Farooq, S (1996) Comparison of isotherm models for hydrocarbon
adsorption on activated carbon, AIChE J. 42, 3191–3201.
94. Langmuir, I. (1916). The constitution and fundamental properties of solids and liquids,
J. Am. Chem. Soc. 38, 2221–2295.
95. Myers, A.L. Prausnitz, J.M. (1965). Thermodynamics of mixed gas adsorption,
AIChE J. 11, 121–129.
96. Dubinin, M.M., (1960). The potential theory of adsorption of gases and vapors for
adsorbents with energetically non-uniform surface, Chem. Rev. 60, 235–266.
97. Schultz M.K, Burnett W. C, Inn KGW (1998) Evaluation of a sequential extraction
method for determining actinide fractionation in soils and sediments. J Environ
Radioact 40:155–174.
165 | P a g e
98. Galceran, J., Companys, E., Puy, J., Cecilia, J and Garces, J.L. (2004). AGNES: a new
electroanalytical technique for measuring free metal ion concentration. Journal of
Electroanalytical Chemistry. 566: 95–109.
99. Salaun, P., Guenat, O., Berdondini, L., Buffle, J. and Koudelka-Hep, M. (2003).
Voltammetric microsystem for trace elements monitoring. Analytical Letters, 36:
1835–1849.
100. Zeng, H.H., Thompson, R.B., Maliwal, B.P., Fones, G.R., Moffett, J.W. and Fierke,
C.A. (2003). Real time determination of picomolar free Cu(II) in seawater using a
fluorescence based fiber optic biosensor. Analytical Chemistry. 75,6807–6812.
101. Wang J., Tian, B.M. and Wang, J.Y. (1998). Electrochemical flow sensor for in-situ
monitoring of total metal concentrations. Analytical Communications. 35, 241–243.
102. Sanzmedel, A. (1995). Beyond total element analysis of biological-systems with
atomic spectrometric techniques. Analyst. 120: 583, 763.
103. Yan, X.P. and Ni, Z.M. (2001). Speciation of metals and metalloids in biomolecules
by hyphenated techniques. Spectroscopy and Spectral Analysis. 21: 129–138.
104. Moldovan, M., Krupp, E.V., Holliday, A.E. and Donard, O. (2004). High resolution
sector field ICPMS and multicollector ICP-MS as tools for trace metal speciation in
environmental studies: a review. Journal of Analytical Atomic Spectrometry. 19: 815–
822.
105. Fytianos, K. (2001). Speciation analysis of heavy metals in natural waters: a review.
Journal of AOAC International. 84, 1763–1769.
106. Rubin, J. (1983). Transport of reacting solutes in porous-media: relation between
mathematical nature of problem formulation and chemical nature of reactions. Water
Resources Research. 19: 1231–1252.
166 | P a g e
107. Xue, H.B., Sigg, L. and Kari, F.G. (1995). Speciation of EDTA in natural waters:
exchange kinetics of Fe-EDTA in river water. Environmental Science & Technology.
29: 59–68.
108. Pohlmeier, A. and Knoche, W. (1996) Kinetics of the complexation of Al3þ with
amino acids, IDA and NTA. International Journal of Chemical Kinetics. 28, 125–136.
109. Nowack, B., Xue, H.B. and Sigg, L. (1997). Influence of natural and anthropogenic
ligands on metal transport during infiltration of river water to groundwater.
Environmental Science & Technology. 31, 866–872.
110. Brooks, S.C. (2005). Analysis of metal-chelating agent complexes by capillary
electrophoresis. In Nowack, B. and VanBriesen, J.M. (Eds), Biogeochemistry of
Chelating Agents. American Chemical Society, New York, pp. 121–138.
111. Echevarria G, Sheppard MI, Morel J L(2001) Effect of pH on the sorption of uranium
in soils. J. Environ. Radioact. 53, 257-264.
112. Ragnarsdottir KV, Charlet L (2000) In: Environmental Mineralogy. Cotter-Howells J,
Batchelder M, Valsami-Jones E (eds.) Uranium behavior in natural environments.
Mineral. Soc. of Great Britain and Ireland, London. p 333-377.
113. Kumar A, Rout S, Ghosh M, Singhal RK, Ravi PM (2013) Thermodynamic
parameters of U (VI) sorption onto soils in aquatic systems. Springer Plus, 2, 530-540.
114. Bachmaf S, Planer-Friedrich B, Merkel BJ (2008) Effect of sulfate, carbonate, and
phosphate on the uranium(VI) sorption behavior onto bentonite. Radiochim Acta. 96,
359-366.
115. Borovec. Z (1981). The adsorption of uranyl species by fine clay. Chem Geol. 32, 45–
58.
167 | P a g e
116. Catalano JG, Brown GE (2005) Uranyl adsorption onto montmoril-lonite: evaluation
of binding sites and carbonate complexation. Geochim Cosmochim Acta. 69, 2995-
3005.
117. Olguin MT, SolacheRios M, Acosta D, Bosch P, Bulbulian S (1997) UO22+ sorption
on bentonite. J Radioanal Nucl Chem. 218, 65–69.
118. Payne T. E, Davis J. A, Lumpkin G. R, Chisari R, Waite TD (2004) Surface
complexation model of uranyl sorption on Georgia kaolinite. Appl. Clay Sci. 26, 151–
162.
119. Foo K. Y, Hameed B. H (2010) Insights into the modeling of adsorption isotherm
systems, Chemical Engineering Journal. 156, 2–10.
120. Gunay A, Arslankaya E, Tosun I (2007) Lead removal from aqueous solution by
natural and pretreated clinoptilolite: adsorption equilibrium and kinetics. J. Hazard.
Mater. 146, 362–371.
121. Dabrowski, (2001) Adsorption—from theory to practice. Adv. Colloid Interface Sci.
93, 135–224.
122. Ho Y. S, McKay G., (1998) A comparison of chemisorption kinetic models applied
to pollutant removal on various sorbents. Trans. Inst. Chem. Eng. 76, 332-340.
123. H o YS. and McKay G. (1999) Comparative sorption kinetic studies of dyes and
aromatic compounds onto fly ash. J. Environ. Sci. Health A 34,1179-1204.
124. Ho YS and McKay G. (2000) The kinetics of sorption of divalent metal ions onto
sphagnum moss peat. Water Res.34, 735-742.
125. Weber W. J and Morris J. C (1962) Advances in water pollution research: removal of
biologically resistant pollutants from waste waters by adsorption. In Proceedings of
International Conference on Water Pollution Symposium.
168 | P a g e
126. Mall I. D, Srivastava V. C, Agarwal N. K, Mishra I. M (2005). Removal of Congo red
from aqueous solution by bagasse fly ash and activated carbon: Kinetic study and
equilibrium isotherm analyses. Chemosphere 61, 492–501.
127. Lenhrt J. J, Honeyman B. D (1999) Uranium(VI) sorption to hematite in the presence
of humic acid. Geochimica et Cosmochimica Acta, 63, 2891–2901
128. Guodong, S., Huaping, D., Runpu, S., Yimin, L. (2013) Microscopic insights into the
temperature-dependent adsorption of Eu(III) onto titanate nanotubes studied by FTIR,
XPS, XAFS and batch technique. Chemical Engineering Journal 217, 486–494.
129. Ozcan AS, Erdem B, Ozcan A (2005) Adsorption of Acid Blue 193 from aqueous
solutions onto BTMA-bentonite, Colloids Surf. A: Physicochem. Eng. Aspects 266,
73–81.
130. Hall K. R, Eagleton L. C, Acrivos A, Vermeulen T (1966) Pore-and solid-diffusion
kinetics in fixed-bed adsorption under constantpattern conditions. Ind Eng Chem
Fundam 5, 212–223
131. K. Bhattacharyya, A. Sharma, Kinetics and thermodynamics of Methylene Blue
adsorption on Neem (Azadirachta indica) leaf powder, Dyes Pigments 66 (2005) 51–
59.
132. Poot, V.J.P., McKay, G., Healy, J.J. (1978). Removal of basic dye from effluent
using wood as an adsorbent, Water Pollut. Control Fed. 50, 926–935.
133. Moyes L. N, Parkman R. H, Charnock J. M, Vaughan D. J, Livens F. R, Hughes CR,
Braithwaite A (2000). Uranium uptake from aqueous solution by interaction with
goethite, lepidocrocite, muscovite, and mackinawite: an X-ray absorption spectroscopy
study. Environ. Sci. Technol. 34,1062.
169 | P a g e
134. Dodge C. J., Francis A. J., Gillow J. B., Halada G.P., Eng C., Clayton C. R.,(2002)
Association of uranium with iron oxides typically formed on corroding steel surfaces.
Environ. Sci. Technol. 36, 3504.
135. Walter M, Arnold T, Reich T, Bernhard G (2003) Sorption of uranium (VI) onto
ferric oxides in sulfate-rich acid waters. Environ. Sci. Technol. 37, 2898.
136. Waite T D, Davis J. A, Payne T. E, Waychunas G. A, Xu N (1994) Uranium(VI)
Adsorption to Ferrihydrite: Application of a Surface Complexation Model Geochimica
et-Cosmochimica Acta., 24, 5465.
137. Glinka Y. D, Krak T. B, Belyak Y. N, Degoda V. Y, Ogenko V. M (1995) X-ray and
photo-luminophors based on SiO2–UO22+ adsorption systems. Colloid Surface A.104:
17.
138. Sylwester E. R., Hudson E. A, Allen PG (2000). The structure of uranium (VI)
sorption complexes on silica, alumina, and montmorillonite. Geochim. Cosmochim.
Acta. 64, 2431.
139. Yang S, Zhao D, Zhang H, Lu S, Chen L, Yu X (2010) Impact of environmental
conditions on the sorption behavior of Pb(II) in Na-bentonite suspensions. J Hazard
Mater 183:632–640.
140. Yang, S., Sheng, G., Tan, X., Hu, J., Du, J., Montavon, G., Wang X (2011a)
Determination of Ni(II) uptake mechanisms on mordenite surfaces: a combined
macroscopic and microscopic approach. Geochim Cosmochim Acta 75:6520–6534.
141. Hu B. W, Cheng W, Zhang H, Yang ST (2010) Solution chemistry effects on sorption
behavior of radionuclide 63Ni(II) in illite-water suspensions. J Nucl Mater 406, 263–
270.
142. Duff, M.C., Amrhein, C. (1996). U (VI) sorption on goethite and soil in carbonate
solutions, Soil. Sci. Soc. Am. J., 60, 1393-1400.
170 | P a g e
143. Fenton, B. R., Waite, T. D. (1996). A kinetic study of cation release from a mixed
mineral assemblage: implications for determination of uranium uptake. Radiochim.
Acta, 74, 251-256.
144. Koch-Steindl, H., Pr€ohl, G., (2001). Considerations on the behaviour of long-lived
radionuclides in the soil, Radiat. Environ. Biophys., 40, 93-104.
145. Echevarria, G., Sheppard, M.I., Morel, J.L., (2001). Effect of pH on the sorption of
uranium in soils. J. Environ. Radioact. 53, 257-264.
146. Langmuir, D., (1978). Uranium solution-mineral equilibria at low temperature with
applications to sedimentary ore deposits, Geochim. Cosmochim. Acta, 42, 547-569.
147. Rout, S, Ravi, P. M., Ajay Kumar & Raj Mangal Tripathi Equilibrium isotherm and
kinetics modeling of U(VI) adsorption by natural soil systems. J Radioanal Nucl Chem,
2014, 303, 2193-2203.
148. Shahandeh, H., Lee, J.H., Hossner, L.R., Loeppert, R.H., Bioavailability of uranium
and plutonium to plants in soil-water systems and the potential of phytoremediation. In:
Gobran, G., Wenzel, W., Lombi, E. (Eds.), Trace Elements in the Rhizosphere. CRC
Press, Florida, USA, 2001.
149. Filgueiras, A.V., Lavilla, I., Bendicho, C. (2002), Chemical sequential extraction for
metal partitioning in environmental samples, J. Environ. Monit., 4, 823-857.
150. Law, G.T.W. (2011). Uranium redox cycling in sediment and biomineral systems.
Geomicrobiol. J., 28, 497–506.
151. Ulrich, K.U. (2008) Dissolution of biogenic and synthetic UO2 under varied reducing
conditions. Environ. Sci. Technol., 42, 5600–5606.
171 | P a g e
152. Michael S. Massey, Juan S. Lezama-Pacheco, Joey M. Nelson, Scott Fendorf, and
Kate Maher (2014). Uranium Incorporation into Amorphous Silica. Environ. Sci.
Technol. 48, 8636−8644.
153. Zhong, L.R., (2005) Oxidative remobilization of biogenic uranium(IV) precipitates:
effects of iron (II) and pH. J. Environ. Qual., 34, 1763–1771.
154. Bruno, J., Pablo, J. de., Duro, L., Figueroa, E.(1995) Experimental study and
modeling of the U(VI)-Fe(OH)3 surface precipitation/ coprecipitation equilibrium,
Geochimica et Cosmochimica Acta.. Cosmochim. Acta 59, 4113–4123.
155. Spark, D.L. (1998). Kinetics and mechanism of chemical reactions at the soil
mineral/water interface, Soil Physical Chemistry, 2nd Eeds. 1998, CRC Press; Florida,
USA, 135–191.
156. Rout, S., Ravi, P. M., Ajay Kumar & Raj Mangal Tripathi (2014). Study on speciation
and salinity-induced mobility of uranium from soil. Environ Earth Sci, 74, 2273-2281.
157. Keller C. and Jorgensen C. K.( 1975). Photoelectron spectra of uranium (V) in mixed
oxides showing characteristic satellite signals. Chem. Phys. Lett. 32, 397–400.
158. Teterin Y. A., Kulakov V. M., Baev A. S., Nevzorov N. B., Melnikov I. V., Streltsov
V. A., Mashirov L. G., Suglobov D. N. and Zelenkov A. G. (1981). A study of
synthetic and natural uranium oxides by X-ray photoelectron spectroscopy. Phys.
Chem. Miner., 7, 151–158.
159. Bera S., Sali S. K., Sampath S., Narasimhan S. V. and Venugopal V.( 1998).
Oxidation state of uranium: an XPS study of alkali and alkaline earth uranates. J. Nucl.
Mater., 255, 26–33.
172 | P a g e
160. Van den Berghe S., Laval J. P., Gaudreau B., Terryn H. and Verwerft M. (2000).
XPS investigations on cesium uranates: mixed valency behaviour of uranium. J. Nucl.
Mater. 277, 28– 36.
161. Santos B. G., Nesbitt H. W., Noe¨l J. J. and Shoesmith D. W. (2004). X-ray
photoelectron spectroscopy study of anodically oxidized SIMFUEL surfaces.
Electrochim. Acta, 49, 1863–1873.
162. Ilton E. S., Boily J. F. and Bagus P. S. (2007). Beam induced reduction of U(VI)
during X-ray photoelectron spectroscopy: The utility of the U 4f satellite structure for
identifying uranium oxidation states in mixed valence oxides. Surf. Sci., 601, 908–916.
163. Zhou P, Gu B (2005) Extraction of oxidized and reduced forms of uranium from
contaminated soils: effects of carbonate concentration and pH. Environ. Sci. Technol.
39: 4435–4440.
164. Manceau A, Charle L, Boisset MC, Didier B, Spadini L (1992) Sorption and
speciation of heavy metals on hydrous Fe and Mn oxides from microscopic to
macroscopic. Appl. Clay Sci. 7: 201–223.
165. Dent A.J, Ramsay J.D.F, Swanton S. W. (1992). An EXAFS study of uranyl ion in
solution and sorbed onto silica and montmorillonite clay colloids. J. Colloid Interf. Sci.
150: 45–60.
166. Hennig C, Reich T, Dahn R, Scheidegger AM (2002) Structure of uranium sorption
complexes at montmorillonite edge sites. Radiochim.Acta 90, 653–657.
167. Moon, H. S., Johnkomlos and Jaffea, P., (2007). Uranium Reoxidation in Previously
Bioreduced Sediment by Dissolved Oxygen and Nitrate, Environ. Sci. Technol. 41,
4587-4596.
173 | P a g e
168. Karrie, A. W., Daniel, S., (2010) Nitrate stimulated oxidative dissolution of U(IV)
bearing minerals leading to U mobility in Nebraska groundwater, Report as of FY2010
for 2009NE183B: EPA
169. Pires, J.C.M., Martins, F.G., Alvim-Ferraz, M.C.M. Simões, M. (2011). Recent
developments in carbon capture and storage: an overview. Chem Eng Res Des, 89,
1446–1460
170. Albritton D. L, Meira Filho L. G. Climate Change 2001: The Scientific Basis;
Contribution of Working Group I tothe Third Assessment Report of the
Intergovernmental Panel on Climate Change––Technical Summary. Geneva:IPCC;
2001
171. Ganor J., Mogollon J.L., Lasaga A.C. (1995) The effect of pH on kaolinite dissolution
rates and on activation energy. Geochimica et Cosmochimica Acta, 66, 3913-3926.
172. Manoela Romanó de Orte, Aguasanta M. Sarmiento ,Maria Dolores Basallote, Araceli
Rodríguez-Romero, Inmaculada Riba, Angel delValls. (2014). Effects on the mobility
of metals from acidification caused by possible CO2 leakage from sub-seabed
geological formations.Science of The Total Environment. 470, 356–363.
173. Apps J.A., Zheng L., Spycher N, Birkholzer J.T, Kharaka Y, Thordsen J, (2011).
Transient changes in shallow groundwater chemistry during the MSU ZERT CO2
injection experiment. Energy Procedia;4, 3231.
174. Kharaka Y.K., Cole D. R., Hovorka S. D, Gunter W. D, Knauss K. G, Freifeld B. M.
(2006) Gas – water –rock interactions in Frio Formation following CO2 injection:
implications for the storage of greenhouse gases in sedimentary basins. Geology, 34,
577-588.


![V. SPECIATION A. Allopatric Speciation B. Parapatric Speciation (aka Local or Progenitor - Derivative) C. Adaptive Radiation D. Sympatric Speciation [Polyploidy]](https://img.pdfslide.us/doc/110x75/56649d3f5503460f94a186e2/v-speciation-a-allopatric-speciation-b-parapatric-speciation-aka-local.jpg)