Embed Size (px)
Citation preview

In Cooperation with our University Partners
Radiochemistry Webinars
Uranium Resources

Meet the Presenter… Dr. Lindsay Shuller-Nickles
Contact Information: [email protected]
Dr. Lindsay Shuller-Nickles is an Assistant Professor in Environmental Engineering and Earth Science at Clemson University. She teaches undergraduate courses on subjects of mineralogy, petrology, the nuclear fuel cycle, and nuclear waste management and graduate courses on nuclear environmental engineering, technical nuclear forensics, and applications of quantum-mechanical modeling in environmental science. She received her Ph.D. in Materials Science and Engineering from the University of Michigan working with Rod Ewing and Udo Becker. Dr. Shuller-Nickles’ research integrates computational and experimental tools to gain a fundamental understanding of the behavior of radionuclide-containing materials in the environment. She currently supports three undergraduate students, five graduate students, and one post-doc working on two funded projects. The first, funded by the Department of Homeland Security, supports her research in nuclear forensics of the characterization of pre- and post-detonation solid materials. The second is an EPSCoR Implementation grant, which funds Dr. Shuller-Nickles’ group as part of a much larger project (~$5M for three years). Her work on the EPSCoR grant is focused on quantum-mechanical calculations to understand cation ordering, waste loading, and phase stability for advanced ceramic waste forms.
2

Uranium Resources
Dr. Lindsay Shuller-Nickles
Clemson University
National Analytical Management Program (NAMP)
U.S. Department of Energy Carlsbad Field Office
TRAINING AND EDUCATION SUBCOMMITTEE
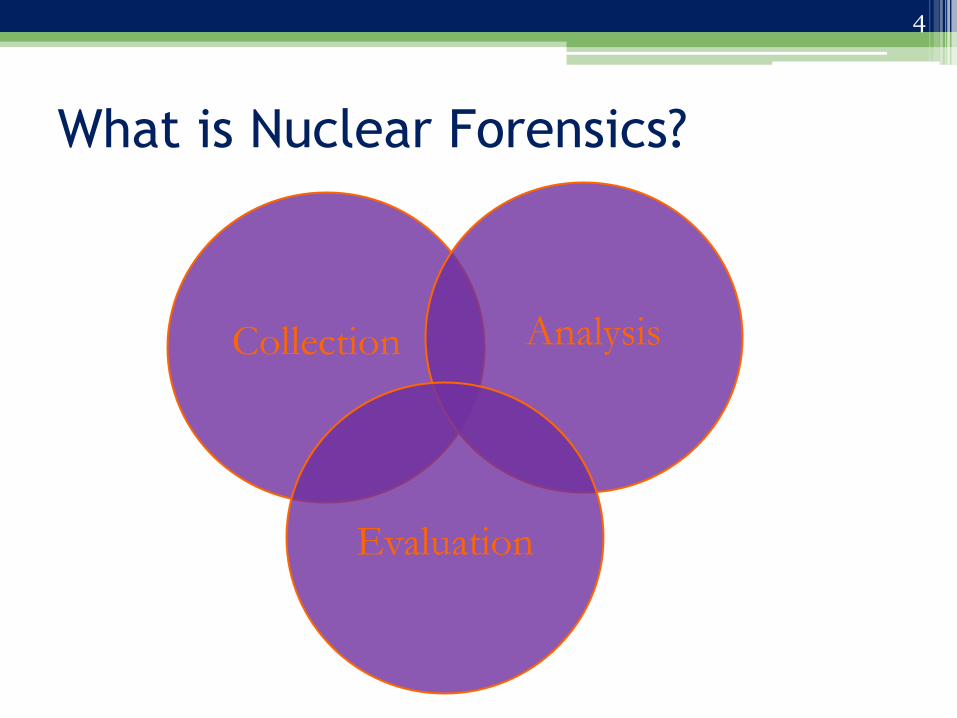
What is Nuclear Forensics?
Collection Analysis
Evaluation
4

Nuclear Forensics is …
• The collection, analysis, and evaluation of pre-detonation (intact) and post-detonation (exploded) radiological or nuclear material, devices, and debris, as well as the immediate effects created by a nuclear detonation.
- National Technical Nuclear Forensics Center (NTNFC)
5

President Barack Obama, National War
College, December 3, 2012
“There’s still much too much material — nuclear, chemical, biological — being stored without enough protection. There are still terrorists and criminal gangs doing everything they can to get their hands on it. And make no mistake, if they get it, they will use it; potentially killing hundreds of thousands of innocent people, perhaps triggering a global crisis.”
www.dhs.gov/national-technical-nuclear-forensics-center
6

What nuclear material is included?
• Focus today: Special Nuclear Material
• Others:
–Radiological material (medical isotopes, short/med-lived isotopes, sealed sources)
–Component materials (casings, containers)
–Associated materials (boosters, heavy water)
7

Special Nuclear Material is …
(1) plutonium, uranium enriched in the isotope 233 or in the isotope 235, and any other material which the Commission, pursuant to the provisions of section 51, determines to be special nuclear material, but does not include source material; or (2) any material artificially enriched by any of the foregoing, but does not include source material.
Source material is…(1) Uranium or thorium, or any combination thereof, in any physical or chemical form or (2) ores which contain by weight one-twentieth of one percent (0.05%) or more of: (i) Uranium, (ii) thorium or (iii) any combination thereof. Source material does not include special nuclear material.
Title 1; Atomic Energy Act of 1954
http://www.nrc.gov/reading-rm/doc-collections/cfr/part040/part040-0004.html
8

Why do we care about SNM?
Approximate Critical Masses of SNM
Material Bare, Isolated
Sphere (kg)
Fully Tamped
(Reflected) Sphere (kg)
235U 52 17
239Pu 10-16 4-6
233U 15 6
Nuclear Forensics Analysis Moody, Hutcheon, and Grant https://en.wikipedia.org/wiki/Gun-type_fission_weapon#/media/File:Fission_bomb_assembly_methods.svg
9

Nuclear
Fuel
Cycle
Nuclear Power Reactor
Interim Storage (Wet pool and
dry cask storage)
Geologic repository
Mining and Milling
Enrichment and Fuel Fabrication
Reprocessing
Where does SNM come from?
10

Nuclear
Fuel
Cycle
Nuclear Power Reactor
Interim Storage (Wet pool and
dry cask storage)
Geologic repository
Reprocessing
Where does SNM come from?
uraninite; betafite; U –rich ore
U3O8 to purified
U3O8/UF6 to UO2
UO2 UO2 + FP and AP
UO2 + FP and AP
Separated U and Pu
11

Nuclear
Fuel
Cycle
Nuclear Power Reactor
Interim Storage (Wet pool and
dry cask storage)
Geologic repository
Reprocessing
Where does SNM come from?
0.72% 235U
U3O8 to purified
U3O8/UF6 to UO2
UO2 UO2 + FP and AP
UO2 + FP and AP
Separated U and Pu
3-5% 235U
3-5% 235U
12

U and Th mineral evolution I. Phase I – concentration of U and Th from
uniform trace distribution to enriched magmatic fluids
II. Phase II – detrital Th-bearing uraninite and abiotic alteration
RE
DU
CIN
G
OX
IDIZ
ING
Hazen et al. 2009
13

Phase II Activity – Abiotic Alteration
How might U (and Th) minerals can alter in reducing environments?
1. Radioactive decay 238U 206Pb
Abiotic alteration leads to formation of Pb-uranyl secondary minerals.
5 mm
Hazen et al. 2009
14
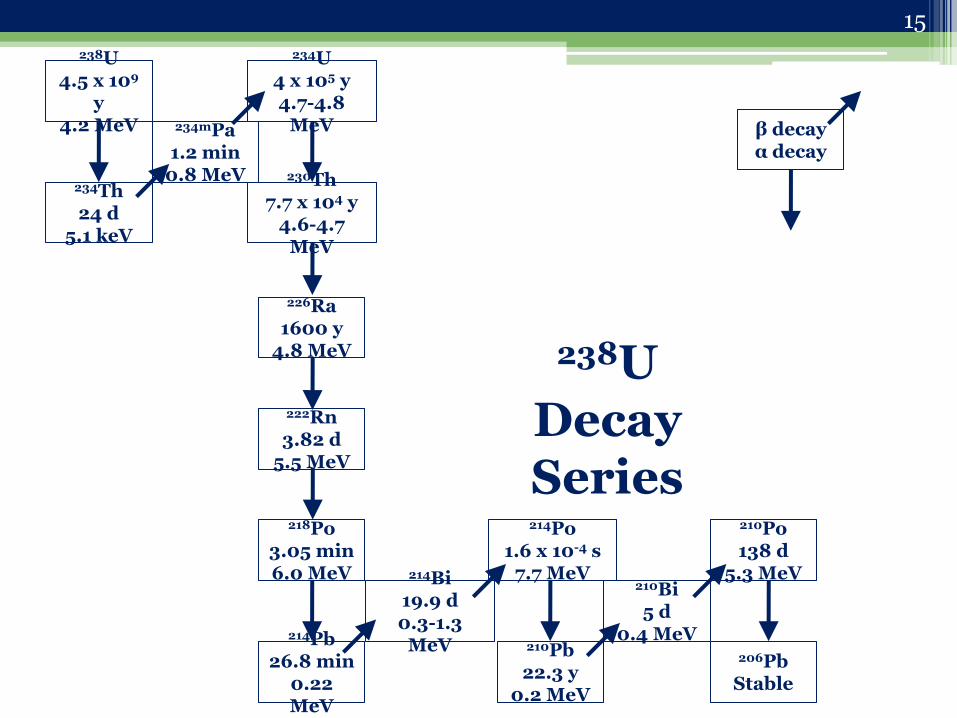
238U 4.5 x 10⁹
y 4.2 MeV 234mPa
1.2 min 0.8 MeV
234Th 24 d
5.1 keV
234U 4 x 10⁵ y 4.7-4.8
MeV
230Th 7.7 x 10⁴ y
4.6-4.7 MeV
226Ra 1600 y
4.8 MeV
222Rn 3.82 d
5.5 MeV
218Po 3.05 min 6.0 MeV 214Bi
19.9 d 0.3-1.3
MeV 214Pb
26.8 min 0.22 MeV
214Po 1.6 x 10⁻⁴ s
7.7 MeV
210Pb 22.3 y
0.2 MeV
210Bi 5 d
0.4 MeV
210Po 138 d
5.3 MeV
206Pb Stable
β decay α decay
238U Decay Series
15

Phase II Activity – Abiotic Alteration
How might U (and Th) minerals can alter in reducing environments?
1. Radioactive decay 238U 206Pb
U4+ Pb2+
2U4+ Pb2+ + U6+
2U4+ Pb4+ + U4+ Pb2+ + U6+
Abiotic alteration leads to formation of Pb-uranyl secondary minerals.
5 mm
Hazen et al. 2009.
16

Phase II Activity – Abiotic Alteration
How might U (and Th) minerals can alter in reducing environments?
2. Radiolysis of thin films of water at the mineral surface causes formation of hydrogen peroxide.
uraninite + hydrogen peroxide studtite
UO2 + 2H2O2 UO2O2(H2O)2
Hazen et al. 2009.; www.irocks.com
Studtite with fourmarierite on uranophane and uraninite from Shinkolobwe Mine, Katanga, Democratic Republic of Congo
17
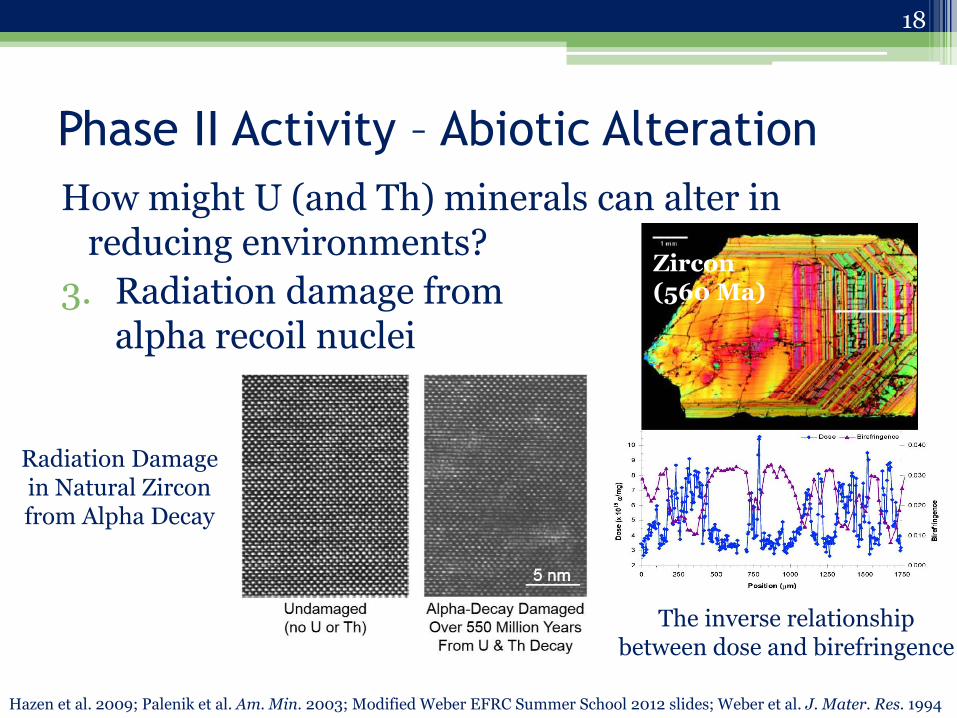
Phase II Activity – Abiotic Alteration
How might U (and Th) minerals can alter in reducing environments?
3. Radiation damage from alpha recoil nuclei
Hazen et al. 2009; Palenik et al. Am. Min. 2003; Modified Weber EFRC Summer School 2012 slides; Weber et al. J. Mater. Res. 1994
The inverse relationship between dose and birefringence
Zircon (560 Ma)
Radiation Damage in Natural Zircon from Alpha Decay
18

U and Th mineral evolution I. Phase I – concentration of U and Th from
uniform trace distribution to enriched magmatic fluids
II. Phase II – detrital Th-bearing uraninite and abiotic alteration
III. Phase III – result of the Great Oxidation Event (GOE) and biological processes
IV. Phase IV – rise of land plants U(VI) in near-surface waters reduce and precipitate due to organic-rich continental sediments
RE
DU
CIN
G
OX
IDIZ
ING
Hazen et al. 2009
19

U and Th mineralogy – deposits
• Magmatic (igneous fluids)
• Detrital (sedimentary conglomerates)
• Hydrothermal (e.g., vein-type)
Uraninite crystal with feldspar from the Swamp Mine, Maine.
1 mm
U4+ minerals form roll front type ore deposits when they come into contact with reducing, organic material in terrestrial sediments.
1 m
Dec
rea
sin
g
Th
co
nce
ntr
ati
on
Hazen et al. 2009.
20
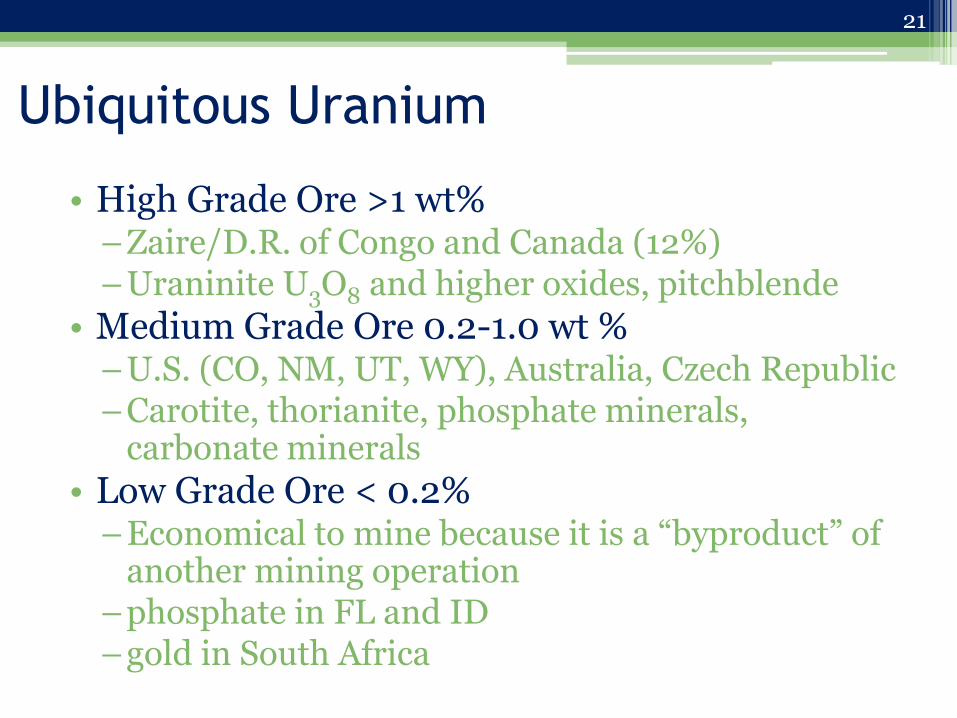
Ubiquitous Uranium
• High Grade Ore >1 wt% –Zaire/D.R. of Congo and Canada (12%) –Uraninite U3O8 and higher oxides, pitchblende
• Medium Grade Ore 0.2-1.0 wt % –U.S. (CO, NM, UT, WY), Australia, Czech Republic –Carotite, thorianite, phosphate minerals,
carbonate minerals
• Low Grade Ore < 0.2% –Economical to mine because it is a “byproduct” of
another mining operation –phosphate in FL and ID –gold in South Africa
21

Uranium Concentrations from Aerial
Gamma-Ray Data
http://energy.cr.usgs.gov/radon/dds-9.html
22

Thorium Concentrations from Aerial
Gamma-Ray Data
http://energy.cr.usgs.gov/radon/dds-9.html
23

Identified Uranium Resources (t U)
RAR+Inferred, Cost range < $130/kg U, 1/1/2013 (OECD 2014)
www.wise-uranium.org
24
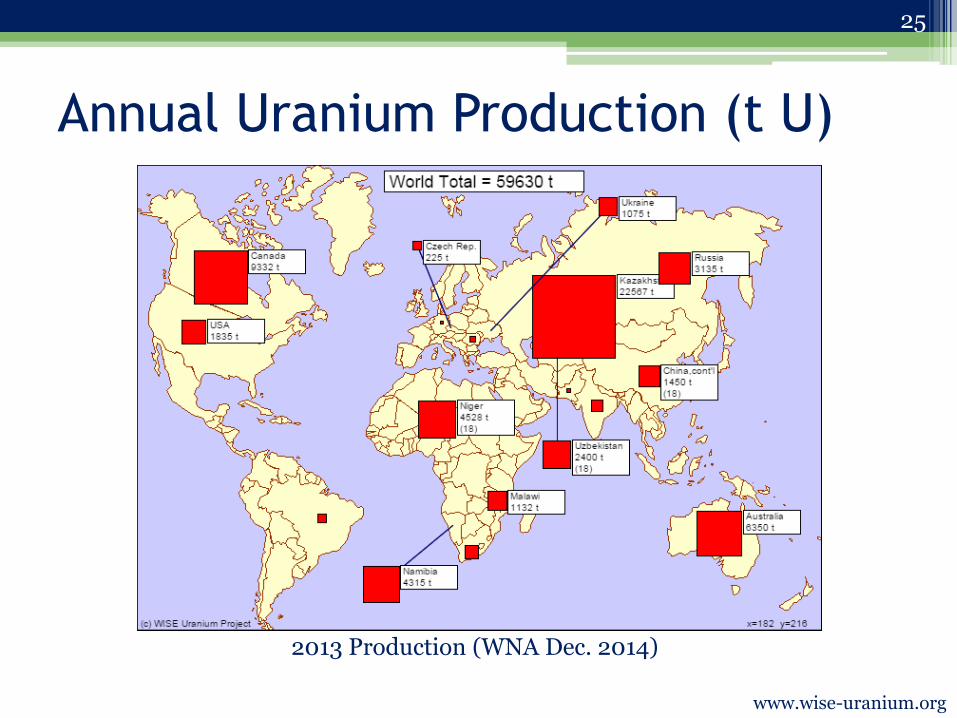
Annual Uranium Production (t U)
2013 Production (WNA Dec. 2014)
www.wise-uranium.org
25

Reasonably Assured Resources plus Inferred Resources, to US$ 130/kg U, 1/1/07, from OECD NEA & IAEA, Uranium 2011: Resources, Production and Demand ("Red Book").
0
5
10
15
20
25
30
35
40Known recoverableresources
2012 production
http://www.world-nuclear.org/info/inf23.html
26

2013 Uranium Production vs.
Requirements Balance [t U] (WNA 2014,
OECD 2014)
27

Ubiquitous Uranium
Shinkolobwe – Midnight Miners
28

Ubiquitous Uranium
Shinkolobwe – Midnight Miners
“Shinkolobwe had been a menace for years. The mine shafts were sealed tight with concrete plugs when the Congo became an independent nation
more than four decades ago. Yet local miners had been sneaking into the pit to dig out its
radioactive contents and sell them on the black market. The birthplace of the first atomic bomb
was still bleeding uranium, and nobody was certain where it was going.”
Uranium by Tom Zoellner
29

For what purpose is the U being mined?
• Energy – What type of reactor?
• CANDU – natural U (0.711% U-235) • LWR – low enriched U (3-5% U-235)
• Research
– What type of reactor? • Fuel/targets range from LEU (< 20% U-235) to HEU > 90% U-
235
• Weapons
– What type of weapon? • U weapon – weapons grade (> 90% U-235) • Pu weapon – ranges (natural is best), Pu produced in a reactor
from U fuel
30

Pathways to HEU
• Enrich natural or LEU to HEU
• Global inventory of HEU
http://www.nti.org/gmap/other_maps/heu/#
31

http://www.ucil.gov.in/web/jaduguda_mill.html
Yellow Cake • Milling process leaves 70-90%
U3O8 with impurities (e.g., B, Cd, Cl, REE)
• Yellow cake may be in the form of ammonium-diuranate or sodium-diuranate
32
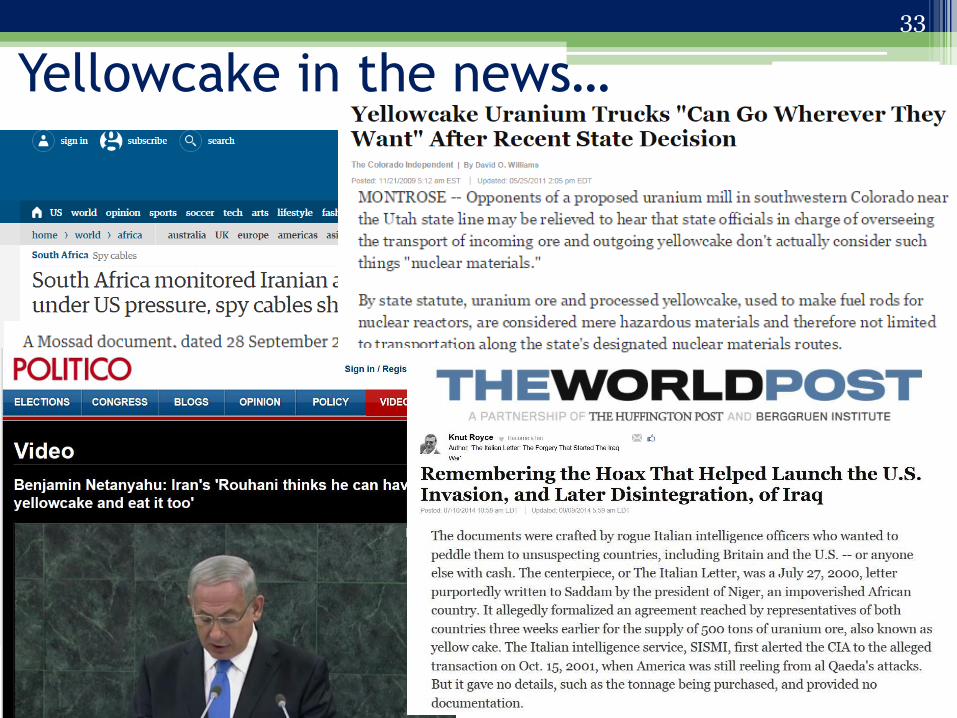
Yellowcake in the news…
33

World Primary Conversion capacity World Nuclear Association Nuclear Fuel Report 2013 & 2015
Company Nameplate capacity (tonnes U/yr as UF6)
Approx capacity utilisation 2015
Capacity utilisation 2015, tU/yr
Cameco, Port Hope, Ont, Canada
12,500 70% 8750
Springfields Fuels, UK (closed August 2014) 0% 0
TVEL at Siberian Chemical Combine,
Seversk, Russia 12,500 100% assumed 12,500
Comurhex (Areva), Malvesi (UF4) &
Tricastin (UF6), France 15,000 70% 10,500
Converdyn, Metropolis, USA
15,000 70% 10,500
CNNC, Lanzhou, China 4000 unknown 4000
IPEN, Brazil 100 70% 70
World Total 59,100 46,320
http://www.world-nuclear.org/info/Nuclear-Fuel-Cycle/Conversion-Enrichment-and-Fabrication/Conversion-and-Deconversion/
34

Conversion to UF6: Why UF6?
• Only 19F isotope
• Gas at moderate T
• Handled at reasonable T and P as a solid
• Water soluble
Methods for conversion:
• Wet solvent extraction process
• Dry hydrofluor process
35

Enrichment
36

World enrichment capacity – operational
and planned (thousand SWU/yr)
Source: World Nuclear Association Nuclear Fuel Report 2013 & 2105, information paper on China's Nuclear Fuel
Cycle, Areva 2014 Reference Document for most 2013 figures.
'Other' includes Resende in Brazil, Rattehallib in India and Natanz in Iran. At end of 2012 Iran had about 9000
SWU/yr capacity operating, according to ISIS and other estimates.
The Euratom Supply Agency Annual Report 2014 estimated world nameplate capacity at 56 million SWU, Russia
28 million SWU, Urenco 18.1 million SWU and Areva 7.5 million SWU.
2013 France
Germany/Netherlands/UKJapan
US
Russia
China
Other
2015
37

Enrichment calculations
• Iran’s Fordow enrichment facility in Qom has been quoted to contain 3000 P2 centrifuges with an annual SWU capacity ranging from 2-5 SWU per centrifuge.
• Prior to the Iran Nuclear Deal, it was possible for LEU from the Natanz enrichment facility to be further enriched at the Fordow facility.
• Using the SWU calculator, we can see how long it would take to convert 3.5% enriched UF6 to 90% UF6 depending on the quality of the centrifuges used.
38
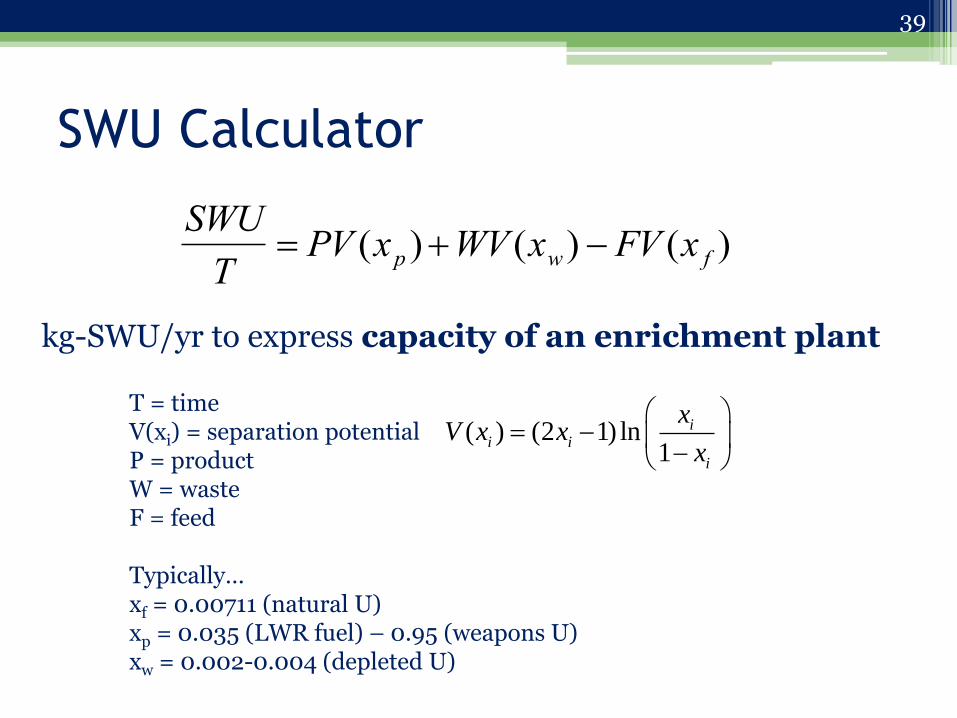
SWU Calculator
SWU
T PV (xp )WV (xw) FV (x f )
kg-SWU/yr to express capacity of an enrichment plant
T = time V(xi) = separation potential P = product W = waste F = feed Typically… xf = 0.00711 (natural U) xp = 0.035 (LWR fuel) – 0.95 (weapons U) xw = 0.002-0.004 (depleted U)
( ) (2 1) ln1
ii i
i
xV x x
x
39

SWU Calculator
What do we know?
• Starting enrichment (xf) = 3.5%
• Final enrichment (xp) = 90%
• Assume depletion (xw) = 1%
• Final product (P) = 29.7 kg of UF6 (20 kg U)
• Basic equations:
• Feed (F) = Product (P) + Waste (W)
• xfF = xpP + xwW
40

SWU Calculator
F 1057.3
P 29.7
W 1027.6
xf 0.035
xp 0.90
xw 0.01
SWU 1418.4 Facility 3000
yr 0.47 weeks 24.59
d 172.69
If centrifuges operate at: • 0.5 SWU/yr, t = 345.38 d
• 3.0 SWU/yr, t = 57.56 d
41

A few interesting articles…
• K. Yost, “Opinion: The Real Danger of Qom” The Tech Online Edition 129(44) 10/13/2009. http://tech.mit.edu/V129/N44/yost.html
• J. Bernstein, “The Simple Math of an Iranian Nuclear Bomb” Tablet 10/2/2014. http://www.tabletmag.com/jewish-news-and-politics/183851/nuclear-iran-bernstein
42

Nuclear Fission
Reactors
Fission
Activation
43

238U Fuel Cycle Pu-isotopes
Fission w/ thermal cross-section (barns)
β-decay w/ half-lives
(n,γ)-reaction w/ thermal cross-section
44

How much Pu is produced in a reactor?
, ,i
i i f ji a ji k k i a i i i
dnn n n n n E
dt
ni = atom density of nuclide i
t = time
γi = fission yield for nuclide i
σf = fission cross-section
σa = absorption/capture cross-section
Φ = neutron flux
λ = decay constant
E = escape term
i = nuclide of interest
j = nuclide that can transmute to nuclide i
k = nuclide that can decay to nuclide i
Rate of
radionuclide
production
Production by fission
+ absorption
+ decay of parent
Loss by
absorption +
decay + escape
= -
45

How much Pu is produced in a reactor?
, ,i
i i f ji a ji k k i a i i i
dnn n n n n E
dt
Rate of
radionuclide
production
Production by fission
+ absorption
+ decay of parent
Loss by
absorption +
decay + escape
= -
238U (n,γ) 239U 𝛽 239Np
𝛽 239Pu
46

How much Pu is produced in a reactor?
Some assumptions
• Neglect 238U, 239Pu decay
• After 2-3 weeks for 1 year irradiation, rate of production/loss of 239U and 239Np are equal.
• Neglect 238U burn-up.
Some parameters
• Irradiation time, t = 1 yr
• Neutron flux, Φ = 4.0 x 10¹³ neutrons/cm2s
• Capture cross section, = 2.1 barns
• Absorption cross section, = 600 barns
• 90 tons of uranium (3 wt. % 235U)
239238 ,238 239 ,239
PuU c U Pu a Pu
dnn n
dt
,239a Pu,238c U
47

How much Pu is produced in a reactor?
n239Pu = 148 kg
• 70 t Pu produced globally/yr
Moody, Grant, Hutcheon Nuclear Forensic Analysis 2015
http://www.world-nuclear.org/info/nuclear-fuel-cycle/fuel-recycling/plutonium/#Notes
48

Nuclear
Fuel
Cycle
Nuclear Power Reactor
Interim Storage (Wet pool and
dry cask storage)
Geologic repository
Mining and Milling
Enrichment and Fuel Fabrication
Reprocessing
Where does SNM come from?
49

Uranium Forensics Case Study
• June 2003
• ITU received 4 uranium pellets from Lithuania
• All had same geometry
– Central hole
– Dished
• Are these pellets UO2?
• What enrichment?
• Where are they from?
Wallenius, Mayer, Ray Forensics Science International (2006)
50

Uranium Forensics Case Study
• Pellet dimensions
• 2% 235U enrichment
• UO2
• 12.6 ± 0.8 years (as of 16.06.2003) – Produced in end of 1990
– 234U/230Th chronometer
51

Uranium Forensics Case Study
• Pellet dimensions
• 2% 235U enrichment
• 12.6 ± 0.8 years (as of 16.06.2003)
– Produced in end of 1990
– 234U/230Th chronometer
• Impurities
RBMK-1500 (Russian type water-cooled, graphite-moderated reactor)
MZ Electrostal (Moscow, Russia)
Ignalina Unit 2 (Lithuania) Started Aug. 1987
Elem. Conc. (μg/g U) Elem. Conc. (μg/g U) Al 6.08 + 0.73 Mg 4.71 + 0.57 Ca 18.4 + 2.2 Mn 1.13 + 0.14 Cr 6.12 + 0.73 Na 17.9 + 2.1 Cu 1.80 + 0.22 Ni 5.14 + 0.62 Fe 91.9 + 7.4 Zn 3.40 + 0.41 K 44.7 + 3.6
52
References • www.dhs.gov/national-technical-nuclear-forensics-center
• http://www.nrc.gov/reading-rm/doc-collections/cfr/part040/part040-0004.html
• Nuclear Forensics Analysis Moody, Hutcheon, and Grant
• Hazen et al. 2009
• www.irocks.com
• Palenik et al. Am. Min. 2003
• Modified Weber EFRC Summer School 2012 slides
• Weber et al. J. Mater. Res. 1994
• http://energy.cr.usgs.gov/radon/dds-9.html
• www.wise-uranium.org
• http://www.world-nuclear.org/info/inf23.html
• Uranium Tom Zoellner
• http://www.nti.org/gmap/other_maps/heu/#
• http://www.ucil.gov.in/web/jaduguda_mill.html
• World Nuclear Association Nuclear Fuel Report 2013 & 2105
• K. Yost, “Opinion: The Real Danger of Qom” The Tech Online Edition 129(44) 10/13/2009.
http://tech.mit.edu/V129/N44/yost.html
• J. Bernstein, “The Simple Math of an Iranian Nuclear Bomb” Tablet 10/2/2014.
http://www.tabletmag.com/jewish-news-and-politics/183851/nuclear-iran-bernstein
• Wallenius, Mayer, Ray Forensics Science International (2006)
53

Upcoming Webinars
• Nuclear Materials Analysis — Physical and Spectroscopic Methods
• Sample Matrices and Collection, Sample Preparation
• Nuclear Materials Analysis — Physical and Spectroscopic Methods
NAMP website: www.wipp.energy.gov/namp