Embed Size (px)
Citation preview

Preliminary
Please do not cite without authors’ permission
Migration and Remittances Household Surveys in Sub-
Saharan Africa: Methodological Aspects and Main Findings
March 31, 2011
Sonia Plaza, Mario Navarrete, and Dilip Ratha*
Abstract
Important documentation related to the Migration and Remittances Household Surveys—
including the project report, methodological specifications, and anonymized microdata—have
recently been made available to the research community and to policy makers (see the World
Bank website). The purpose of this paper is to describe the surveys’ data sources, content,
methodological underpinnings, and the way the fieldwork and data cleaning were carried out.
Some preliminary results will be presented so as to underscore the potential these surveys afford
to researchers everywhere.
Keywords: Migration and Remittances Household Surveys, Sub-Saharan Africa, International
migration,InternalMigration, Remittances, Development, Poverty reduction
______________________________________________________________________________ * This background paper—a product of the joint Migration and Remittances Unit of the Development Economics Vice
Presidency (DEC), and Poverty Reduction and Economic Management Network (PREM)—was prepared as part of
the Africa Migration Project. The findings from the surveys are background material for a joint regional report of the
African Development Bank and World Bank titled ―Leveraging Migration in Africa: Remittances, Skills, and
Investments Migration, Remittances and Development in Africa‖ (released in March 2011).

2
Acknowledgments
The Africa Migration and Remittances household surveys were managed by Sonia Plaza under
the direction of Dilip Ratha. The following individuals and organizations contributed to the
implementation of surveys: Mario Navarrete (Sistemas Integrales, Chile), Professor Richard E.
Bilsborrow (Carolina Population Center, University of North Carolina) and Richard Adams
(consultant, World Bank). The household surveys were conducted by the following principal
researchers: Professor Yiriyibin Bambio, Universite de Ouagadougou (Burkina Faso); Rose
Ngugi, University of Nairobi, School of Economics (Kenya); Chukuwuma Agu (Nigeria), Zibah
Consults Limited; Professor Fatou Cisse, Consortium pour la Recheche Economique et Sociale
(Senegal), Innocent Matshe (Senior Research Specialist), Human Sciences Research Council,
(South Africa); E.S.K. Muwanga-Zake and Alex Ntale, Makerere Statistical Consults Limited,
(Uganda).
Colleagues in the Migration and Remittances Unit, Adriana Castaldo, Ani Silwal, Carly Petracco,
Farai Jena, Jacqueline Irving, Neil Ruiz, and Zhimei Xu provided useful inputs, analysis and
research assistance at various stages. Special thanks to Sanket Mohapatra for extensive
consultations. Olivier Dupriez, Akiko Sagesaka, Mehmood Asghar, Matthew John Welch and
Tefera Bekele Degefu provided support for the survey catalogue.

3
1. Introduction
As part of the Africa Migration Project, six Migration and Remittances Household Surveys were
conducted in Burkina Faso, Kenya, Nigeria, Senegal, South Africa, and Uganda. The project has
received financial support from the African Development Bank (AfDB), Canadian International
Development Agency (CIDA), Department of International Development (DFID),International
Fund for Agricultural Development (IFAD), Ministry of Foreign Affairs of Denmark, French
Ministry of Immigration, Integration, National Identity and Development Partnership , and the
Swedish International Development Agency (SIDA). The surveys used a standardized
methodology developed by the World Bank and were conducted by primarily country-based
researchers and institutions during 2009 and 2010. They covered recent migration and remittance
trends, housing conditions, household assets and expenditures, use of financial services, internal
and international migration and remittances from former and nonformer household members,
(that is, individuals who regularly send remittances but have not been part of the current
household) and return migration patterns. Collectively, these surveys provide unique data and a
new research methodology for collecting information on migration and remittances in Sub-
Saharan Africa.
A unique feature of these surveys is that they allow for comparison across countries. Since the
surveys were implemented during the same period, they provide us with a good picture of
regional migration and remittances, at the household level, in the six countries surveyed.
This paper describes the design of the six African Migration and Remittances Household
Surveys and reports preliminary findings on migration and remittances, labor force activity,
return migration, the education of migrants, and other topics.

4
2. Overview of the African Migration and Remittances
Household Surveys
Despite its importance, migration remains a topic on which available data are relatively weak or
not available (Thorogood 2005, World Bank 2005). The national statistical institutions of many
African countries fail to provide accurate statistics on migration. Some countries collect
migration data in their censuses, living standards measurement studies, demographic and
household surveys, and labor force surveys. According to Carletto and de Braw (2008), there are
two types of household surveys that collect migration data: specialized surveys and general-
purpose surveys (such as the Living Standards Measurement Study). Specialized surveys are
particularly helpful in obtaining information on the characteristics of migrants.
Though data on migration and remittances have been captured in Sub-Saharan countries
through these two types of surveys, there is no consistent database tracking migrant populations
or flows in Sub-Saharan countries. As a preparation for the African Migration and Remittances
Household Surveys, the authors reviewed about 70 household surveys conducted between 1990
and 2006 that were available through the World Bank’s Development Data Platform (DDP)
microdata catalogue (see box 2.1). Some issues—for example, constraints on migration—were
not adequately addressed in most of the surveys reviewed. Several surveys did not ask questions
about the channels through which remittances were transferred and some did not even provide
any information on migration or remittances.
Box 2.1 Migration and remittances in African household surveys
In a review of 70 household surveys conducted between 1990 and 2006, researchers found that migration and
remittances data are spread across various sections of most surveys and are rarely linked to one another. The main
findings are as follows:
1) Migration modules are sometimes found in a separate section (for example, Cameroon, 2004; Gambia, 1992;
Guinea, 1994; Mali, 1994; Rwanda, 1998; and Uganda, 1993). In other cases the topic of migration is appended to
other modules, such as literacy (Burkina Faso, 1998), education (Ivory Coast, 1998), and employment (Senegal,
1991).
2) Most surveys collect data on the migration history of all household members above a certain age (typically 10 or
15 years); however, some collect information on the migration history of the household head only.
3) Most surveys collect data on the migration of household members since birth but some limit the inquiry to
migratory movements during the preceding one year. Remittances are captured as part of income and expenditures
modules, but many of the surveys do not distinguish between remittances and gifts (or other transfers) received by
the households.
5
The objective of the World Bank surveys was to achieve a better understanding of the
characteristics of migrants in sending countries and thereby help inform national policy makers
of migration and remittances motives, channels, and impacts. The collection of migration and
remittance data through these surveys addresses serious gaps in knowledge of the motives for
migration, the estimated remittances sent through formal and informal channels, the remittances
sent by former and nonformer household members, and return migration.
Migrant household surveys present a methodological challenge, especially for Sub-Saharan
African countries. Conducting a survey in six countries is a challenge. In measuring international
migration, researchers must set up a good sample framework and develop a way to handle the
large sample size and the complexity of the survey itself. Of the six countries surveyed, South
Africa was the only predominantly immigrant-receiving country, with a large presence of
immigrants from various parts of Africa. The other five, predominantly migrant-sending
countries surveyed were Burkina Faso, Senegal, Nigeria, Uganda, and Kenya.
Given a previous lack of information on the surveys’ topics, the design called for
representative samples of households in each country to capture a series of information on
migration and remittances. Four key elements of the design were the inclusion of questions on: (i)
informal channels that included remittances sent through visiting friends and relatives or carried
by the migrants themselves; (ii) the characteristics, remittances sent, and migration motives of
former household and nonhousehold members; (iii) return migration; (iv) internal, intraregional,
and international migration.
We hope that these surveys will shed light on many aspects of migration and remittance
behavior and further their analysis along dimensions of gender, motive, educational
characteristics, labor force participation, and access to finance.

6
3. Basic survey features
3.1 Survey type
A single-round, cross-sectional survey was implemented as part of the project in six countries.
This captured information about households with internal migrants, international migrants, and
no migrants.
The survey instrument and its component parts
The survey instrument obtained information on a variety of demographic, social, and economic
characteristics, such as education, marriage status, housing conditions, labor force participation,
skills, languages, and access to finance. The standardized questionnaire includes seven modules
that focus on the following: (i) household roster, (ii) housing conditions, (iii) household assets
and expenditure, (iv) household use of financial services, (v) internal and international migration
and remittances from former household members, (vi) internal and international migration and
remittances from nonhousehold members, and (vii) return migration.
Module 1. This module includes a series of questions on the household. Data collected
include the number of household members and their country of birth, year of birth, age, sex,
education, place of residence, marital status, language, and religion—and their parents’
country of birth, age, citizenship, and place of residence.
A technical workshop that took place in June 2009 recommended taking into
consideration the fact that different members of a household have different responsibilities.
The interviewer, therefore, lists all persons who usually live and eat together in the household.
Module 2. The main purpose of the housing conditions section is to collect information on
characteristics of the household members’ dwelling, including its ownership.
Module 3. This module records information on household assets, household expenditures,
and the purchase prices of several staples, goods, and services.
Module 4. This small module contains questions on financial usage and access.
Module 5. This covers migration information—current place of residence, reasons for
moving, education level of the migrant, employment situation (pre- and postmigration),
demographic characteristics, remittances behavior, channels for sending remittances,
amounts sent, and so on.

7
Most migration in Africa is rural-to-urban and intraregional. The survey contains
information on three places of residence: birthplace (from the household roster), the current
place of residence, and the previous place of residence (in the migration module). For some
respondents these places will coincide.
Module 6. This collects migration information on nonformer household members, including
their current place of residence, reasons for moving, education level, employment situation
(pre- and postmigration), demographic characteristics, remittance behaviors, channels for
sending remittances, amounts sent, and so on.
Module 7. This module captures data on return migration. A return migrant was defined as an
adult member (over 18 years old) currently living in the household, who had lived in another
country or another place in Uganda for at least 3 months in the 5 years preceding the survey.
The information sought in this section related to the last migration episode for each return
migrant.
3.2 Some basic definitions
For the purpose of these surveys, a number of concepts and definitions were adopted during a
technical workshop that convened external experts and the local research institutions of each
country surveyed. Defining a household was discussed, as was measuring the time elapsed since
the first migration movement. As opposed to other surveys, the African Migration and
Remittances Household Surveys try to capture data on a cross-section of migrants, including
those who left home a long time back. For this survey, a migrant is a person who used to live in a
household in the country in which the interview is being conducted, but left before the interview
to live abroad, or in another village or urban area within the country, for at least six months.
Remittances include both international (cross-border) and internal (within-country) ―person-to-
person‖ transfers of resources (both money and in-kind) often sent by migrant workers. A place
of residence is where a person normally resides and excludes short-term stays (less than 3
months) for vacations, home visits, or business, medical, or religious reasons. Country of origin
is the country of birth.

8
3.3 Sampling strategies
Sampling frame and methodology
One of the biggest challenges faced when implementing the Migrant and Remittances Household
Surveys was locating those relatively rare households that include migrants. McKenzie and
Mistiaen (2007) note that even in countries with a high incidence of international migration,
finding a household with an emigrant abroad or a returned migrant can be challenging. In
migrant-receiving countries, such as South Africa, yet another challenge is households’
reluctance to participate in studies of this nature. Annex 1 provides a summary of the sampling
strategy implemented in each country.
Sampling Frame
It was not economically viable and cost-effective to capture data on the geographical
distribution of households with international migrants. Sampling frameworks were very difficult
to obtain. In a few countries, such as Senegal, it was possible to use the latest census as a
framework, but in other cases the latest census had taken place more than 10 years back and
could not be used to identify high-migration areas. For example, in Kenya, it was not possible to
use the latest census as a framework, so the team used remittance transfer data and maps from
M-PESA to identify migrant areas.
Countries that used census data and conducted national representative samples
Nigeria, Senegal, and Uganda used their population census to select provinces, districts, or other
units and to conduct national representative samples. Each country, however, used a different
methodology. In Nigeria and Senegal, the focus was on giving a higher probability of selection
to zones and/or primary sampling units with a higher prevalence of migrants. In the case of
Uganda, by contrast, the allocation was made proportional to the number of migrants in urban
and rural areas, while the primary units were selected without taking into account the prevalence
of migrants. As a result of these strategies, the Ugandan survey located only 249 international
migrant households—far below the 800 households expected. Meanwhile, the similarly targeted
sampling strategies used in Nigeria and Senegal were shown to be successful in the search for
migrant households.

9
Countries that used other materials for frame construction
In many African countries, the censuses were too outdated to be used. In Burkina Faso, the
survey team was not able to obtain a framework from the National Statistical Office. Meanwhile,
Kenya was conducting a census at the time of survey implementation. Since the team had to
adopt the previous census, additional materials for framework construction were used to account
for population growth and migration as well as changes in administrative units (boundary
changes, new districts) that had occurred since the earlier census. The Kenya Integrated
Household Budget Survey (2005) data, the Financial Services Deepening Survey (2006), and the
presence of remittance service providers—including M-PESA, Western Union, and Money Gram
services—were also consulted while designing the frame. In addition, the Kenya National
Bureau of Statistics’ officers, village elders, and administrative officers helped to map out
clusters where there was a higher probability of finding international migrants.
Sample design
Braw and Carletto (2008)noted that there are two alternative sampling designs that can be
applied to collect information on migration.: 1) disproportionate sampling of high migration in
the primary sample units (PSUs) and 2) stratified random sampling within PSUs (two stage
sampling). According to the authors these two methods can either be used individually or in
conjunction with one another. Bilsborrow and others (1997) suggest that to find households with
international migrants, it is best to conduct stratified disproportionate sampling with fractions;
this is the preferred methodological strategy to be applied in surveys that try to capture
international migrants. McKenzie and Mistien (2007) outline three approaches to sampling rare
elements: (i) stratified sampling using disproportionate sampling fractions with two-phase
sampling, (ii) snowball sampling, and (iii) time and space sampling.
One of the main tasks of each survey team was to design an effectively strategy for
locating households with international migrants. In the course of the implementation of the
surveys different strategies were implemented. Since not all the countries have access to
national-level sampling frames, each country used a different sampling strategies. Senegal,
Uganda and Nigeria results are representative of the whole nation. Burkina Faso, South Africa
and Kenya are representative of the level of the unit of analysis chosen (province, state or unit).

10
Once the enumeration areas were selected, a two-phase sampling procedure was used.
Surveying was restricted to certain provinces or districts where migrants were thought to
originate. Teams in Burkina Faso and Kenya conducted the surveys only in areas with a high
incidence of migration. These areas were chosen based on the 2006 population census for
Burkina Faso, and 10 provinces and 78 primary sampling units were selected. In Kenya 17
districts and 92 clusters in the districts were selected. Kenya found that even in relatively high
migration areas, the prevalence of migration was not going to give a high number of households
with migrants if the sample is drawn randomly. This two stage sampling requires a full listing
operation of the selected PSUs. This is the approach that the survey team in Kenya followed. The
selection process of households involved re-listing of the households in each cluster so as to
update the list of occupied households and to identify three groups of households; international
migrant, internal migrants and non migrant households. Each group of these three households
was treated as an independent sub-frame and random sampling was used to select households in
each group. An instrument was developed to capture the basic characteristics of households at
this stage including household headship, number of members, and presence and number of
international or internal migrant. This allows indentifying migrant households and then selecting
a sample with more households with migrants.
The sample designs had the following features:
The information sources consulted when developing the sample designs included
censuses, recent household surveys, remittance surveys, and the expert opinion of
administrative personnel from the national statistical offices.
Household samples were selected in several sampling stages, since the sampling frame
included information on urban/rural classification, identification of higher-level units
(districts, provinces, states, and so on), population, and other characteristics.
The statistical aim was to generate survey data that were representative at the level of the
province, region, or country. To this end, the team sought to find a representative sample
of the population with a relatively homogeneous distribution across three categories
(households with internal migrants, households with international migrants, and
households with no migrants). Prior to the household sampling, a listing operation of
selected primary units was carried out in the fieldwork areas, with the purpose of

11
classifying households in these three categories. Differences in the applied methodologies
were mainly in the early stages of sample selection.
Screening a sufficiently large number of households to identify households with migrants
presented some challenges. For example, in urban areas around Nairobi, Kenya, it was
difficult to find household members at home during the week. The team had to return to
the same households on weekends to obtain information.
Identifying households with immigrants posed a challenge in South Africa, since
immigrants still feared xenophobic attacks or did not want to be identified as
undocumented immigrants. To encourage households to participate in the process, there
was no listing operation to determine which households had an immigrant member.
Table 3.1 summarizes the number of households surveyed and the migration status of former
household members found in each survey for each country.
Table 3.1 Main sample characteristics Country Level of statistical
representativeness
Households
screened
Target
sample
Households
successfully
interviewed
Total number of households by
migration status of former
household member
Sending country Nonmigra
nts
Internati
onal
migrants
Internal
migrants
Burkina
Faso
10 most important
provinces for
migration
9,177 2,106 2,102 745 662 695
Kenya 17 districts with the
largest concentration
of household with
migrants
7,373 2,000 1,942 671 578 713
Nigeria National
representative
8,075 2,000 2,251 813 875 563
Senegal National
representative
2,000 2,100 700 700 700
Uganda National
representative
24,618 2,000 1,961 1,112 249 600
Receiving country
South
Africa
Main corridors
Limpopo/Gauteng
6,760 2,028 2,012 328
Immigra
nts
Source: Authors’ calculations based on results household surveys conducted in Burkina Faso, Kenya, Nigeria,
Senegal, South Africa, and Uganda in 2009 as part of the Africa Migration Project
12
In sum, to develop appropriate sample designs in each country was challenging. These
constraints were recognized in all country-specific sample designs. In Senegal, Nigeria, and
Uganda the household surveys were nationally representative and applied stratified random
sampling. In Kenya, Burkina Faso, and South Africa the surveys were representative of the areas
selected. Annex A.1 summarizes the implementation of the stratified random sample in each
country, including the methodological steps, number of primary units selected, and sample size.
3.4 Language design
The key principle was that every respondent in the household was interviewed in his or her
preferred language, but this presented challenges in questionnaire preparation and field
operations. In the majority of the countries surveyed, the interviewers spoke the languages of the
largest ethnic language groups. For example, interviewers came from various regions of Burkina
Faso and spoke at least five local languages. South Africa was the only country that translated
the questionnaire into three different languages.
3.5 Fieldwork
The fieldwork in the six countries was properly organized and implemented in order to use the
limited resources efficiently. The teams of interviewers recruited for each survey team were well
qualified. For example, in the case of Nigeria all the interviewers had a college degree. In
Burkina Faso, Nigeria, South Africa, Uganda, Senegal, and Kenya, supervisors and interviewers
were trained according to the questionnaire guidelines. The survey teams encountered few
difficulties in implementing the surveys. In certain cases, some respondents were not willing to
give information on nonhousehold members from which they received remittances. In these
cases, interviewers did not ask for the real name of the sender but only a surname. The reticence
to provide information on senders of remittances was high in urban areas. In Nigeria in some
instances, the survey team had some difficulty in obtaining answers to questions seeking
personal (particularly financial) data. In South Africa some households refused to answer such
questions, especially in highly affluent areas of both the Gauteng and Limpopo provinces.
3.6 Data entry, quality control, format, and availability
Once the fieldwork was finalized in each of the countries, the survey teams proceeded to
manually control the content of the completed questionnaires to be later entered into a software

13
program. Prior to sending the files to the research team, local teams validated the data content.
Data reported as erroneous were reviewed and corrected with the help of paper questionnaires.
Data on the questionnaires needed to be subjected to different types of checks; these typically
included range checks, checks against reference data, skip checks, consistency checks, and
typographic checks (Munoz 2003). This review process was monitored specifically for the
following:
Duplicate records
Correspondence between different types of household registration (individuals, migrants,
and so on)
Undefined values for categorical variables
Values outside the logical range for numeric variables
Missing values beyond 5 percent identified as eligible
Cross-consistency of information
In the process of validation and error correction, imputation was avoided in the case of
missing values.
The data from the survey are available from the World Bank website. These data include the
survey instrument, manuals, and methodology. The data can be downloaded as a STATA or
SPPS file.
The data obtained by each survey have been anonymized by removing name fields, addresses,
phone numbers, and the names of the interviewers.
3.7 Limitations of the data
There are a number of important methodological and data issues that users need to be aware
of when using the data. Like all sample surveys, these migration and remittances household
surveys can only produce estimates and these estimates are limited by a number of factors.
Sample coverage – the sampling frame does not cover the whole population in all the
countries.

14
Sampling variability – all samples can differ from the population by chance. This is
referred to as sampling error. The findings from the surveys seem to corroborate previous
findings from other surveys on certain variables.
Bias in the achieved sample – if a sample under represents sections of the population or if
a large proportion of people do not answer some questions, the estimates may differ
substantially from the population that are not a result of chance. For example, in Senegal,
the unweighted sample is 53.8 % female in rural areas, but the true figure of the
population is 52.3%. This is an example of bias caused by young males, in particular,
being difficult to contact to take part in the survey since it was the harvest season at the
time of the implementation of the survey.
The surveys are also limited in the amount of detail it can collect about some topics. For
example, it was not designed to provide reliable "economic" statistics (e.g.
unemployment rates and average earnings).
4. Some preliminary findings
In the past, very few nationally representative household surveys have collected detailed data on
migration and remittances in any Sub-Saharan African country, with the exception of the 2005–
06 Ghana Living Standards Survey 5 (GLSS 5). As a result, little is known about the
characteristics of households that have former and current members who are internal or
international migrants or who have received internal and international remittances from former
and nonformer household members. Even less is known about the age, gender, and skill
composition of internal and international migrants in Africa. For these reasons, the six
Household Migration and Remittances Surveys represent a unique source of information on
household composition and characteristics and individual-level migration, remittance, and return
migration patterns. This section provides an overview of the data captured by the six surveys.

15
It should be noted that not all the surveys’ samples are nationally representative. Therefore, the
results can only be interpreted at the level they represent (province or region).
Table 4.1 Main sample characteristics Country Level of statistical
representativeness
Households
screened
Target
sample
Households
successfully
interviewed
Total number of households by
migration status of former
household member
Sending country Nonmigra
nts
Internat
ional
migrant
Internal
migrants
Burkina
Faso
10 most important
provinces for the
migration
9,177 2,106 2,102 745 662 695
Kenya 17 districts with the
largest concentration
of households with
migrants
7,373 2,000 1,942 671 578 713
Nigeria National
representative
8,075 2,000 2,251 813 875 563
Senegal National
representative
2,000 2,100 700 700 700
Uganda National
representative
24,618 2,000 1,961 1,112 249 600
Receiving country Immigrants
South
Africa
Main corridors
Limpopo/Gauteng
6,760 2,028 2,012 328
Source: Authors’ calculations based on results household surveys conducted in Burkina Faso, Kenya, Nigeria,
Senegal, South Africa, and Uganda in 2009 as part of the Africa Migration Project
4.1 Sociodemographic characteristics of households
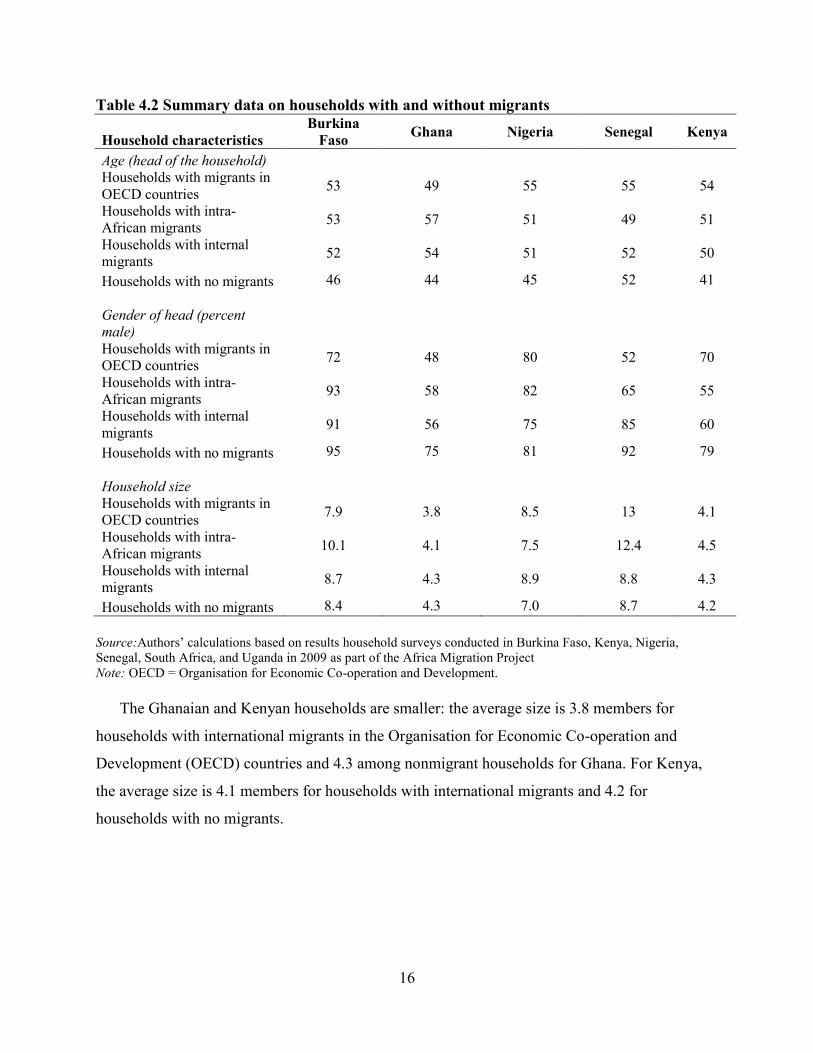
Table 4.2 presents mean values on selected household-level variables for four groups of
households: households with no migrants, internal migrants (mainly rural to urban or rural to
rurual, within the same nation), intra-African migrants, and international migrants (outside
Africa). Table 4.1 indicates that those households with no migrants have the youngest household
heads. On the other hand, households with international migrants have smaller household sizes.
The size of the household, however, also reflects the demographic patterns in a given country.
For example, high fertility levels in Burkina Faso and Senegal also explain the large household
sizes.
Survey findings confirm previous findings on household sizes in Ghana and Senegal (small
nuclear households in Ghana and large polygamous households in Senegal; Eurostat 2000). In
Senegal the average household count was 8.7 members in nonmigrant households and 13 in
migrant households.
16
Table 4.2 Summary data on households with and without migrants
Household characteristics
Burkina
Faso Ghana Nigeria Senegal Kenya
Age (head of the household)
Households with migrants in
OECD countries 53 49 55 55 54
Households with intra-
African migrants 53 57 51 49 51
Households with internal
migrants 52 54 51 52 50
Households with no migrants 46 44 45 52 41
Gender of head (percent
male)
Households with migrants in
OECD countries 72 48 80 52 70
Households with intra-
African migrants 93 58 82 65 55
Households with internal
migrants 91 56 75 85 60
Households with no migrants 95 75 81 92 79
Household size
Households with migrants in
OECD countries 7.9 3.8 8.5 13 4.1
Households with intra-
African migrants 10.1 4.1 7.5 12.4 4.5
Households with internal
migrants 8.7 4.3 8.9 8.8 4.3
Households with no migrants 8.4 4.3 7.0 8.7 4.2
Source:Authors’ calculations based on results household surveys conducted in Burkina Faso, Kenya, Nigeria,
Senegal, South Africa, and Uganda in 2009 as part of the Africa Migration Project
Note: OECD = Organisation for Economic Co-operation and Development.
The Ghanaian and Kenyan households are smaller: the average size is 3.8 members for
households with international migrants in the Organisation for Economic Co-operation and
Development (OECD) countries and 4.3 among nonmigrant households for Ghana. For Kenya,
the average size is 4.1 members for households with international migrants and 4.2 for
households with no migrants.

17
4.2 Migrant demographics
Since data were collected for both migrant and nonmigrant households, we can compare across
the two groups and across the six surveyed countries. The data from the five migrant-sending
countries surveyed confirm that young men migrate the most and that most international
migrants—both within and outside Africa—are male.
Table 4.3 Characteristics of migrants from select African countries
Characteristics/destination Burkina
Faso Ghana Nigeria Senegal Kenya
Age (middle 50 percent)
Migrants in OECD countries 35 37 33 38 34
Intra-African migrants 32 35 28 35 33
Internal migrants 32 35 27 32 31
Gender (percent male)
Migrants in OECD countries 79 70 72 80 57
Intra-African migrants 90 63 75 86
Internal migrants 82 62 62 75 61
Education (percent with
given level of education)
Migrants in OECD countries 52 secondary
61
secondary 45 tertiary 44 tertiary 47secondary
Intra-African migrants 65 primary
45
secondary 38 secondary 48 primary
Internal migrants 45 secondary
54
secondary 49 secondary 35 primary
43
secondary
Reason for emigration
Employment 78 .. 48 48 54
Education 8 .. 29 29 38
Others 4 .. 4 3 2
Source: Authors’ calculations based on results household surveys conducted in Burkina Faso, Kenya, Nigeria,
Senegal, South Africa, and Uganda in 2009 as part of the Africa Migration Project
.. Negligible.
Note: OECD = Organisation for Economic Co-operation and Development.
Findings from the surveys show that migrants going to OECD countries have a higher level
of education than migrants within Africa and within the same nation. In Burkina Faso, the data
corroborate that the majority of migrants that go to neighboring countries only have primary
education while internal migrants have secondary education. In Senegal, where the overall

18
educational levels are lowest, intra-African migrants and internal migrants have only primary
education.
For all the countries surveyed, the main reason that migrants leave their countries is to pursue
economic opportunity, followed by studying abroad, and, finally, marriage or family reasons.
In migrant-receiving countries, immigrants also move for economic reasons. Immigrants in
South Africa were asked to indicate the main reason for their last move: ―search for work‖ was
the most prevalent reason, followed by ―civil/conflict/war,‖ and then ―family reasons‖ (table 4.4).
Table 4.4 South Africa: Reasons for moving (%)
Reasons for immigrating Percentage (%)
Economic 63
Conflict 13
Family 15
Education 5
Other 2
Total 100 Source: Authors’ calculations based on results household surveys conducted in Burkina Faso, Kenya, Nigeria,
Senegal, South Africa, and Uganda in 2009 as part of the Africa Migration Project
4.3 Countries of destination
Figure 4.1 shows the main countries of destination for each of the sending countries surveyed. In
Burkina Faso there is a predominance of intraregional migration, mainly to Côte d’Ivoire and
Mali. For Ghanaians, Nigerians, and Kenyans the United States and the United Kingdom are the
top two destinations. Senegalese emigrants go to Italy, Spain, France, and other African
countries (Mauritania and Gabon). Historical colonial ties continue to be a major factor affecting
the patterns of emigration from Africa. But Italy, Qatar, Spain, and the United Arab Emirates
have become new countries of destination for some African emigrants.

19
Figure 4.1 Main countries of destination, per migrant-sending country
Percentage of all international migrants
0%
5%
10%
15%
20%
25%
30%
35%
40%
Kenya
0%
5%
10%
15%
20%
25%
30%
Nigeria
0%5%
10%15%20%25%
Senegal
0%
5%
10%
15%
20%
25%
USA UK Other ECOWAS
Italy Germany
Ghana

20
Source: Authors’ calculations based on results household surveys conducted in Burkina Faso, Kenya, Nigeria,
Senegal, South Africa, and Uganda in 2009 as part of the Africa Migration Project
Note: ECOWAS = Economic Community of West African States.
4.4 Labor market activity of migrants
The survey data also indicate the labor-market effects of migration. In Burkina Faso migration
allowed for more full-time and part-time wage activities. Nigeria, migration allowed a shift from
unemployment to self-employment and wage employment. Migration appears to have various
implications for women’s labor-market status in these countries. In Kenya the shift in labor-
market status is significant for unemployed, many of whom were able to find wage employment
after migrating (table 4.5).
Table 4.5 Labor-market status of individuals from select African countries, before and
after migrating, 2009
(percent)
Labor market status Burkina Faso Senegal Nigeria Kenya
Before After Before After Before After Before After
Self-employed 80 64 42 43 16 26 7 9
Student 10 5 21 8 43 23 31 16
Housewife 3 5 9 8 1 5 2 3
Full-time wage
earner 3 9 9 24 14 34
21 53
Part-time wage
earner 1 12 3 4 3 4
4 8
Unemployed 2 2 9 3 22 4 33 8
Other 1 3 7 10 2 4 1 3 Source: Authors’ calculations based on results household surveys conducted in Burkina Faso, Kenya, Nigeria,
Senegal, South Africa, and Uganda in 2009 as part of the Africa Migration Project
0%
10%
20%
30%
40%
50%
60%
70%
80%
90%
Cote d'Ivoire Mali Togo Italy
Burkina Faso

21
Labor market activity in migrant-receiving countries
According to the numbers reported in the survey in South Africa, the majority of
immigrants currently work in low-skilled occupations (Table 4.6).
Table 4.6 South Africa: Occupation and migration status (absolute numbers)
Occupation Migration status Total
Native Born abroad,
within Africa
Born abroad,
outside Africa
Managers 242 31 7 280
Professionals 392 26 5 423
Technicians and associate professionals 129 13 2 144
Clerical support workers 190 5 3 198
Service and sales workers 294 47 3 344
Skilled agricultural, forestry, and fishery
workers
42 3 2 47
Craft and related trades workers 85 48 6 139
Plant and machine operators, and
assemblers
85 23 0 108
Elementary occupations (for example,
domestic worker, or vegetable or street
vendor)
352 155 0 507
Armed forces occupations 31 6 0 37
Don’t know 20 5 1 26
Total 1,862 362 29 2,253
Source: Authors’ calculations based on results household surveys conducted in Burkina Faso, Kenya, Nigeria,
Senegal, South Africa, and Uganda in 2009 as part of the Africa Migration Project
4.5 Remittances: Uses and channels
Uses of remittances
Table 4.7 shows the uses of remittances sent by internal, intraregional (that is, within
Africa), and international migrants. Households in Burkina Faso and Senegal spend a large
proportion of remittances sent by international migrants on food. Remittances sent by
international migrants outside Africa are spent on food, education, health, and physical
investments.

22
Table 4.7 Use of remittances by recipient households in select African countries, by source (percent of total remittances)
Burkina Faso Kenya Nigeria
Use
Outside
Africa
Within
Africa Domestic
Outside
Africa
Within
Africa Domestic
Outside
Africa
Within
Africa Domestic
Construction of
new house 25.7 10.1 2.6 11.2 27.5 1.3 5.8 0.0 0.1
Food 23.5 34.9 48.7 12.8 14.5 29.7 10.1 20.1 1.0
Education 12.4 5.9 9.4 9.6 22.9 20.5 22.1 19.6 4.5
Health 11.3 10.1 12.5 7.3 5.8 7.0 5.1 12.0 10.6
Business 10.4 2.6 2.4 3.9 8.4 13.0 21.7 20.1 11.1
Clothing 5.0 0.7 0.7 .. .. .. .. .. ..
Marriage/funeral 2.1 3.9 3.1 0.9 1.7 2.0 0.4 1.0 ..7
Rent (house,
land) 1.4 0.6 1.7 5.7 0.4 7.4 4.4 4.9 ..8
Rebuilding of
house 0.3 1.0 1.2 5.3 3.1 1.3 4.7 3.2 7.0
Cars/trucks 0.1 0.0 0.1 1.3 1.0 0.4 0.0 0.0 0.5
Purchase of land 0.0 1.4 0.1 8.4 7.0 1.3 24.8 16.6 18.2
Improvement of
farma 0.0 3.9 1.1 2.3 0.4 4.4 .. .. ..
Investment .. .. 24.2 0.6 4.7 .. .. ..
Other 7.7 24.9 16.3 7.2 6.6 6.9 0.8 2.6 3.5
Senegal Uganda
Outside
Africa
Within
Africa Domestic
Outside
Africa
Within
Africa Domestic
Construction of
new house 7.0 0.7 0.0 2.5 1.6 0.4
Food 52.6 72.6 81.9 7.6 9.7 12.4
Education 3.6 2.3 4.6 12.7 14.5 20.2
Health 10.7 7.3 2.9 6.3 14.5 24.8
Business 1.3 5.7 0.2 7.6 9.7 2.1
Clothing .. .. .. .. .. ..
Marriage/funeral 2.9 2.4 1.1 7.6 6.5 1.7
Rent (house,
land) 1.0 0.0 2.2 5.1 8.1 4.5
Rebuilding of
house 4.2 0.7 0.1 6.3 3.2 2.1
Cars/trucks 0.2 0.0 0.0 2.5 0.0 0.0
Purchase of land 3.0 0.0 0.0 3.8 4.8 2.1
Improvement of
farma .. .. .. .. .. ..
Investment .. .. .. .. .. ..
Other 13.5 8.3 6.9 38.0 27.4 29.8
Source:Authors’ calculations based on results household surveys conducted in Burkina Faso, Kenya, Nigeria,
Senegal, South Africa, and Uganda in 2009 as part of the Africa Migration Project .. Negligible. a. Includes agricultural equipment.

23
Many migrants transfer funds to households in origin countries for the purpose of investment.
Data from household surveys reveal that households receiving international remittances from
OECD countries have been making productive investments in land, housing, businesses, farm
improvements, agricultural equipment, and so on (36 percent in Burkina Faso, 55 percent in
Kenya, 57 percent in Nigeria, 15 percent in Senegal, and 20 percent in Uganda; see figure 4.2).
Households receiving transfers from other African countries are also investing a significant share
in business activities, housing, and other investments in Kenya (47 percent), Nigeria (40 percent),
Uganda (19.3 percent), and Burkina Faso (19.0 percent).
Figure 4.2 Investments in business and housing funded by remittances from within and outside
Africa
Source: Authors’ calculations based on results household surveys conducted in Burkina Faso, Kenya, Nigeria,
Senegal, South Africa, and Uganda in 2009 as part of the Africa Migration Project
Note: ―Other investments‖ include purchases of land, livestock, and agricultural equipment and investment in
agriculture.
0
10
20
30
40
50
60
Senegal Within Africa
Senegal Outside Africa
Burkina Faso
Within Africa
Burkina Faso
Outside Africa
Uganda Within Africa
Uganda Outside Africa
Kenya Within Africa
Kenya Outside Africa
Nigeria Within Africa
Nigeria Outside Africa
Business and other investments Housing
Percent of total

24
Channels for remittances
Internal remittances
Internal migrants generally send remittances by way of friends or relatives—or carry the money
themselves on visits home. The situation is different in Kenya, however, where the use of M-
PESA agencies is highly used. About 60 percent of Kenyan internal migrants reported the use of
mobile transfers as a main channel for sending remittances (table 4.8)
Source: Authors’ calculations based on results household surveys conducted in Burkina Faso, Kenya,
Nigeria, Senegal, South Africa, and Uganda in 2009 as part of the Africa Migration Project
Table 4.8 Channels used to send internal remittances
Percentage Channels of Remittances - Internal Migrants
Channel Burkina Faso Ghana Kenya Nigeria Senegal
Western Union 1 0 1 3 5
Money Gram 0 0 1 2 0
Other money transfer operator (MTO) 0 0 0 2 0
Postal money order 1 0 1 0 3
Direct transfer to bank account 0 1 6 35 0
Bank as paying agent for MTO 0 0 1 3 0
Foreign exchange bureau 0 0 1 0 0
Credit union 0 0 0 0 0
Travel agency 1 0 0 0 0
Informal individual agents 1 0 0 4 3
Mobile phone/telecom service providers
0 0 60 0 1
Through friend or relative 27 44 7 21 37
Courier, bus, or other transport 3 0 1 0 12
Brought back himself during visit 63 50 21 28 37
Pre paid cards/ATM card 0 0 0 0 0
Internet money transfer 0 0 0 0 0
Other 1 5 1 1 2
Total 100 100 100 100 100

25
Source: Authors’ calculations based on results household surveys conducted in Burkina Faso, Kenya,
Nigeria, Senegal, South Africa, and Uganda in 2009 as part of the Africa Migration Project
Cross-border remittances within Africa
Migrant workers in Africa generally transfer their remittances mainly through informal channels.
Sending money through friends and bringing back money during visits is still the most important
channel. In all six countries, surveys reported that remittance service providers (Western Union
and Money Gram) are a channel for sending remittances. Kenyans and Nigerians sending
remittances from within Africa used the banking system as a channel to transfer money. Kenya
also reported the use of mobile phone and telecommunication providers as an important way to
transfer money.
Table 4.9 Channels used to send remittances within Africa
Channels of remittances—Within-Africa migrants (%)
Channel Burkina Faso Ghana Kenya Nigeria Senegal
Western Union 10 17 24 31 30
Money Gram 1 6 12 3 1
Other money transfer operator (MTO) 0 0 2 1 0
Postal money order 3 0 2 1 6
Direct transfer to bank account 0 0 11 12 0
Bank as paying agent for MTO 0 0 1 18 0
Foreign exchange bureau 0 0 2 1 0
Credit union 0 0 0 0 0
Travel agency 0 0 0 0 0
Informal individual agents 3 0 3 4 4
Mobile phone/telecom service providers 0 0 24 0 0
Through friend or relative 64 43 9 15 41
Courier, bus, or other transport 3 0 4 0 1
Brought back himself during visit 15 30 8 13 14
Prepaid cards/ATM card 0 0 0 0 0
Internet money transfer 0 0 0 0 0
Other 0 4 0 0 2
Total 100 100 100 100 100
Source: Authors’ calculations based on results household surveys conducted in Burkina Faso, Kenya, Nigeria,
Senegal, South Africa, and Uganda in 2009 as part of the Africa Migration Project .

26
International cross-border remittances
Table 4.10 shows that international migrants working outside of Africa remit more through
formal channels. Money-transfer companies are the main channel to send money from outside
Africa. The role of friends is still important but not in the same proportion as for internal and
intraregional remittances. Sending money through mobile phones is not a channel represented in
the survey when the money is sent from outside Africa.
Table 4.10 Channels used to send international remittances Channels of remittances—OECD migrants
Channel Burkina Faso Ghana Kenya Nigeria Senegal
Western Union 32 54 43 51 74
Money Gram 9 6 20 5 6
Other money transfer operator (MTO) 2 14 1 0 2
Postal money order 0 0 1 0 3
Direct transfer to bank account 0 2 8 12 0
Bank as paying agent for MTO 2 0 8 11 1
Foreign exchange bureau 0 0 7 0 0
Credit union 0 0 0 0 1
Travel agency 0 0 1 0 0
Informal individual agents 0 0 1 2 2
Mobile phone/telecom service providers 0 0 2 0 0
Through friend or relative 18 18 4 13 10
Courier, bus, or other transport 0 0 0 0 0
Brought back himself during visit 34 4 2 5 1
Pre-paid cards/ATM card 0 0 0 0 0
Internet money transfer 0 0 0 0 0
Other 2 2 0 0 0
Total 100.00 100.00 100.00 100.00 100.00
Source: Authors’ calculations based on results household surveys conducted in Burkina Faso, Kenya, Nigeria,
Senegal, South Africa, and Uganda in 2009 as part of the Africa Migration Project.

27
4.6 Return migration
The survey data show low rates of return migration: the share of emigrants who returned was
only 3 percent in Nigeria, 9 percent in Senegal, and 25 percent in Burkina Faso (table 4.11). The
majority of those who returned to Burkina Faso and Nigeria came back in less than four years. In
contrast, in Senegal two-thirds of returnees had spent 15 or more years abroad.1
Table 4.11 Return migration in select African countries
(percent)
Item Burkina Faso Nigeria Senegal
Returnees as a share of migrants 25 3 9
of which:
Returned in less than 4 years 67 69 32
Returned in 5–15 years 16 23 2
Returned after more than 15 years 16 8 66 Source: Authors’ calculations based on results household surveys conducted in Burkina Faso, Kenya, Nigeria,
Senegal, South Africa, and Uganda in 2009 as part of the Africa Migration Project
5. Final assessment and conclusions
The six Migration and Remittances Household Surveys conducted as part of the Africa
Migration Project are an important source of detailed information on migration and international
remittances in Africa. These include five migrant-sending countries and one migrant-receiving
country. The data contain a series of demographic, economic, migration, and remittance
variables.
The data promise to be a vital contribution to the research community. They will allow for
comparative studies across countries, since the questionnaires were standardized and the surveys
were implemented in roughly the same period as one another.
1. See Azam and Gubert (2005) for discussion of the pattern of migration in rural Senegal.

28
Due to time and cost constraints, the survey instrument does not contain questions capturing
some data relevant to migration and remittances, such as that on migrant networks migrant
history, and child labor. The coverage of the sample is not optimal in all the countries, but at
least it can provide a picture—previously missing—of the migration and remittance patterns in
certain areas.
The six household surveys will contribute to the analysis of migration issues and will
facilitate policy formulation. Another unique aspect of the household surveys is that they were
conducted by local research institutions in Africa.
Given the questionnaires, training modules, and sampling strategies, more countries can
implement migration and remittances household surveys using the same methodology.

29
Annex A.1 Sampling methodology
Country Burkina Faso
Population All households in the 10 provinces which account for the largest
concentration of households with migrants
Sampling frame
All the villages and urban areas located in the 10 provinces which
are the primary sampling units of this survey.
Domains of survey Households with international migrants, households with internatl
migrants, and households without migrants.
Stratus 10 selected provinces
Number of primary units selected 78
Sampling allocation Strates Nombre de DR tiré
Sanmatenga 24
Yatenga 9
Passoré 6
Boulgou 8
Boulkiemdé 6
Namentenga 6
Banwa 5
Sourou 5
Tuy 5
Kadiogo 4
Total 78
Sample size 2, 106 households (78*27)
Sampling design
A survey with a selection of primary units in geographic strata in
the first phase and selection of households in strata according to
the domains of study within each PSU.
Household listing All the households selected in the village were listed and an
average of 120 households in selected urban areas. Then classified
them according to the domains of the survey. A light survey was
conducted to identify the households with migrants and no
migrants.

30
Country Kenya
Population All the households in 17 districts that contain the largest number
of households receiving transfers (internal or international
remittances)
Sampling frame primary sampling units (PSUs) which are the clusters developed
during the 1999 census.
Domains of survey Households with international migrants, households with internal
migrants, and households without migrants.
Stratus Districts by urban and rural sectors
Number of primary units selected 91
Sampling allocation Rural urban
Embu 4 1
Garissa 1 4
Kakamega 3 2
Kiambu 4 1
Kilifi 1 4
Kisii 3 2
Lugari 3 2
Machakos 3 2
Malindi 3 2
Migori 4 1
Mombasa 6
Nairobi 10
Nakuru 3 2
Rachuonyo 4 1
Siaya 4 1
Thika 3 2
Vihiga 3 2
Total 46 45
Sample size 2,184 households (91*24)
Sampling design Cluster survey with a selection of primary units in geographic
strata in the first phase and selection of households in strata
according to the domains of study within each PSU.
It listed all the households in the PSUs are selected and classified
according to the domains of study via a survey conducted in light
all the households in the selected PSUs.
Household listing It listed all the households in the PSUs are selected and classified
according to the domains of study via a survey conducted in light
all the households in the selected PSUs.

31
Country Nigeria
Population All households in the country
Sampling frame All the PSUs according to the 2006 National Population Census.
Domains of survey Households with international migrants, households with internal
migrants, and households without migrants.
Stratus Areas with high and low migration rates in rural and sector zones
Number of primary units
selected
60
Sampling allocation Strates Nombre de DR tiré
High migration urban 36
High migration rural 36
Low migration urban 9
Low migration rural 9
TOTAL 90
Sample size 2,040 households (90*34)
Sampling design Cluster survey in four stages
Household listing All the households in the PSUs selected were listed. Then they
were classified into the three stratums using a light survey
conducted to the households in the selected PSUs.
Methodological steps - Classification of states in high and low migration based on
prior information.
- Of the states classified as high migration were selected
12 and the low migration 6, both with probability
proportional to size, using the population as a measure of
this.
- Within the states were randomly chosen proportionate to
the size of the state. Local Governments at two high-LG
by state for migration and a low migration. Subsequently
decided to expand by 50% the sample of LG.
- Random selection of two enumeration area for each LG
- List of households in 90 PSUs in the sample households
classified listings in three layers, namely households with
international migrants, households with internal migrants
and households without migrants.
- Selection of households within each stratum, PSUs by
systematic sampling at 12 interrnacionales migrant
households, 12 internal migrant households and 10
households without migrants.
32
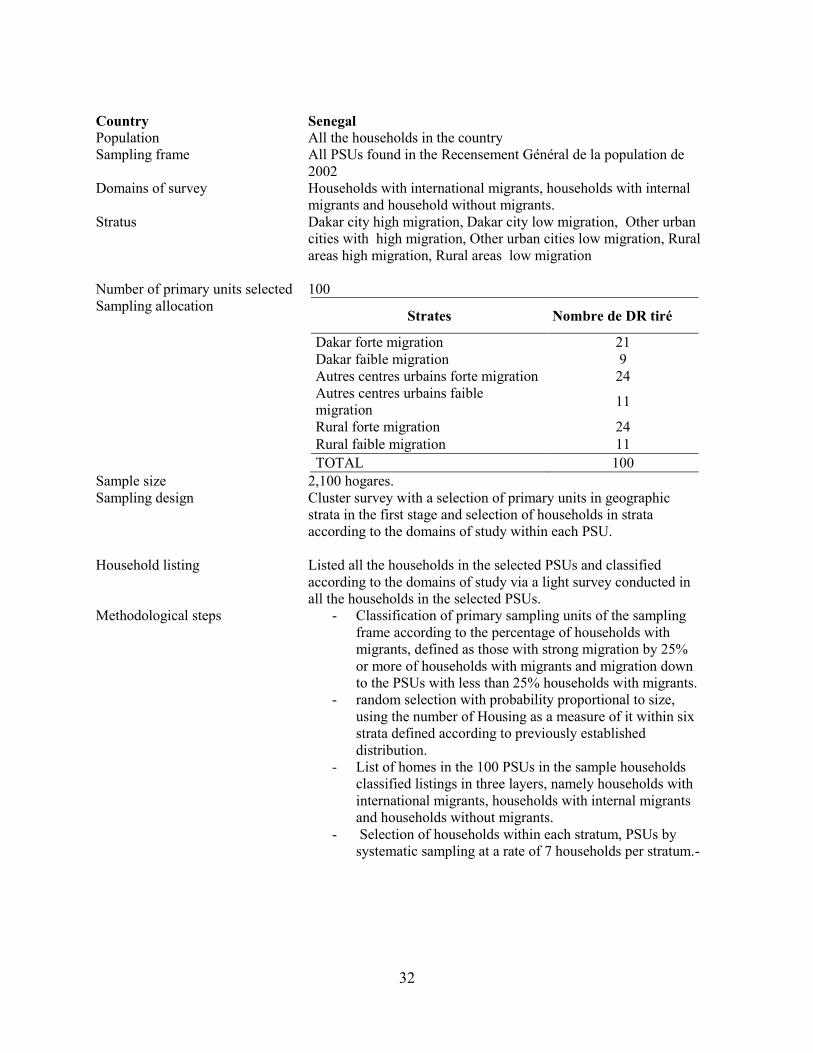
Country Senegal
Population All the households in the country
Sampling frame All PSUs found in the Recensement Général de la population de
2002
Domains of survey Households with international migrants, households with internal
migrants and household without migrants.
Stratus Dakar city high migration, Dakar city low migration, Other urban
cities with high migration, Other urban cities low migration, Rural
areas high migration, Rural areas low migration
Number of primary units selected 100
Sampling allocation Strates Nombre de DR tiré
Dakar forte migration 21
Dakar faible migration 9
Autres centres urbains forte migration 24
Autres centres urbains faible
migration 11
Rural forte migration 24
Rural faible migration 11
TOTAL 100
Sample size 2,100 hogares.
Sampling design Cluster survey with a selection of primary units in geographic
strata in the first stage and selection of households in strata
according to the domains of study within each PSU.
Household listing Listed all the households in the selected PSUs and classified
according to the domains of study via a light survey conducted in
all the households in the selected PSUs.
Methodological steps - Classification of primary sampling units of the sampling
frame according to the percentage of households with
migrants, defined as those with strong migration by 25%
or more of households with migrants and migration down
to the PSUs with less than 25% households with migrants.
- random selection with probability proportional to size,
using the number of Housing as a measure of it within six
strata defined according to previously established
distribution.
- List of homes in the 100 PSUs in the sample households
classified listings in three layers, namely households with
international migrants, households with internal migrants
and households without migrants.
- Selection of households within each stratum, PSUs by
systematic sampling at a rate of 7 households per stratum.-

33
Country South Africa
Population Households of Gauteng and Limpopo.
Sampling frame All enumeration areas in the provinces of Gauteng and Limpopo.
Domains of survey Households with immigrants, households with migrants and
households with no migrants.
Stratus Gauteng y Limpopo.
Number of primary units selected 334
Sampling distribution Province Quartile Sample EAs
Gauteng 1 0
2 3
3 7
4 157
Total 167
Limpopo 1 17
2 47
3 93
4 10
Total 167
Total 1 17
2 50
3 100
4 167
Total 334
Sample size 2,004 households (334*6)
Sampling design Cluster survey with a selection of primary units in geographic
strata in a first stage and households selected by systematic step in
a second stage.
Household listing There was no listing operation
Methodological steps - Classification of "migration intensity" of each
enumeration area of the two provinces on the basis of
information from different sources
- Random selection of EAs within each province with
probability proportional to size, using the "intensity of
migration" as a measure of that within strata defined.
- Quick Count housing
- Determination of housing selection step
- Select random starting point
- Selection of households to be interviewed
34
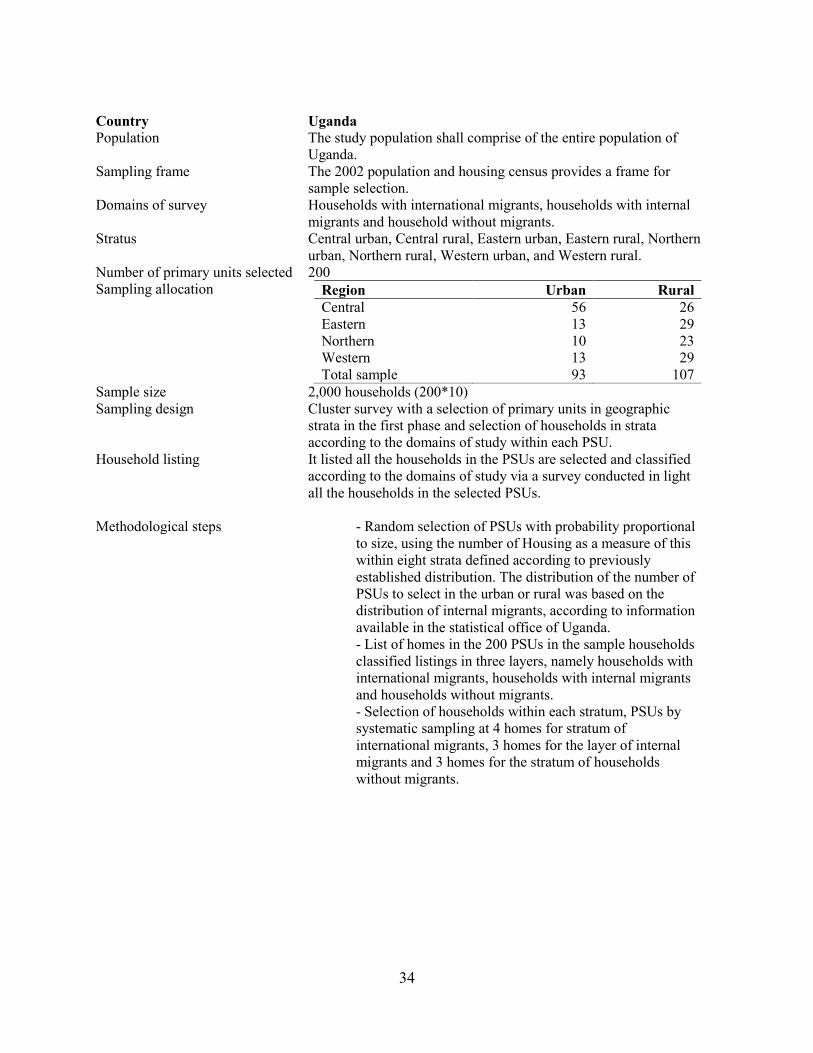
Country Uganda
Population The study population shall comprise of the entire population of
Uganda.
Sampling frame The 2002 population and housing census provides a frame for
sample selection.
Domains of survey Households with international migrants, households with internal
migrants and household without migrants.
Stratus Central urban, Central rural, Eastern urban, Eastern rural, Northern
urban, Northern rural, Western urban, and Western rural.
Number of primary units selected 200
Sampling allocation Region Urban Rural
Central 56 26
Eastern 13 29
Northern 10 23
Western 13 29
Total sample 93 107
Sample size 2,000 households (200*10)
Sampling design Cluster survey with a selection of primary units in geographic
strata in the first phase and selection of households in strata
according to the domains of study within each PSU.
Household listing It listed all the households in the PSUs are selected and classified
according to the domains of study via a survey conducted in light
all the households in the selected PSUs.
Methodological steps - Random selection of PSUs with probability proportional
to size, using the number of Housing as a measure of this
within eight strata defined according to previously
established distribution. The distribution of the number of
PSUs to select in the urban or rural was based on the
distribution of internal migrants, according to information
available in the statistical office of Uganda.
- List of homes in the 200 PSUs in the sample households
classified listings in three layers, namely households with
international migrants, households with internal migrants
and households without migrants.
- Selection of households within each stratum, PSUs by
systematic sampling at 4 homes for stratum of
international migrants, 3 homes for the layer of internal
migrants and 3 homes for the stratum of households
without migrants.

35
References
Azam, Jean-Paul & Gubert, Flore, 2005. "Migrant Remittances and Economic Development in
Africa: A Review of Evidence," IDEI Working Papers 354, Institut d'Économie Industrielle
(IDEI), Toulouse.
Bilsborrow, R. E. 2007. ―Surveys of International Migration: Issues and Tips.‖ Paper presented
at the Sixth Coordination Meeting on International Migration United Nations, New York, 1–
5. http://www.un.org/esa/population/meetings/sixthcoord2007/Bilsborrow_paper.pdf.
Bilsborrow, Richard, Graeme Hugo, A. S. Oberai, and Hania Zlotnick. 1997. International
Migration Statistics: Guidelines for Improving Data Collection Systems. Geneva:
International Labour Organization.
Carletto, C and Alan de Braw. 2008. Measuring Migration using Household Surveys. Migration
Operational Vehicle Note 2. The World Bank. Washington D.C.
Eurostat, .2000. Push and Pull Factors of International Migration: A Comparative Report.
European Community. Luxembourg.
Lucas, Robert E. B. 1993. ―Internal Migration in Developing Countries.‖ In Handbook of
Population and Family Economics, ed. M. R. Rosenzweig and O. Stark, vol. 1, chap. 13,
721–98. Elsevier
Lucas, Robert E. B. 2000. ―Migration.‖ In Designing Household Survey Questionnaires for
Developing Countries: Lessons from 15 Years of the Living Standards Measurement Study,
Volume 2, ed. M. Grosh and P. Glewwe, 49–82. World Bank: Washington, DC.
McKenzie, David J., and Johan Mistien. 2007. ―Surveying Migrant Households: A Comparison
of Census-Based, Snowball, and Intercept Point Surveys.‖
http://siteresources.worldbank.org/INTMIGDEV/Resources/2838212-
1160686302996/mckenziemistiaen.pdf.
Muñoz, Juan. 2007. ―Sampling: What You Don’t Know Can Hurt You.‖ Presentation at the
Multi-topic Household Survey course, World Bank, Washington, DC, January 2007.
Thorogood, D. 2005. ―Migration Statistics in Europe—The Effects of Differences in Concepts
and Definitions.‖ Paper presented at CEIES Seminar: Migration Statistics—Social and
Economic Impacts with Respect to Labour Market, Riga, 14–24.
World Bank. 2005. Global Economic Prospects 2006: Economic Implications of Remittances and
Migration. World Bank: Washington, DC.


![Application Migration Effort in the Cloud – The …...Migration Planning Migration Execution Migration Evaluation Fig. 1: Migration Evaluation Process [11] details of the used application,](https://img.pdfslide.us/doc/110x75/5f7b6290eee8fe431c5b6775/application-migration-effort-in-the-cloud-a-the-migration-planning-migration.jpg)