Embed Size (px)
Citation preview
- 13 -
Infectious Disease Assessment for Migrants 2015
3.1 BackgroundWith an increasing world population, globalisation of the world’s economy, climate change and other socio-political factors, more people migrate today than at any other time.(1) This movement has implications for the health of both the individual and the population. It has been documented in the 2009 United Nations Human Development Report that migration benefits people in terms of increased educational and economic opportunities.(2) However, people who move country can also face challenges when accessing local health and social services.
Migrants are a diverse group with varying health needs. Many are healthy, young adults from countries with low prevalence of infectious diseases who travel to work or study.(3) Others come from regions with a high burden of infections and continue to be at risk of these diseases due to return visits to their country of origin or due to adverse conditions such as overcrowding in their country of arrival.(3) These migrants may have more extensive health needs. When assessing their health needs the following broad questions are helpful to consider:
=What were their life experiences before migration, for example, their family life, education, employment and healthcare access?
= What were the circumstances of their migration? This may have been a voluntary choice for education or economic purposes or the person may be more vulnerable, for example, if they have been trafficked.
= What was their experience during the process of migration?
= What are their current living circumstances in Ireland? How are they integrating into their new community? What are the social structures that they have in place?
Healthcare professionals also need to be aware of specific diseases that are more prevalent in certain ethnic or migrant groups.
3.2 Migrant population and demography Overall, the size of the Irish population is increasing. Data from Census 2011 suggest that the annual average growth since the 2006 census was 1.6%.(4) The number of non-Irish nationals in Ireland in April 2011 was recorded as 544,357*.(3) In 2011, the percentage of residents who were non-Irish nationals was 12% compared with 5.8% in 2002.(3)
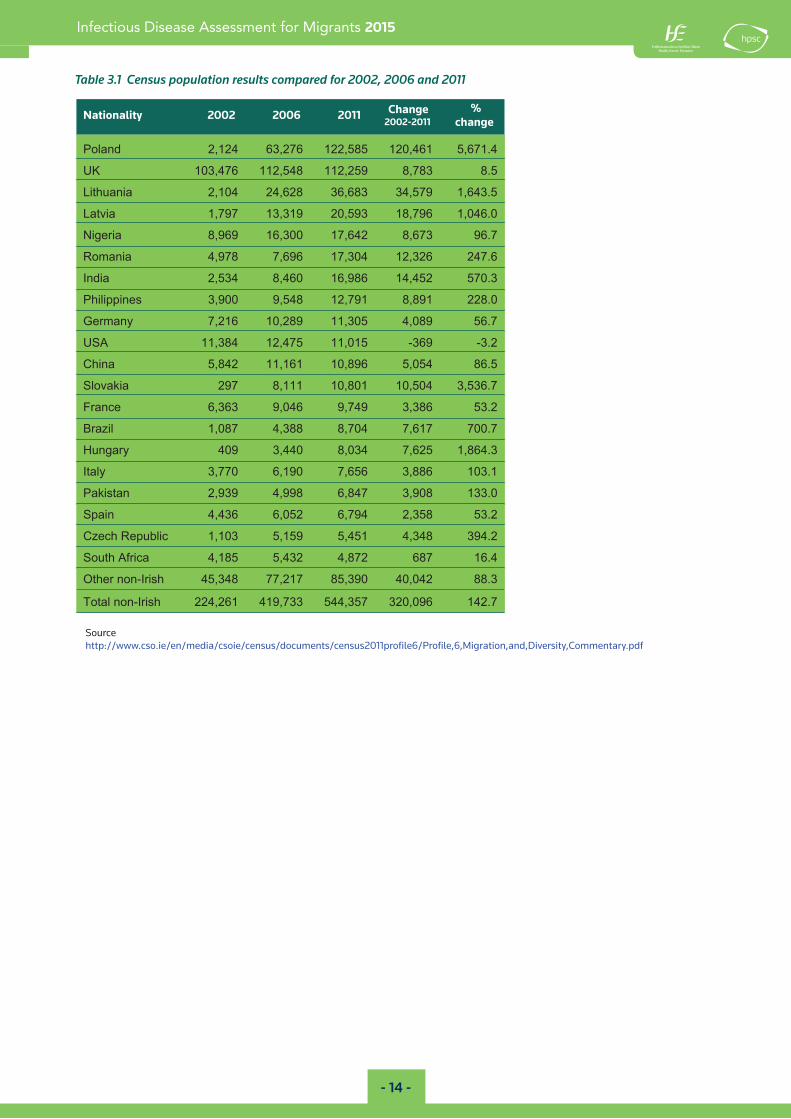
Between 2006 and 2011 there has been an increase of 124,624 in non-Irish nationals living in Ireland.(3) Table 3.1 compares the numbers of non-Irish nationals living in Ireland in 2002, 2006 and 2011. The nationality with the largest increase between 2006 and 2011 was the Polish nationality.(3) Of note, the migrant population in Ireland in 2011 showed a peak single year of age of 30 years with an average age of 32.6 years. Sixty percent of all non-Irish nationals were in the 22-44 age range compared with 32 per cent of Irish nationals.(3)
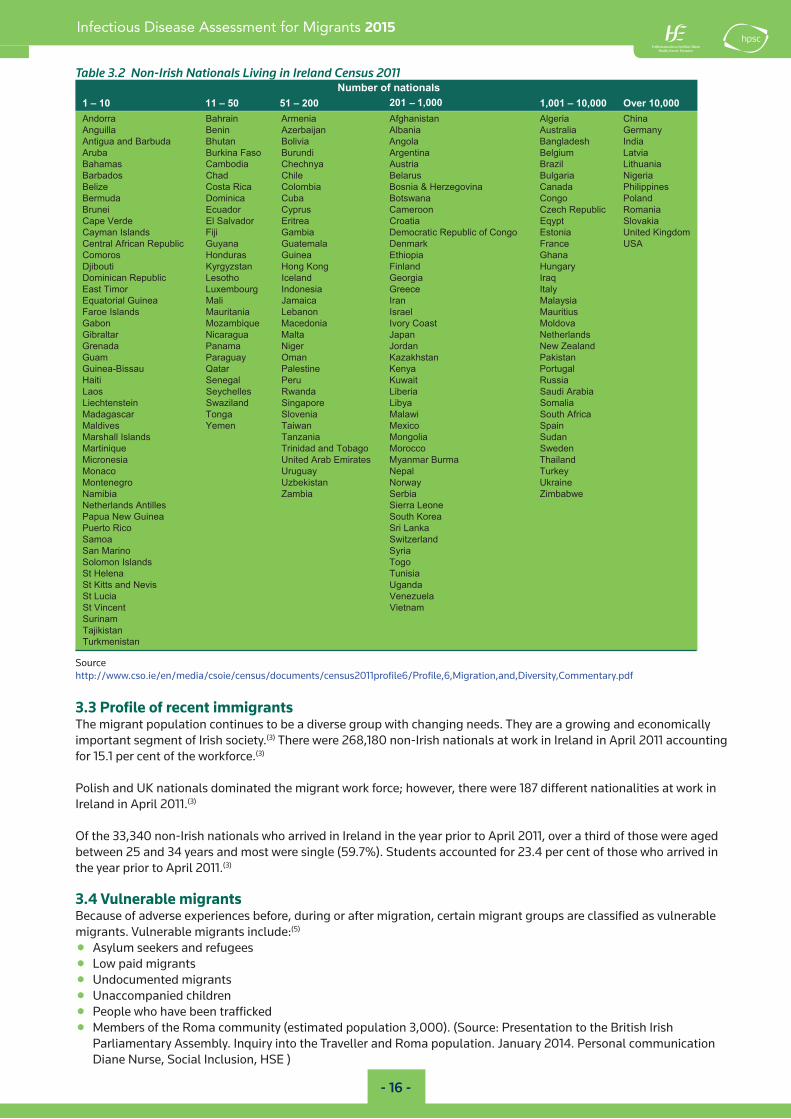
In non-Irish nationals living in Ireland in April 2011, a remarkable diversity of nationalities existed, representing 199 different nations. Figure 3.1 and Table 3.2 show the country of origin of non-Irish nationals living in Ireland in April 2011.
3/Migrant population overview
*The committee is aware that census data may not capture the full extent of the migrant population in Ireland, particularly in terms of vulnerable migrants such as undocumented migrants, those who were trafficked or unaccompanied minors.
- 14 -
Infectious Disease Assessment for Migrants 2015
HSE/hpsc
Table 3.1 Census population results compared for 2002, 2006 and 2011
Nationality 2002 2006 2011 Change2002-2011
%change
Poland 2,124 63,276 122,585 120,461 5,671.4
UK 103,476 112,548 112,259 8,783 8.5
Lithuania 2,104 24,628 36,683 34,579 1,643.5
Latvia 1,797 13,319 20,593 18,796 1,046.0
Nigeria 8,969 16,300 17,642 8,673 96.7
Romania 4,978 7,696 17,304 12,326 247.6
India 2,534 8,460 16,986 14,452 570.3
Philippines 3,900 9,548 12,791 8,891 228.0
Germany 7,216 10,289 11,305 4,089 56.7
USA 11,384 12,475 11,015 -369 -3.2
China 5,842 11,161 10,896 5,054 86.5
Slovakia 297 8,111 10,801 10,504 3,536.7
France 6,363 9,046 9,749 3,386 53.2
Brazil 1,087 4,388 8,704 7,617 700.7
Hungary 409 3,440 8,034 7,625 1,864.3
Italy 3,770 6,190 7,656 3,886 103.1
Pakistan 2,939 4,998 6,847 3,908 133.0
Spain 4,436 6,052 6,794 2,358 53.2
Czech Republic 1,103 5,159 5,451 4,348 394.2
South Africa 4,185 5,432 4,872 687 16.4
Other non-Irish 45,348 77,217 85,390 40,042 88.3
Total non-Irish 224,261 419,733 544,357 320,096 142.7
Sourcehttp://www.cso.ie/en/media/csoie/census/documents/census2011profile6/Profile,6,Migration,and,Diversity,Commentary.pdf

- 15 -
Infectious D
isease Assessm
ent for M
igrants 20
15
Figure 3.1 Non-Irish nationals living in Ireland by country of origin, 2011
Sourcehttp://w
ww
.cso.ie/en/media/csoie/census/docum
ents/census2011profile6/Profile,6,Migration,and,D
iversity,Comm
entary.pdf
- 16 -
Infectious Disease Assessment for Migrants 2015
HSE/hpsc
Table 3.2 Non-Irish Nationals Living in Ireland Census 2011
Number of nationals 1 – 10 11 – 50 51 – 200 201 1,000 1,001 – 10,000 Over 10,000 Andorra Bahrain Armenia anihC aireglA natsinahgfA
ynamreG ailartsuA ainablA najiabrezA nineB alliugnAAntigua and Barbuda Bhutan Bo aidnI hsedalgnaB alognA aivil
aivtaL muigleB anitnegrA idnuruB osaF anikruB aburABahamas Cambodia Chechnya ainauhtiL lizarB airtsuA
airegiN airagluB suraleB elihC dahC sodabraB senippilihP adanaC anivogezreH & ainsoB aibmoloC aciR atsoC ezileB
dnaloP ognoC anawstoB abuC acinimoD adumreBBrunei Ecuador Cyprus Camero ainamoR cilbupeR hcezC no
aikavolS tpyqE aitaorC aertirE rodavlaS lE edreV epaCCayman Islands Fiji Gambia Democratic Republic of Congo Estonia United Kingdom Central African Republic Guyana ASU ecnarF kramneD alametauG
anahG aipoihtE aeniuG sarudnoH soromoC yragnuH dnalniF gnoK gnoH natszygryK ituobijD
Dominican Republic Lesotho qarI aigroeG dnalecI ylatI eceerG aisenodnI gruobmexuL romiT tsaE aisyalaM narI aciamaJ ilaM aeniuG lairotauqE suitiruaM learsI nonabeL ainatiruaM sdnalsI eoraF
Gabon Mozambique Macedonia avodloM tsaoC yrovIGibraltar Nicaragua Ma sdnalrehteN napaJ atl
dnalaeZ weN nadroJ regiN amanaP adanerG natsikaP natshkazaK namO yaugaraP mauG lagutroP ayneK enitselaP rataQ uassiB-aeniuG aissuR tiawuK ureP lageneS itiaH aibarA iduaS airebiL adnawR sellehcyeS soaL ailamoS aybiL eropagniS dnalizawS nietsnethceiL acirfA htuoS iwalaM ainevolS agnoT racsagadaM niapS ocixeM nawiaT nemeY sevidlaM naduS ailognoM ainaznaT sdnalsI llahsraM nedewS occoroM ogaboT dna dadinirT euqinitraM
Micronesia United Arab Emirates Myanmar Burma Thailand yekruT lapeN yaugurU ocanoM eniarkU yawroN natsikebzU orgenetnoM ewbabmiZ aibreS aibmaZ aibimaN enoeL arreiS sellitnA sdnalrehteN aeroK htuoS aeniuG weN aupaP aknaL irS ociR otreuP dnalreztiwS aomaS airyS oniraM naS ogoT sdnalsI nomoloS aisinuT aneleH tS adnagU siveN dna sttiK tS aleuzeneV aicuL tS manteiV tnecniV tS maniruS natsikijaT natsinemkruT
–
Sourcehttp://www.cso.ie/en/media/csoie/census/documents/census2011profile6/Profile,6,Migration,and,Diversity,Commentary.pdf
3.3 Profile of recent immigrantsThe migrant population continues to be a diverse group with changing needs. They are a growing and economically important segment of Irish society.(3) There were 268,180 non-Irish nationals at work in Ireland in April 2011 accounting for 15.1 per cent of the workforce.(3)
Polish and UK nationals dominated the migrant work force; however, there were 187 different nationalities at work in Ireland in April 2011.(3)
Of the 33,340 non-Irish nationals who arrived in Ireland in the year prior to April 2011, over a third of those were aged between 25 and 34 years and most were single (59.7%). Students accounted for 23.4 per cent of those who arrived in the year prior to April 2011.(3)
3.4 Vulnerable migrantsBecause of adverse experiences before, during or after migration, certain migrant groups are classified as vulnerable migrants. Vulnerable migrants include:(5)
=Asylum seekers and refugees=Low paid migrants=Undocumented migrants=Unaccompanied children=People who have been trafficked=Members of the Roma community (estimated population 3,000). (Source: Presentation to the British Irish
Parliamentary Assembly. Inquiry into the Traveller and Roma population. January 2014. Personal communication Diane Nurse, Social Inclusion, HSE )
- 17 -
Infectious Disease Assessment for Migrants 2015
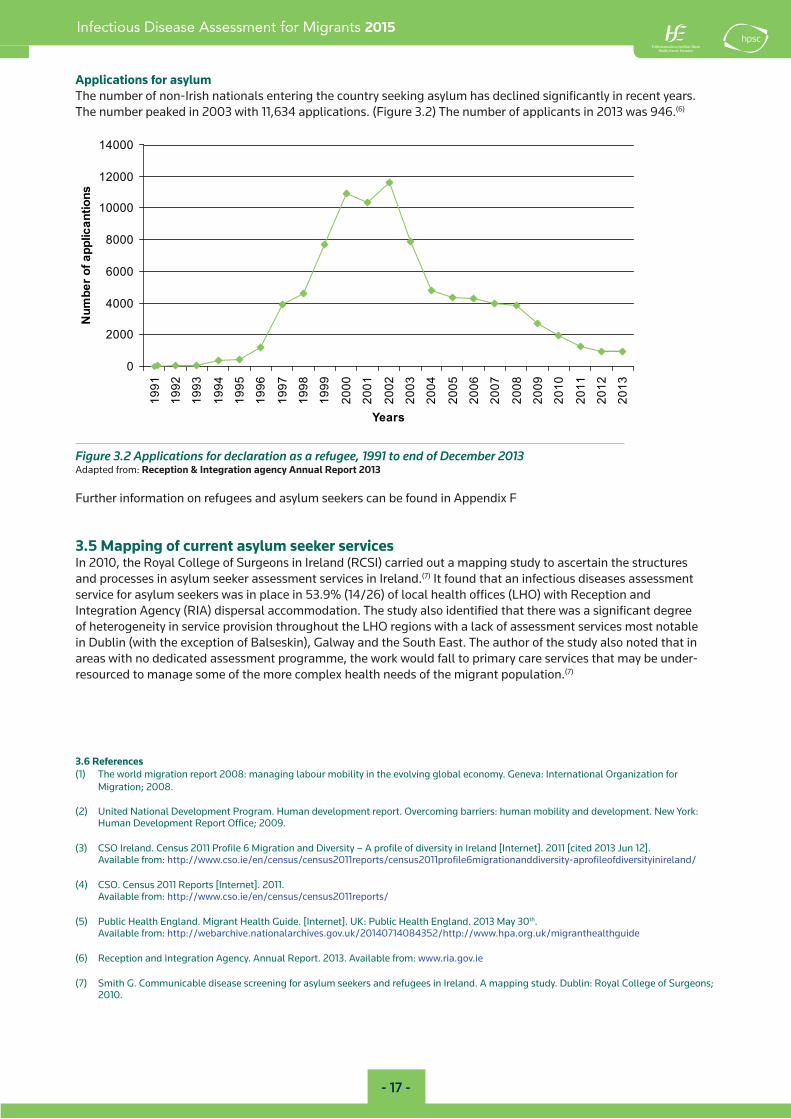
Applications for asylumThe number of non-Irish nationals entering the country seeking asylum has declined significantly in recent years. The number peaked in 2003 with 11,634 applications. (Figure 3.2) The number of applicants in 2013 was 946.(6)
0
2000
4000
6000
8000
10000
12000
1400019
91
1992
1993
1994
1995
1996
1997
1998
1999
2000
2001
2002
2003
2004
2005
2006
2007
2008
2009
2010
2011
2012
2013
Years
Num
ber o
f app
lican
tions
Figure 3.2 Applications for declaration as a refugee, 1991 to end of December 2013 Adapted from: Reception & Integration agency Annual Report 2013
Further information on refugees and asylum seekers can be found in Appendix F
3.5 Mapping of current asylum seeker servicesIn 2010, the Royal College of Surgeons in Ireland (RCSI) carried out a mapping study to ascertain the structures and processes in asylum seeker assessment services in Ireland.(7) It found that an infectious diseases assessment service for asylum seekers was in place in 53.9% (14/26) of local health offices (LHO) with Reception and Integration Agency (RIA) dispersal accommodation. The study also identified that there was a significant degree of heterogeneity in service provision throughout the LHO regions with a lack of assessment services most notable in Dublin (with the exception of Balseskin), Galway and the South East. The author of the study also noted that in areas with no dedicated assessment programme, the work would fall to primary care services that may be under-resourced to manage some of the more complex health needs of the migrant population.(7)
3.6 References(1) The world migration report 2008: managing labour mobility in the evolving global economy. Geneva: International Organization for
Migration; 2008.
(2) United National Development Program. Human development report. Overcoming barriers: human mobility and development. New York: Human Development Report Office; 2009.
(3) CSO Ireland. Census 2011 Profile 6 Migration and Diversity – A profile of diversity in Ireland [Internet]. 2011 [cited 2013 Jun 12]. Available from: http://www.cso.ie/en/census/census2011reports/census2011profile6migrationanddiversity-aprofileofdiversityinireland/
(4) CSO. Census 2011 Reports [Internet]. 2011. Available from: http://www.cso.ie/en/census/census2011reports/
(5) Public Health England. Migrant Health Guide. [Internet]. UK: Public Health England. 2013 May 30th. Available from: http://webarchive.nationalarchives.gov.uk/20140714084352/http://www.hpa.org.uk/migranthealthguide
(6) Reception and Integration Agency. Annual Report. 2013. Available from: www.ria.gov.ie
(7) Smith G. Communicable disease screening for asylum seekers and refugees in Ireland. A mapping study. Dublin: Royal College of Surgeons; 2010.
- 74 -
Infectious Disease Assessment for Migrants 2015
HSE/hpsc
Appendix G. Refugees and asylum seekers
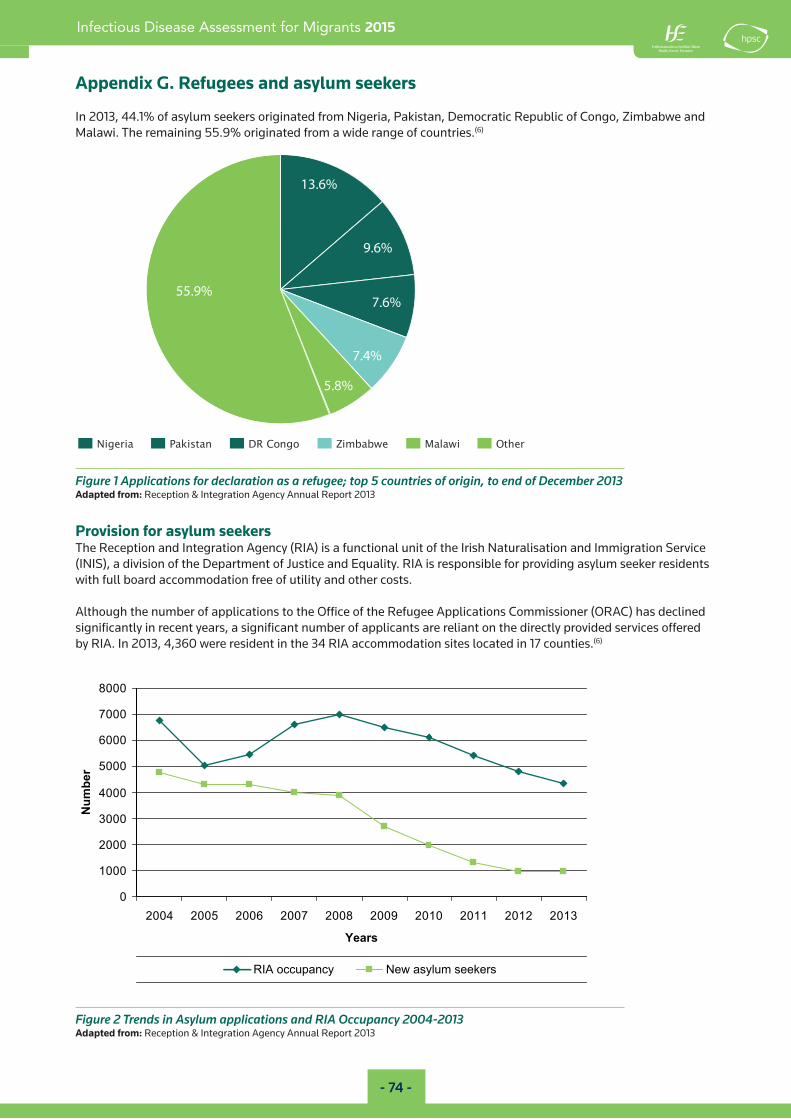
In 2013, 44.1% of asylum seekers originated from Nigeria, Pakistan, Democratic Republic of Congo, Zimbabwe and Malawi. The remaining 55.9% originated from a wide range of countries.(6)
55.9%
13.6%
9.6%
7.6%
7.4%
5.8%
Nigeria Pakistan DR Congo Zimbabwe Malawi Other
Figure 1 Applications for declaration as a refugee; top 5 countries of origin, to end of December 2013Adapted from: Reception & Integration Agency Annual Report 2013
Provision for asylum seekers The Reception and Integration Agency (RIA) is a functional unit of the Irish Naturalisation and Immigration Service (INIS), a division of the Department of Justice and Equality. RIA is responsible for providing asylum seeker residents with full board accommodation free of utility and other costs.
Although the number of applications to the Office of the Refugee Applications Commissioner (ORAC) has declined significantly in recent years, a significant number of applicants are reliant on the directly provided services offered by RIA. In 2013, 4,360 were resident in the 34 RIA accommodation sites located in 17 counties.(6)
0
1000
2000
3000
4000
5000
6000
7000
8000
2004 2005 2006 2007 2008 2009 2010 2011 2012 2013
Years
Num
ber
RIA occupancy New asylum seekers
Figure 2 Trends in Asylum applications and RIA Occupancy 2004-2013Adapted from: Reception & Integration Agency Annual Report 2013
- 75 -
Infectious Disease Assessment for Migrants 2015
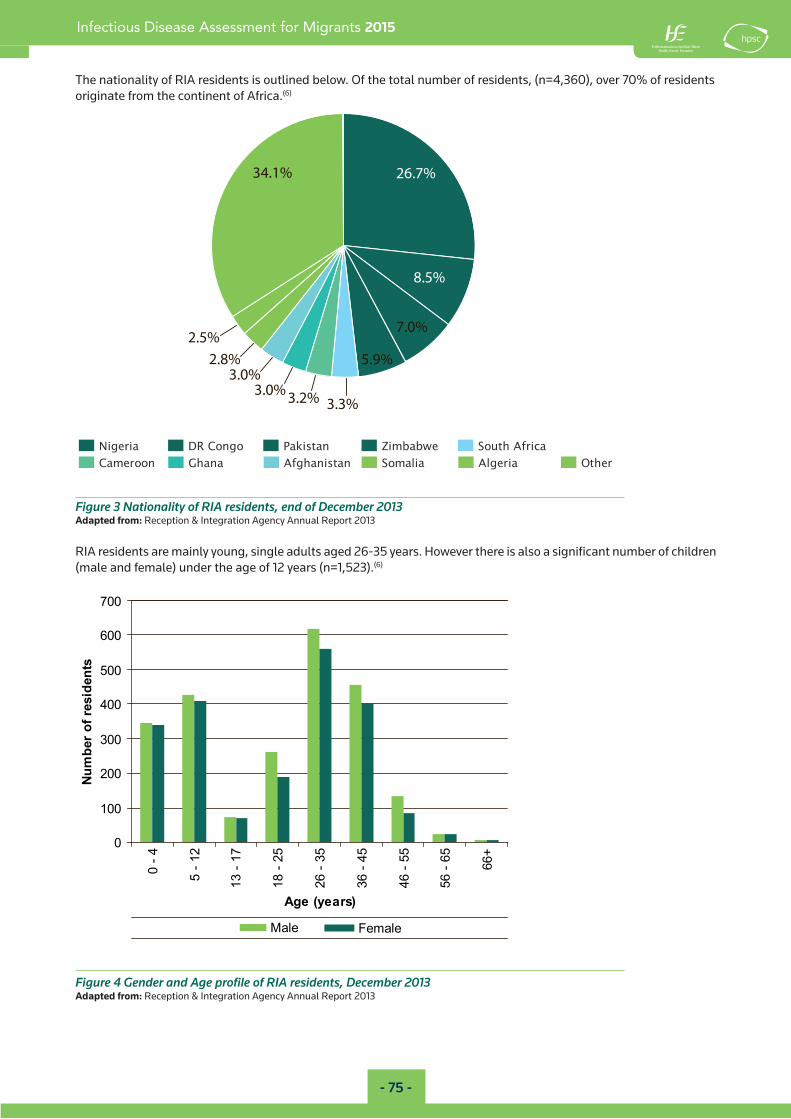
The nationality of RIA residents is outlined below. Of the total number of residents, (n=4,360), over 70% of residents originate from the continent of Africa.(6)
Nigeria DR Congo Pakistan Zimbabwe South AfricaCameroon Ghana Afghanistan Somalia Algeria Other
34.1%
2.5%2.8%
3.0%3.0%3.2% 3.3%
26.7%
8.5%
7.0%
5.9%
Figure 3 Nationality of RIA residents, end of December 2013Adapted from: Reception & Integration Agency Annual Report 2013
RIA residents are mainly young, single adults aged 26-35 years. However there is also a significant number of children (male and female) under the age of 12 years (n=1,523).(6)
0
100
200
300
400
500
600
700
0 - 4
5 - 1
2
13 -
17
18 -
25
26 -
35
36 -
45
46 -
55
56 -
65 66+
Age (years)
Num
ber
of r
esid
ents
Male Female
Figure 4 Gender and Age profile of RIA residents, December 2013Adapted from: Reception & Integration Agency Annual Report 2013


![Montreal G Molleman definitieve versie.ppt [Alleen-lezen] The Netherlands (2005 data) • Population: 16.305.526 • included migrants: 3.130.661 • Urbanisation 41,5% • Inhabitants/km2](https://img.pdfslide.us/doc/110x75/5f842c7e0f54237eab520fc7/montreal-g-molleman-definitieve-alleen-lezen-the-netherlands-2005-data-a-population.jpg)