Embed Size (px)
Citation preview
Mi#ga#ng climate risks on the farm: tree nut
perspec#ve DavidDoll
TreeNutPomologyAdvisorUCCEMerced
Let’s Talk About the Weather…
“Somethingwecan’tcontrol,but….“somethinginwhichwehavetomanage.”
“Itimpactseverythingwedo.”
“Theycantevengettheweatherright,howcantheypredictclimate?”
Let’s Talk About the Climate…
VariousforecasJngmodelsareaddingtotheconfusion;Noabilitytodeterminelongrangeforecasts;Lackofconcernforthelongtermduetoday-to-dayoperaJonmanagement. Inmanycases,notmuchcanbedone
onaday-to-daybasistomanage.
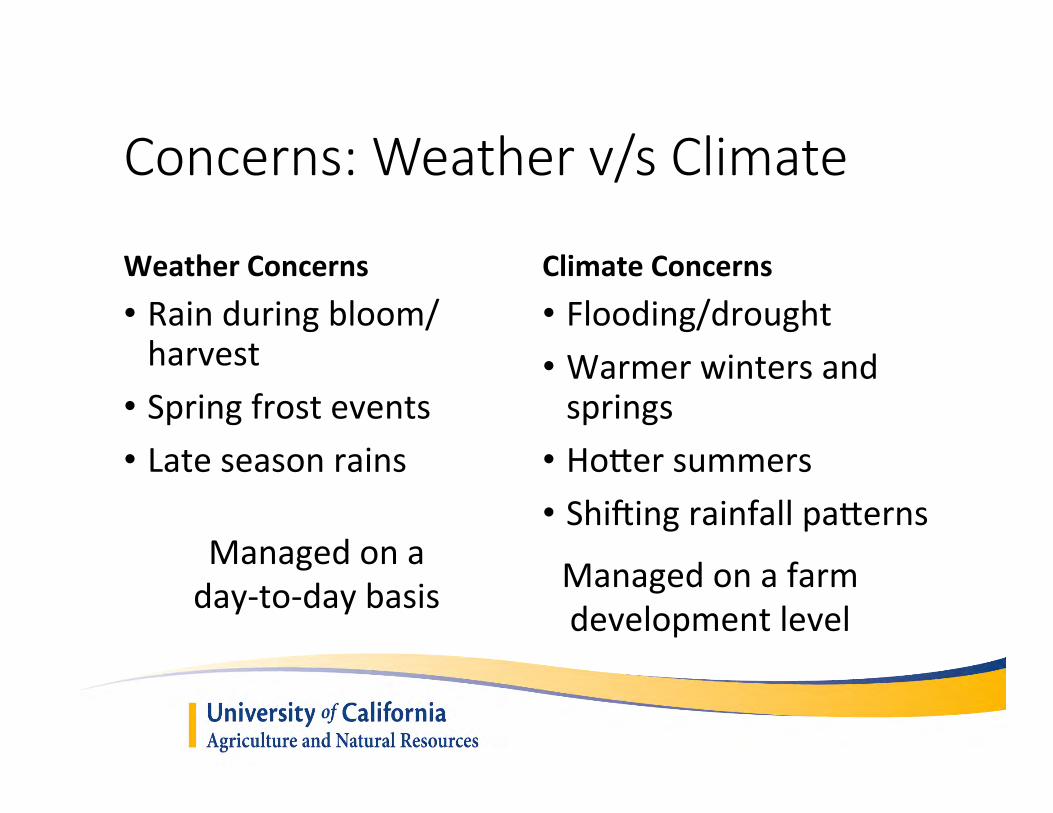
Concerns: Weather v/s Climate
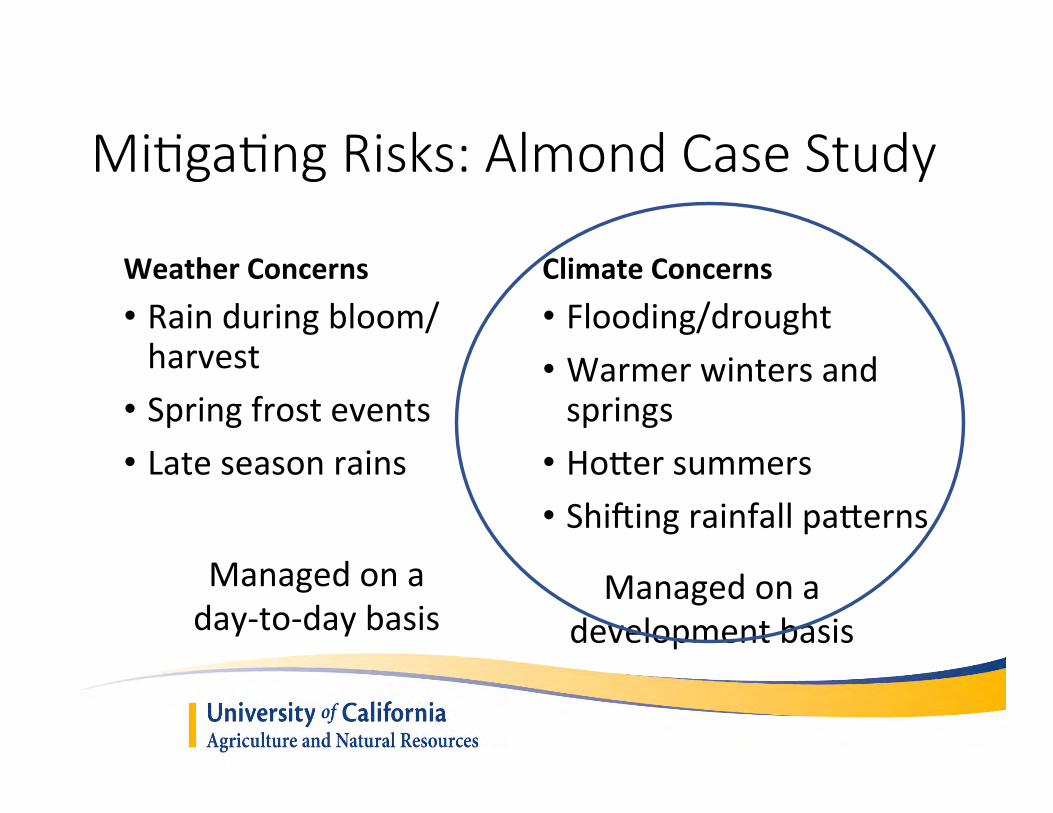
WeatherConcerns• Rainduringbloom/harvest• Springfrostevents• Lateseasonrains
ClimateConcerns• Flooding/drought• Warmerwintersandsprings• HoTersummers• ShiUingrainfallpaTerns
Managedonaday-to-daybasis
Managedonafarmdevelopmentlevel
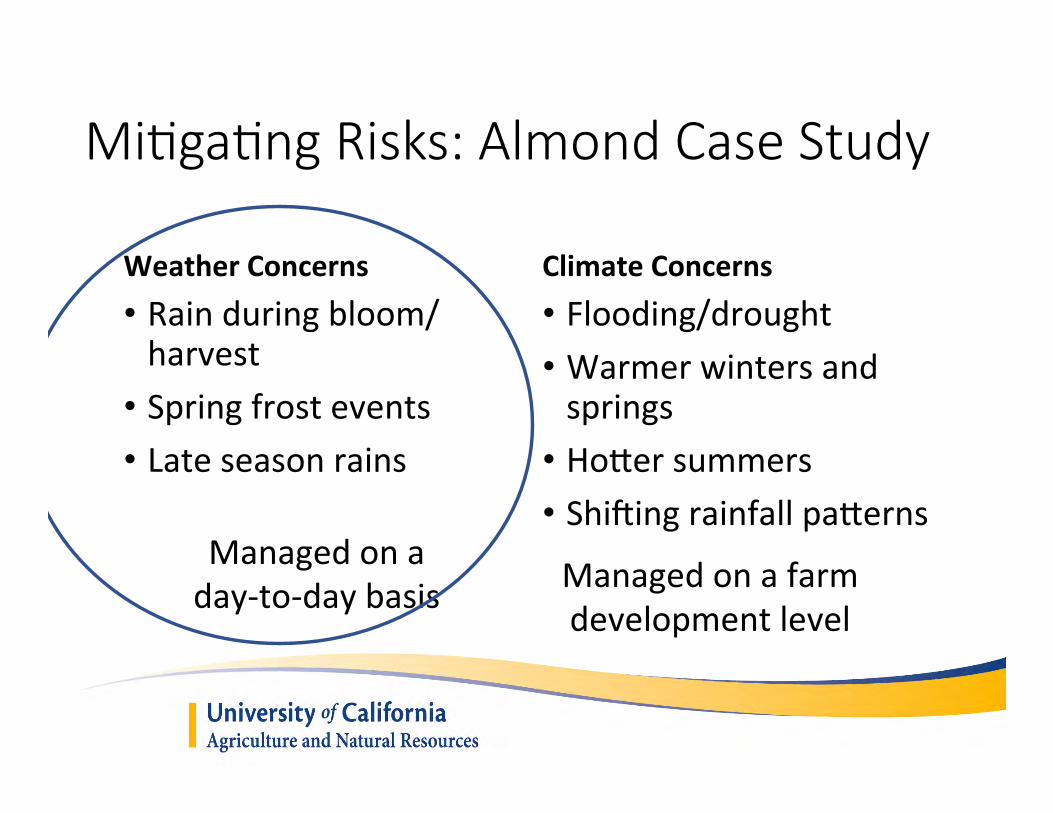
WeatherConcerns• Rainduringbloom/harvest• Springfrostevents• Lateseasonrains
ClimateConcerns• Flooding/drought• Warmerwintersandsprings• HoTersummers• ShiUingrainfallpaTerns
Managedonaday-to-daybasis
Managedonafarmdevelopmentlevel
Mi#ga#ng Risks: Almond Case Study
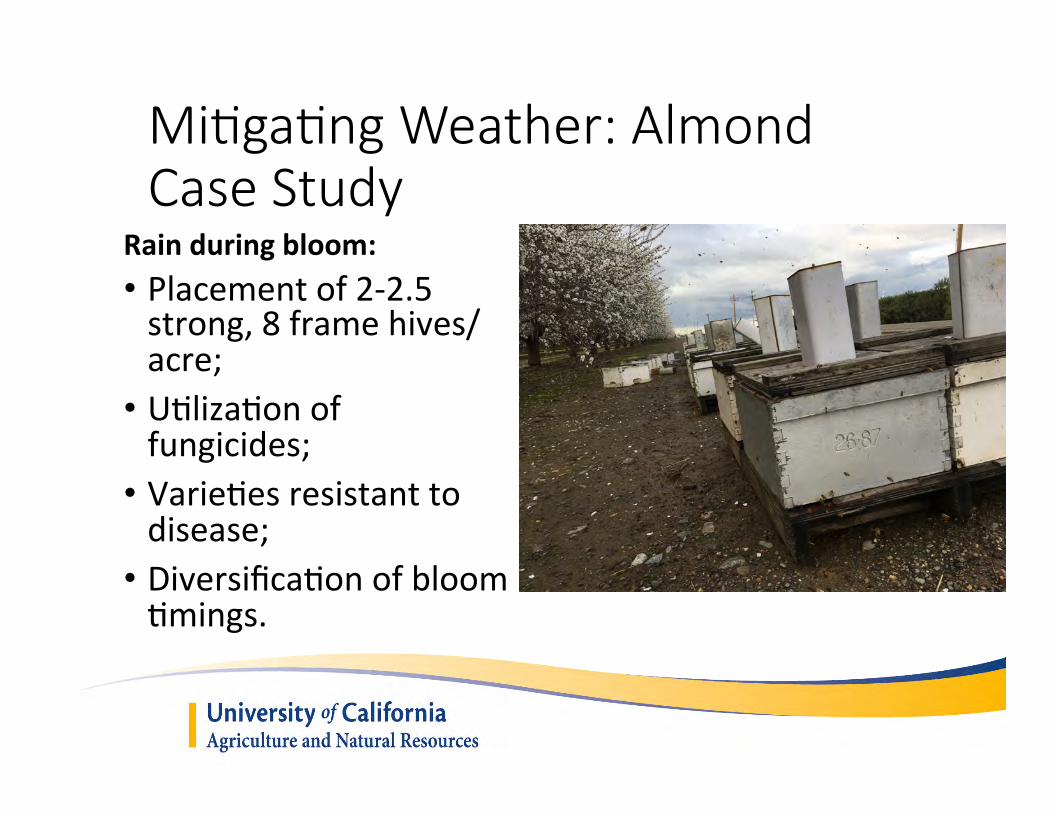
Mi#ga#ng Weather: Almond Case Study
Rainduringbloom:• Placementof2-2.5strong,8framehives/acre;• UJlizaJonoffungicides;• VarieJesresistanttodisease;• DiversificaJonofbloomJmings.
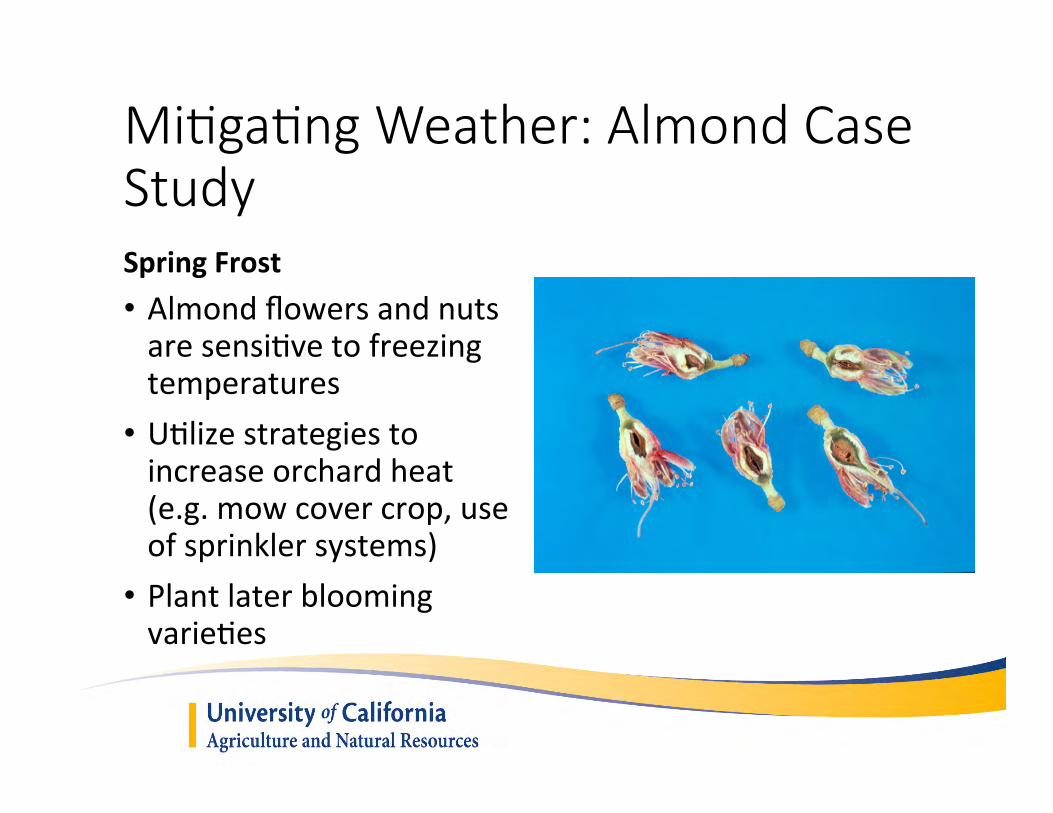
SpringFrost• AlmondflowersandnutsaresensiJvetofreezingtemperatures• UJlizestrategiestoincreaseorchardheat(e.g.mowcovercrop,useofsprinklersystems)• PlantlaterbloomingvarieJes
Mi#ga#ng Weather: Almond Case Study
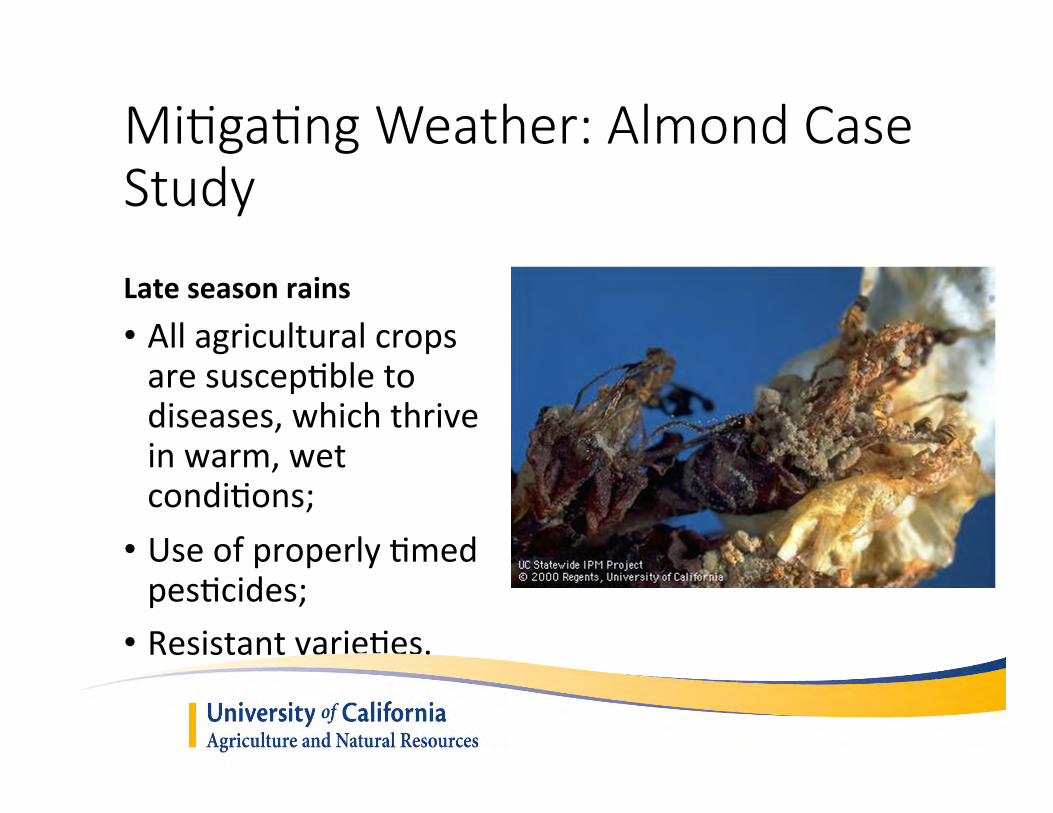
Lateseasonrains• AllagriculturalcropsaresuscepJbletodiseases,whichthriveinwarm,wetcondiJons;• UseofproperlyJmedpesJcides;• ResistantvarieJes.
Mi#ga#ng Weather: Almond Case Study
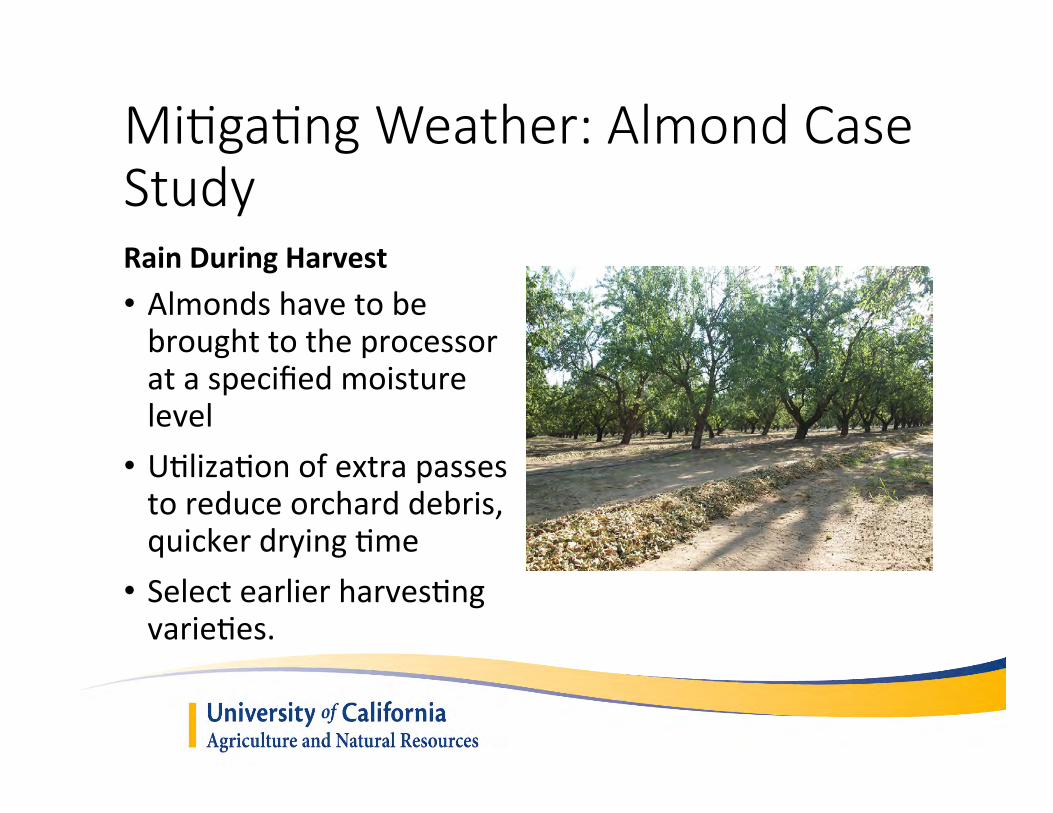
RainDuringHarvest• Almondshavetobebroughttotheprocessorataspecifiedmoisturelevel• UJlizaJonofextrapassestoreduceorcharddebris,quickerdryingJme• SelectearlierharvesJngvarieJes.
Mi#ga#ng Weather: Almond Case Study
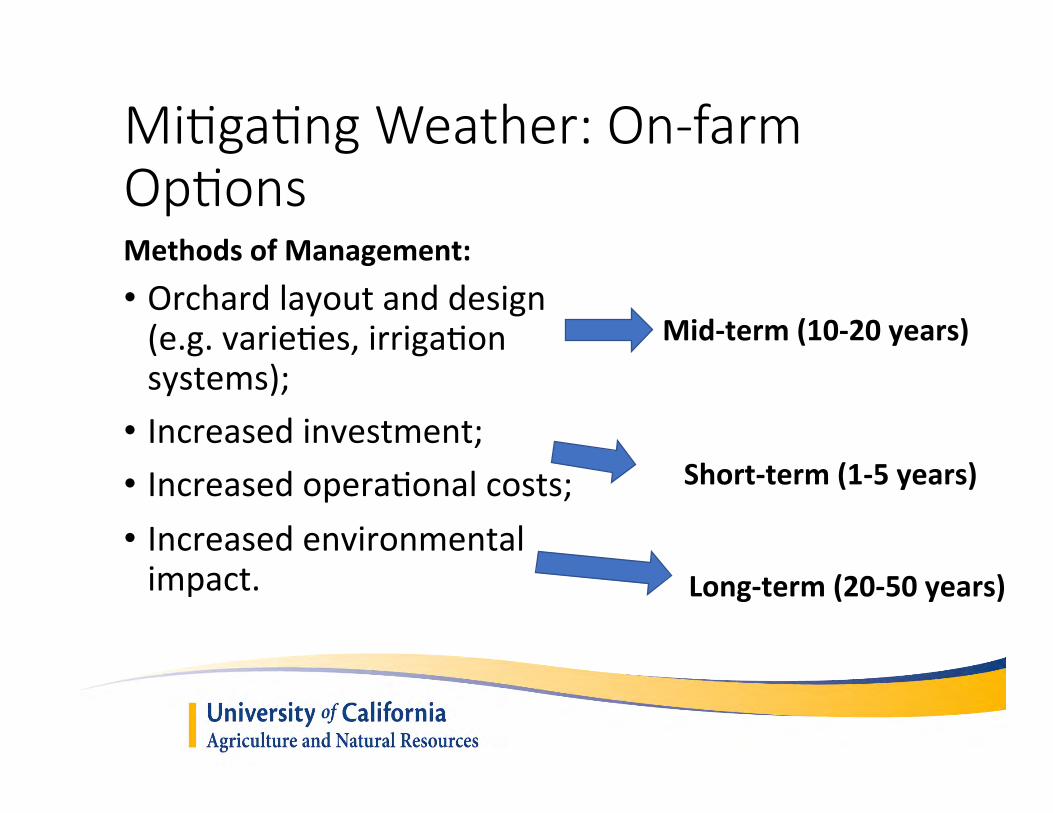
MethodsofManagement:• Orchardlayoutanddesign(e.g.varieJes,irrigaJonsystems);• Increasedinvestment;• IncreasedoperaJonalcosts;• Increasedenvironmentalimpact.
Mid-term(10-20years)
Mi#ga#ng Weather: On-farm Op#ons
Short-term(1-5years)
Long-term(20-50years)
WeatherConcerns• Rainduringbloom/harvest• Springfrostevents• Lateseasonrains
ClimateConcerns• Flooding/drought• Warmerwintersandsprings• HoTersummers• ShiUingrainfallpaTerns
Managedonaday-to-daybasis
Managedonadevelopmentbasis
Mi#ga#ng Risks: Almond Case Study
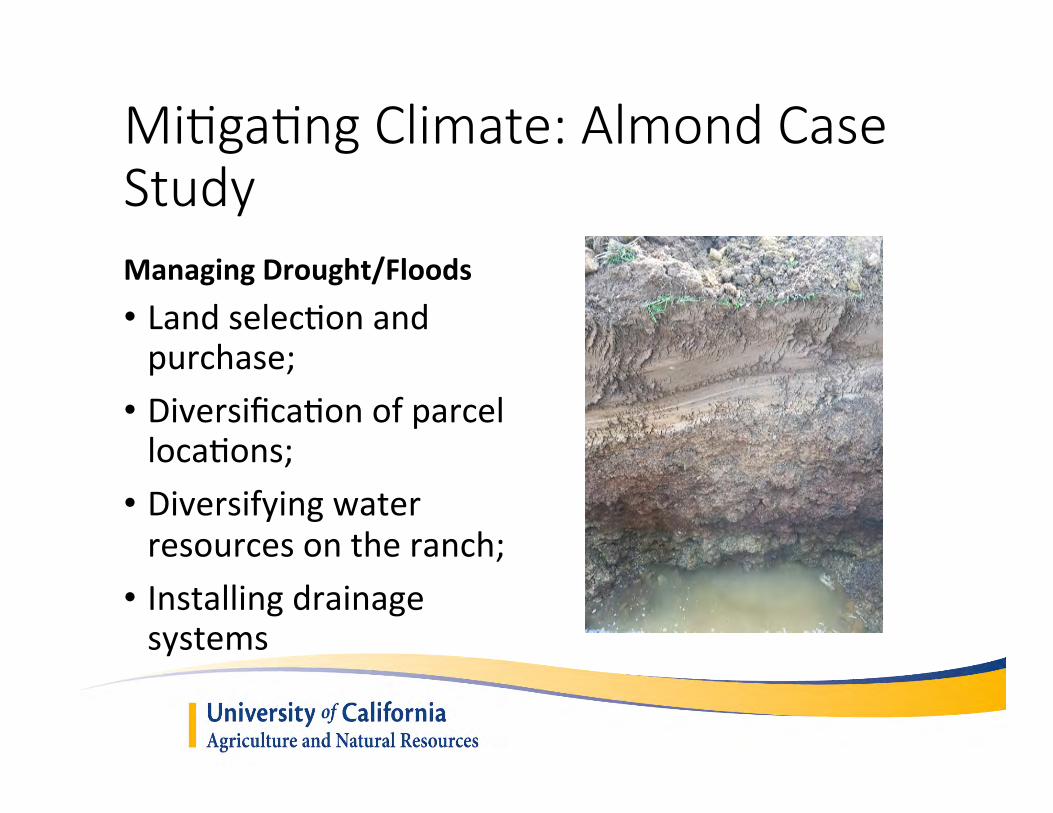
ManagingDrought/Floods• LandselecJonandpurchase;• DiversificaJonofparcellocaJons;• Diversifyingwaterresourcesontheranch;• Installingdrainagesystems
Mi#ga#ng Climate: Almond Case Study
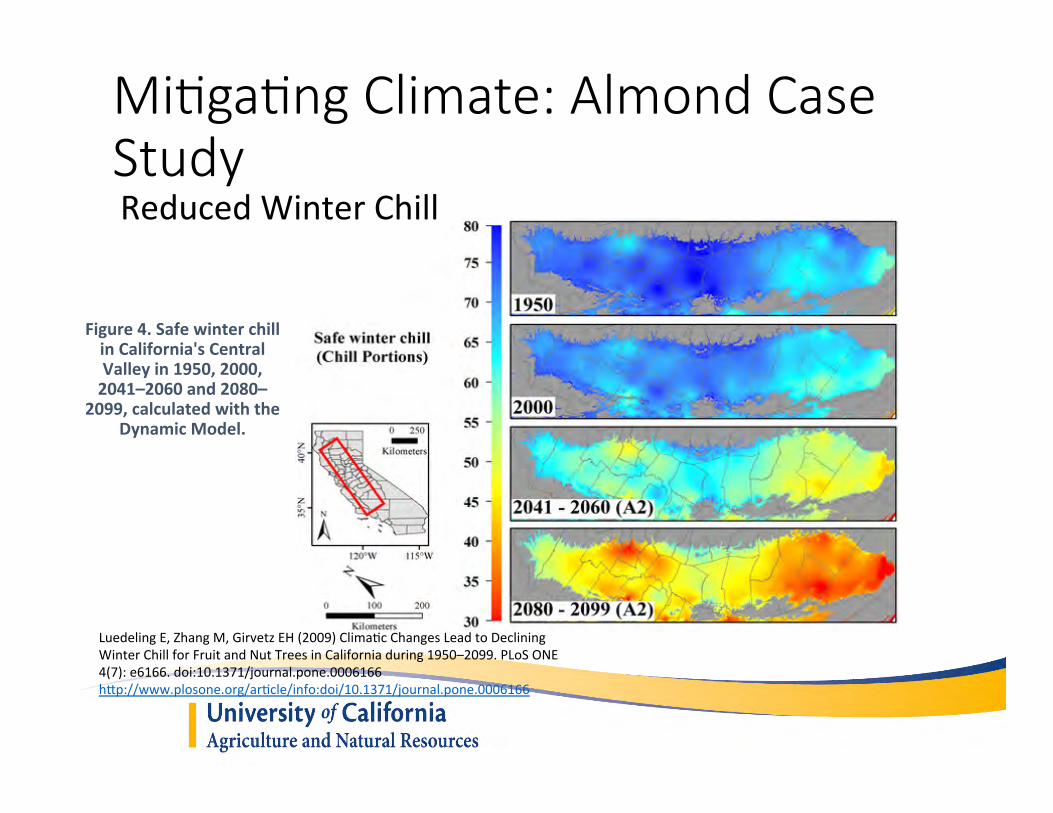
Figure4.SafewinterchillinCalifornia'sCentralValleyin1950,2000,2041–2060and2080–
2099,calculatedwiththeDynamicModel.
Mi#ga#ng Climate: Almond Case Study ReducedWinterChill
LuedelingE,ZhangM,GirvetzEH(2009)ClimaJcChangesLeadtoDecliningWinterChillforFruitandNutTreesinCaliforniaduring1950–2099.PLoSONE4(7):e6166.doi:10.1371/journal.pone.0006166hTp://www.plosone.org/arJcle/info:doi/10.1371/journal.pone.0006166
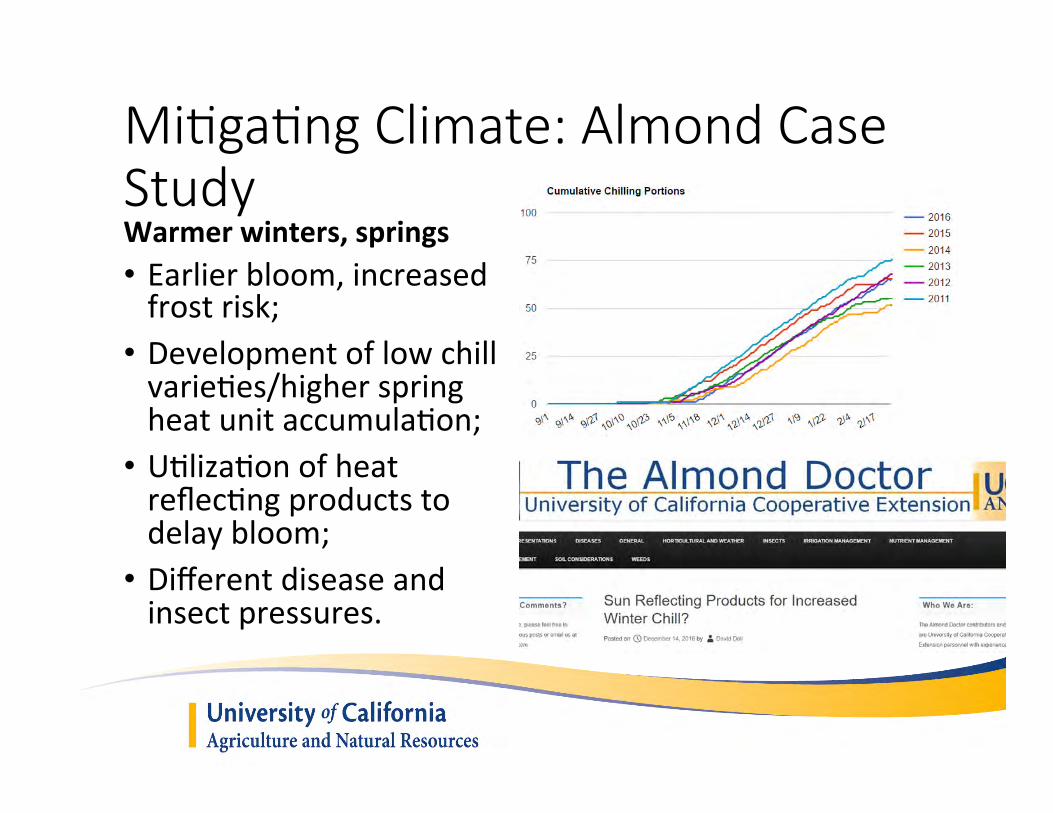
Mi#ga#ng Climate: Almond Case Study Warmerwinters,springs• Earlierbloom,increasedfrostrisk;• DevelopmentoflowchillvarieJes/higherspringheatunitaccumulaJon;• UJlizaJonofheatreflecJngproductstodelaybloom;• Differentdiseaseandinsectpressures.
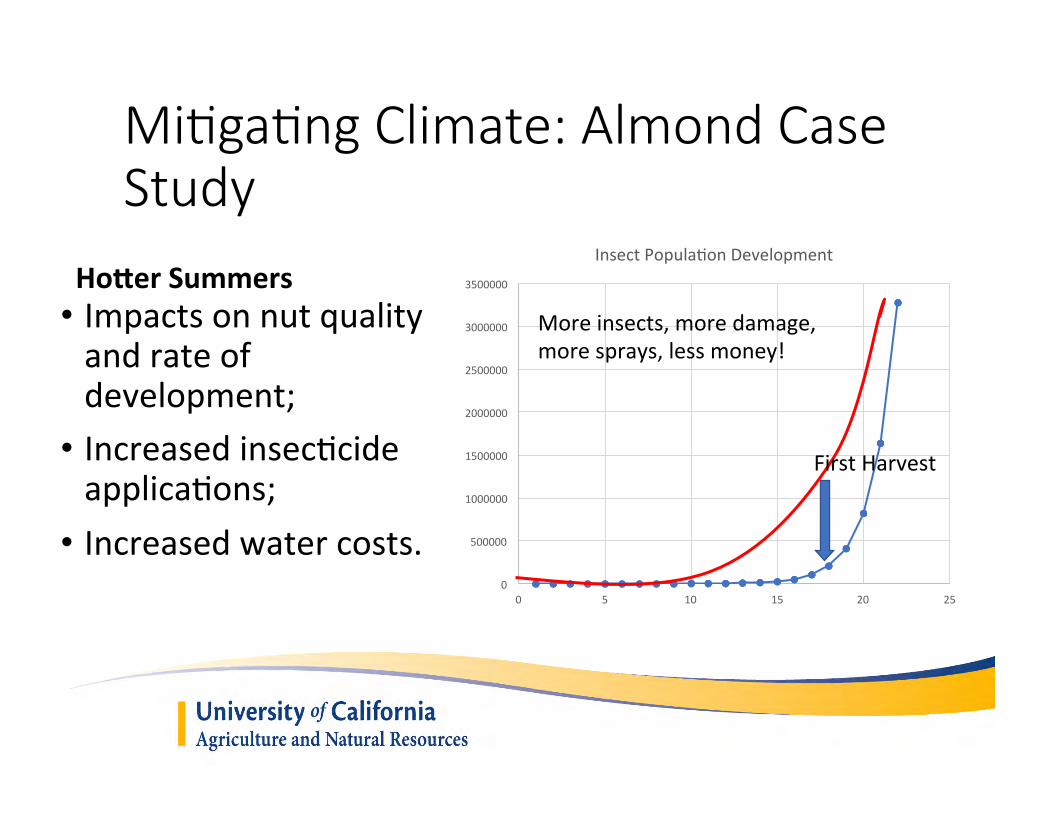
HoRerSummers• Impactsonnutqualityandrateofdevelopment;• IncreasedinsecJcideapplicaJons;• Increasedwatercosts.
Mi#ga#ng Climate: Almond Case Study
0
500000
1000000
1500000
2000000
2500000
3000000
3500000
0 5 10 15 20 25
InsectPopulaJonDevelopment
FirstHarvest
Moreinsects,moredamage,moresprays,lessmoney!
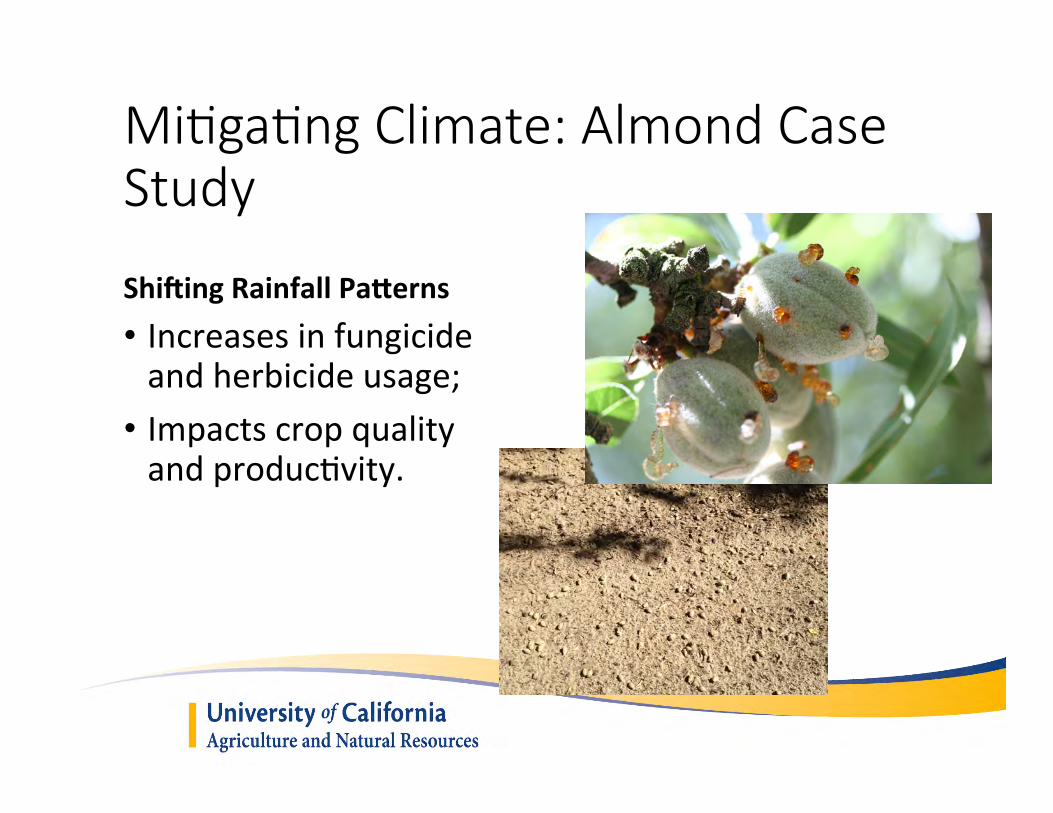
ShiSingRainfallPaRerns• Increasesinfungicideandherbicideusage;• ImpactscropqualityandproducJvity.
Mi#ga#ng Climate: Almond Case Study

MethodsofManagement:• BreedingofvarieJes;• Increasedcapitaloutlay;• Increasedfarmingcosts(sprays,chillingopJons);• Choiceofcrop.
Long(20-50years)
Mi#ga#ng Climate: On-farm Op#ons
Medium(10-20years)
Short/Medium(5-20years)
Medium/Long(10-50years)
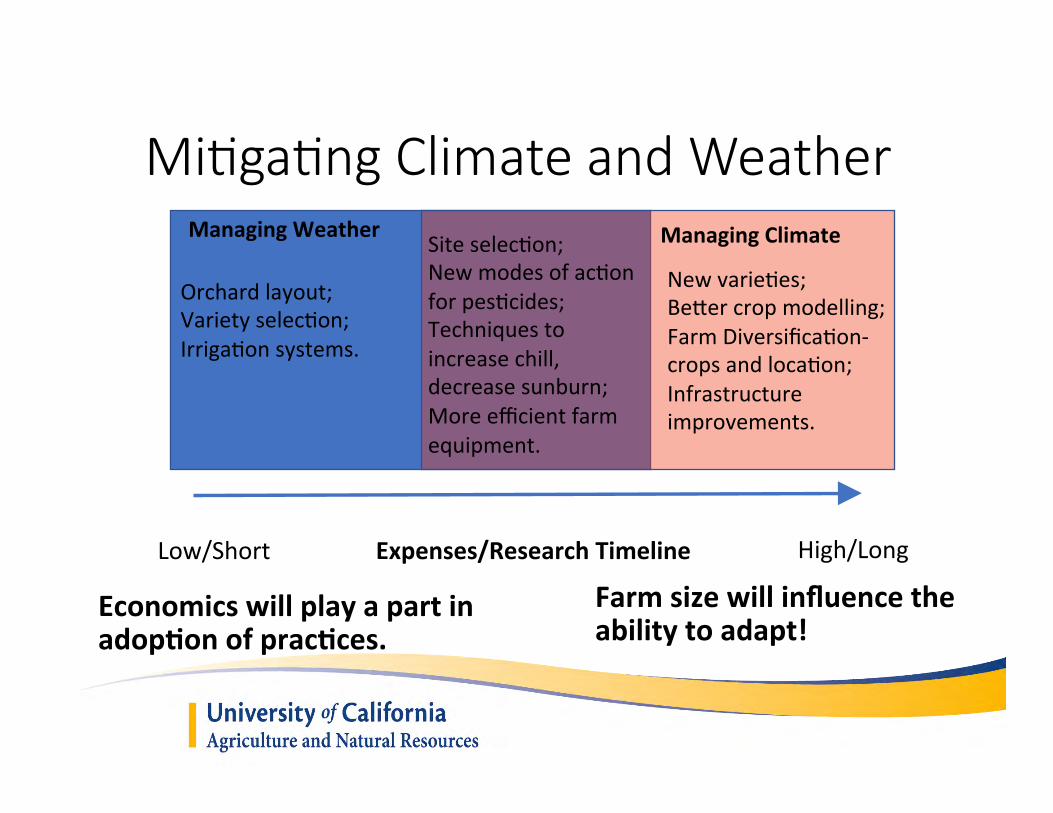
Mi#ga#ng Climate and Weather
Farmsizewillinfluencetheabilitytoadapt!
Expenses/ResearchTimeline High/LongLow/Short
ManagingWeather ManagingClimate
NewvarieJes;BeTercropmodelling;FarmDiversificaJon-cropsandlocaJon;Infrastructureimprovements.
SiteselecJon;NewmodesofacJonforpesJcides;Techniquestoincreasechill,decreasesunburn;Moreefficientfarmequipment.
Orchardlayout;VarietyselecJon;IrrigaJonsystems.
Economicswillplayapartinadop[onofprac[ces.
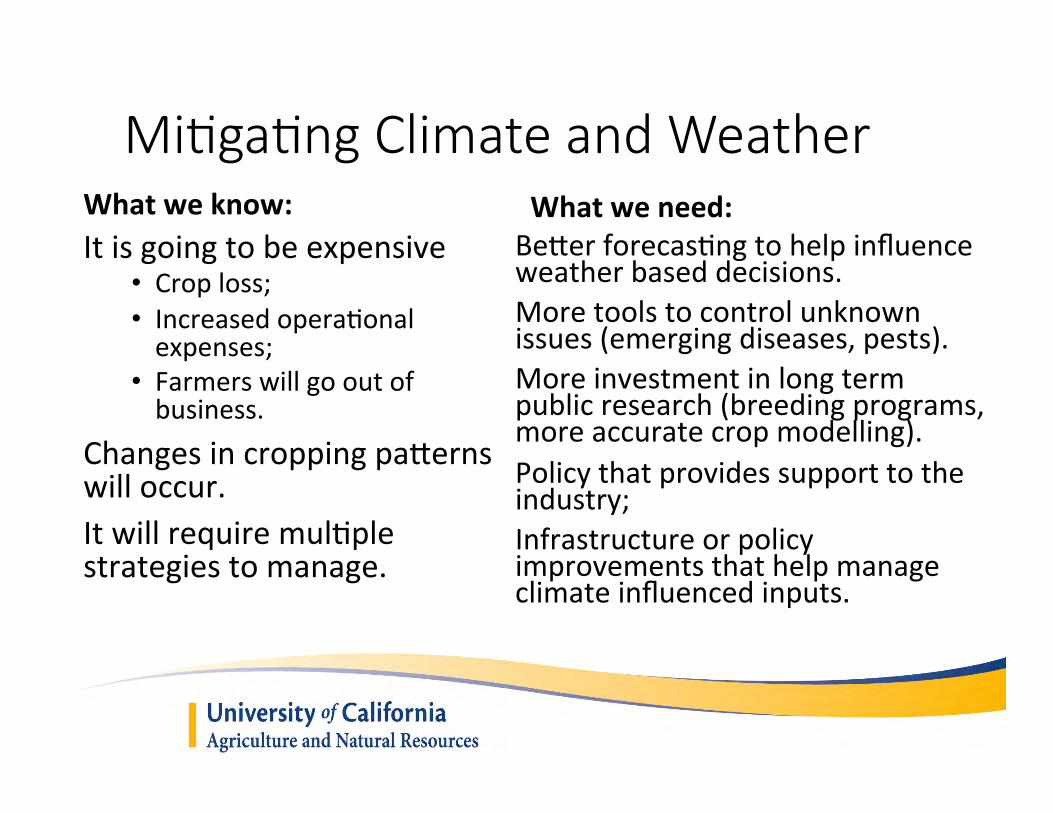
Whatweknow:Itisgoingtobeexpensive
• Croploss;• IncreasedoperaJonalexpenses;
• Farmerswillgooutofbusiness.
ChangesincroppingpaTernswilloccur.ItwillrequiremulJplestrategiestomanage.
Whatweneed:BeTerforecasJngtohelpinfluenceweatherbaseddecisions.Moretoolstocontrolunknownissues(emergingdiseases,pests).Moreinvestmentinlongtermpublicresearch(breedingprograms,moreaccuratecropmodelling).Policythatprovidessupporttotheindustry;Infrastructureorpolicyimprovementsthathelpmanageclimateinfluencedinputs.
Mi#ga#ng Climate and Weather
Climate Impacts on California Agriculture and Tools for Managing Risks
Tapan Pathak, Ph.D. Cooperative Extension Specialist- Climate Adaptation in Agriculture University of California Merced
Email: [email protected]
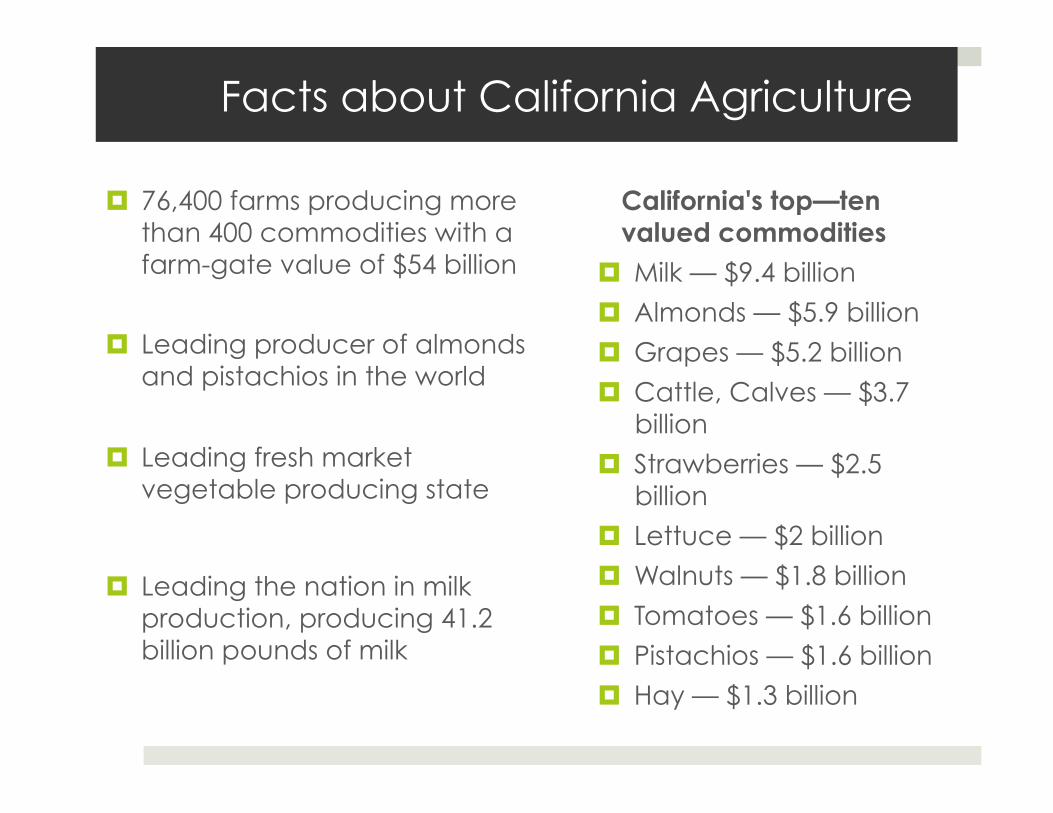
Facts about California Agriculture
¤ 76,400 farms producing more than 400 commodities with a farm-gate value of $54 billion
¤ Leading producer of almonds and pistachios in the world
¤ Leading fresh market vegetable producing state
¤ Leading the nation in milk production, producing 41.2 billion pounds of milk
California's top—ten valued commodities
¤ Milk — $9.4 billion
¤ Almonds — $5.9 billion
¤ Grapes — $5.2 billion
¤ Cattle, Calves — $3.7 billion
¤ Strawberries — $2.5 billion
¤ Lettuce — $2 billion
¤ Walnuts — $1.8 billion
¤ Tomatoes — $1.6 billion
¤ Pistachios — $1.6 billion
¤ Hay — $1.3 billion
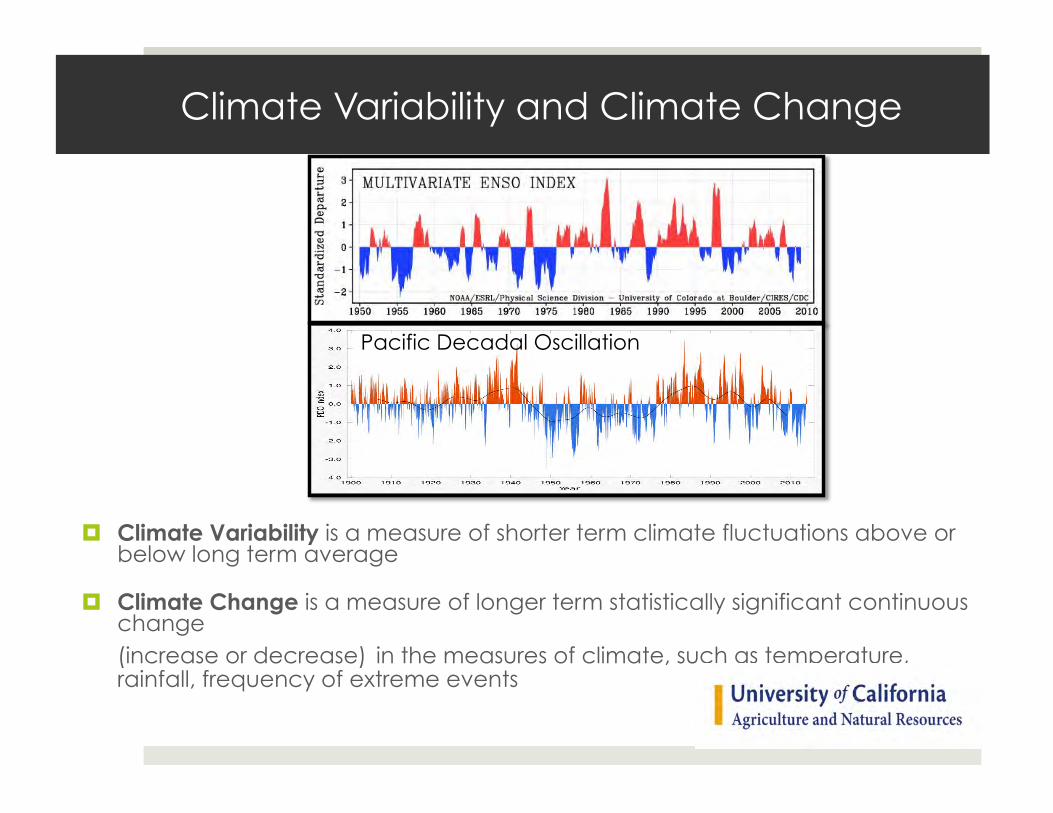
Climate Variability and Climate Change
¤ Climate Variability is a measure of shorter term climate fluctuations above or below long term average
¤ Climate Change is a measure of longer term statistically significant continuous change (increase or decrease) in the measures of climate, such as temperature, rainfall, frequency of extreme events
Pacific Decadal Oscillation
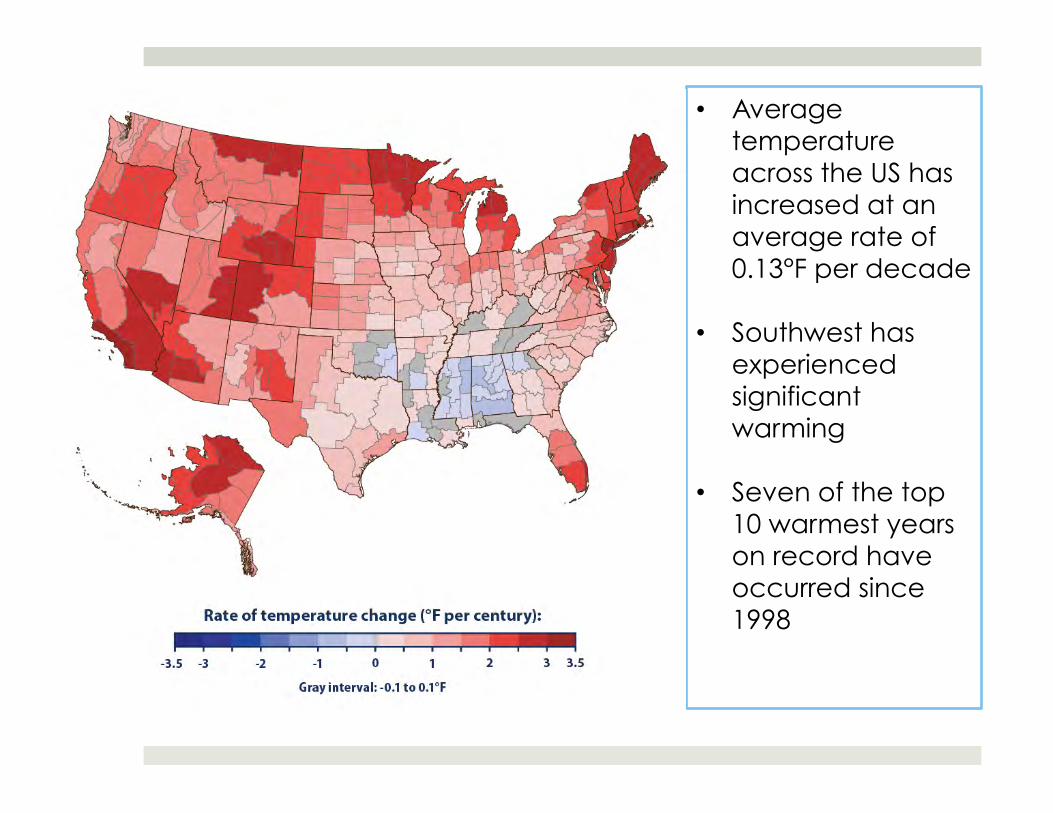
• Average temperature across the US has increased at an average rate of 0.13°F per decade
• Southwest has experienced significant warming
• Seven of the top 10 warmest years on record have occurred since 1998
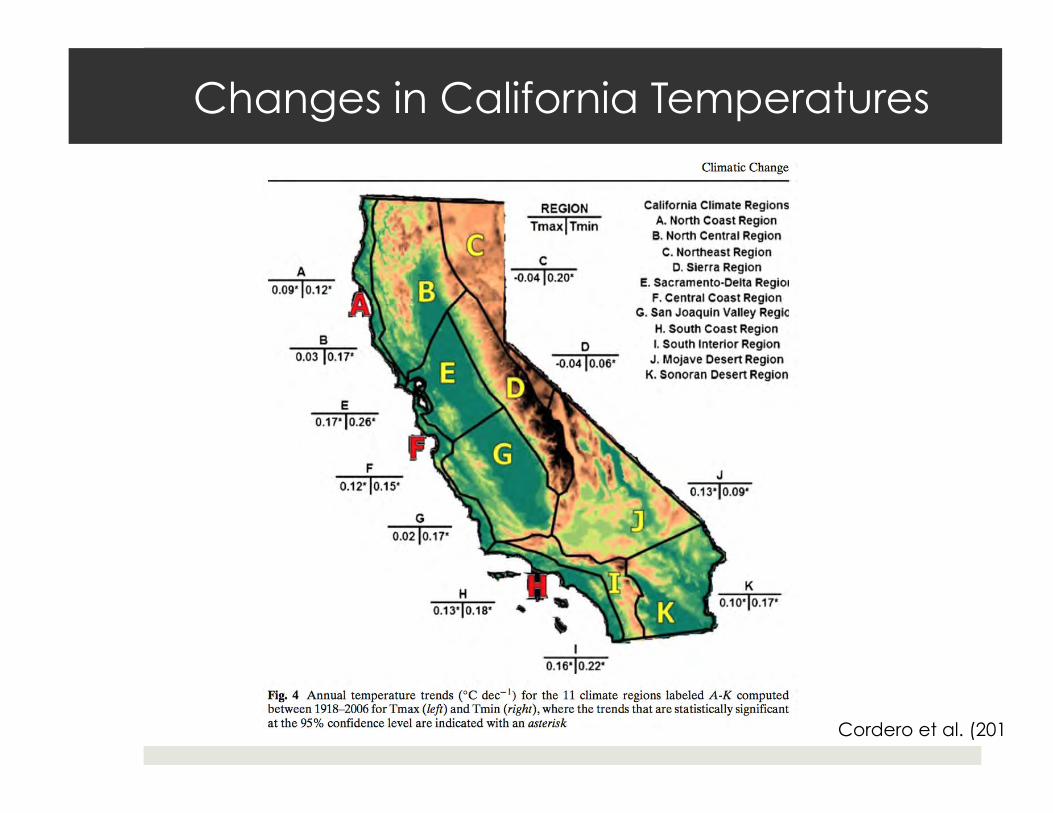
Changes in California Temperatures
Cordero et al. (2011)
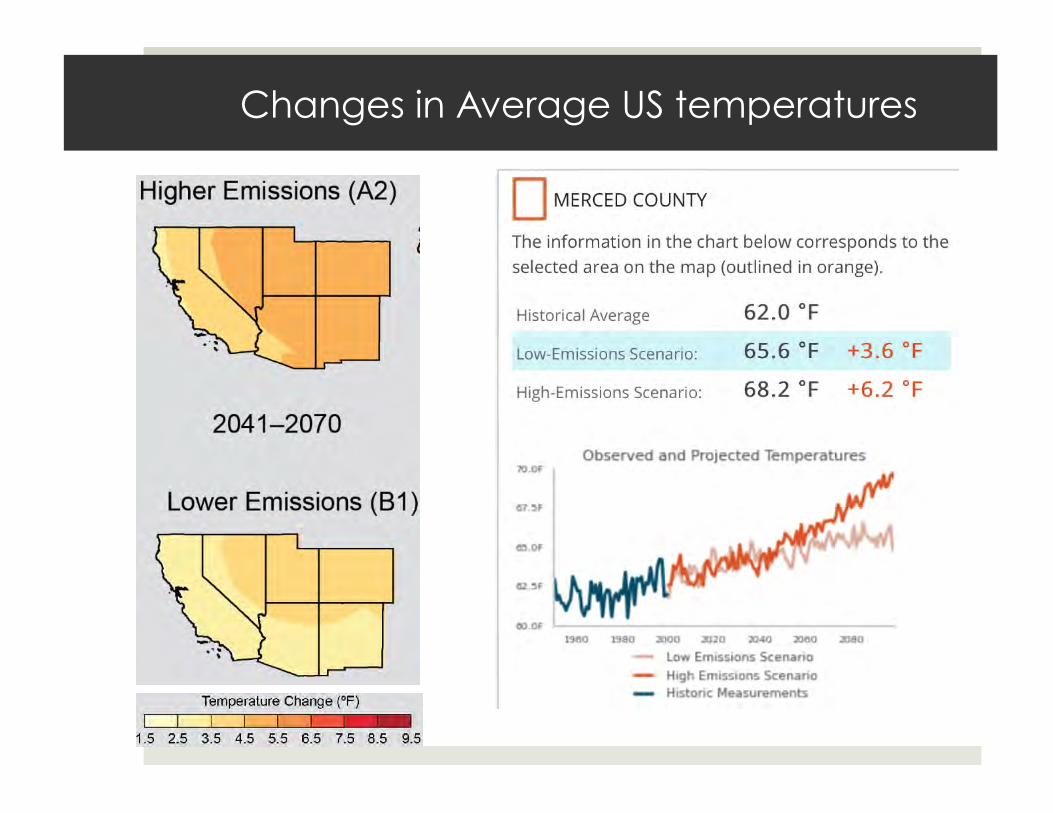
Changes in Average US temperatures
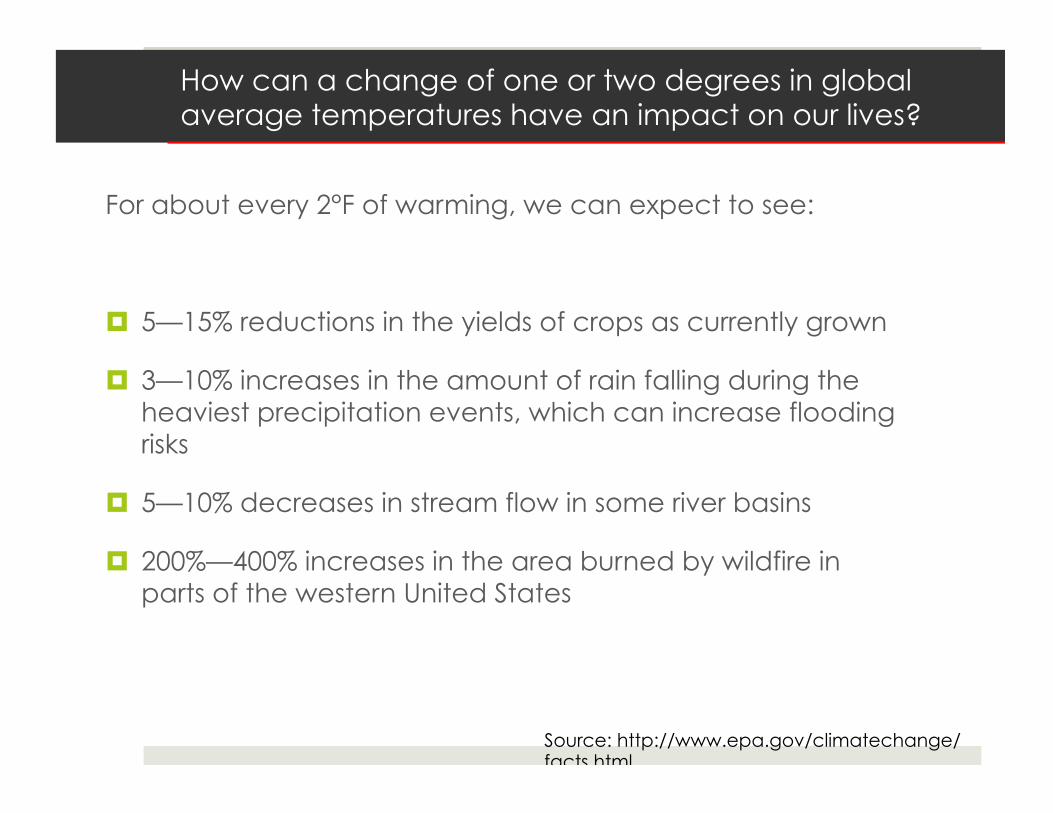
How can a change of one or two degrees in global average temperatures have an impact on our lives?
For about every 2°F of warming, we can expect to see:
¤ 5—15% reductions in the yields of crops as currently grown
¤ 3—10% increases in the amount of rain falling during the heaviest precipitation events, which can increase flooding risks
¤ 5—10% decreases in stream flow in some river basins
¤ 200%—400% increases in the area burned by wildfire in parts of the western United States
Source: http://www.epa.gov/climatechange/facts.html
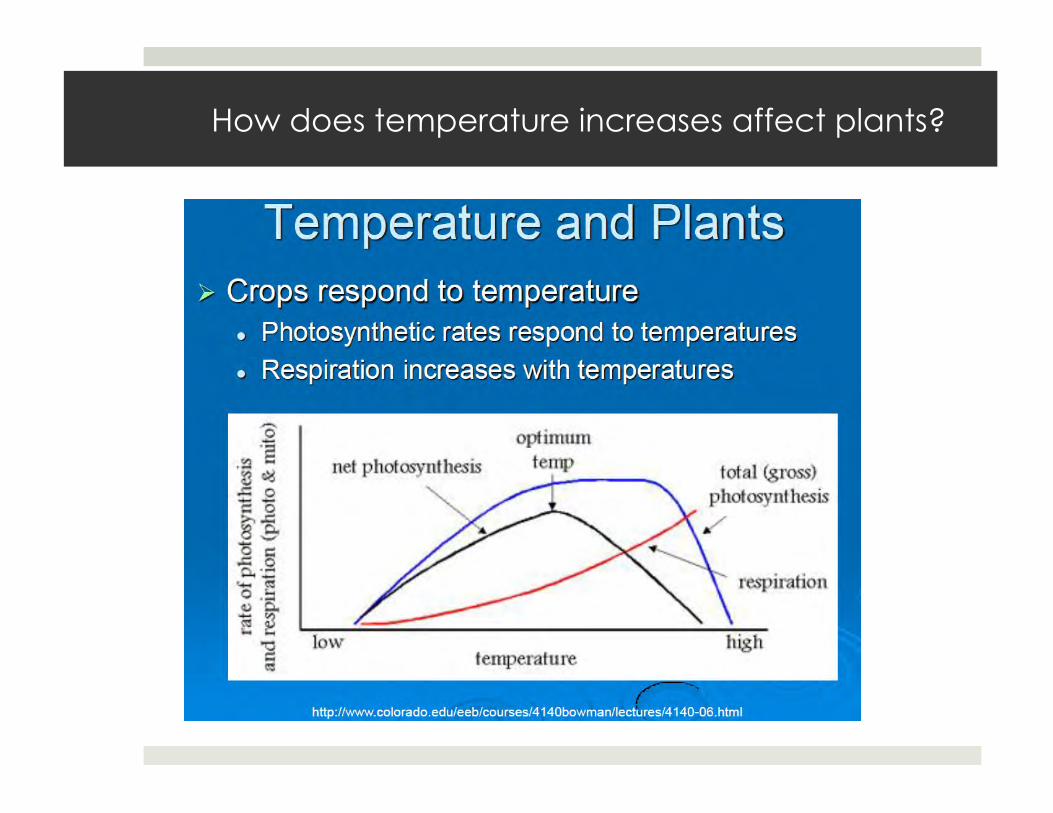
How does temperature increases affect plants?
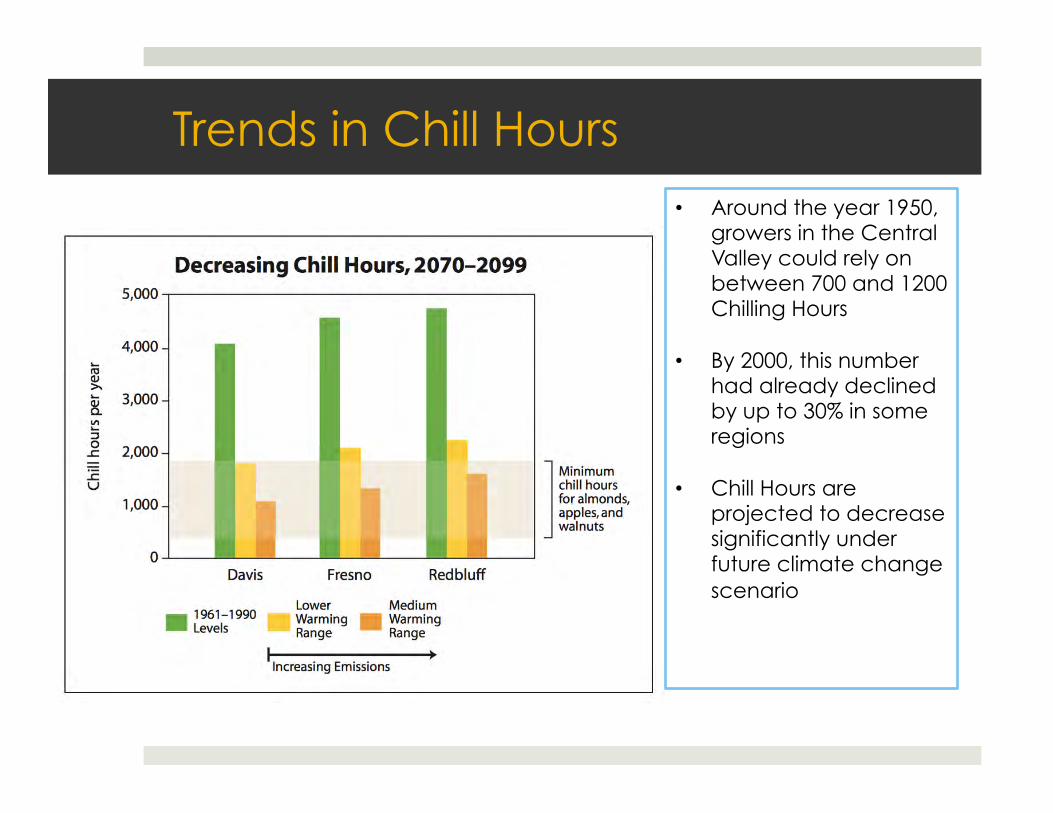
Trends in Chill Hours • Around the year 1950,
growers in the Central Valley could rely on between 700 and 1200 Chilling Hours
• By 2000, this number had already declined by up to 30% in some regions
• Chill Hours are projected to decrease significantly under future climate change scenario
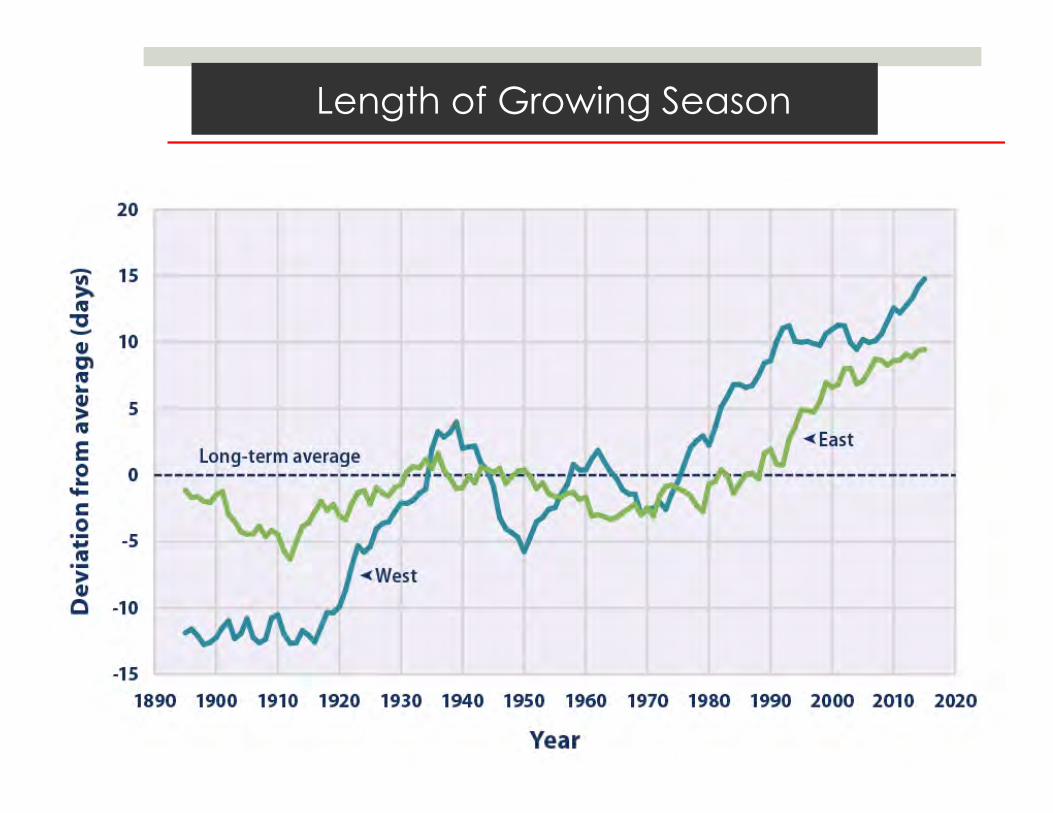
Length of Growing Season
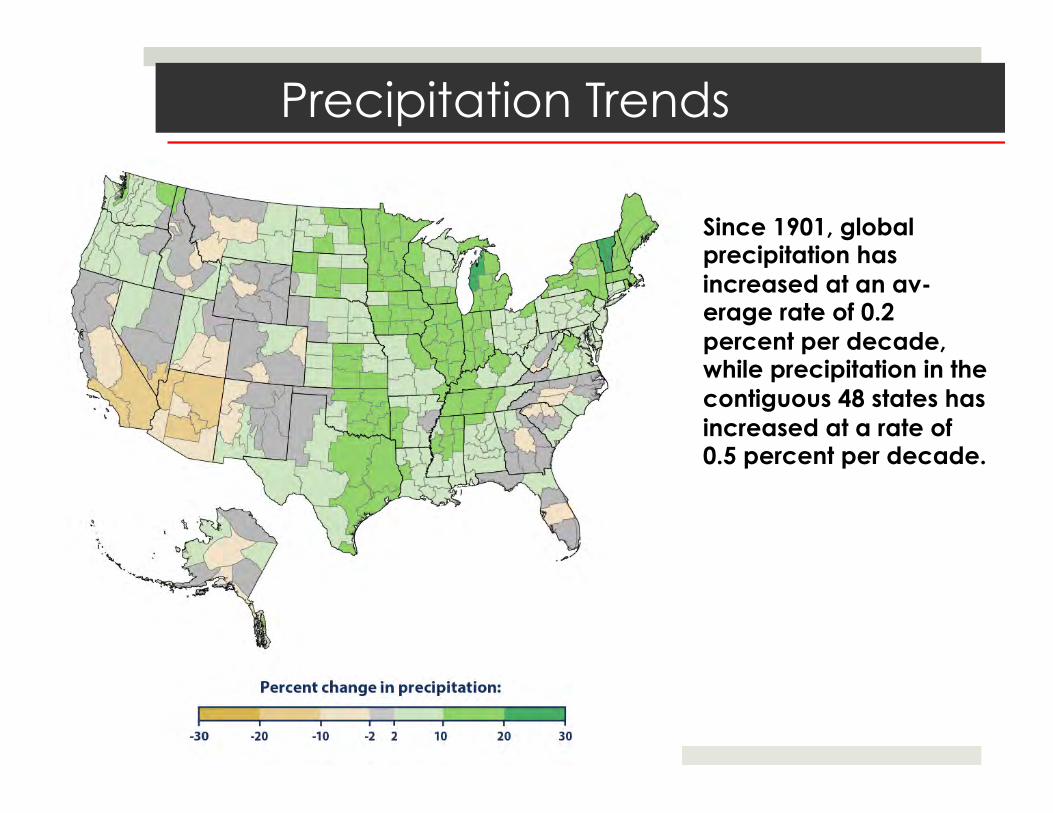
Precipitation Trends
Since 1901, global precipitation has increased at an av- erage rate of 0.2 percent per decade, while precipitation in the contiguous 48 states has increased at a rate of 0.5 percent per decade.
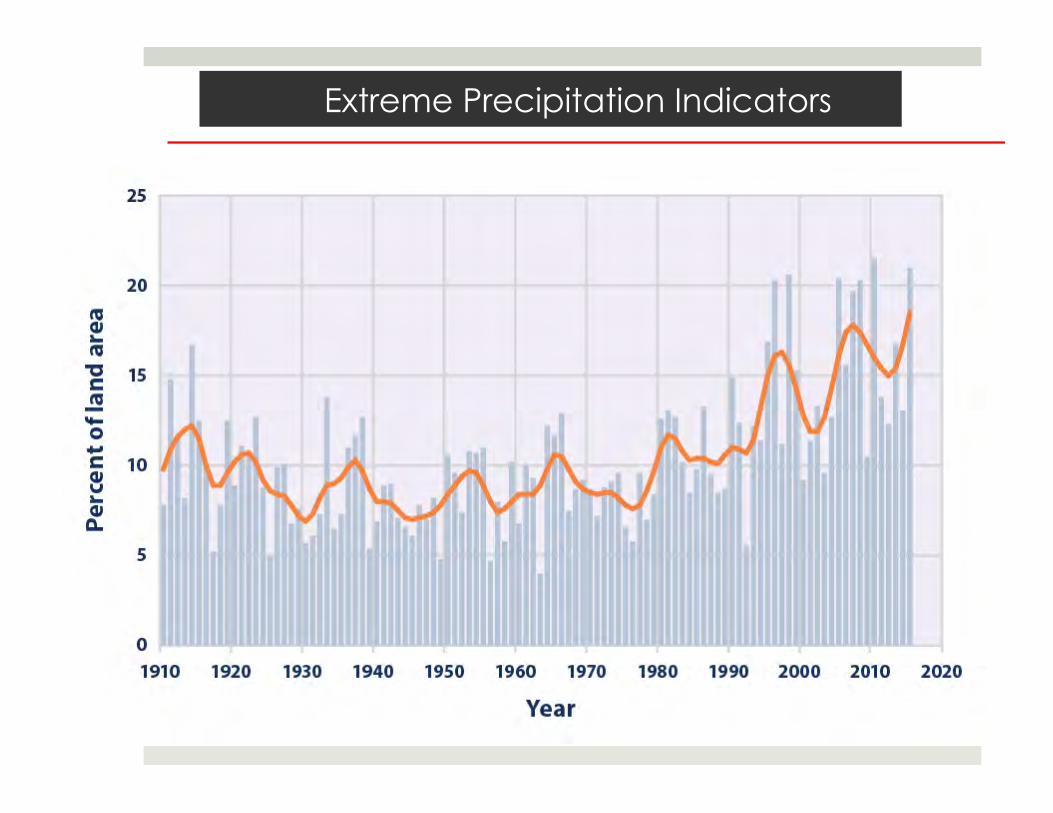
Extreme Precipitation Indicators
Slide Courtesy: Teamrat Ghezzehei
Climate Information for Managing Risks
¤ Climate has direct influence on agricultural production
¤ Integrating climate information into agricultural decisions can enhance agricultural resiliency to climate risks
¤ However, this information is not always available in a format that is desirable to agricultural producers/decision makers
¤ Translating climate information into actionable knowledge can greatly enhance growers’ capacity to manage risks and increase productivity
Climate Information Needs
¤ United States Government Accountability Office – “USDA faces the challenge of turning the large amount of often technical climate research into readily understandable information.”
¤ Decision support processes need to take account of the values and goals of stakeholders, evolving scientific information, and perceptions of risk. (National Climate Assessment)
¤ Climate Change Consortium for Specialty Crops report- “CDFA should compile a list of grower needs for weather data and forecast products”
Examples of Agro-Climate Decision Support Systems
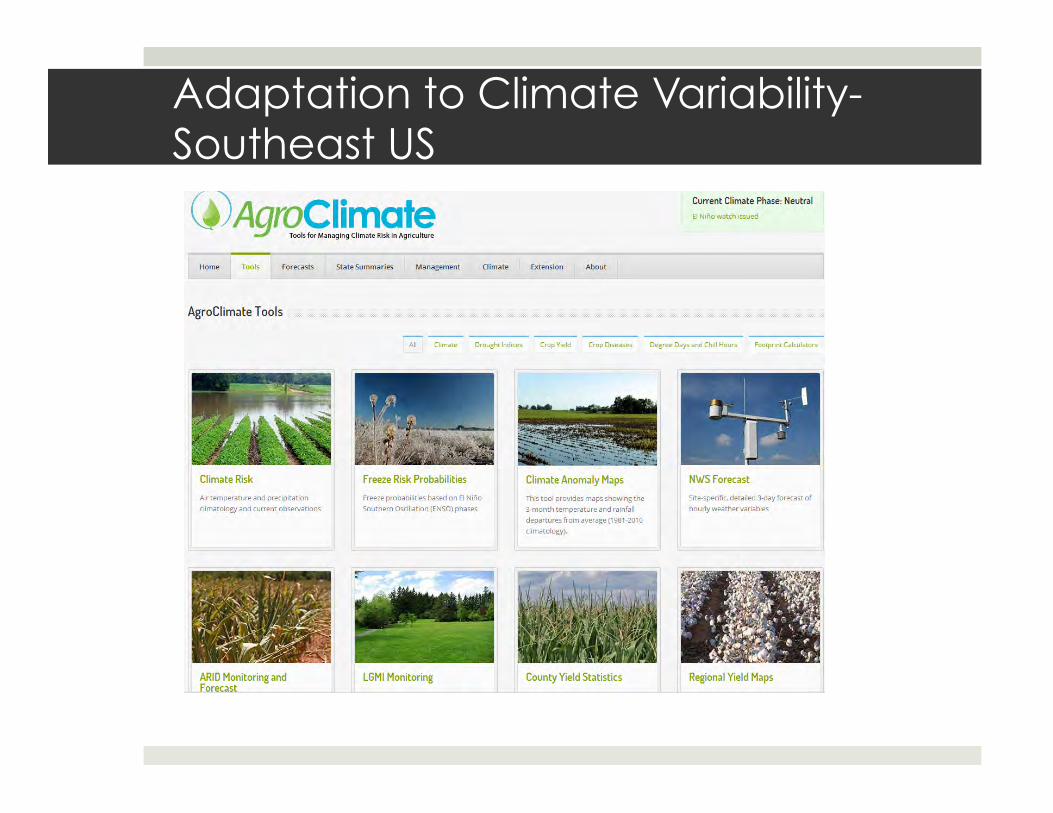
Adaptation to Climate Variability-Southeast US
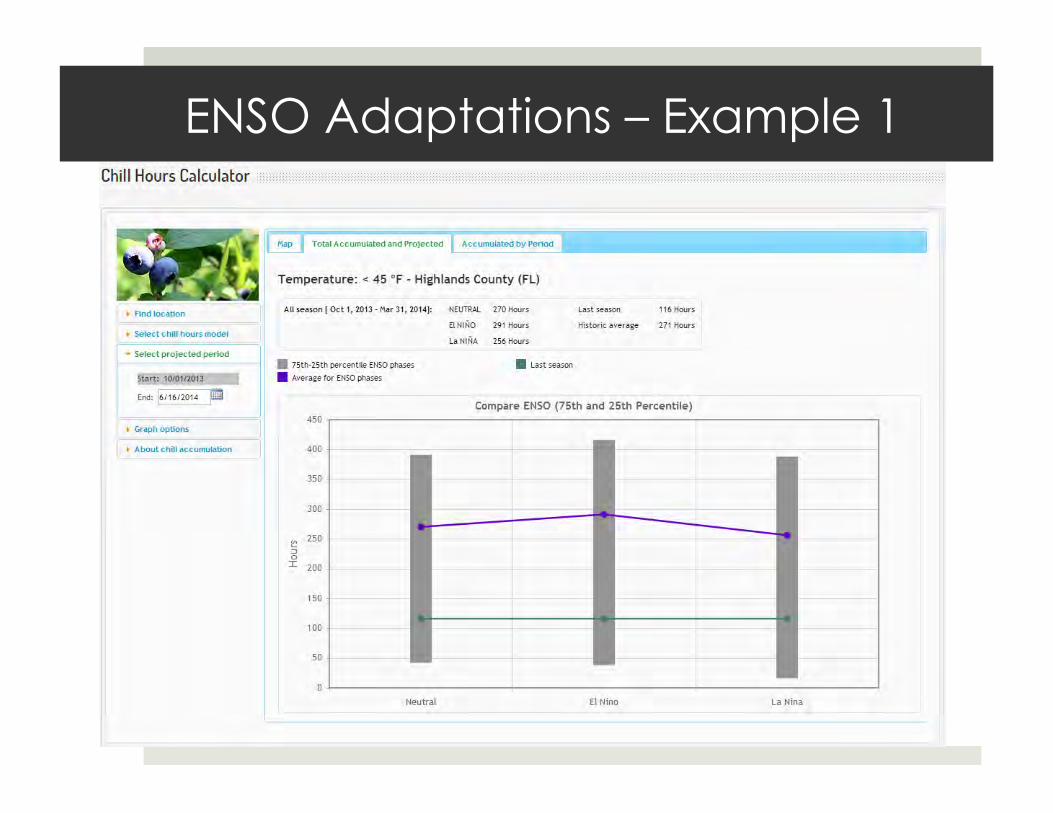
ENSO Adaptations – Example 1
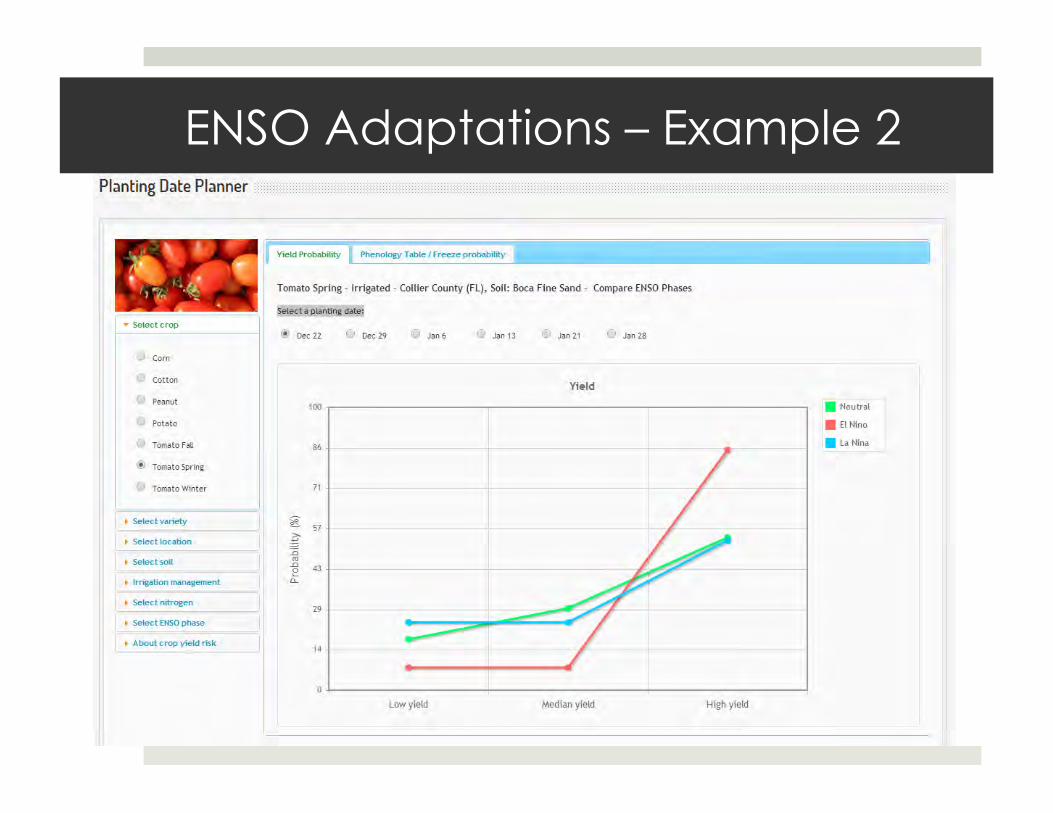
ENSO Adaptations – Example 2
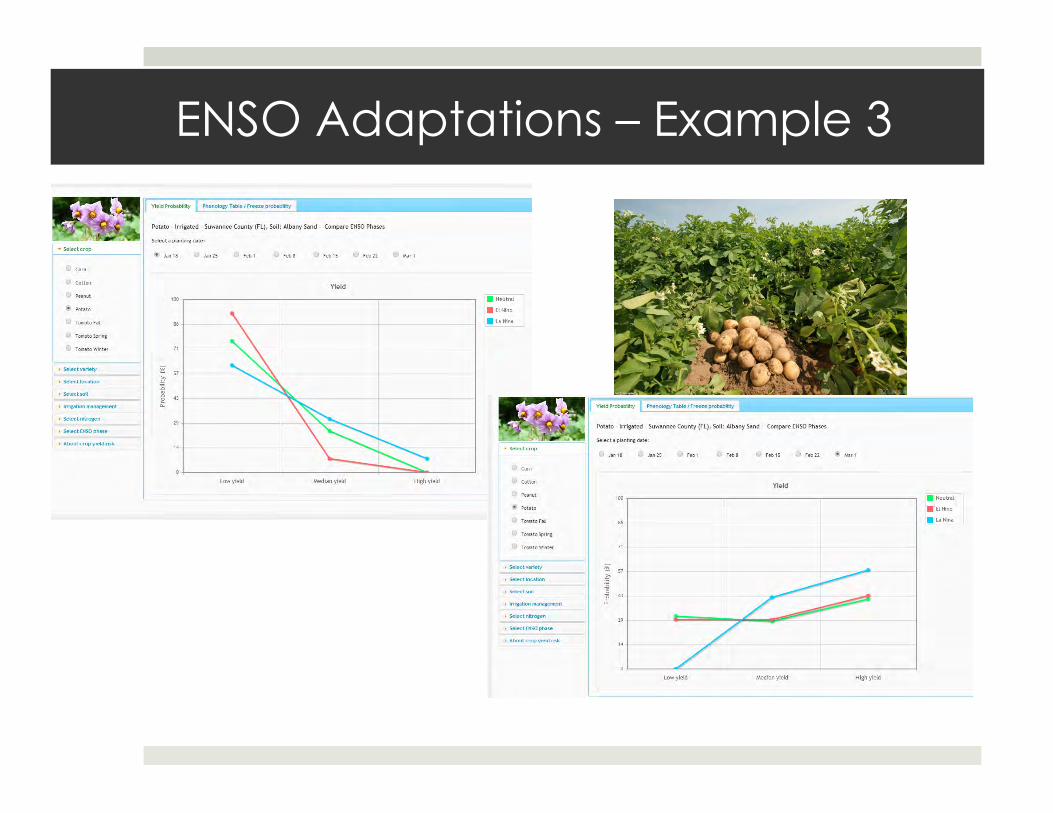
ENSO Adaptations – Example 3
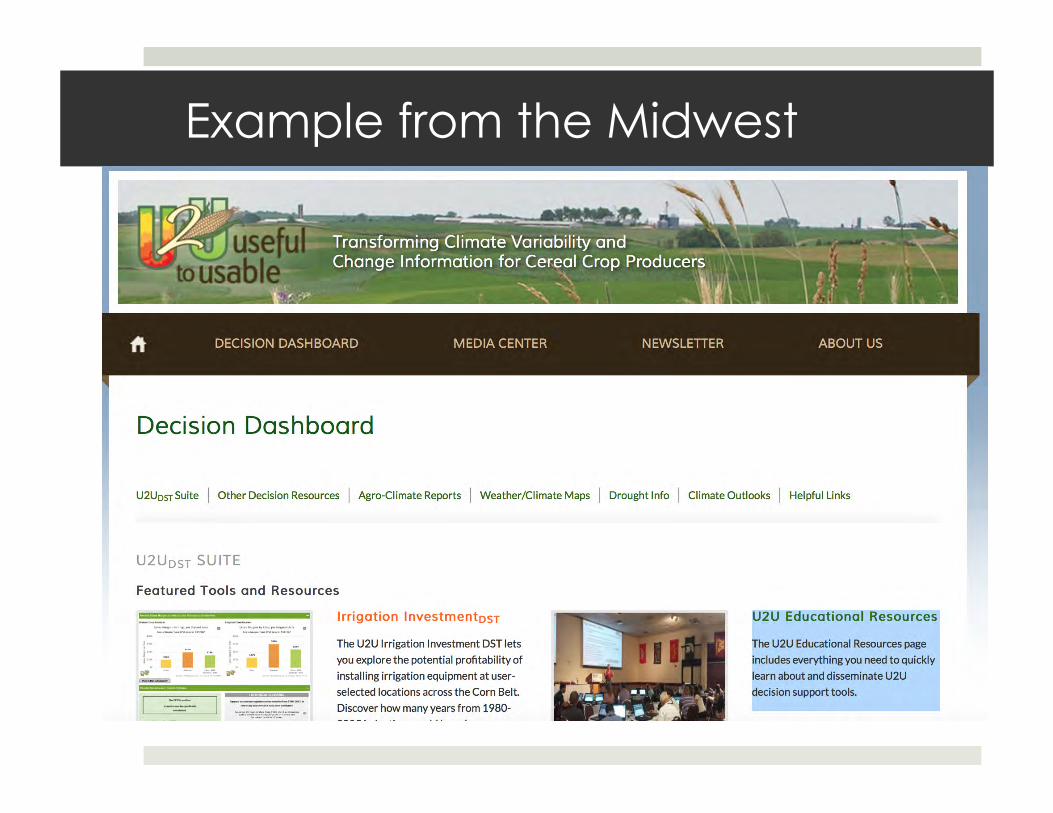
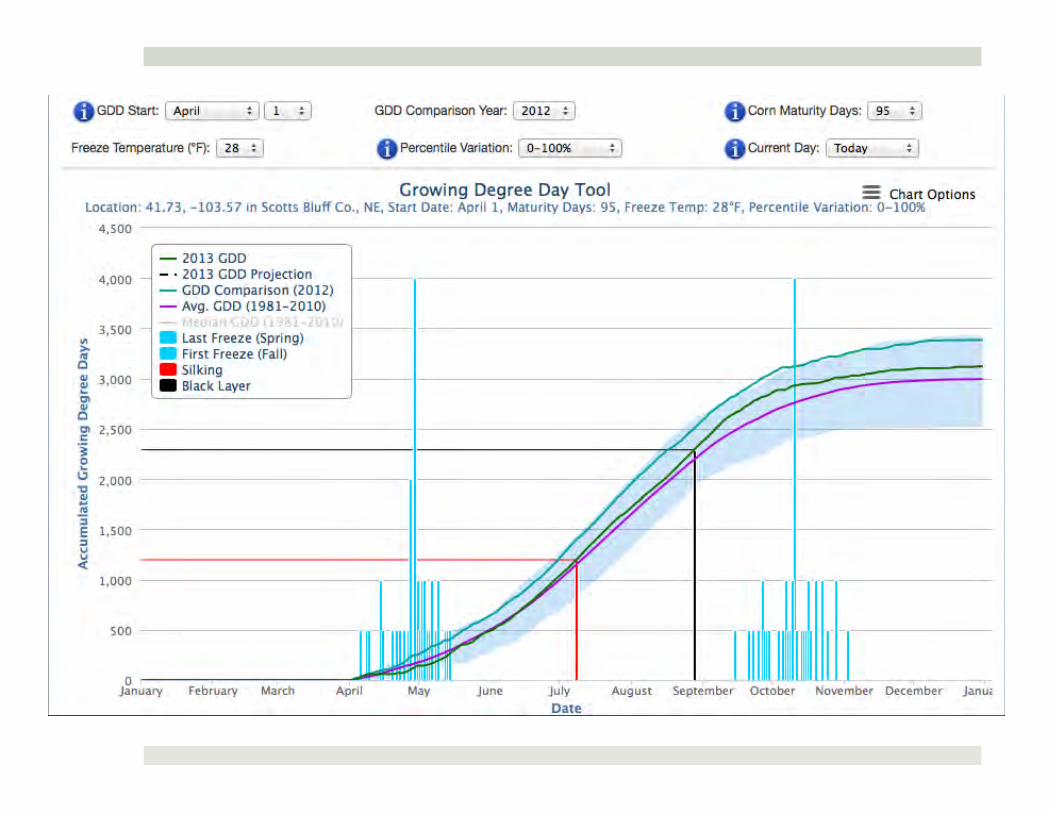
Example from the Midwest
Tapan Pathak, Ph.D. Cooperative Extension Specialist- Climate Adaptation in Agriculture University of California Merced
Email: [email protected]
Usingclimateinformationforlong-termadaptation
planning:
KripaJagannathan-PhDcandidate,UCBerkeley
“On-FarmClimateAdapta2onDecisions:WhereTheoryMeetsPrac2ce”:CalCAN2017Summit-28Feb2017
Informa(onneeds,modelingcapabili(es&tools
BACKGROUNDWhytouseclimateinforma2oninlong-term
planning?
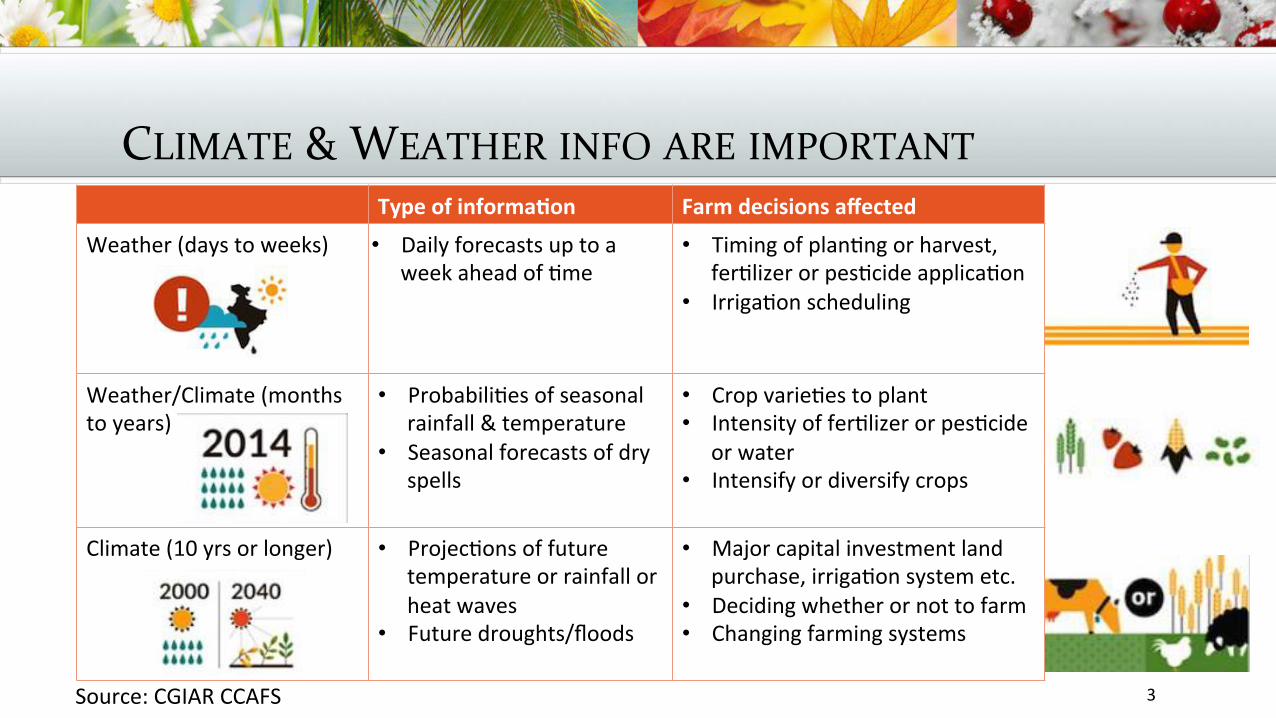
CLIMATE&WEATHERINFOAREIMPORTANTTypeofinforma=on Farmdecisionsaffected
Weather(daystoweeks) • Dailyforecastsuptoaweekaheadof2me
• Timingofplan2ngorharvest,fer2lizerorpes2cideapplica2on
• Irriga2onscheduling
Weather/Climate(monthstoyears)
• Probabili2esofseasonalrainfall&temperature
• Seasonalforecastsofdryspells
• Cropvarie2estoplant• Intensityoffer2lizerorpes2cide
orwater• Intensifyordiversifycrops
Climate(10yrsorlonger) • Projec2onsoffuturetemperatureorrainfallorheatwaves
• Futuredroughts/floods
• Majorcapitalinvestmentlandpurchase,irriga2onsystemetc.
• Decidingwhetherornottofarm• Changingfarmingsystems
Source:CGIARCCAFS 3
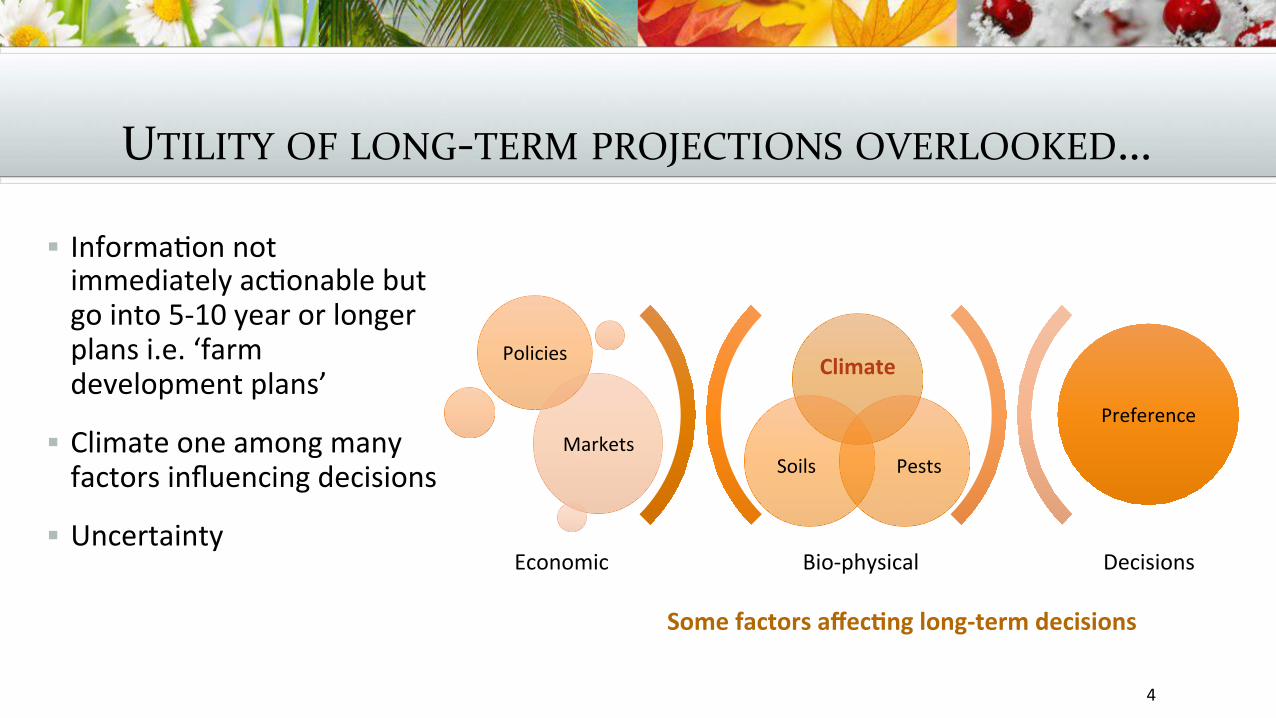
UTILITYOFLONG-TERMPROJECTIONSOVERLOOKED…
4
§ Informa2onnotimmediatelyac2onablebutgointo5-10yearorlongerplansi.e.‘farmdevelopmentplans’
§ Climateoneamongmanyfactorsinfluencingdecisions
§ UncertaintyBio-physical Decisions
Climate
PestsSoils
Policies
MarketsPreference
Economic
Somefactorsaffec=nglong-termdecisions
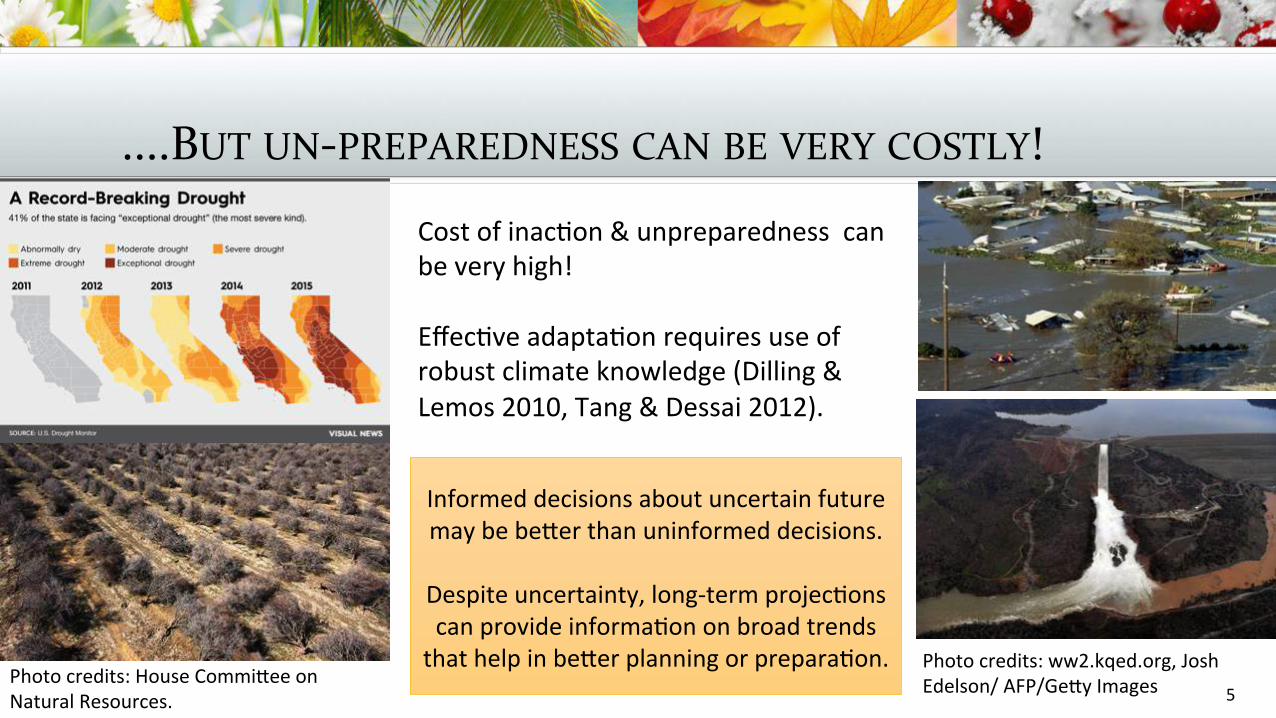
....BUTUN-PREPAREDNESSCANBEVERYCOSTLY!
5
Costofinac2on&unpreparednesscanbeveryhigh!Effec2veadapta2onrequiresuseofrobustclimateknowledge(Dilling&Lemos2010,Tang&Dessai2012).
Informeddecisionsaboutuncertainfuturemaybebeferthanuninformeddecisions.
Despiteuncertainty,long-termprojec2onscanprovideinforma2ononbroadtrendsthathelpinbeferplanningorprepara2on.
Photocredits:HouseCommifeeonNaturalResources.
Photocredits:ww2.kqed.org,JoshEdelson/AFP/GefyImages
FARMERS’INFORMATIONNEEDSInterviewswithalmondgrowersintheCentralValley
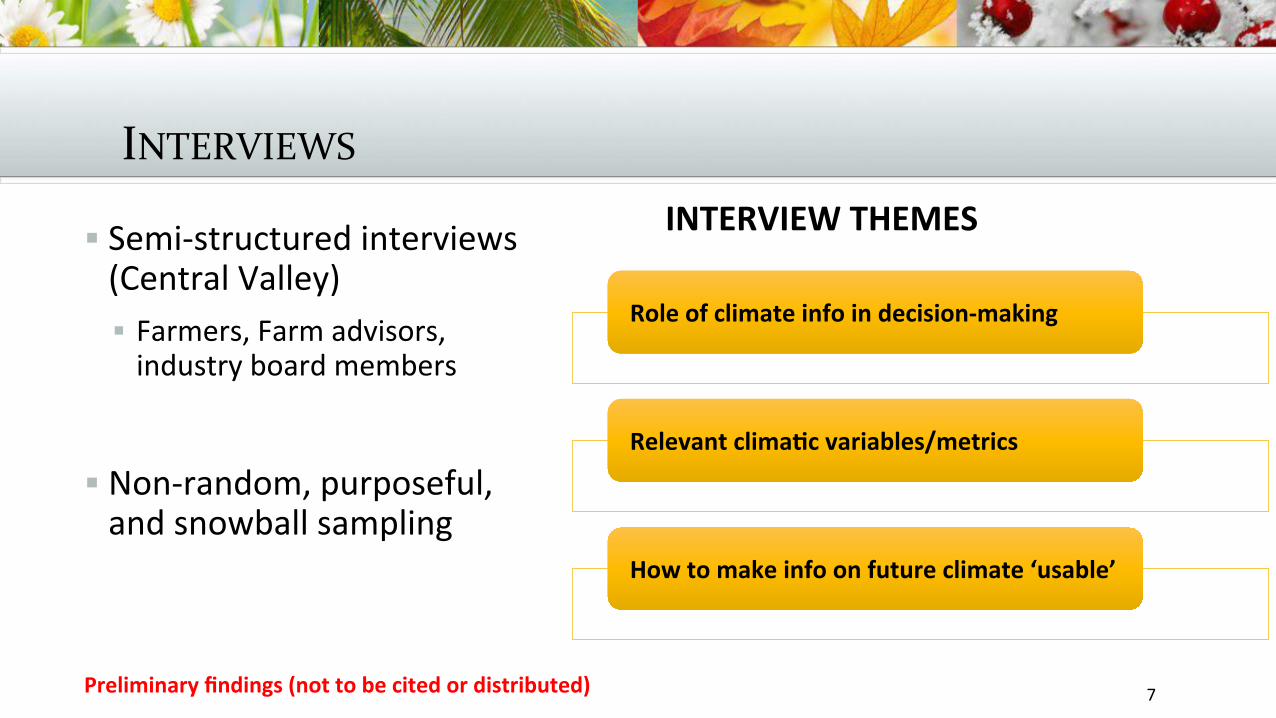
INTERVIEWS
Roleofclimateinfoindecision-making
Relevantclima=cvariables/metrics
Howtomakeinfoonfutureclimate‘usable’
7
§ Semi-structuredinterviews(CentralValley)§ Farmers,Farmadvisors,industryboardmembers
§ Non-random,purposeful,andsnowballsampling
Preliminaryfindings(nottobecitedordistributed)
INTERVIEWTHEMES
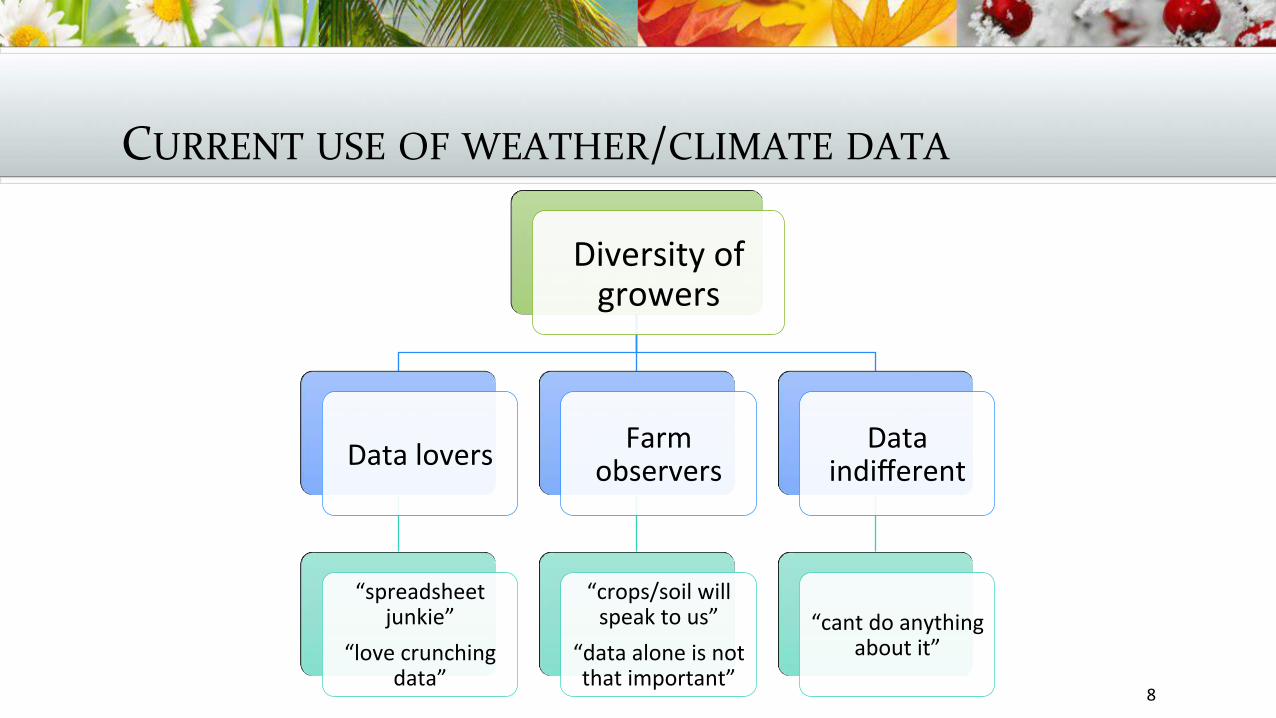
CURRENTUSEOFWEATHER/CLIMATEDATA
8
Diversityofgrowers
Datalovers
“spreadsheetjunkie”
“lovecrunchingdata”
Farmobservers
“crops/soilwillspeaktous”
“dataaloneisnotthatimportant”
Dataindifferent
“cantdoanythingaboutit”
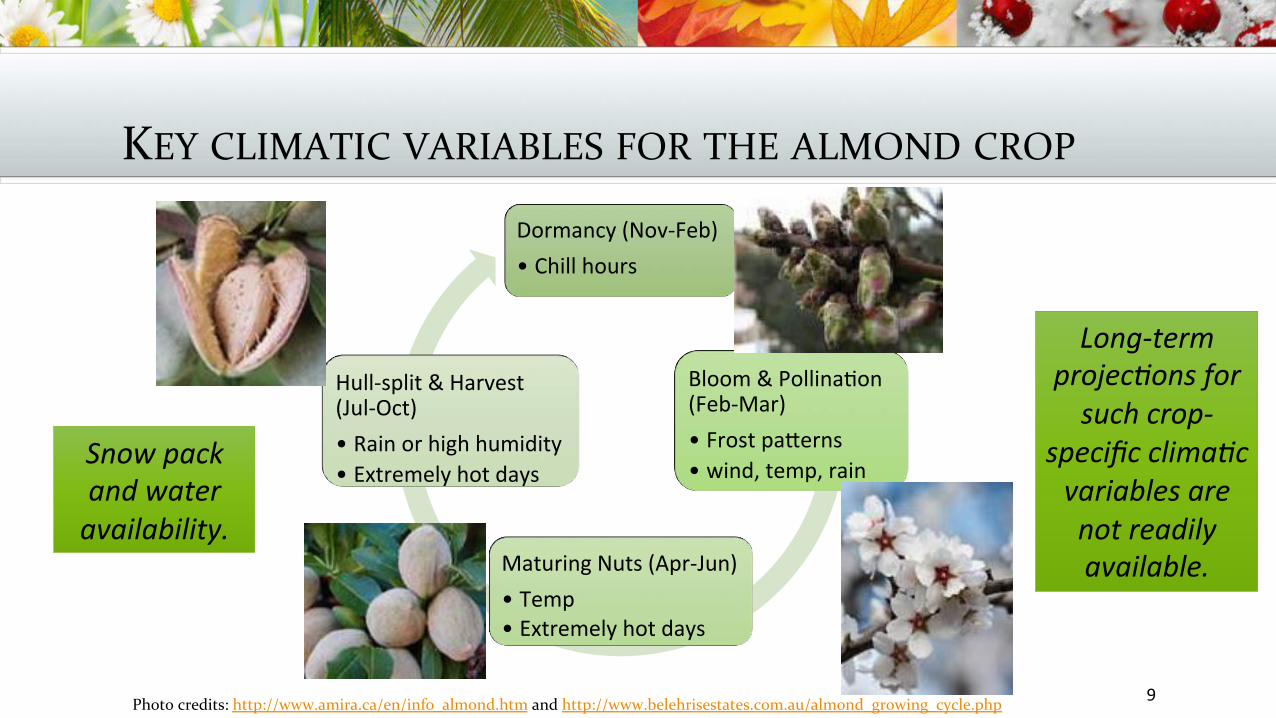
KEYCLIMATICVARIABLESFORTHEALMONDCROP
9
Dormancy(Nov-Feb)• Chillhours
Bloom&Pollina2on(Feb-Mar)• Frostpaferns• wind,temp,rain
MaturingNuts(Apr-Jun)• Temp• Extremelyhotdays
Hull-split&Harvest(Jul-Oct)• Rainorhighhumidity• Extremelyhotdays
Photocredits:http://www.amira.ca/en/info_almond.htmandhttp://www.belehrisestates.com.au/almond_growing_cycle.php
Long-termprojec(onsforsuchcrop-
specificclima(cvariablesarenotreadilyavailable.
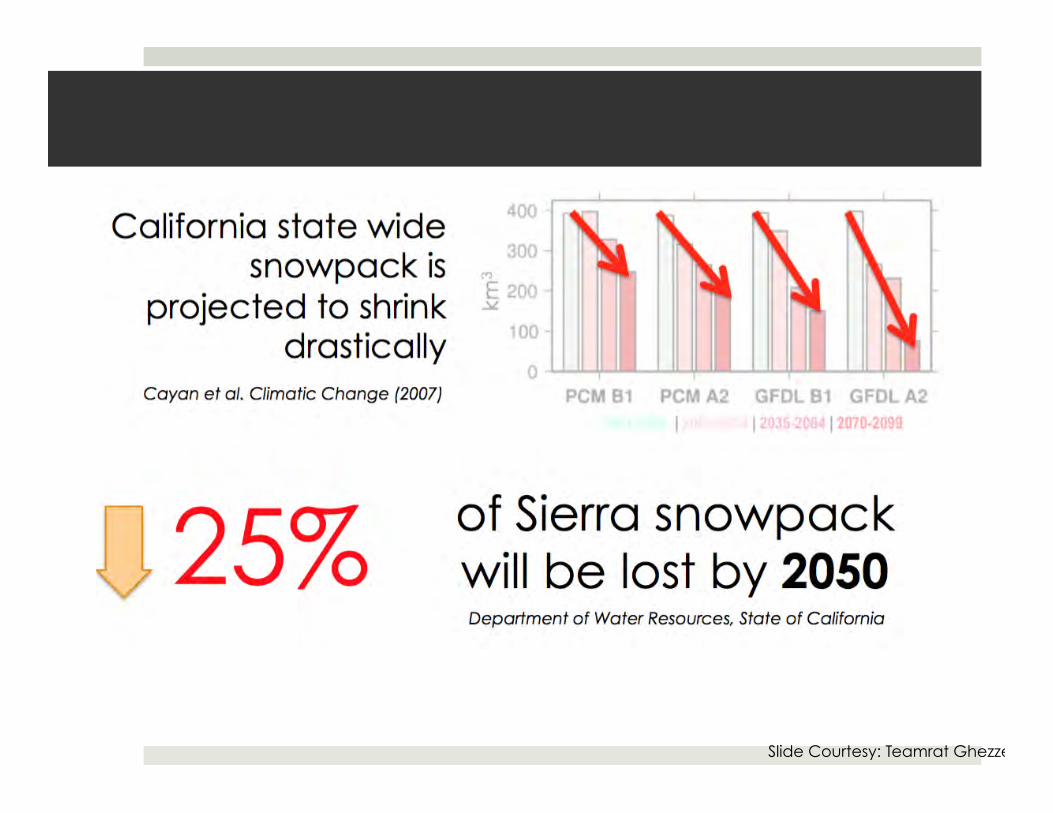
Snowpackandwateravailability.
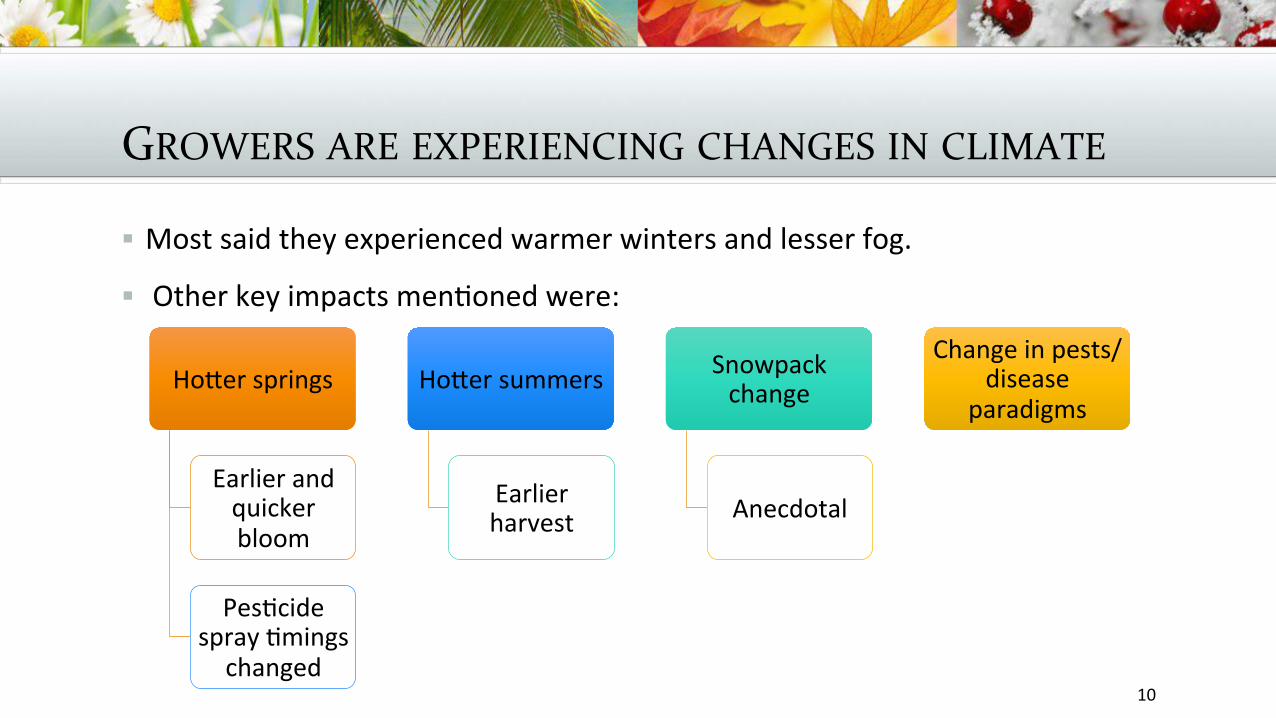
GROWERSAREEXPERIENCINGCHANGESINCLIMATE
§ Mostsaidtheyexperiencedwarmerwintersandlesserfog.
§ Otherkeyimpactsmen2onedwere:
10
Hofersprings
Earlierandquickerbloom
Pes2cidespray2mingschanged
Hofersummers
Earlierharvest
Snowpackchange
Anecdotal
Changeinpests/disease
paradigms
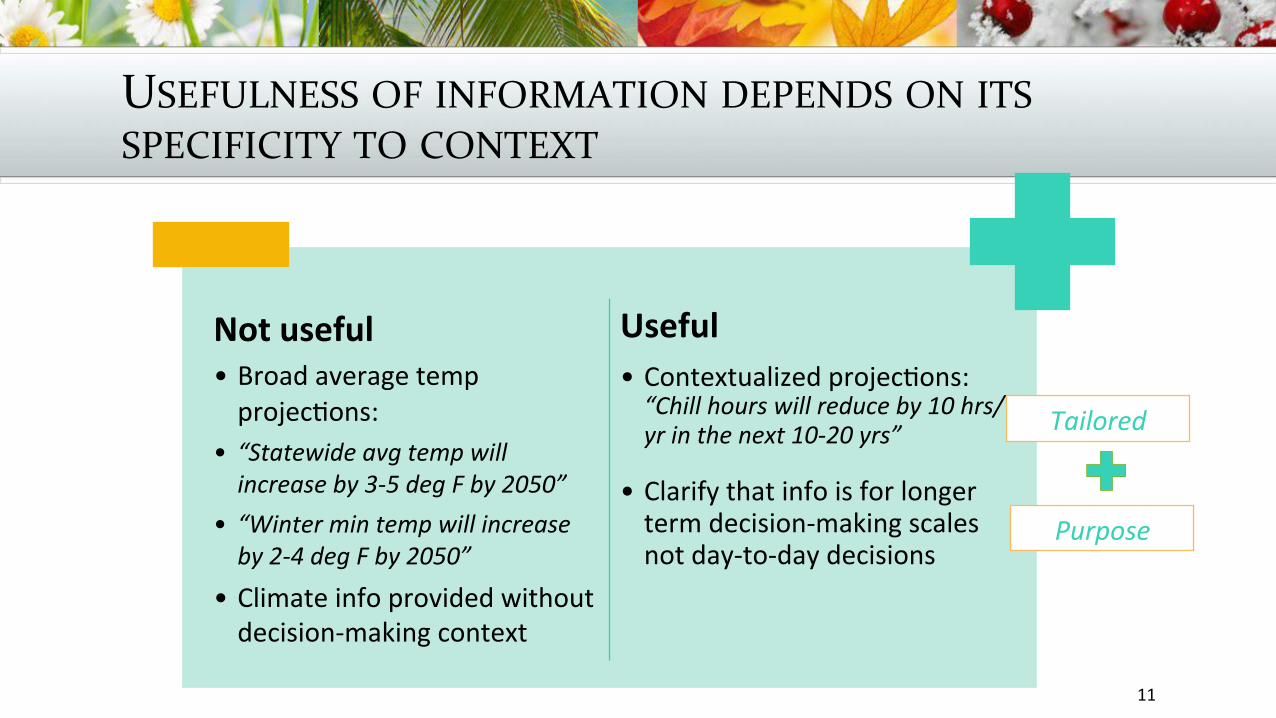
USEFULNESSOFINFORMATIONDEPENDSONITSSPECIFICITYTOCONTEXT
11
Useful• Contextualizedprojec2ons:“Chillhourswillreduceby10hrs/yrinthenext10-20yrs”
• Clarifythatinfoisforlongertermdecision-makingscalesnotday-to-daydecisions
Notuseful• Broadaveragetempprojec2ons:
• “Statewideavgtempwillincreaseby3-5degFby2050”
• “Wintermintempwillincreaseby2-4degFby2050”
• Climateinfoprovidedwithoutdecision-makingcontext
Tailored
Purpose
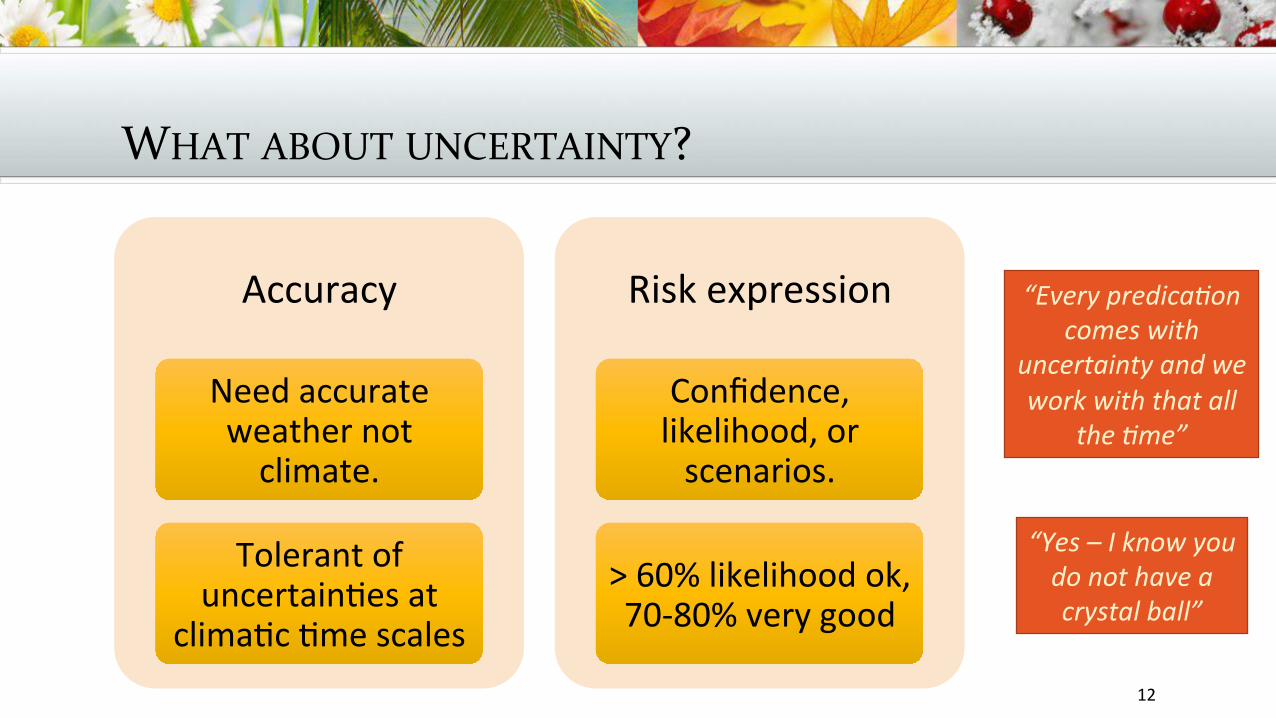
WHATABOUTUNCERTAINTY?
12
Accuracy
Needaccurateweathernotclimate.
Tolerantofuncertain2esat
clima2c2mescales
Riskexpression
Confidence,likelihood,orscenarios.
>60%likelihoodok,70-80%verygood
“Everypredica(oncomeswith
uncertaintyandweworkwiththatall
the(me”
“Yes–Iknowyoudonothaveacrystalball”
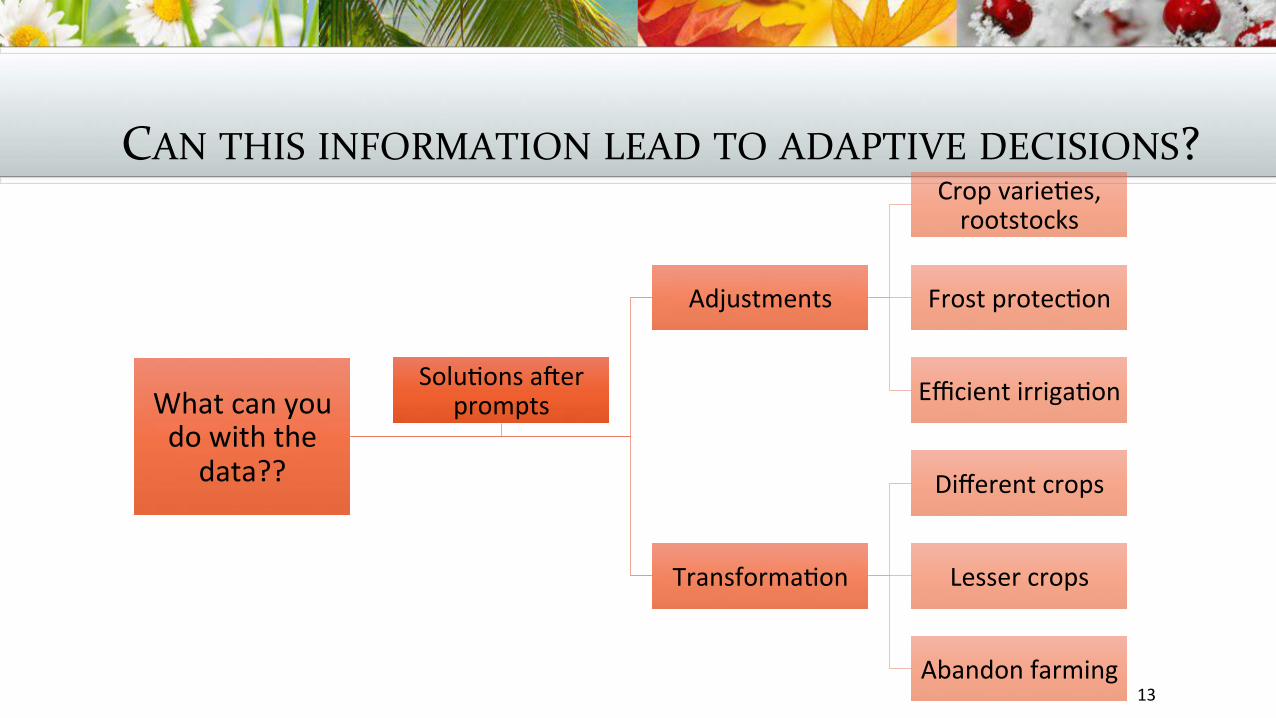
CANTHISINFORMATIONLEADTOADAPTIVEDECISIONS?
13
Whatcanyoudowiththedata??
Adjustments
Cropvarie2es,rootstocks
Frostprotec2on
Efficientirriga2on
Transforma2on
Differentcrops
Lessercrops
Abandonfarming
Solu2onsarerprompts
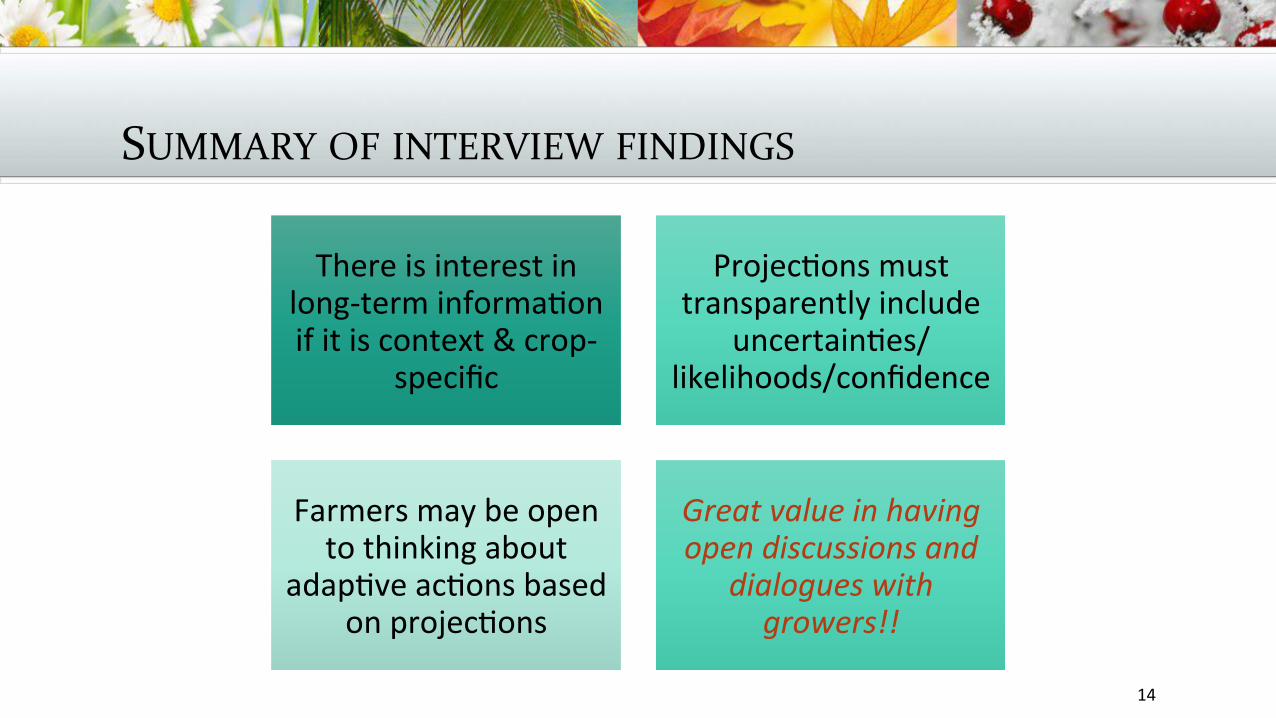
SUMMARYOFINTERVIEWFINDINGS
Thereisinterestinlong-terminforma2onifitiscontext&crop-
specific
Projec2onsmusttransparentlyinclude
uncertain2es/likelihoods/confidence
Farmersmaybeopentothinkingabout
adap2veac2onsbasedonprojec2ons
Greatvalueinhavingopendiscussionsand
dialogueswithgrowers!!
14
CLIMATEMODELINGCAPABILITIES
Canmodelsprovide“usable”info?:Adeeperdelveintoanalysisofchillhourprojec=ons
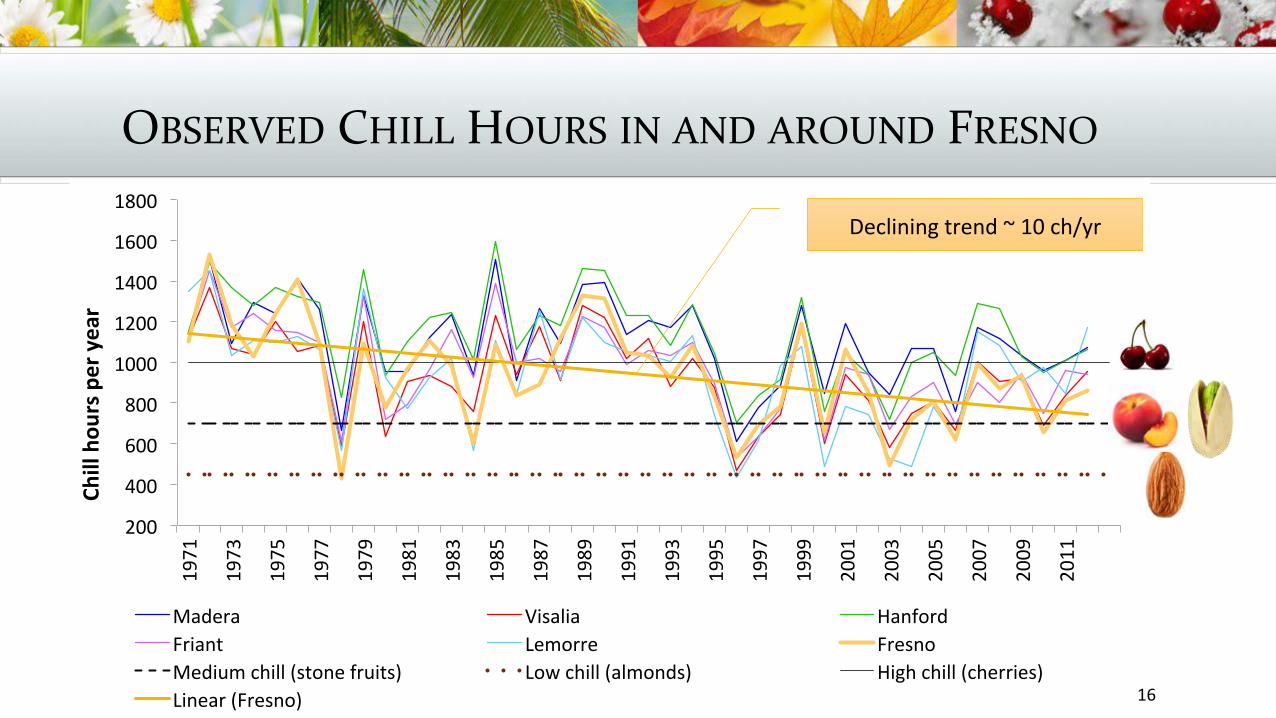
OBSERVEDCHILLHOURSINANDAROUNDFRESNO
200
400
600
800
1000
1200
1400
1600
18001971
1973
1975
1977
1979
1981
1983
1985
1987
1989
1991
1993
1995
1997
1999
2001
2003
2005
2007
2009
2011
Chillhou
rsperyear
YearMadera Visalia HanfordFriant Lemorre FresnoMediumchill(stonefruits) Lowchill(almonds) Highchill(cherries)Linear(Fresno) 16
Decliningtrend~10ch/yr
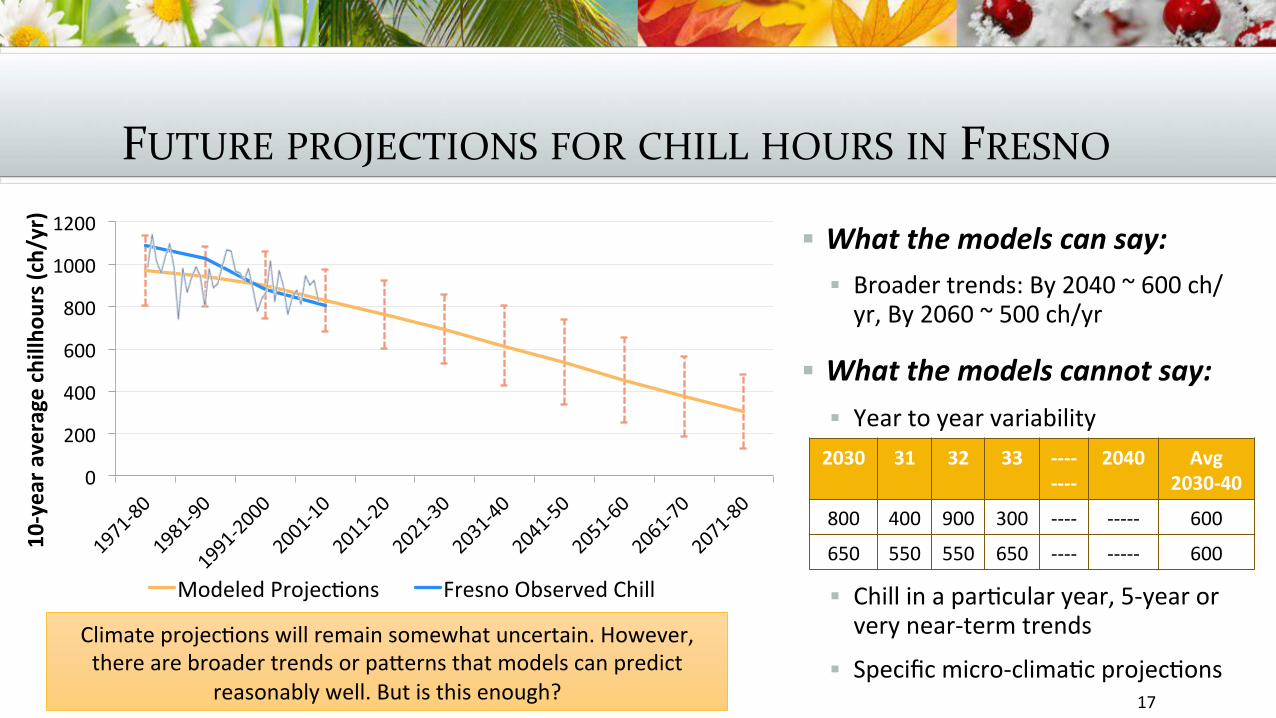
FUTUREPROJECTIONSFORCHILLHOURSINFRESNO
17
0
200
400
600
800
1000
1200
10-yeara
veragechillh
ours(ch/yr)
ModeledProjec2ons FresnoObservedChill
§ Whatthemodelscansay:§ Broadertrends:By2040~600ch/yr,By2060~500ch/yr
§ Whatthemodelscannotsay:§ Yeartoyearvariability
§ Chillinapar2cularyear,5-yearorverynear-termtrends
§ Specificmicro-clima2cprojec2onsClimateprojec2onswillremainsomewhatuncertain.However,therearebroadertrendsorpafernsthatmodelscanpredict
reasonablywell.Butisthisenough?
2030 31 32 33 --------
2040 Avg2030-40
800 400 900 300 ---- ----- 600
650 550 550 650 ---- ----- 600
CAL-ADAPTTOOLPla`ormforclimatedataandotherresourcesforCA
adapta=on
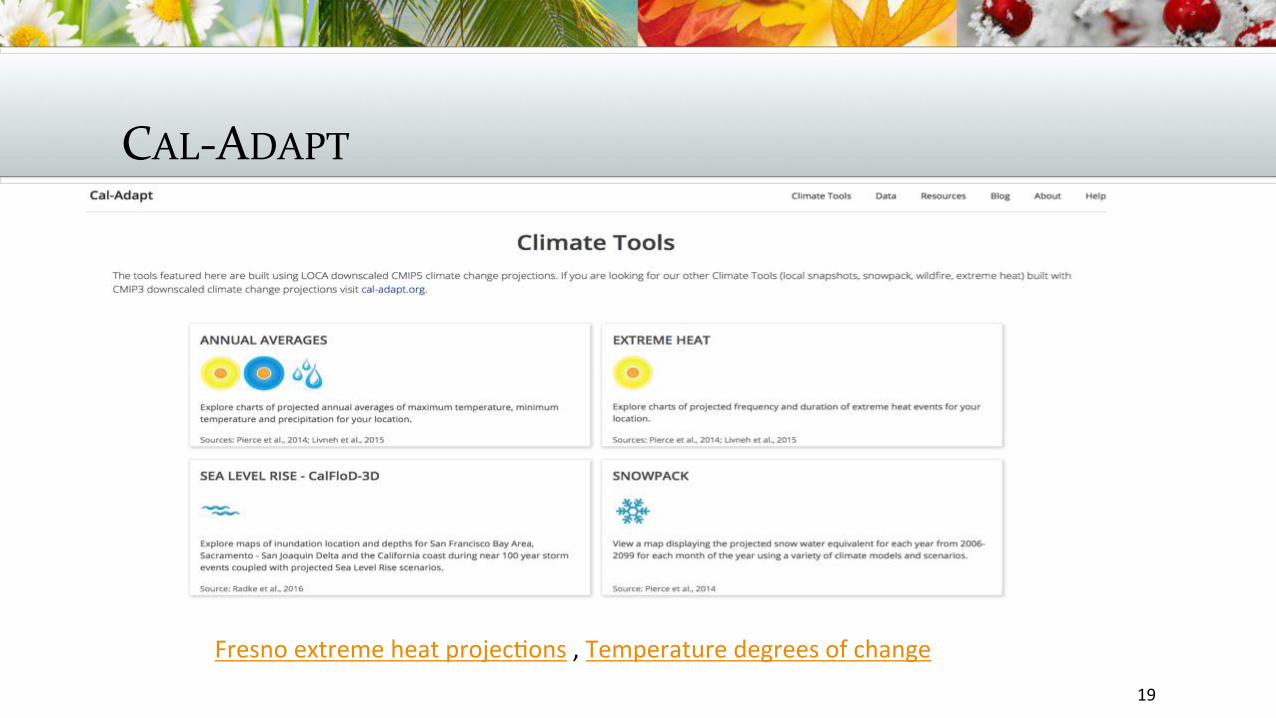
CAL-ADAPT
19
Fresnoextremeheatprojec2ons,Temperaturedegreesofchange
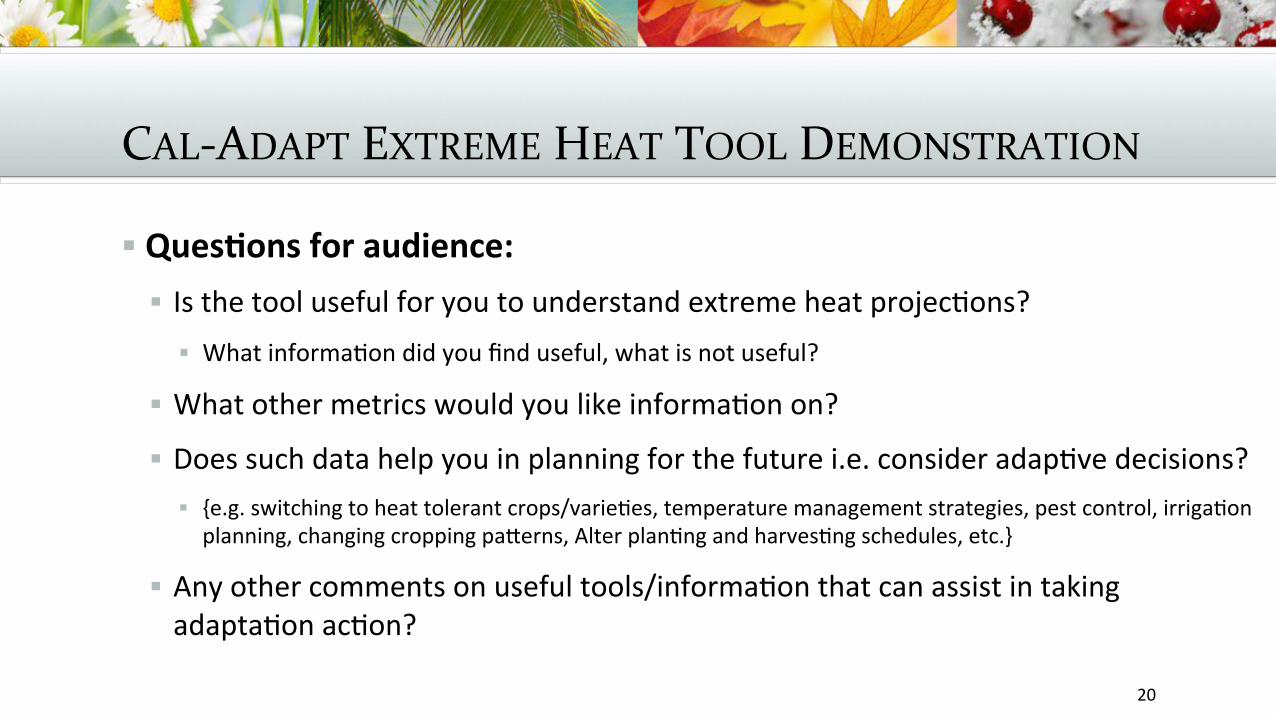
CAL-ADAPTEXTREMEHEATTOOLDEMONSTRATION
§ Ques=onsforaudience:§ Isthetoolusefulforyoutounderstandextremeheatprojec2ons?
§ Whatinforma2ondidyoufinduseful,whatisnotuseful?
§ Whatothermetricswouldyoulikeinforma2onon?
§ Doessuchdatahelpyouinplanningforthefuturei.e.consideradap2vedecisions?§ {e.g.switchingtoheattolerantcrops/varie2es,temperaturemanagementstrategies,pestcontrol,irriga2onplanning,changingcroppingpaferns,Alterplan2ngandharves2ngschedules,etc.}
§ Anyothercommentsonusefultools/informa2onthatcanassistintakingadapta2onac2on?
20
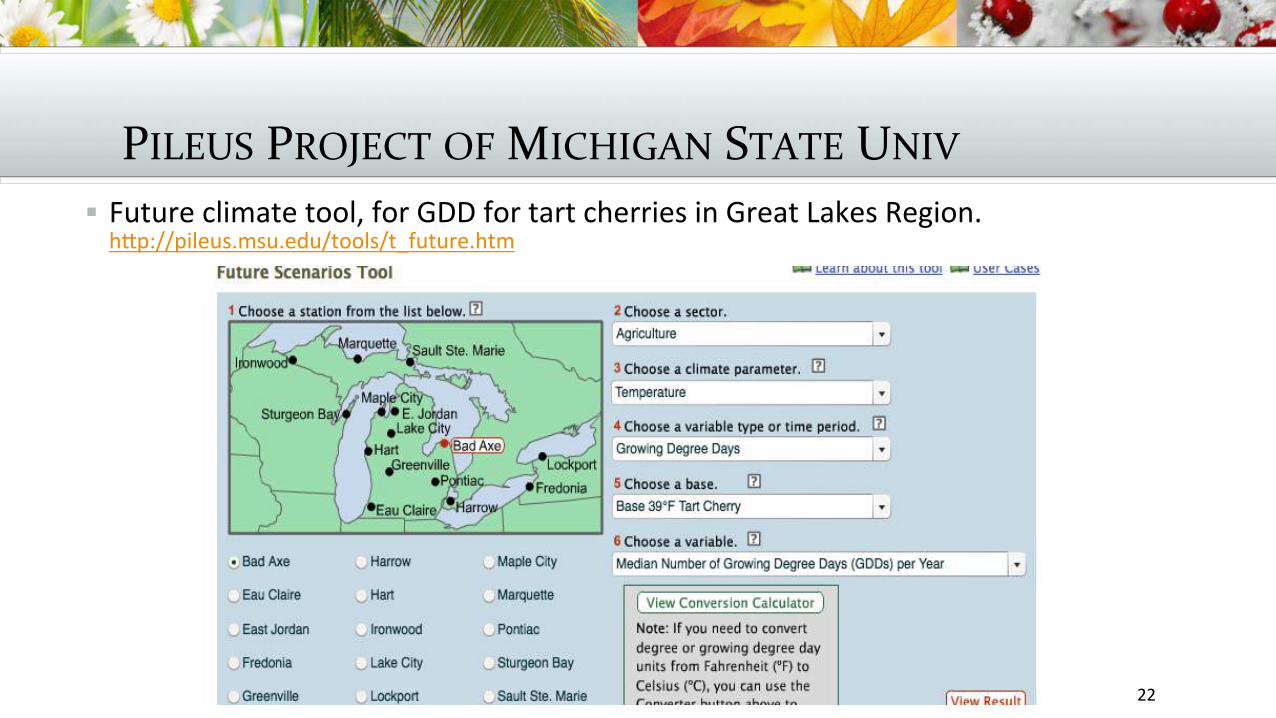
PILEUSPROJECTOFMICHIGANSTATEUNIV§ Futureclimatetool,forGDDfortartcherriesinGreatLakesRegion.hfp://pileus.msu.edu/tools/t_future.htm
22
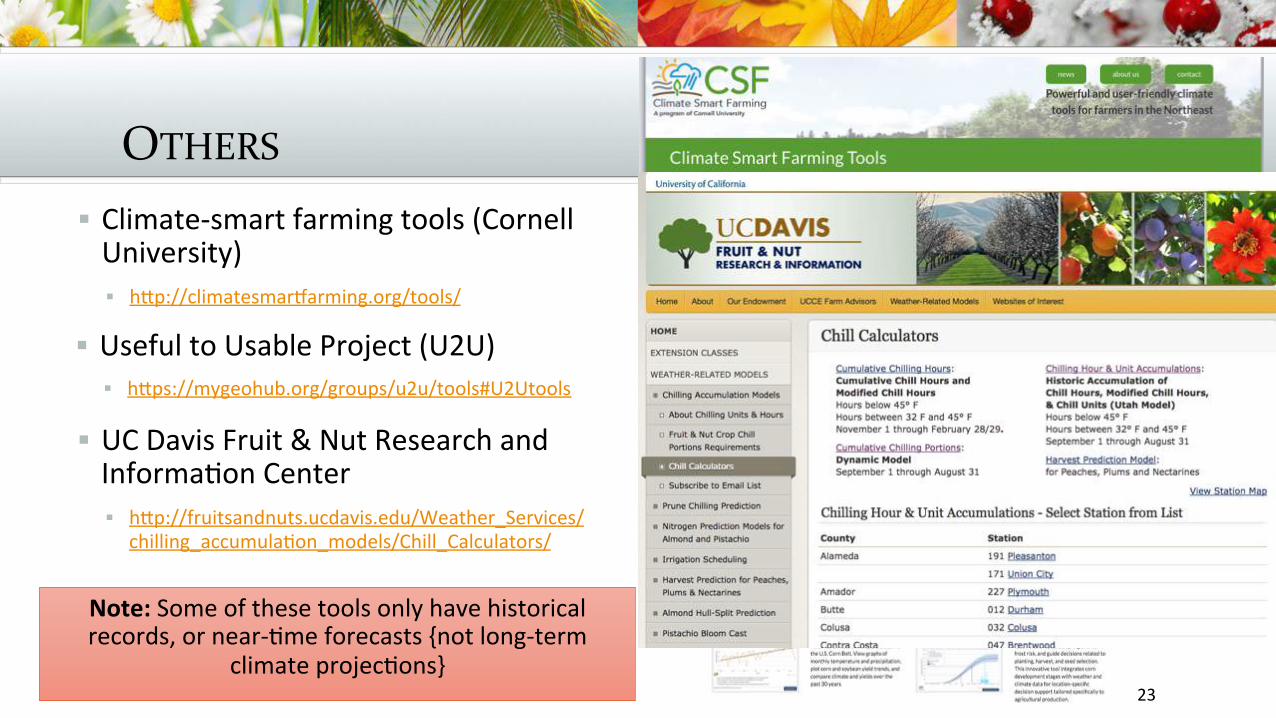
OTHERS§ Climate-smartfarmingtools(CornellUniversity)§ hfp://climatesmarxarming.org/tools/
23
§ UsefultoUsableProject(U2U)§ hfps://mygeohub.org/groups/u2u/tools#U2Utools
§ UCDavisFruit&NutResearchandInforma2onCenter§ hfp://fruitsandnuts.ucdavis.edu/Weather_Services/
chilling_accumula2on_models/Chill_Calculators/
Note:Someofthesetoolsonlyhavehistoricalrecords,ornear-2meforecasts{notlong-term
climateprojec2ons}

EXTRASLIDESCal-Adapt
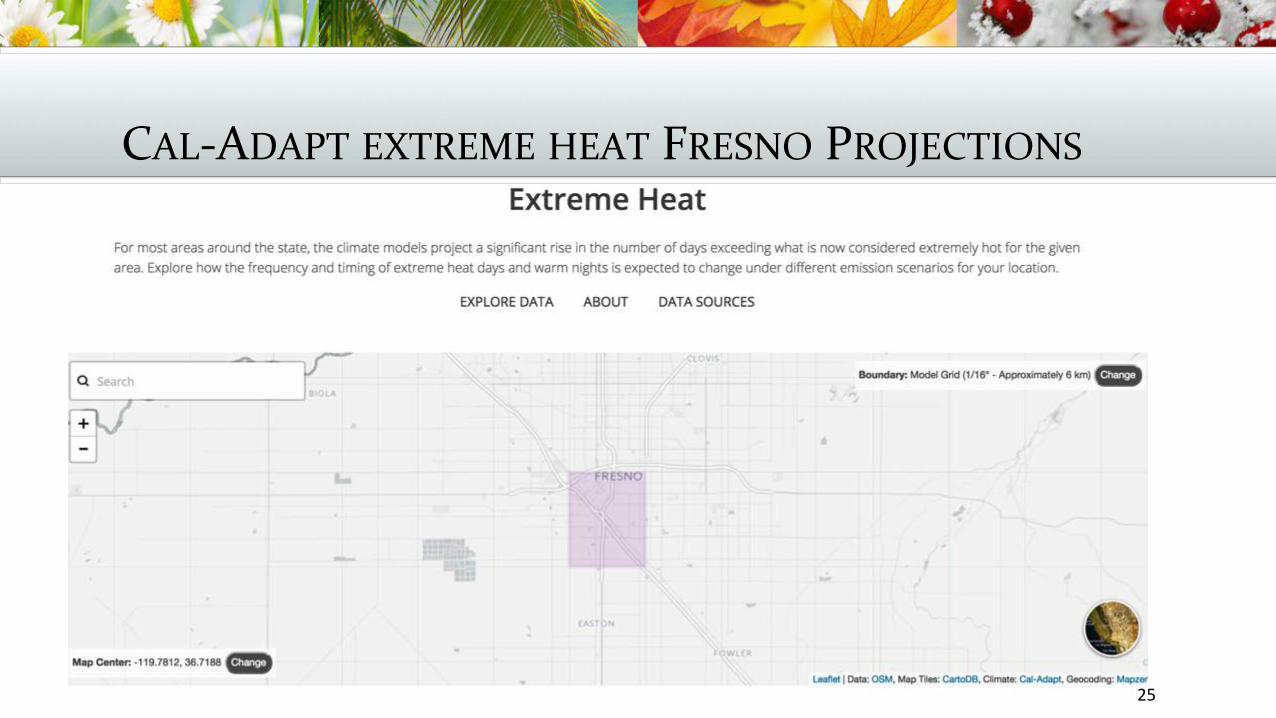
CAL-ADAPTEXTREMEHEATFRESNOPROJECTIONS
25
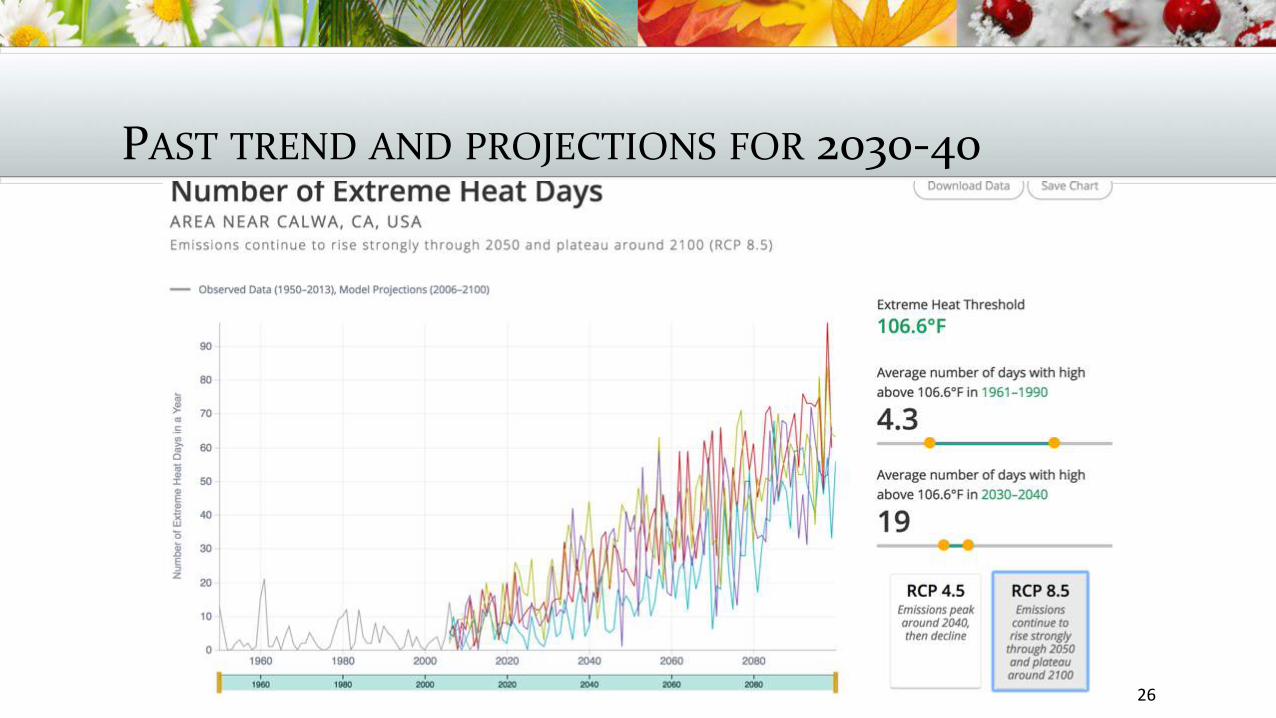
PASTTRENDANDPROJECTIONSFOR2030-40
26
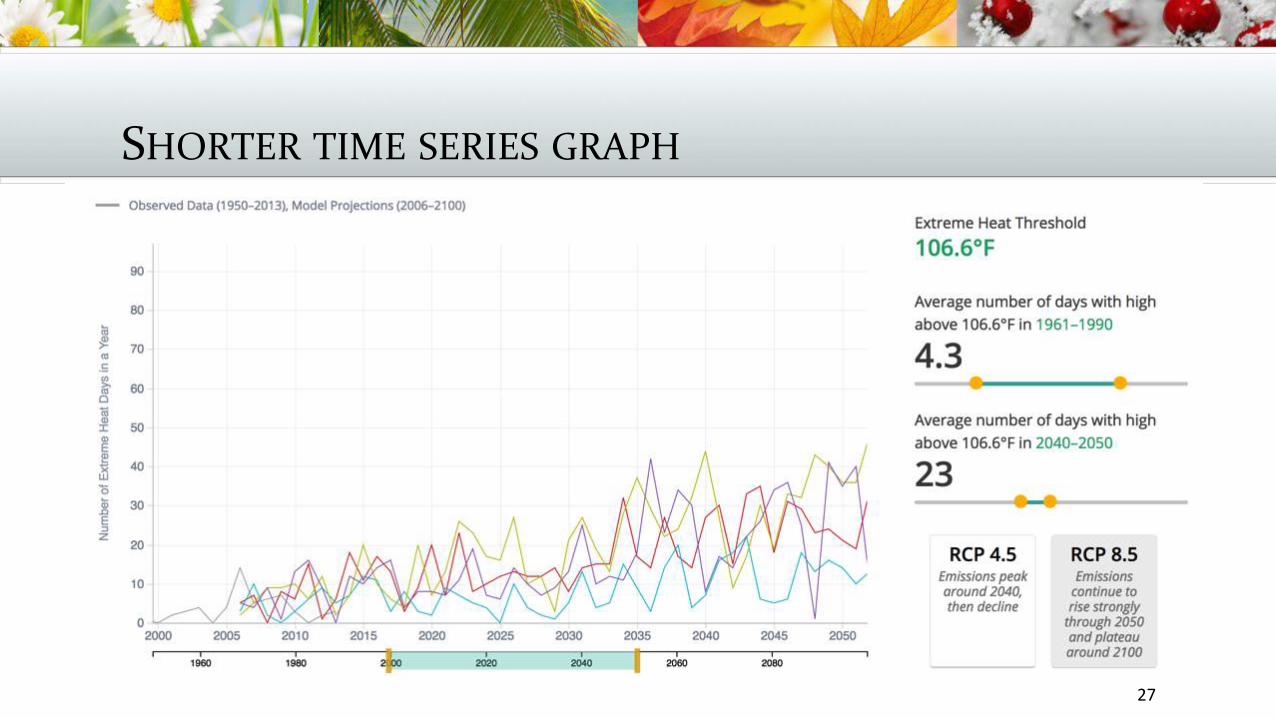
SHORTERTIMESERIESGRAPH
27
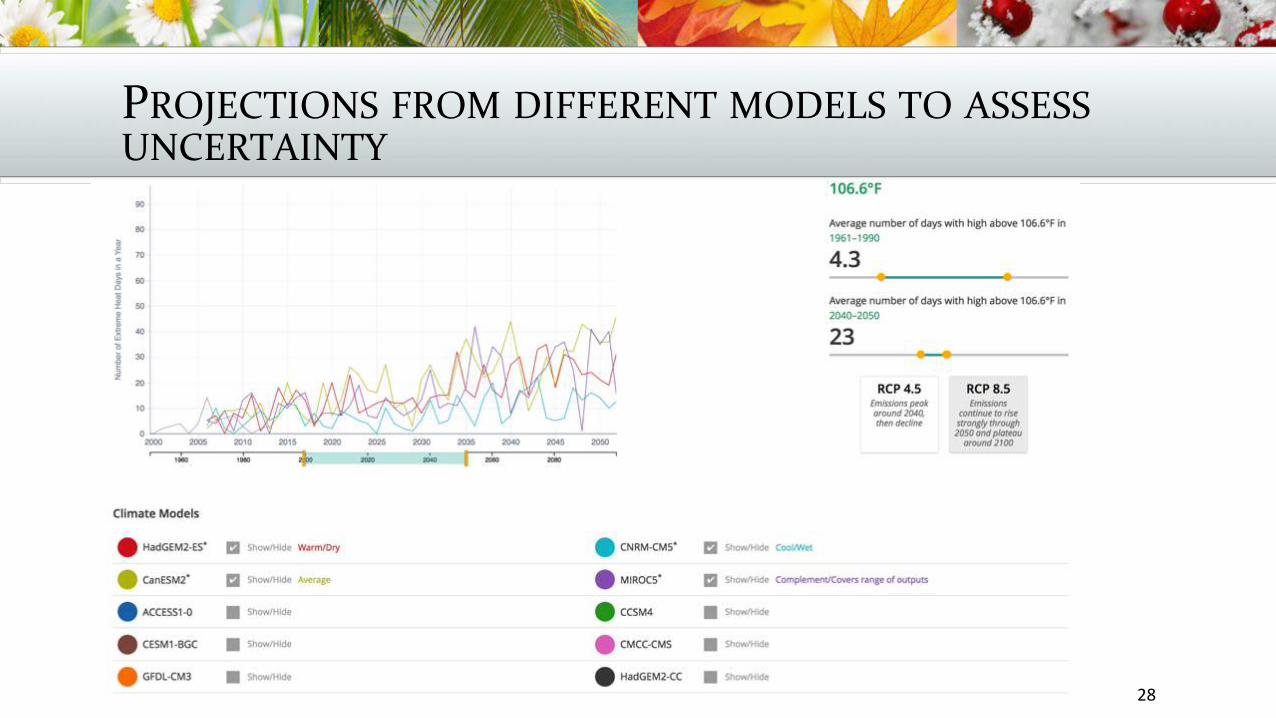
PROJECTIONSFROMDIFFERENTMODELSTOASSESSUNCERTAINTY
28
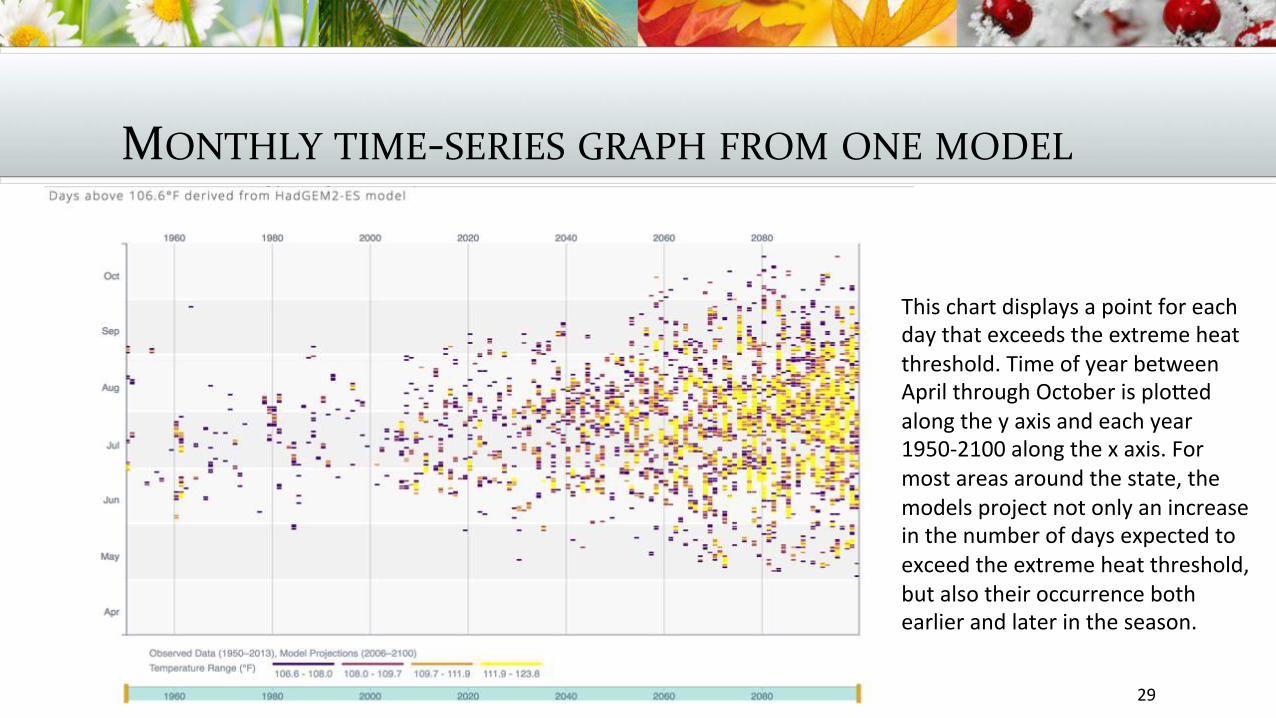
MONTHLYTIME-SERIESGRAPHFROMONEMODEL
29
Thischartdisplaysapointforeachdaythatexceedstheextremeheatthreshold.TimeofyearbetweenAprilthroughOctoberisplofedalongtheyaxisandeachyear1950-2100alongthexaxis.Formostareasaroundthestate,themodelsprojectnotonlyanincreaseinthenumberofdaysexpectedtoexceedtheextremeheatthreshold,butalsotheiroccurrencebothearlierandlaterintheseason.
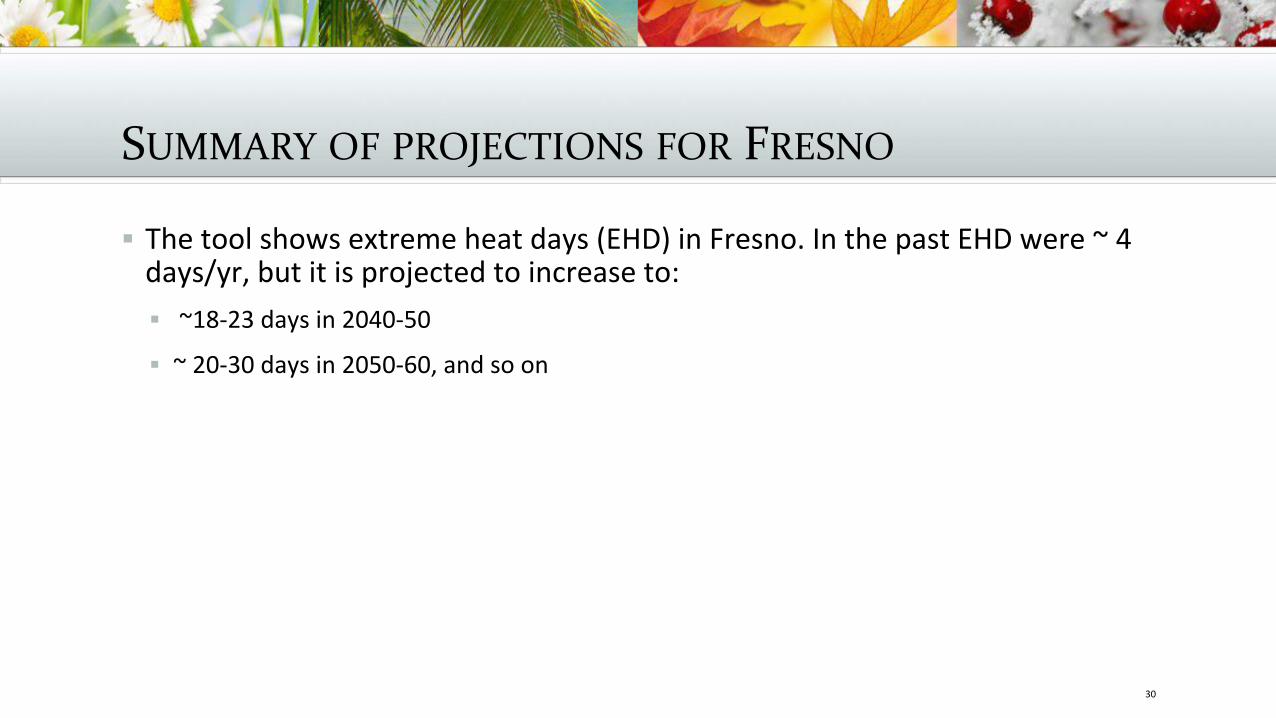
SUMMARYOFPROJECTIONSFORFRESNO
§ Thetoolshowsextremeheatdays(EHD)inFresno.InthepastEHDwere~4days/yr,butitisprojectedtoincreaseto:§ ~18-23daysin2040-50
§ ~20-30daysin2050-60,andsoon
30
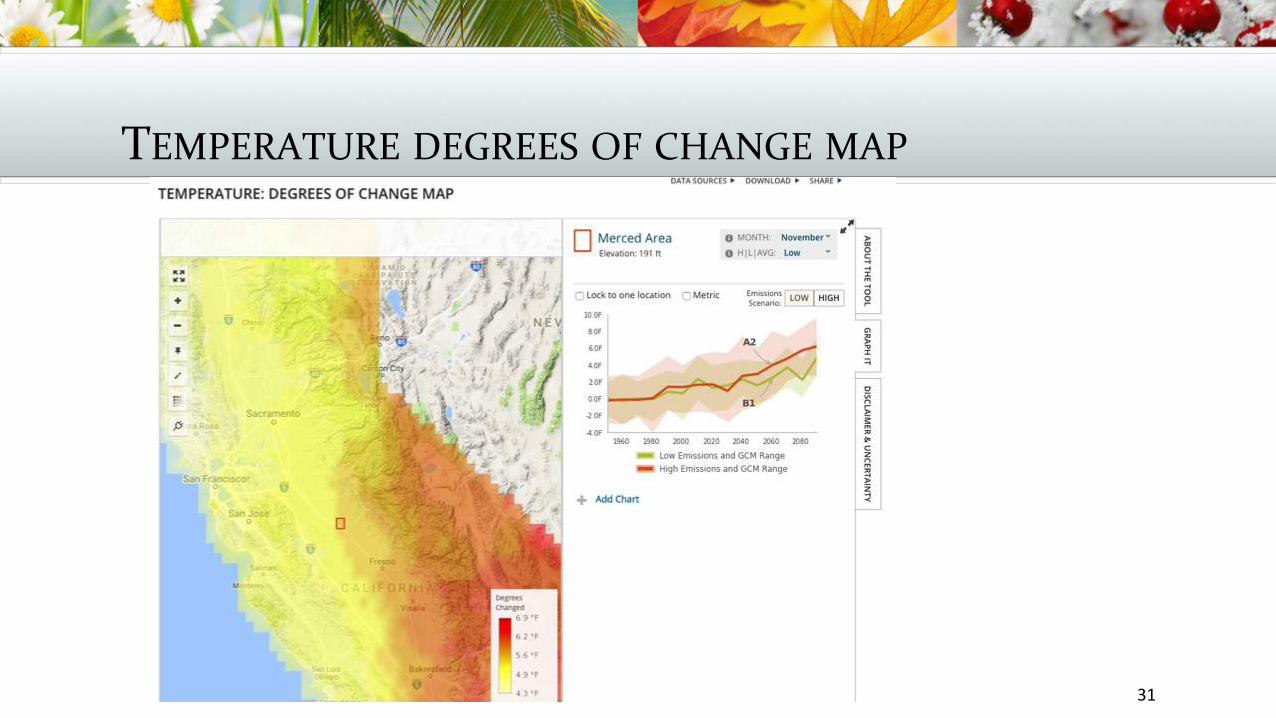
TEMPERATUREDEGREESOFCHANGEMAP
31