Embed Size (px)
Citation preview
Mid-Year Analysis of Homicides and Nonfatal Shootings
Milwaukee Homicide Review Commission
July 29, 2011
1
Introduction
This report summarizes homicide and nonfatal shooting data for the first six months of 2011. It provides incidence (e.g., the number of new homicides), as well as demographic data on victims and suspects. The data comes from the Milwaukee Homicide Review Commission (MHRC).
2
About MHRC
MHRC is a multi-level and multi-disciplinary collaborative that seeks to not only improve community safety but also increase the quality of life of all residents. MHRC provides technical assistance in violence prevention by assisting law enforcement and social service agencies in program/policy development and evaluation. MHRC maintains a comprehensive database of homicide, nonfatal shootings, and near fatal domestic violence incidents.
3
Methodology Notes• Data is accurate as of July 6, 2011. Any new suspects
identified after this date were not included in the report.
• Data periods covered: January 1 – June 30 for 2010 and 2011. When we refer to “2010” or “2011”, we a referring to only those cases that occurred during the first six months of each year.
• Suspect demographic data (e.g., race, gender) is unduplicated. If a suspect was involved in more than one incident, that suspect is only counted once.
• Both primary and secondary factors (top two reasons why the incident occurred) are reported for all circumstance-related data.
• Percents may not add up to 100% due to rounding.
4
New in this Report
• Number of homicides by Milwaukee police districts. This is in addition to zip code level data.
• Number of nonfatal shooting suspects that were eligible to carry concealed weapons. This is in addition to the number of victims or suspects that have a criminal history or were under supervision at the time of the incident.
• Number of cleared homicide and nonfatal shooting cases to date. This number changes daily as new suspects are identified and charged. This number does not reflect trial outcomes.
5
Homicides
6
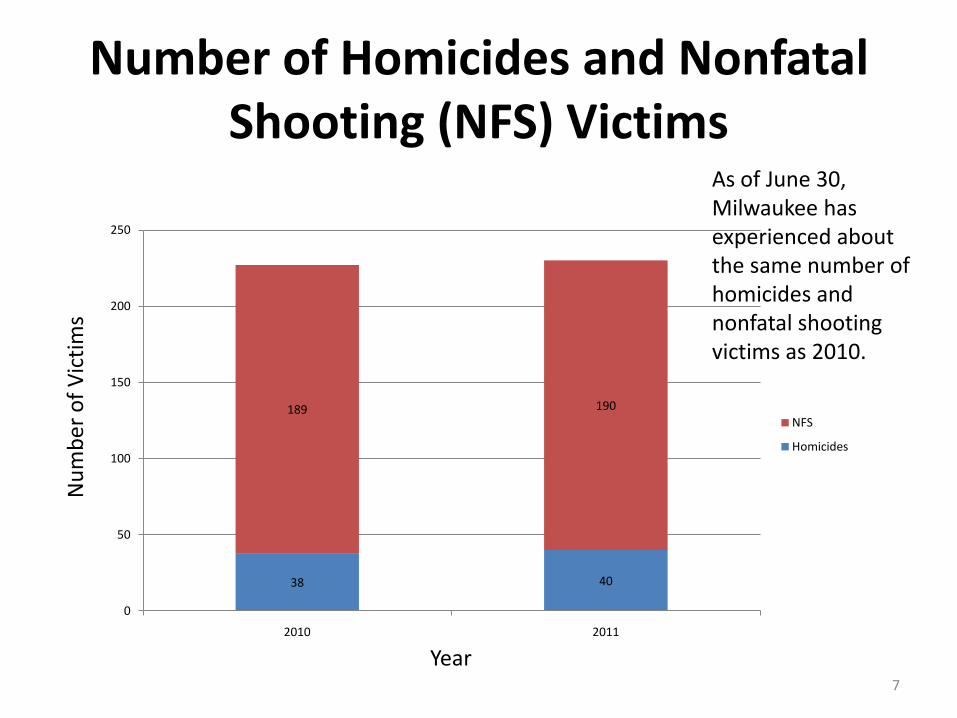
Number of Homicides and Nonfatal Shooting (NFS) Victims
38 40
189 190
0
50
100
150
200
250
2010 2011
NFS
Homicides
As of June 30, Milwaukee has experienced about the same number of homicides and nonfatal shooting victims as 2010.
Year
Nu
mb
er
of
Vic
tim
s
7
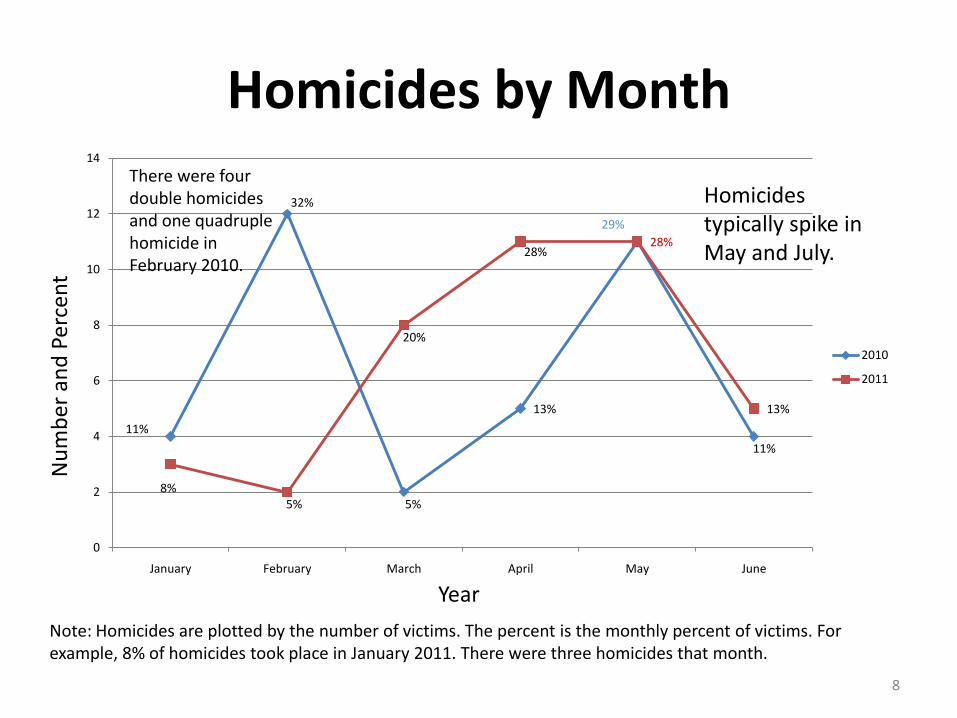
Homicides by Month
11%
32%
5%
13%
28%
11%
8%5%
20%
28%
29%
13%
0
2
4
6
8
10
12
14
January February March April May June
2010
2011
Note: Homicides are plotted by the number of victims. The percent is the monthly percent of victims. For example, 8% of homicides took place in January 2011. There were three homicides that month.
8
Nu
mb
er
and
Per
cen
t
Year
There were four double homicides and one quadruple homicide in February 2010.
Homicides typically spike in May and July.
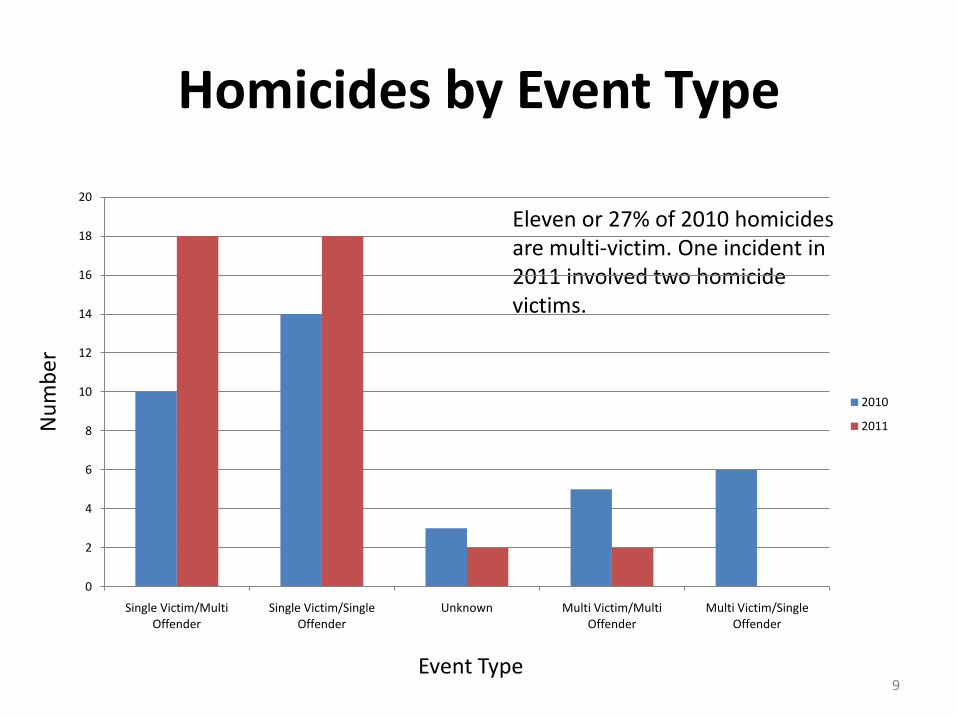
Homicides by Event Type
Eleven or 27% of 2010 homicides are multi-victim. One incident in 2011 involved two homicide victims.
9
0
2
4
6
8
10
12
14
16
18
20
Single Victim/Multi Offender
Single Victim/Single Offender
Unknown Multi Victim/Multi Offender
Multi Victim/Single Offender
2010
2011
Event Type
Nu
mb
er
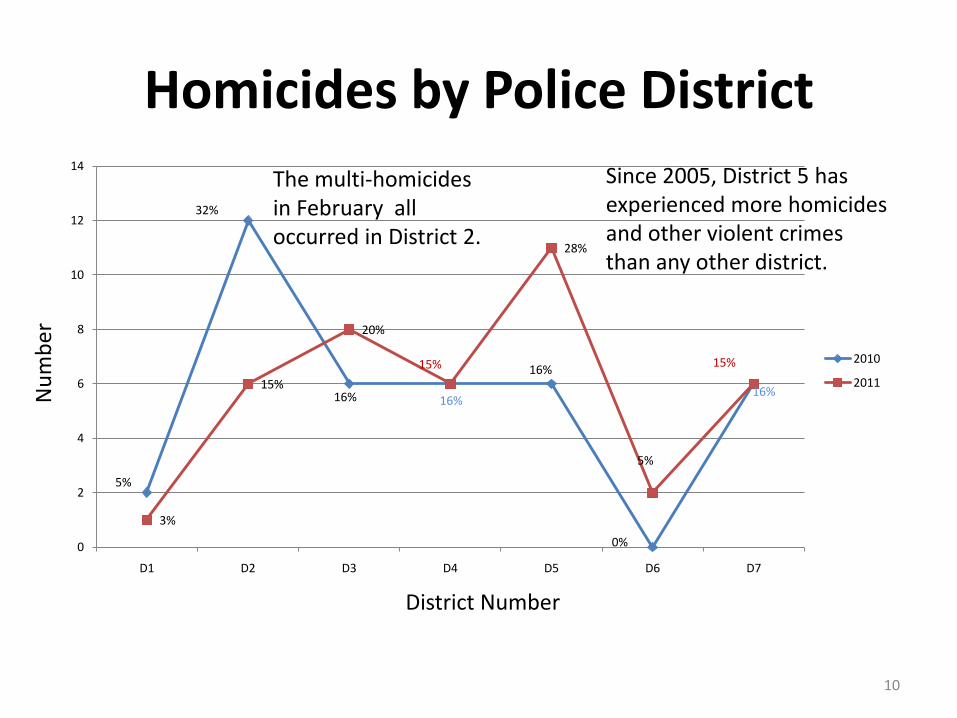
Homicides by Police District
10
5%
32%
16% 16%
16%
0%
16%
3%
15%
20%
15%
28%
5%
15%
0
2
4
6
8
10
12
14
D1 D2 D3 D4 D5 D6 D7
2010
2011
District Number
Nu
mb
er
The multi-homicides in February all occurred in District 2.
Since 2005, District 5 has experienced more homicides and other violent crimes than any other district.
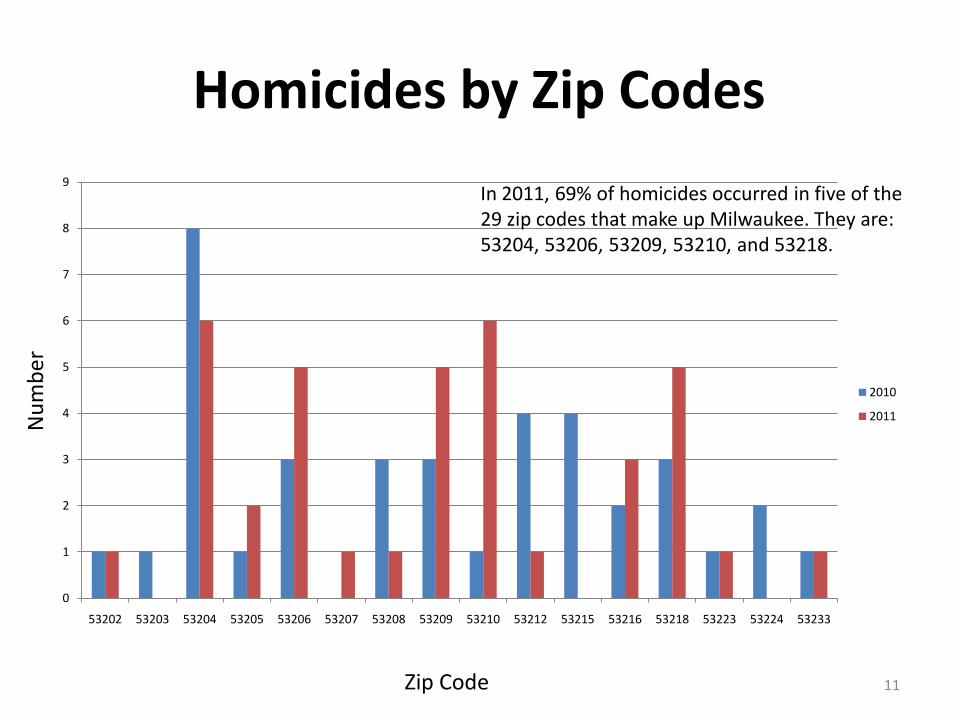
Homicides by Zip Codes
11
0
1
2
3
4
5
6
7
8
9
53202 53203 53204 53205 53206 53207 53208 53209 53210 53212 53215 53216 53218 53223 53224 53233
2010
2011
Zip Code
Nu
mb
er
In 2011, 69% of homicides occurred in five of the 29 zip codes that make up Milwaukee. They are: 53204, 53206, 53209, 53210, and 53218.
0
2
4
6
8
10
12
14
16
18
2010
2011
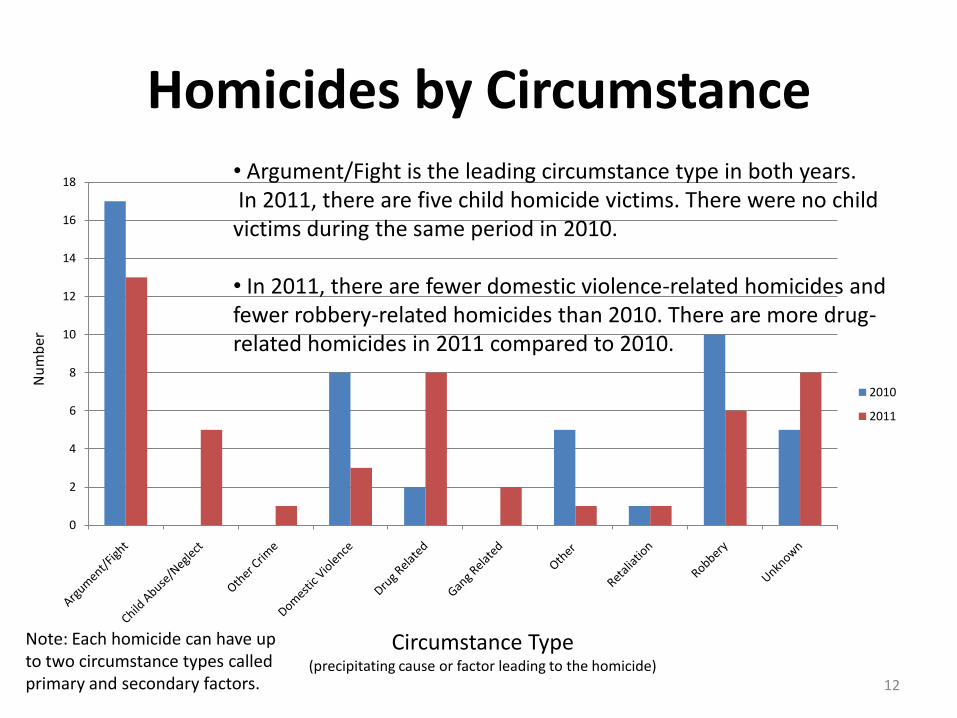
Homicides by Circumstance• Argument/Fight is the leading circumstance type in both years.In 2011, there are five child homicide victims. There were no child victims during the same period in 2010.
• In 2011, there are fewer domestic violence-related homicides and fewer robbery-related homicides than 2010. There are more drug-related homicides in 2011 compared to 2010.
12
Circumstance Type(precipitating cause or factor leading to the homicide)
Nu
mb
er
Note: Each homicide can have up to two circumstance types called primary and secondary factors.
0
5
10
15
20
25
30
Children & Youth Young Adult Adult Older Adult
2010
2011
Homicide Victim by Age Category
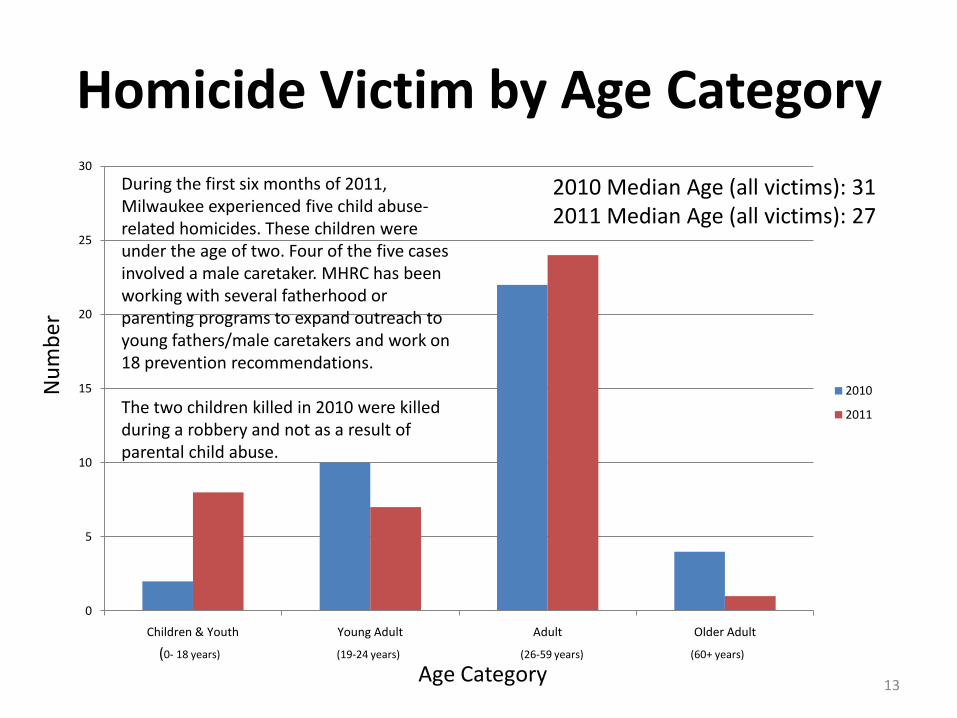
2010 Median Age (all victims): 312011 Median Age (all victims): 27
During the first six months of 2011, Milwaukee experienced five child abuse-related homicides. These children were under the age of two. Four of the five cases involved a male caretaker. MHRC has been working with several fatherhood or parenting programs to expand outreach to young fathers/male caretakers and work on 18 prevention recommendations.
The two children killed in 2010 were killed during a robbery and not as a result of parental child abuse.
13Age Category
Nu
mb
er
(0- 18 years) (19-24 years) (26-59 years) (60+ years)
Homicide Victim by Gender
14
Year
Perc
ent
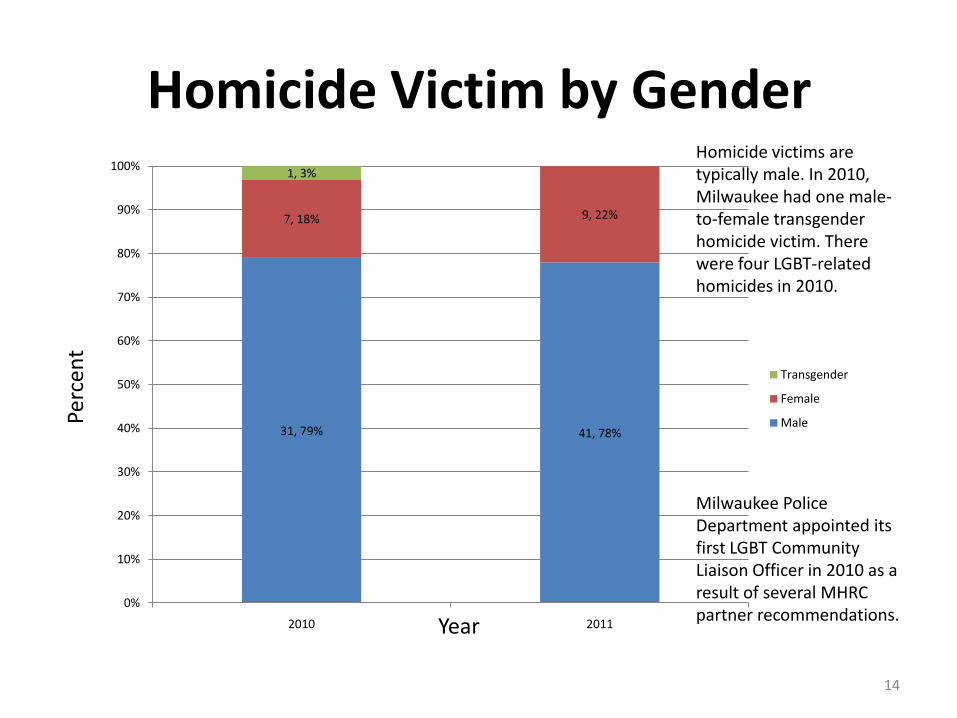
Homicide victims are typically male. In 2010, Milwaukee had one male-to-female transgender homicide victim. There were four LGBT-related homicides in 2010.
Milwaukee Police Department appointed its first LGBT Community Liaison Officer in 2010 as a result of several MHRC partner recommendations.
31, 79% 41, 78%
7, 18% 9, 22%
1, 3%
0%
10%
20%
30%
40%
50%
60%
70%
80%
90%
100%
2010 2011
Transgender
Female
Male
Homicide Victim by Race
15
Race
Nu
mb
er
3%
55%
13%
26%
3%
75%
20%
5%
0
5
10
15
20
25
30
Am. Indian Black Latino White Other
2010
2011
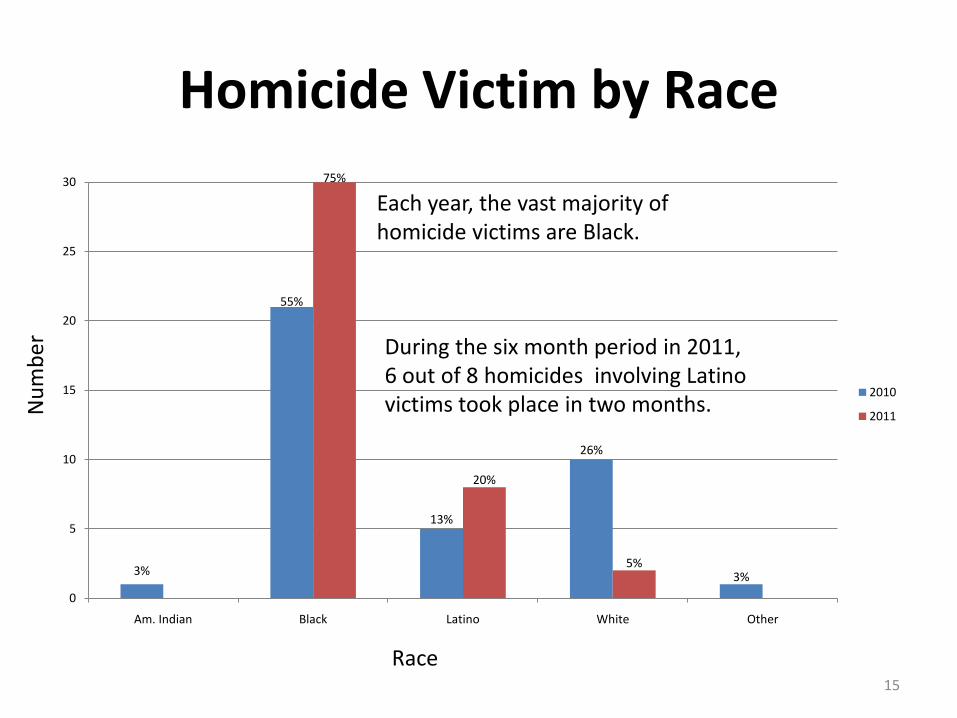
Each year, the vast majority of homicide victims are Black.
During the six month period in 2011, 6 out of 8 homicides involving Latino victims took place in two months.
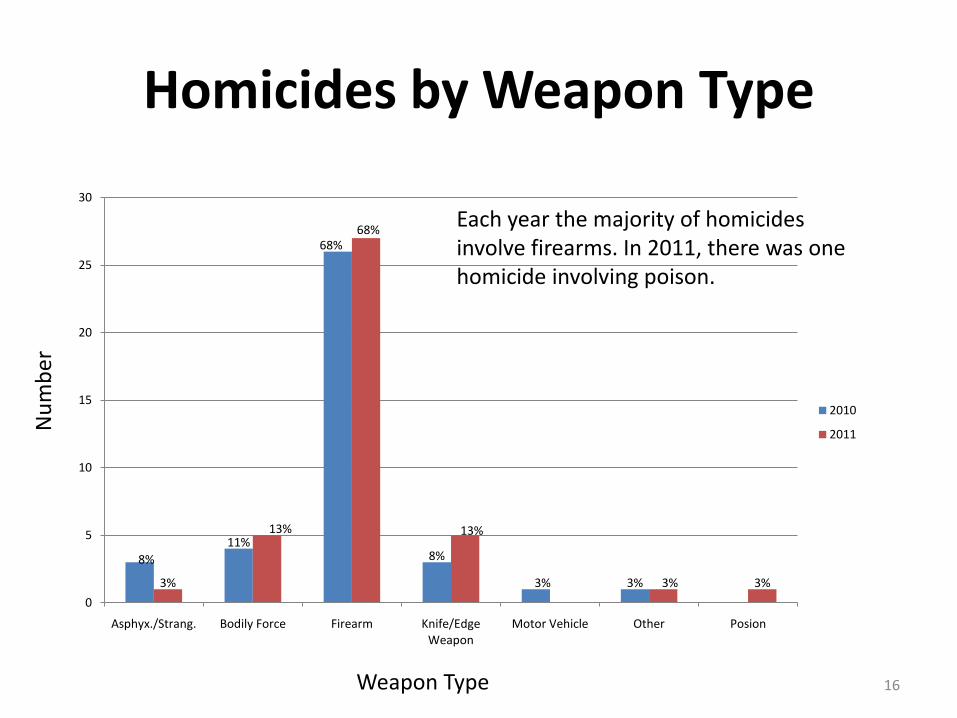
Homicides by Weapon Type
16
8%
11%
68%
8%
3% 3%3%
13%
68%
13%
3% 3%
0
5
10
15
20
25
30
Asphyx./Strang. Bodily Force Firearm Knife/Edge Weapon
Motor Vehicle Other Posion
2010
2011
Weapon Type
Nu
mb
er
Each year the majority of homicides involve firearms. In 2011, there was one homicide involving poison.
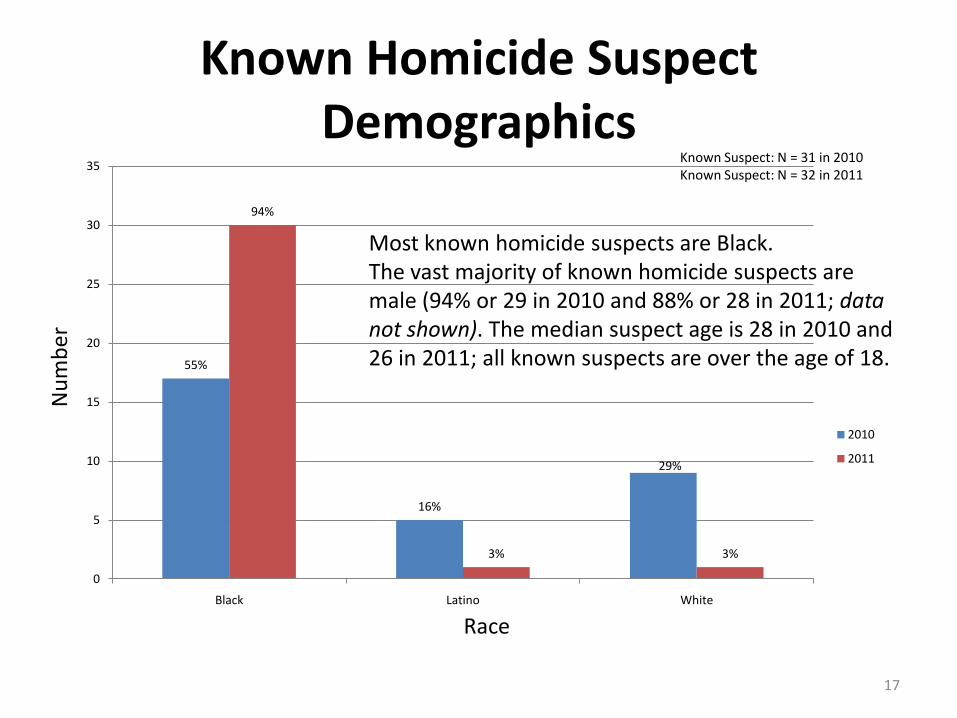
Known Homicide Suspect Demographics
17
Known Suspect: N = 31 in 2010Known Suspect: N = 32 in 2011
55%
16%
29%
94%
3% 3%
0
5
10
15
20
25
30
35
Black Latino White
2010
2011
Race
Nu
mb
er
Most known homicide suspects are Black.The vast majority of known homicide suspects are male (94% or 29 in 2010 and 88% or 28 in 2011; data not shown). The median suspect age is 28 in 2010 and 26 in 2011; all known suspects are over the age of 18.
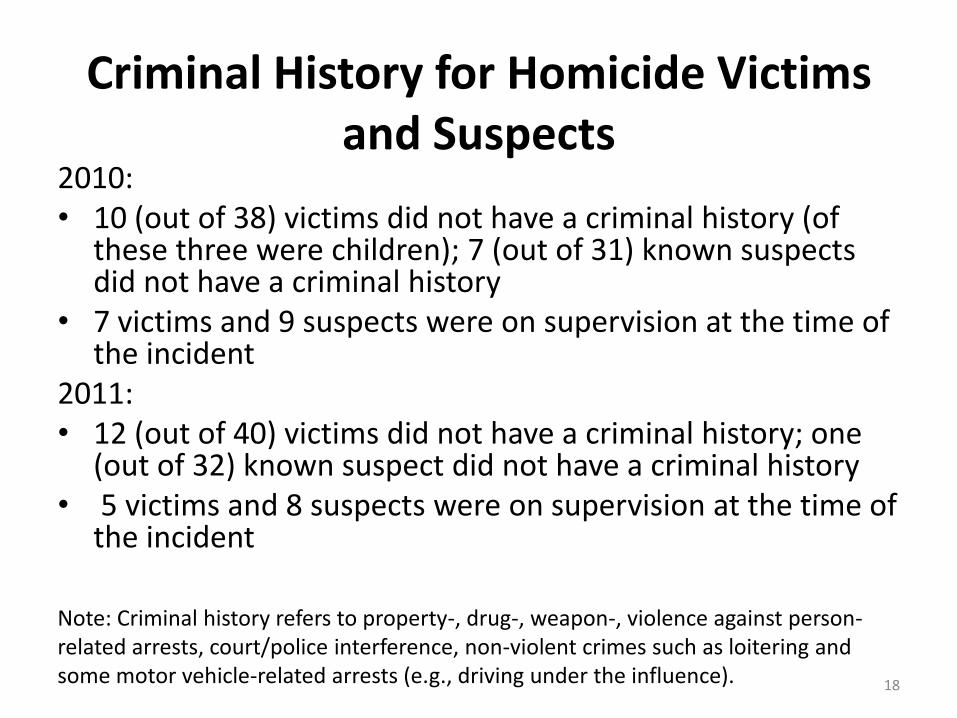
Criminal History for Homicide Victims and Suspects
2010: • 10 (out of 38) victims did not have a criminal history (of
these three were children); 7 (out of 31) known suspects did not have a criminal history
• 7 victims and 9 suspects were on supervision at the time of the incident
2011:• 12 (out of 40) victims did not have a criminal history; one
(out of 32) known suspect did not have a criminal history• 5 victims and 8 suspects were on supervision at the time of
the incident
18
Note: Criminal history refers to property-, drug-, weapon-, violence against person-related arrests, court/police interference, non-violent crimes such as loitering and some motor vehicle-related arrests (e.g., driving under the influence).
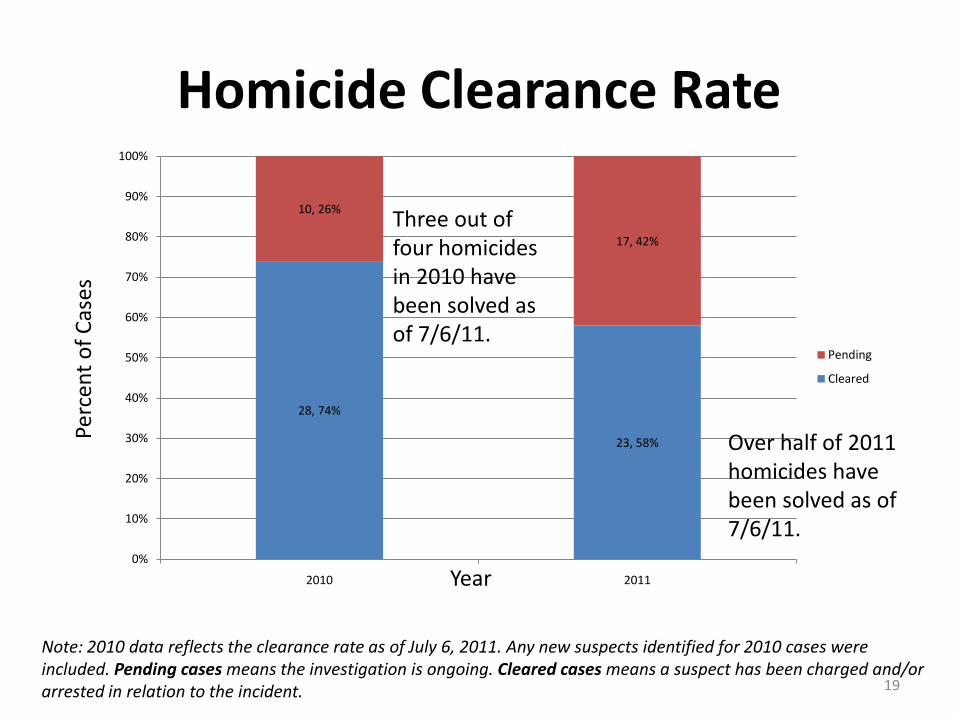
28, 74%
23, 58%
10, 26%
17, 42%
0%
10%
20%
30%
40%
50%
60%
70%
80%
90%
100%
2010 2011
Pending
Cleared
Homicide Clearance Rate
Note: 2010 data reflects the clearance rate as of July 6, 2011. Any new suspects identified for 2010 cases were included. Pending cases means the investigation is ongoing. Cleared cases means a suspect has been charged and/or arrested in relation to the incident.
Perc
ent
of
Cas
es
Year
Three out of four homicides in 2010 have been solved as of 7/6/11.
Over half of 2011 homicides have been solved as of 7/6/11.
19
Nonfatal Shootings (NFS)
20
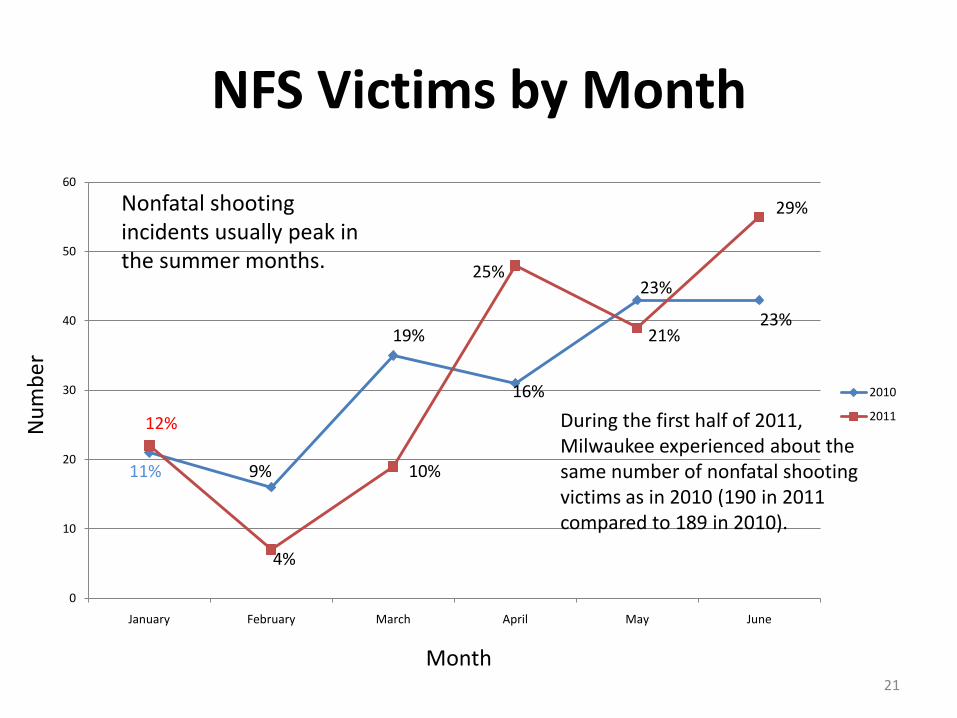
NFS Victims by Month
0
10
20
30
40
50
60
January February March April May June
2010
201112%
11%
4%
10%
25%
21%
29%
16%
19%
9%
23%
23%
21
Month
Nu
mb
er
During the first half of 2011, Milwaukee experienced about the same number of nonfatal shooting victims as in 2010 (190 in 2011 compared to 189 in 2010).
Nonfatal shooting incidents usually peak in the summer months.
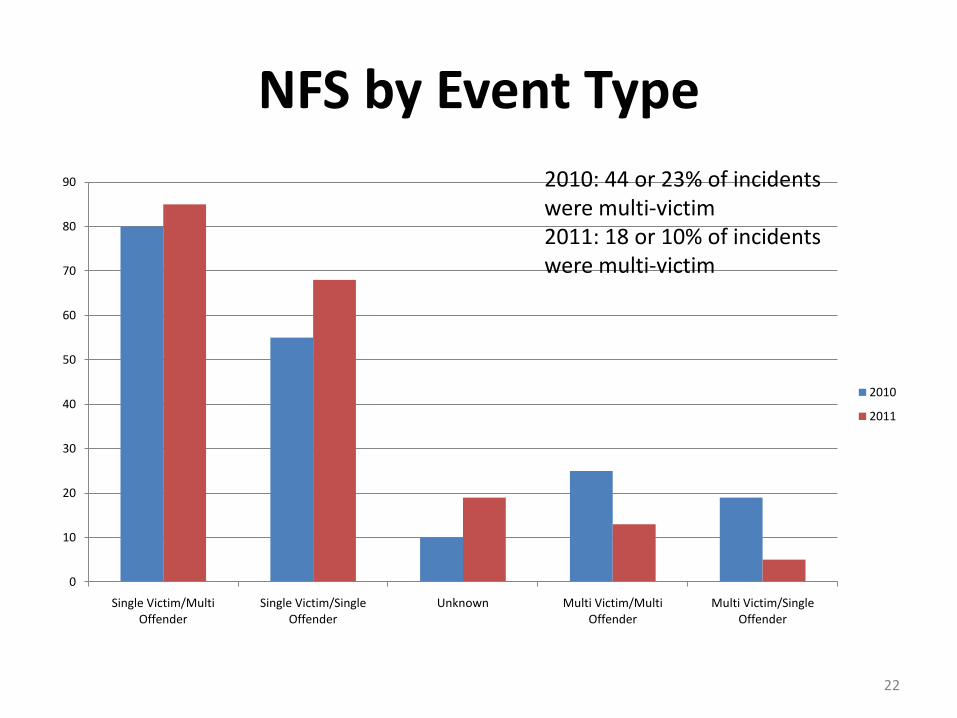
NFS by Event Type
0
10
20
30
40
50
60
70
80
90
Single Victim/Multi Offender
Single Victim/Single Offender
Unknown Multi Victim/Multi Offender
Multi Victim/Single Offender
2010
2011
2010: 44 or 23% of incidents were multi-victim2011: 18 or 10% of incidents were multi-victim
22
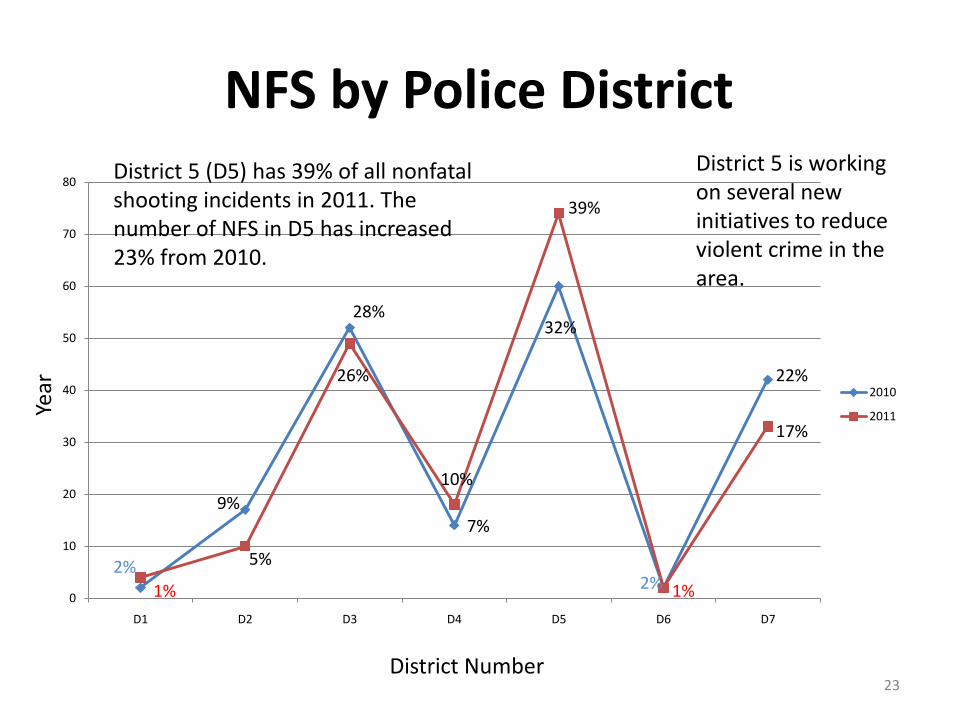
NFS by Police District
7%
0
10
20
30
40
50
60
70
80
D1 D2 D3 D4 D5 D6 D7
2010
2011
9%
5%
26%
10%
39%
1%
17%
2%
1%
32%28%
2%
22%
23District Number
Year
District 5 (D5) has 39% of all nonfatal shooting incidents in 2011. The number of NFS in D5 has increased 23% from 2010.
District 5 is working on several new initiatives to reduce violent crime in the area.
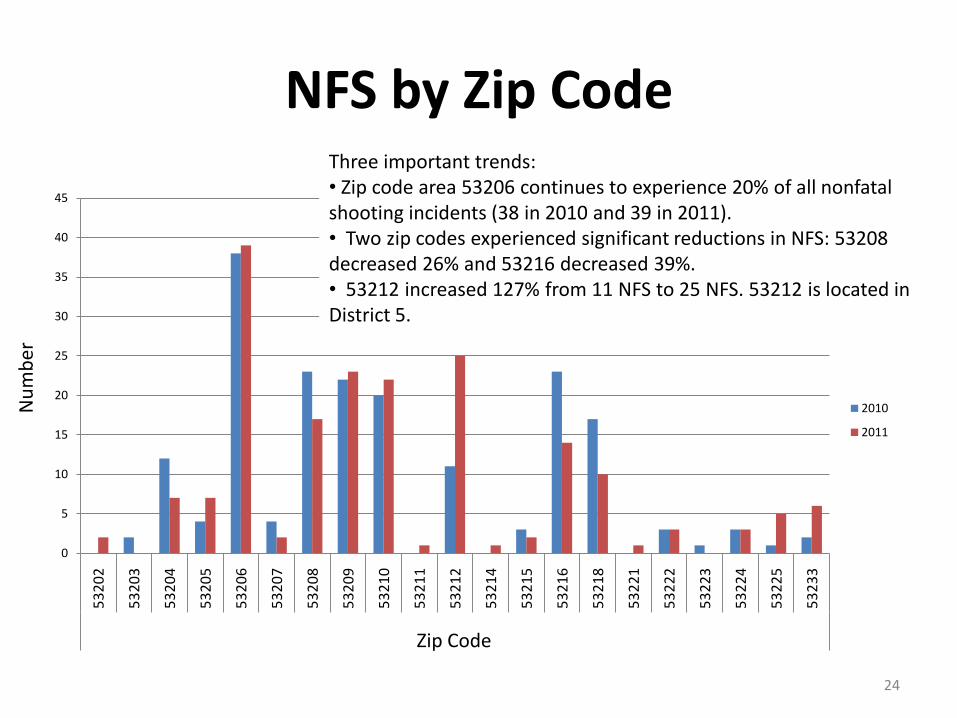
NFS by Zip Code
24
0
5
10
15
20
25
30
35
40
45
53
20
2
53
20
3
53
20
4
53
20
5
53
20
6
53
20
7
53
20
8
53
20
9
53
21
0
53
21
1
53
21
2
53
21
4
53
21
5
53
21
6
53
21
8
53
22
1
53
22
2
53
22
3
53
22
4
53
22
5
53
23
3
Zip Code
2010
2011
Three important trends: • Zip code area 53206 continues to experience 20% of all nonfatal shooting incidents (38 in 2010 and 39 in 2011). • Two zip codes experienced significant reductions in NFS: 53208 decreased 26% and 53216 decreased 39%. • 53212 increased 127% from 11 NFS to 25 NFS. 53212 is located in District 5.
Nu
mb
er
Zip Code
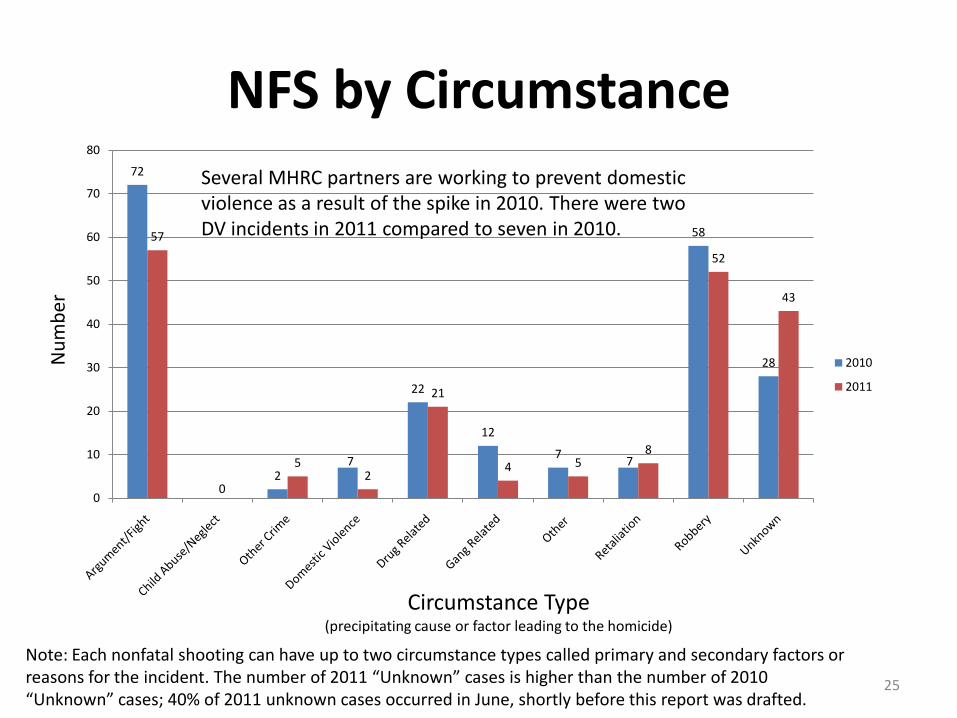
NFS by Circumstance72
02
7
22
12
77
58
28
57
52
21
4 58
52
43
0
10
20
30
40
50
60
70
80
2010
2011
25
Circumstance Type(precipitating cause or factor leading to the homicide)
Note: Each nonfatal shooting can have up to two circumstance types called primary and secondary factors or reasons for the incident. The number of 2011 “Unknown” cases is higher than the number of 2010 “Unknown” cases; 40% of 2011 unknown cases occurred in June, shortly before this report was drafted.
Several MHRC partners are working to prevent domestic violence as a result of the spike in 2010. There were two DV incidents in 2011 compared to seven in 2010.
Nu
mb
er
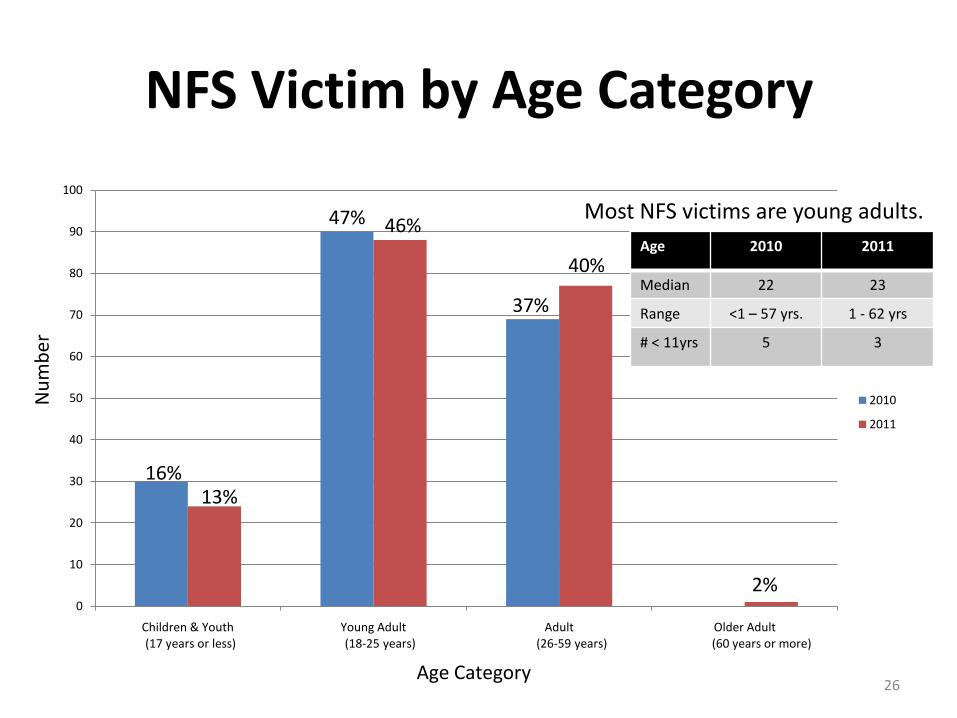
NFS Victim by Age Category
0
10
20
30
40
50
60
70
80
90
100
Children & Youth Young Adult Adult Older Adult
2010
2011
37%
13%16%
2%
40%
46%47% Most NFS victims are young adults.
(17 years or less) (18-25 years) (26-59 years) (60 years or more)
26
Age 2010 2011
Median 22 23
Range <1 – 57 yrs. 1 - 62 yrs
# < 11yrs 5 3
Nu
mb
er
Age Category
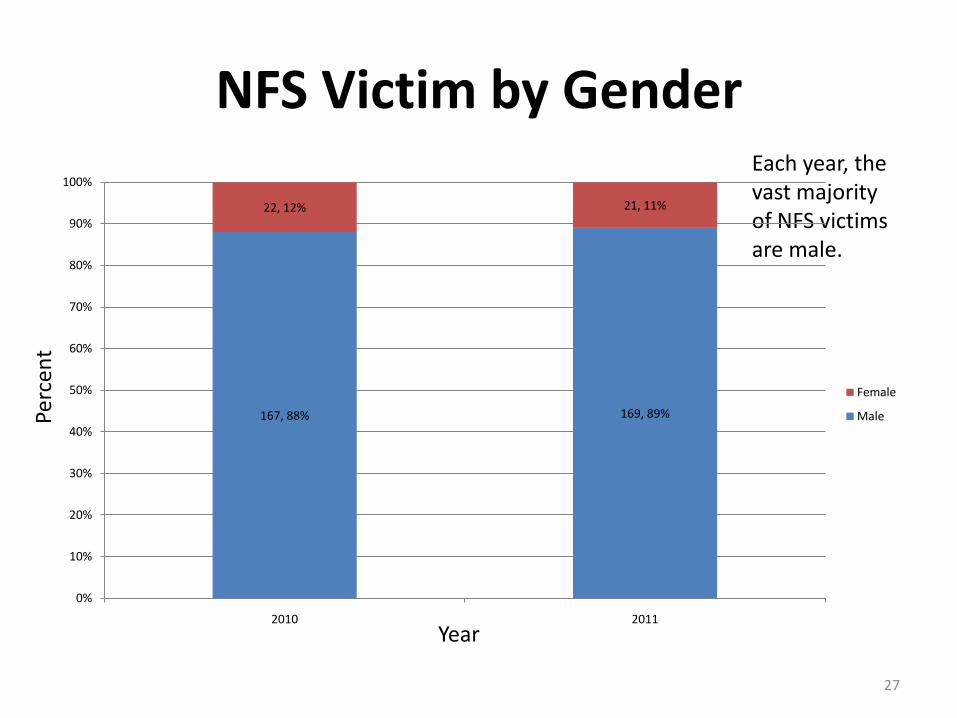
NFS Victim by Gender
27
Year
Perc
ent
Each year, the vast majority of NFS victims are male.
167, 88% 169, 89%
22, 12% 21, 11%
0%
10%
20%
30%
40%
50%
60%
70%
80%
90%
100%
2010 2011
Female
Male
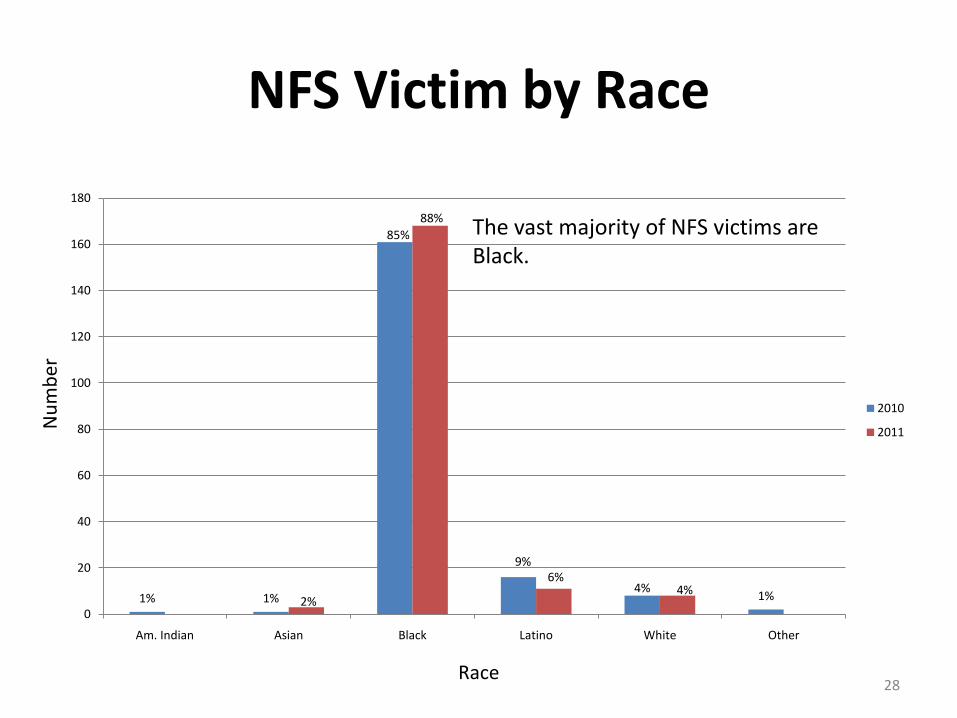
NFS Victim by Race
28
1% 1%
85%
9%
4%1%2%
88%
6%4%
0
20
40
60
80
100
120
140
160
180
Am. Indian Asian Black Latino White Other
2010
2011
The vast majority of NFS victims are Black.
Nu
mb
er
Race
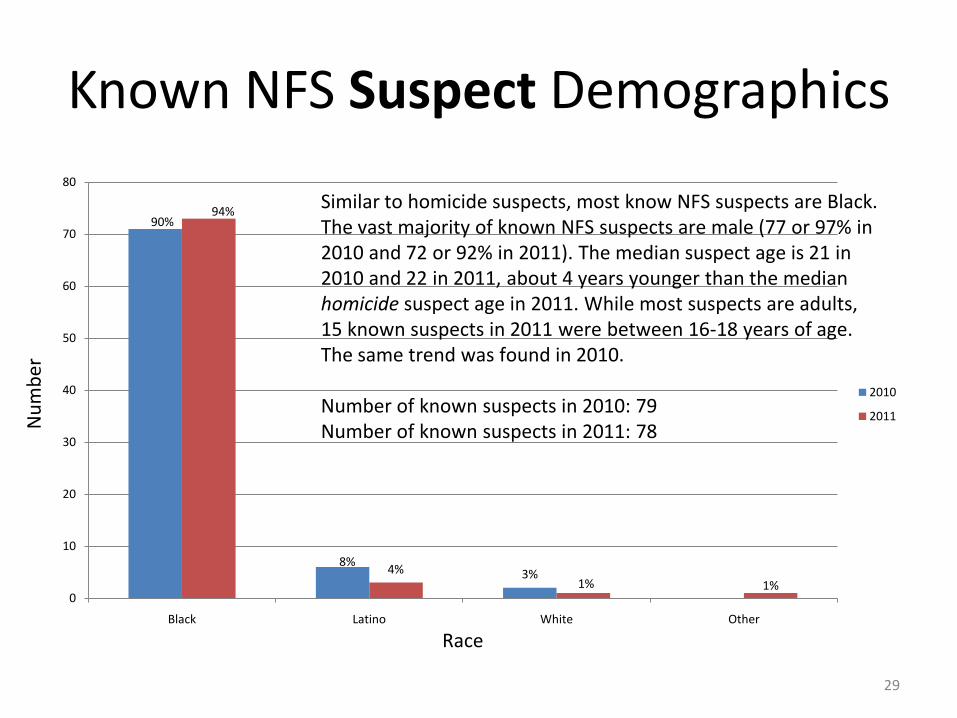
Known NFS Suspect Demographics
29
90%
8%3%
94%
4%1% 1%
0
10
20
30
40
50
60
70
80
Black Latino White Other
2010
2011
Similar to homicide suspects, most know NFS suspects are Black. The vast majority of known NFS suspects are male (77 or 97% in 2010 and 72 or 92% in 2011). The median suspect age is 21 in 2010 and 22 in 2011, about 4 years younger than the median homicide suspect age in 2011. While most suspects are adults, 15 known suspects in 2011 were between 16-18 years of age. The same trend was found in 2010.
Number of known suspects in 2010: 79Number of known suspects in 2011: 78N
um
ber
Race
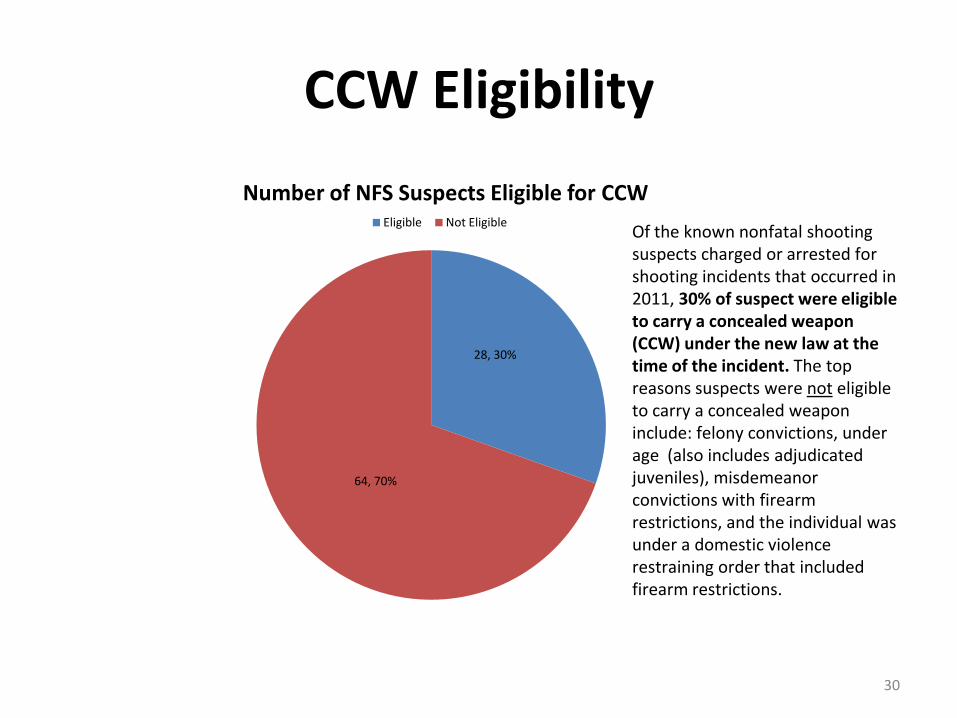
CCW Eligibility
28, 30%
64, 70%
Number of NFS Suspects Eligible for CCWEligible Not Eligible
Of the known nonfatal shooting suspects charged or arrested for shooting incidents that occurred in 2011, 30% of suspect were eligible to carry a concealed weapon (CCW) under the new law at the time of the incident. The top reasons suspects were not eligible to carry a concealed weapon include: felony convictions, under age (also includes adjudicated juveniles), misdemeanor convictions with firearm restrictions, and the individual was under a domestic violence restraining order that included firearm restrictions.
30
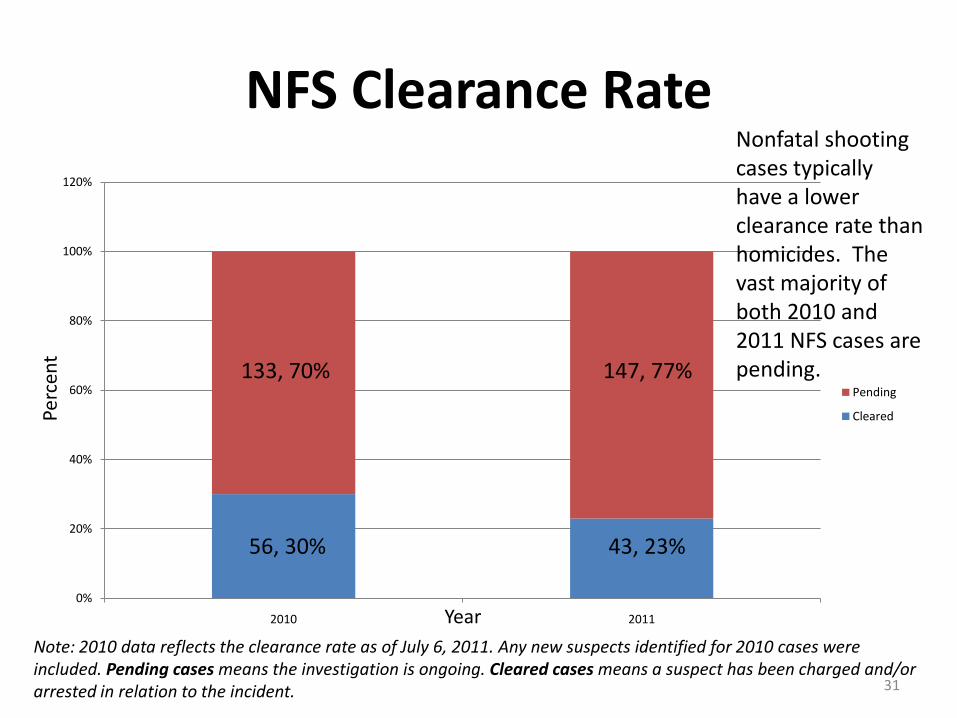
NFS Clearance Rate
0%
20%
40%
60%
80%
100%
120%
2010 2011
Pending
Cleared
43, 23%56, 30%
147, 77%133, 70%
31
Nonfatal shooting cases typically have a lower clearance rate than homicides. The vast majority of both 2010 and 2011 NFS cases are pending.
Note: 2010 data reflects the clearance rate as of July 6, 2011. Any new suspects identified for 2010 cases were included. Pending cases means the investigation is ongoing. Cleared cases means a suspect has been charged and/or arrested in relation to the incident.
Perc
ent
Year
Year-end Report
Each year MHRC produces a year-end data report on homicides and nonfatal shootings. Look for the next report in March of 2012.
All MHRC data reports are available online at www.milwaukee.gov/hrc
32
Citation and Contact Information
Suggested Citation:
Mid-Year Analysis of Homicides and Nonfatal Shootings (2011). Milwaukee Homicide Review Commission: Milwaukee, WI.
For more information about the data included in this report or to request data:
Contact Nicole Robinson, MPH/MSW, Associate Researcher at [email protected] or 414-935-7625.
33