Embed Size (px)
Citation preview

2016 Milwaukee Homicide Review Commission Annual Report 1
2016 Annual Report:
Homicides and
Nonfatal Shootings in
Milwaukee
Milwaukee Homicide Review Commission
2 2016 Milwaukee Homicide Review Commission Annual Report
Mission
Working together to reduce violence through innovative interagency collaboration.
Vision
A community where residents, community organizations, and law enforcement
professionals work together to decrease violence.

2016 Milwaukee Homicide Review Commission Annual Report 3
AUTHORS Salmafatima S Abadin, MPH Violence Prevention Research Coordinator, Milwaukee Homicide Review Commission, City of Milwaukee Health Department Office of Violence Prevention Mallory E O’Brien, PhD, MS Director, Milwaukee Homicide Review Commission, Assistant Professor, Medical College of Wisconsin
ACKNOWLEDGEMENTS There are many individuals, agencies and organizations throughout the City of Milwaukee, the State, and across the nation that we must thank for their ongoing support and partnership. In particular, we want to acknowledge the members of the Executive Committee whose support and guidance have led the way to ensure the success of the Milwaukee Homicide Review Commission, and the City of Milwaukee Health Department’s Office of Violence Prevention whose engagement and support over the years has been instrumental. We also thank community service providers, neighborhood associ-ations, residents, law enforcement, representatives of the criminal justice system, and others who routinely participate in the review process. Without your knowledge and expertise, we would not be able to accomplish this important work. Over the years, the Milwaukee Homicide Review Commission activities were funded, in part, by the Greater Milwaukee Foundation, US Department of Justice Project Safe Neighborhoods, Community-Oriented Policing and US Department of Justice, National Institutes of Justice.
SUGGESTED CITATION Abadin, S and O’Brien, M. 2016 Milwaukee Homicide Review Commission Annual Report. Milwau-kee Homicide Review Commission and City of Milwaukee Health Department, September 2017.

4 2016 Milwaukee Homicide Review Commission Annual Report
The Milwaukee Homicide Review Commission dedicates this report to the victims of homi-
cides and nonfatal shootings in Milwaukee in 2016 and remembers the 139 lives lost due to
violence.
Marques Addison, 24 Terry Giesler, 46 Earnest Love, 32 Leroy Singleton, 42
Carnelle Adkins, 29 Anton Gillon, 27 Kemone Love, 17 Andrico Slaughter, 29
Deandre Allen, 27 Justin Girtler, 32 Shelby Manriquez, 63 Judy Smith, 49
Demarion Allen, 18 Ilona Gonzalez, 30 Jesus Manso-Perez, 40 Sidney Smith, 46
Arturo Arvelo, 12 Lazarus Gray, 22 Madyson Marshel, 4 Tabitha Smith, 47
Hermalinda Arvelo, 45 Claude Grimes, 18 Paris McDaniel, 32 David Stange, 26
Verquell Bailey, 19 Milton Hampton, 31 David McKay, 38 London Street, 27
Derrick Ball, 46 Cody Harris, 27 Jemell McMillan, 36 Chaabane Tandji, 39
Westley Barksdale, 31 Landray Harris, 29 Ronnie McMillon Jr, 26 Alexandra Taylor, 26
Kayla Bauske, 23 Melody Helgren, 48 Delvin Mendoza-Chaparro, 20 Devonta Taylor, 25
Bennie Bennett, 25 Hausien Hennings, 27 Marquelle Miller, 32 Ebony Taylor, 25
Deangelo Binns, 30 Odyssus Henry, 67 Maurire Mitchell, 20 Kenyon Thomas, 25
Maurice Brown, 38 Talya Henry, 27 Roberta Newman, 38 Robert Thomas, 45
Reginald Brown, 36 Billy Hill, 44 Timothy Olinger, 32 Donte Thompson, 25
Deondrick Byrd, 45 Tzegai Hinson, 45 Shawn Ostrom, 32 Kortni Thornton, 30
Daniel Cabrices, 52 Eric Holloway, 24 Travon Overton, 16 Leopoldo Vela, 57
Reed Carlsen, 42 Earl Hubanks, 34 Antonio Patterson, 20 Andrew Voit, 35
Quamari Carr, 23 Alac Jackson, 49 Michael Patton, 44 Mai Vue, 32
Derrick Carson, 38 Britany Jackson, 26 Tamecca Perry, 23 Phia Vue, 36
Kirby Clark, 26 Shomaray Jackson, 36 Kurt Pierzchalski, 35 Clinton Washington, 34
Josue Colindres-Barrantes, 31 Za'layia Jenkins, 9 Lamar Ragland, 23 Patrick Washington, 24
Dorian Crawford, 25 Casey Johnson, 32 Worth Rathsack, 68 Frank Watts, 52
Jovonte Daniels, 22 Jarvis Johnson, 28 Devante Reed, 20 Canova Webb, 17
Herman Davis, 73 Melanie Johnson, 15 Michael Reed, 38 Diamond Webb, 31
Colin Demge, 33 Darryl Jones, 55 Remone Reed, 29 Audrea Williams, 18
Lavenski Dennis, 23 Worn Jones, 23 Tyrone Richmond, 21 Marvin Williams, 38
Steven Earl, 33 Bruce Jordan, 31 Jevontese Riley, 23 Quishawne Williams, 24
Jessica Ellenberger, 28 Prarie Kelly, 32 Rickole Rogers, 24 Tajah Williams, 22
Carlton Evans, 31 Edward Lawson Jr, 24 Scott Ross, 56 Travis Williams, 31
Antonio Ewing, 30 Tyjuan Lee, 37 Dawayne Rumley, 40 Vincent Williams, 44
Sean Flowers III, 3 months Donald Lewis, 65 Anthony Sanders, 44 Willie Williams, 64
Deshun Freeman, 21 Ernest Lindsey, 26 Theresa Saxon, 57 Charles Williams Jr, 36
Anthony Garcia-Cortes, 39 Teneya Little, 40 Jallahni Shabazz, 24 Trevion Winningham, 7
John Garrett, 46 Jahlin Lopez, 18 Carmelo Silva Jr, 18 Rebecca Wood, 32
Marquis Gaston, 20 Demarre Lott, 23 Jovanni Sims, 29
2016 Milwaukee Homicide Review Commission Annual Report 5
A LETTER FROM THE DIRECTOR
Dear Milwaukee Community and Partners,
2016 marked the 12th year of the Milwaukee Homicide Review Commission and we
undoubtedly remain committed to preventing violence with a public health approach
in Milwaukee. The data indicate that violence continues to plague Milwaukee, and
convening across systems and sectors as well as sharing data is critical to the re-
duction in violence. While I am proud of the work that the Commission has and will
continue to do, I am ever conscious of the seriousness and complexity of violence
and how it impacts our families, friends and community. We are hopeful and stead-
fast in fulfilling our mission and reaching toward a vision of a violence-free Milwau-
kee.
Relationships have always and will continue to be foundational to the success of
the Milwaukee Homicide Review Commission. These relationships can and have
changed over time but I want to express my gratitude and appreciation for our nu-
merous partners over the past decade. The City, County, State, and Federal part-
ners’ ongoing commitment and the sense of urgency to prevent violence requires all
of us to partner, collaborate and act with common goals and strategies. The Com-
mission strives to align our work with other impactful work in our community to
strengthen and improve our assets.
As we move through 2017, we are reminded that homicides are preventable but it
takes time, a lot of hard work, and the participation of government, public and pri-
vate agencies, and individuals working together to achieve that goal.
Thank you for the work that you do to keep Milwaukee safe and healthy.
Be well,
Mallory E O’Brien, MS, PhD
Director, Milwaukee Homicide Review Commission

6 2016 Milwaukee Homicide Review Commission Annual Report
THE MILWAUKEE HOMICIDE REVIEW COMMISSION
Established in January 2005 under the leadership of key elected and appointed officials, the Milwau-kee Homicide Review Commission (MHRC) has been a central component to the City of Milwaukee's violence prevention efforts. Drawing on public health and criminal justice approaches, the Commis-sion was designed to achieve the following goals:
1) Gain a better understanding of homicide through strategic problem analysis
2) Develop innovative and effective responses and prevention strategies
3) Help focus available prevention and intervention resources
A key assumption underlying the work of the MHRC is that homicides are preventable. With over a decade of collaboration and coordination, the MHRC strives to reduce homicides and non-fatal shootings through a multi-level, multi-disciplinary and multi-agency homicide review process, which includes independent data collection, analysis, and interpretation, case review and recommenda-tions, and systems and policy change. At each review, partners participate in an intensive discussion and examination of homicide and nonfatal shooting incidents. Through this process, trends, gaps, assets, and deficits within existing systems, policies, practices, and programs designed to prevent and reduce violence are identified and recommendations are made to strengthen them.
The MHRC is comprised of public health professionals, law enforcement professionals, criminal jus-tice professionals and community service providers who meet regularly to build and nurture relation-ships and exchange information and perspective regarding violent crimes to identify prevention strat-egies. This innovative, interagency collaboration helps to foster neighborhoods and communities where residents, organizations, and law enforcement work together to reduce violence.
The success of the MHRC has been driven by building trust and information sharing among agen-cies; providing opportunities to network and work together; acting on recommendations and having results; valuing and drawing on expertise from multiple disciplines and perspectives; and providing timely data on violence in our City.
During 2005-2007, the National Institute of Justice funded the Harvard School of Public Health to evaluate the MHRC. The impact evaluation revealed that the implementation of the MHRC interven-tions was associated with a 52% decrease in the monthly count of homicide in the intervention police districts, whereas the control police districts experienced a 9.2% decrease in homicide. These find-ings indicate that the MHRC adds value to understanding violence in our urban communities from a public health perspective.
2016 Milwaukee Homicide Review Commission Annual Report 7
KEY ACCOMPLISHMENTS

8 2016 Milwaukee Homicide Review Commission Annual Report
The Milwaukee Homicide Review Commission has had numerous accomplishments since its incep-
tion in 2005. In addition to facilitating hundreds of incident reviews and engaging national, state, and
local partners for over a decade, some key accomplishments include:
The MHRC is a proven model for reducing homicides that has been replicated nationally. The
National Institute for Justice Evaluation demonstrated that the homicide reviews were associated
with a statistically significant reduction in homicides in Milwaukee. In police districts included in
the review process, homicides were reduced by 52% compared to 9.2% in control sites.
The MHRC has embarked on a new type of review called sentinel events with a particular em-
phasis on geographic areas in the City of Milwaukee that have been identified as areas with high
need and low investment.
MHRC staff were significant contributors to the Project Safe Neighborhoods grant, coordinated
by the United States Attorney’s Office to help develop suppression strategies focused on chronic
violent offenders. As a part of this grant, MHRC staff conducted social network analyses of the
chronic violent offenders to better understand and target each offender’s social networks.
Sojourner Family Peace Center (SFPC) began internal homicide reviews on all homicide cases
related to domestic violence to refine internal practices and procedures. This has improved
SFPC’s advocacy and ability to focus on lethality factors and implement a lethality assessment
tool.
The Milwaukee County Offender Reentry Program (MCORP) was created by the Department of
Corrections, District Attorney’s Office, Public Defender’s Office, Milwaukee City Attorney’s Office,
Milwaukee Police Department, and the Office of the Mayor. MCORP is aimed at decreasing the
number of absconders and increasing the number of ex-offenders that successfully reenter Mil-
waukee.
The Milwaukee Police Department has implemented biweekly internal shoot reviews to help
solve nonfatal shooting cases. The review process is similar to the one developed and used by
the MHRC.
Two ordinances related to nuisance properties and taverns have been passed in collaboration
with the City Attorney’s Office, the Department of Neighborhood Services, and members of the
Common Council. The first ordinance improves surveillance at retail properties that are consid-
ered nuisance properties by requiring them to install video surveillance systems. The second or-
dinance allows law enforcement to target the owners of problem establishments.

2016 Milwaukee Homicide Review Commission Annual Report 9
LIST OF PARTNERS
Aurora Healthcare
Boys & Girls Clubs of Greater Milwaukee
Bureau of Alcohol, Tobacco, Firearms, and
Explosives
Bureau of Milwaukee Child Welfare
Center for Urban Population Health
City Attorney’s Office
City of Milwaukee Department of Neighbor-
hood Services
City of Milwaukee Health Department
City of Milwaukee Health Department Office
of Violence Prevention
Community Advocates
Counseling Center of Milwaukee
Delinquency and Court Services Division
FBI
FORGE
Havenswood
High Intensity Drug Trafficking Area Pro-
gram
Hillside Family Resource Center
Hope House
Journey House
Justice 2000
Kids Matter, Inc
League of Young Voters
Legal Action of Wisconsin, Inc
LISC Milwaukee
Marquette University
Medical College of Wisconsin
Medical Examiner’s Office
Metcalfe Park Neighborhood Services
Milwaukee Community Justice Council
Milwaukee County District Attorney’s Office
Milwaukee Housing Authority
Milwaukee Police Department
Milwaukee Public Schools
National Alliance of Mental Illness
Office of the Chief Judge
Peace Learning Center
Project Ujima
RISE
Running Rebels
Safe and Sound
Safe Schools Initiative
Safe Zones
SaintA
Sherman Park Association
Sixteenth Street Community Health Centers
Social Development Commission
Sojourner Family Peace Center
Southside Organizing Committee
State Office of Minority Health
University of Wisconsin Milwaukee
U.S. Attorney’s Office
U.S. Drug Enforcement Agency
U.S. Immigrations and Customs Enforce-
ment
U.S. Marshal Service
Urban Underground
Violence Prevention Initiative
Wisconsin Anti-Violence Effort
Wisconsin Community Services
Wisconsin Department of Corrections (Adult
and Juvenile)
Wisconsin Department of Justice
YMCA
YWCA

10 2016 Milwaukee Homicide Review Commission Annual Report
A PUBLIC HEALTH APPROACH TO VIOLENCE PREVENTION
Violence is preventable. Taking a public health approach provides us a process to not only move towards prevention but also to advance health equity.
Underlying and driving the public health model is data. Data are used to help us define the problem to answer questions around the who, what, where, when, and how. Data also help identify risk and protective factors and guide where resources should be allocated. When strategies and recommendations are implemented, data are collected to test effectiveness and impact. Ongoing data collection and analysis are needed even after adoption of effective strate-gies to continue to monitor and evalu-ate them. The role of the MHRC as an independent source for data collection and analysis is clearly vital to violence prevention. This function of the MHRC
not only has and will continue to support the upcoming release of the community wide violence prevention plan, led by the City of Milwaukee Health Department’s Office of Violence Prevention, but it also helps to support our community and criminal justice partners’ work.
Foundational to the MHRC’s work is addressing the social determinants of health. According to the Coun-ty Health Rankings Model, social and economic fac-tors account for 40% of the factors that contribute to individual and population health outcomes. This mod-els emphasizes that multiple factors, if improved, can help make communities healthier places to live, learn, work, and play – and this is true for violence. Within the MHRC’s reviews, in particular the community ser-vice provider reviews, the discussions highlight how social and economic context greatly dictates health outcomes and the ability for people, populations, neighborhoods and communities to reach their full potentials. In the context of violence, review partici-pants evaluate how some individuals and communi-ties are unfairly disadvantaged while others are un-fairly advantaged. The MHRC provides a forum for these critical conversations to be held and inform pre-vention strategies and recommendations.

2016 Milwaukee Homicide Review Commission Annual Report 11
METHODOLOGY AND DEFINITIONS
Since its inception, the MHRC has maintained a database that tracks homicides and nonfatal
shootings in the City of Milwaukee. Historically, guidelines similar to the National Violent Death Re-
porting System were followed. Data were abstracted from the Milwaukee Police Department and
then coded according to the NVDRS protocol. However, in 2016, access to the data on homicides
and nonfatal shootings was restricted and, thus, MHRC was not able to independently verify, vali-
date, or interpret the data provided by MPD. Because the data collection methodology changed in
2016, for variables that require an interpretation or additional review, such as primary factor, the
MHRC does not recommend making comparisons between 2016 and previous years.
According to the FBI’s Uniform Crime Reporting Program, a criminal homicide is defined under two
categories:
1. Murder and nonnegligent manslaughter—the willful (nonnegligent) killing of one human being by
another.
2. Manslaughter by negligence—the killing of another person through gross negligence.
The data reported in this report include homicides that meet the UCR definition. Incidents that do
not meet the above criteria include self-defense and officer-involved cases. In addition, for the pur-
poses of this report, the date of incident is used to count a homicide.
A nonfatal shooting is defined as an injury as a result of a firearm that does not cause death. The
date of incident and victim information are used to count nonfatal shootings.
Several statistics are included in this report.
1. Frequency—the number of times a data value (e.g. homicide) occurs.
2. Homicide rate—the rate at which homicides occur in a population.
3. Nonfatal shooting rate—the rate at which nonfatal shootings occur in a population.
4. Relative risk—risk of a disease (e.g. homicide) in one group relative to another.

12 2016 Milwaukee Homicide Review Commission Annual Report
2016 Milwaukee Homicide Review Commission Annual Report 13
TABLE OF CONTENTS
Mission and Vision ............................................................................................ 2
Authors, Acknowledgements, and Suggested Citation .................................. 3
Report Dedication .............................................................................................. 4
A Letter from the Director ................................................................................. 5
The Milwaukee Homicide Review Commission ............................................... 6
Key Accomplishments....................................................................................... 7
List of Partners .................................................................................................. 9
A Public Health Approach to Violence Prevention ........................................ 10
Methodology and Definitions .......................................................................... 11
Executive Summary ......................................................................................... 15
Violence in Milwaukee ..................................................................................... 16
Victim and Suspect Demographics and Characteristics .............................. 29
Violence by ZIP Code ...................................................................................... 39
Violence by Neighborhood .............................................................................. 42
Appendix .......................................................................................................... 56

14 2016 Milwaukee Homicide Review Commission Annual Report

2016 Milwaukee Homicide Review Commission Annual Report 15
Executive Summary
Homicide (left) and Nonfatal Shooting (right) Location
in the City of Milwaukee, 2016
Data Source: MPD, 2016 Data Source: MPD, 2016
Key data points for 2016:
The homicide rate for the City of Milwaukee in 2016 was 23.2 per 100,000 population.
Milwaukee recorded 139 homicides and 555 nonfatal shooting victims in 2016 based on date of
injury.
When the data are represented by age, gender, and race, both homicide and nonfatal shooting
rates are highest among males and people of color.
The ZIP code, 53206, had the highest homicide and nonfatal shooting rate in 2016, which is
similar to previous years.
The neighborhood, Old North Milwaukee, experienced the highest frequency of assaults and
nonfatal shootings in 2016.
In 2016, Harambee had the highest frequency of homicides at 10.

16 2016 Milwaukee Homicide Review Commission Annual Report
VIOLENCE IN MILWAUKEE, 2016

2016 Milwaukee Homicide Review Commission Annual Report 17
Figure 1. Firearm Homicide and Nonfatal Shooting Victims, 2006-2016
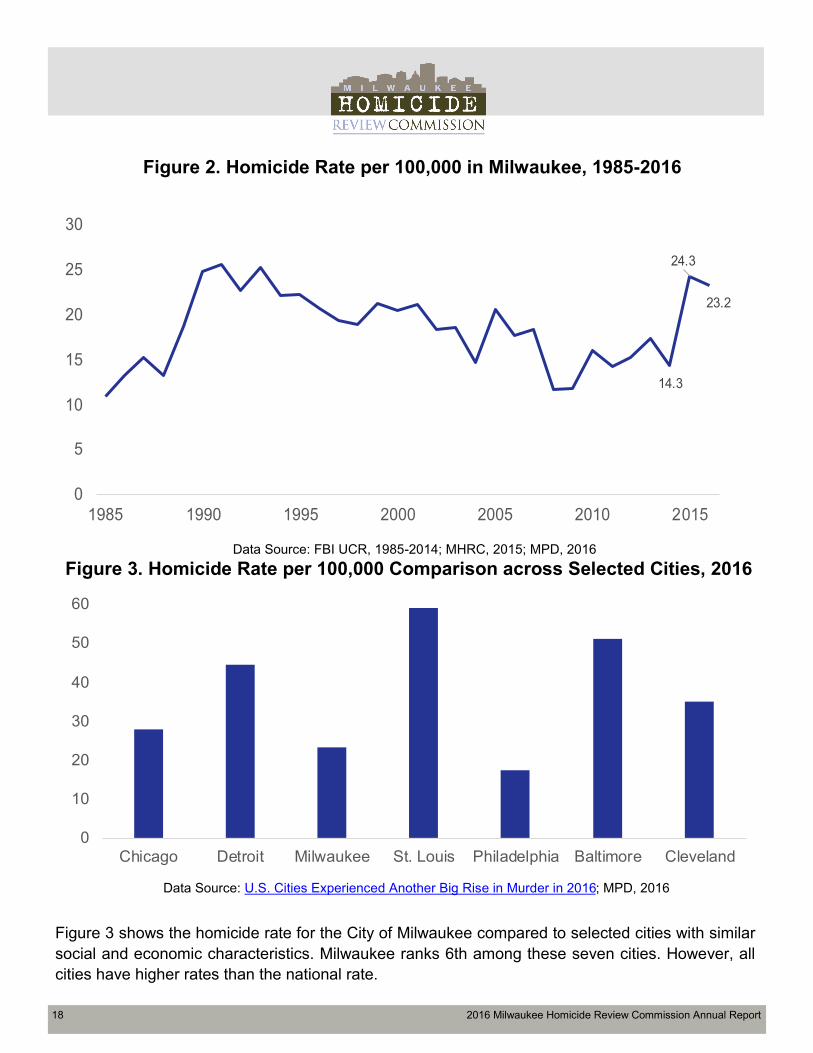
Milwaukee recorded 139 homicides and 555 nonfatal shooting victims in 2016. In Figure 1, compar-ing 2006 to 2016, there has been a 51% increase in firearm-related homicide victims, an 11% de-crease in nonfatal shooting victims, and a 4% decrease in combined victims. Figure 2 shows homicide rates from 1985 to 2016 in the City of Milwaukee. Homicide rates peaked in the early 1990s, and continued to have a downward trend through 2014. The homicide rate in 2015 was 24.3 per 100,000 compared to 23.2 per 100,000 in 2016. The 2016 state of Wisconsin homicide rate was 3.0 per 100,000.
Data Source: MHRC, 2006-2015; MPD, 2016
698
568
496 492 468533
575611
659
753671
621
485448 439
402
473500
530
583633
555
103 10571 72 95 87 91 105 87
146 139
77 83 48 53 66 60 75 81 76 120 116
2006 2007 2008 2009 2010 2011 2012 2013 2014 2015 2016
Combined Firearm Homicide and Non-Fatal Shooting Victims by Year
Combined NFS and FH Non-Fatal Shootings
Overall Homicides Firearm Homicides
18 2016 Milwaukee Homicide Review Commission Annual Report
Figure 2. Homicide Rate per 100,000 in Milwaukee, 1985-2016
14.3
24.3
23.2
0
5
10
15
20
25
30
1985 1990 1995 2000 2005 2010 2015
Figure 3. Homicide Rate per 100,000 Comparison across Selected Cities, 2016
0
10
20
30
40
50
60
Chicago Detroit Milwaukee St. Louis Philadelphia Baltimore Cleveland
Figure 3 shows the homicide rate for the City of Milwaukee compared to selected cities with similar
social and economic characteristics. Milwaukee ranks 6th among these seven cities. However, all
cities have higher rates than the national rate.
Data Source: FBI UCR, 1985-2014; MHRC, 2015; MPD, 2016
Data Source: U.S. Cities Experienced Another Big Rise in Murder in 2016; MPD, 2016
2016 Milwaukee Homicide Review Commission Annual Report 19
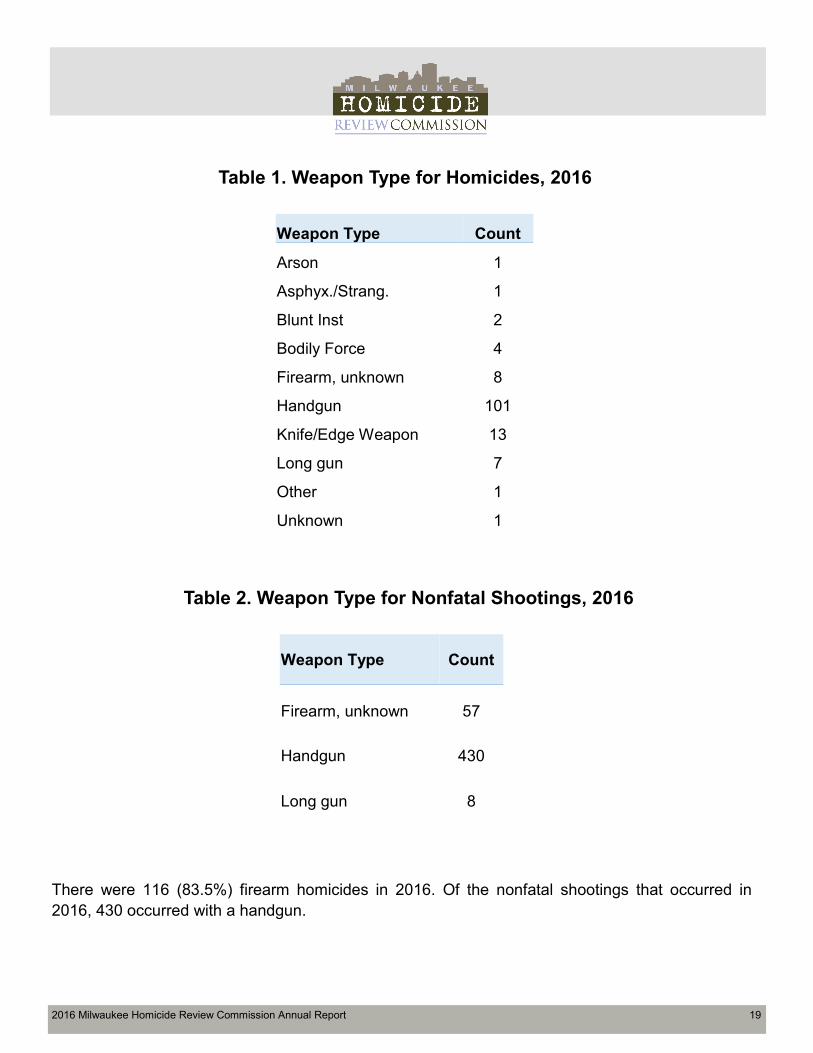
Weapon Type Count
Arson 1
Asphyx./Strang. 1
Blunt Inst 2
Bodily Force 4
Firearm, unknown 8
Handgun 101
Knife/Edge Weapon 13
Long gun 7
Other 1
Unknown 1
Table 1. Weapon Type for Homicides, 2016
Table 2. Weapon Type for Nonfatal Shootings, 2016
Weapon Type Count
Firearm, unknown 57
Handgun 430
Long gun 8
There were 116 (83.5%) firearm homicides in 2016. Of the nonfatal shootings that occurred in
2016, 430 occurred with a handgun.
20 2016 Milwaukee Homicide Review Commission Annual Report
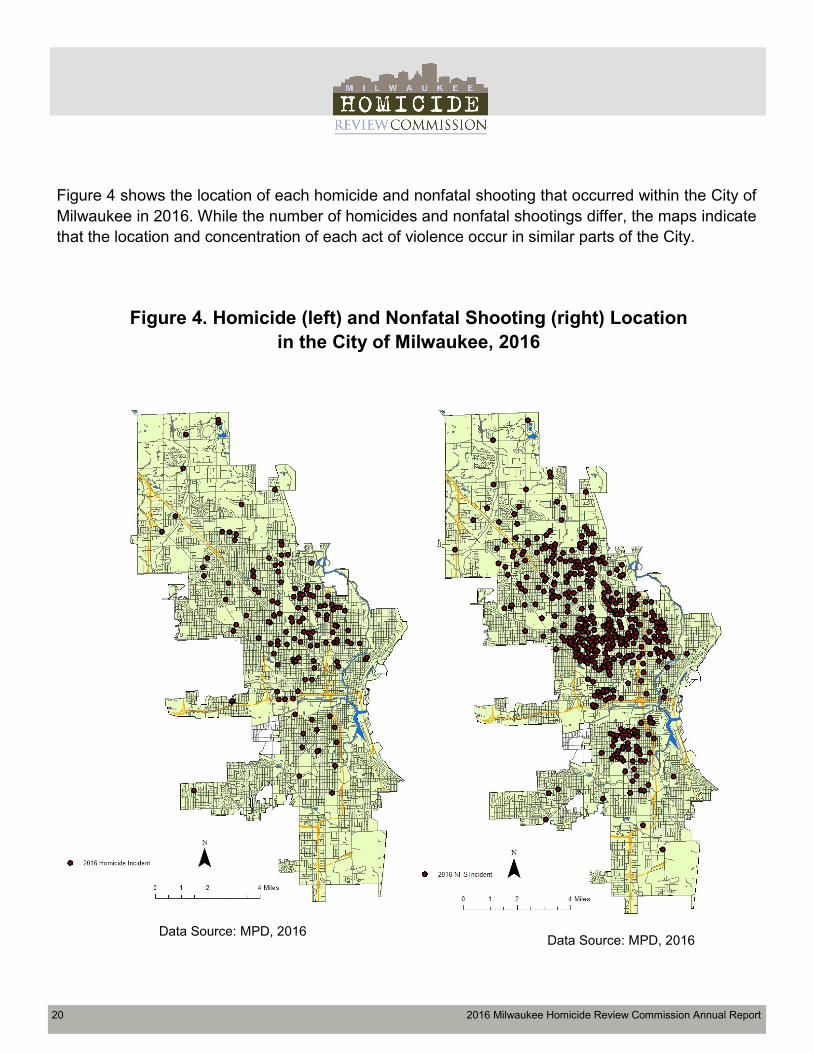
Figure 4. Homicide (left) and Nonfatal Shooting (right) Location
in the City of Milwaukee, 2016
Data Source: MPD, 2016 Data Source: MPD, 2016
Figure 4 shows the location of each homicide and nonfatal shooting that occurred within the City of
Milwaukee in 2016. While the number of homicides and nonfatal shootings differ, the maps indicate
that the location and concentration of each act of violence occur in similar parts of the City.
2016 Milwaukee Homicide Review Commission Annual Report 21
Data Source: MPD, 2016 Data Source: MPD, 2016
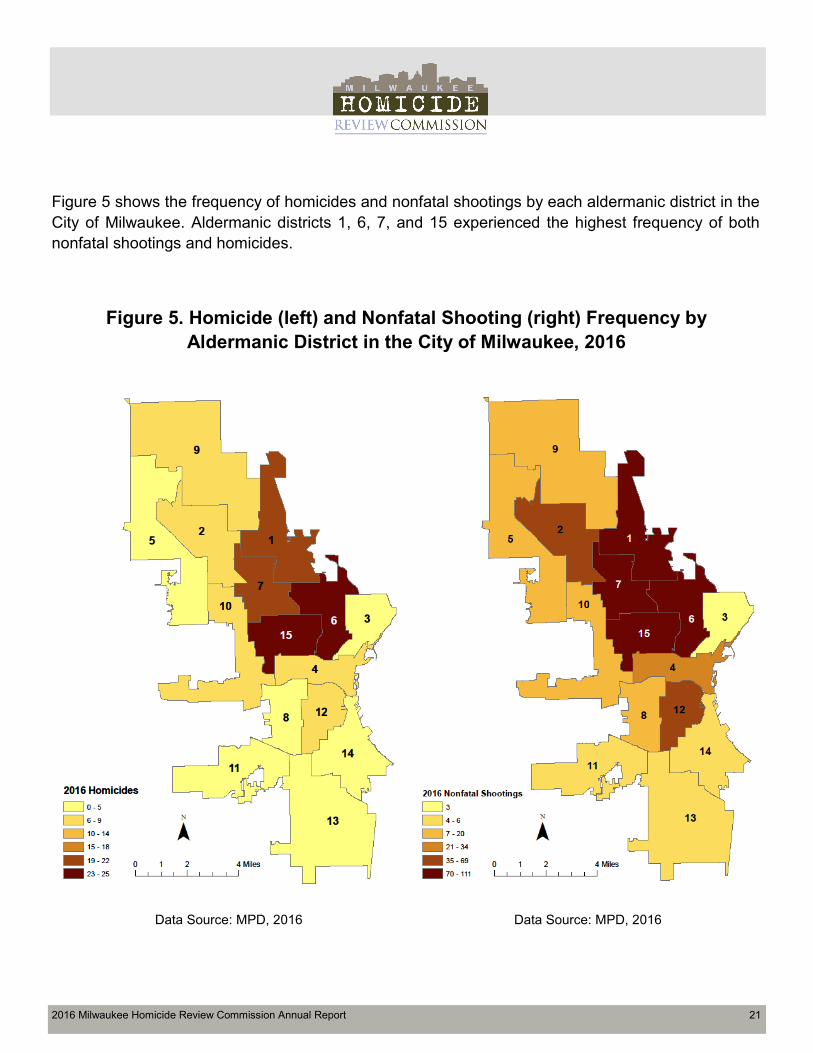
Figure 5. Homicide (left) and Nonfatal Shooting (right) Frequency by
Aldermanic District in the City of Milwaukee, 2016
Figure 5 shows the frequency of homicides and nonfatal shootings by each aldermanic district in the
City of Milwaukee. Aldermanic districts 1, 6, 7, and 15 experienced the highest frequency of both
nonfatal shootings and homicides.

22 2016 Milwaukee Homicide Review Commission Annual Report
Figure 6. Primary Factor of Homicides, 2016
Figure 7. Primary Factor of Nonfatal Shootings, 2016
Data Source: MPD, 2016*
In 2016, there were over 30% of homicide and nonfatal shooting cases with unknown primary factor.
Argument/fight followed as the next leading driver of both homicides and nonfatal shootings.
0% 5% 10% 15% 20% 25% 30% 35%
Unknown
Robbery
Retaliation
Recklessness
Prostitution
Negligent Handling
Jealousy
Gang Related
Drug Related Robbery
Drug Related
Domestic Violence
Commission of Other Crime
Child Abuse/Neglect
Argument/Fight
*Note: MHRC methodology was not applied to 2016 data. The primary factors are based on MPD interpretation.
0% 5% 10% 15% 20% 25% 30% 35% 40%
Unknown
Robbery
Retaliation
Reckless Use
Prostitution
Possibly Self-Inflicted
Other
Negligent Handling
Gang Related
Gambling
Drug Related Robbery
Drug Related
Domestic Violence
Commission of Other Crime
Argument/Fight
Data Source: MPD, 2016*
*Note: MHRC methodology was not applied to 2016 data. The primary factors are based on MPD interpretation.
2016 (#)
Argument/Fight 35
Child Abuse/Neglect 2
Commission of Other Crime 5
Domestic Violence 14
Drug Related 6
Drug Related Robbery 9
Gang Related 1
Jealousy 2
Negligent Handling 1
Prostitution 1
Recklessness 1
Retaliation 10
Robbery 8
Unknown 44
2016
Argument/Fight 145
Commission of Other Crime 14
Domestic Violence 14
Drug Related 16
Drug Related Robbery 20
Gambling 5
Gang Related 3
Negligent Handling 2
Other 5
Possibly Self-Inflicted 4
Prostitution 2
Reckless Use 1
Retaliation 35
Robbery 95
Unknown 194
2016 Milwaukee Homicide Review Commission Annual Report 23
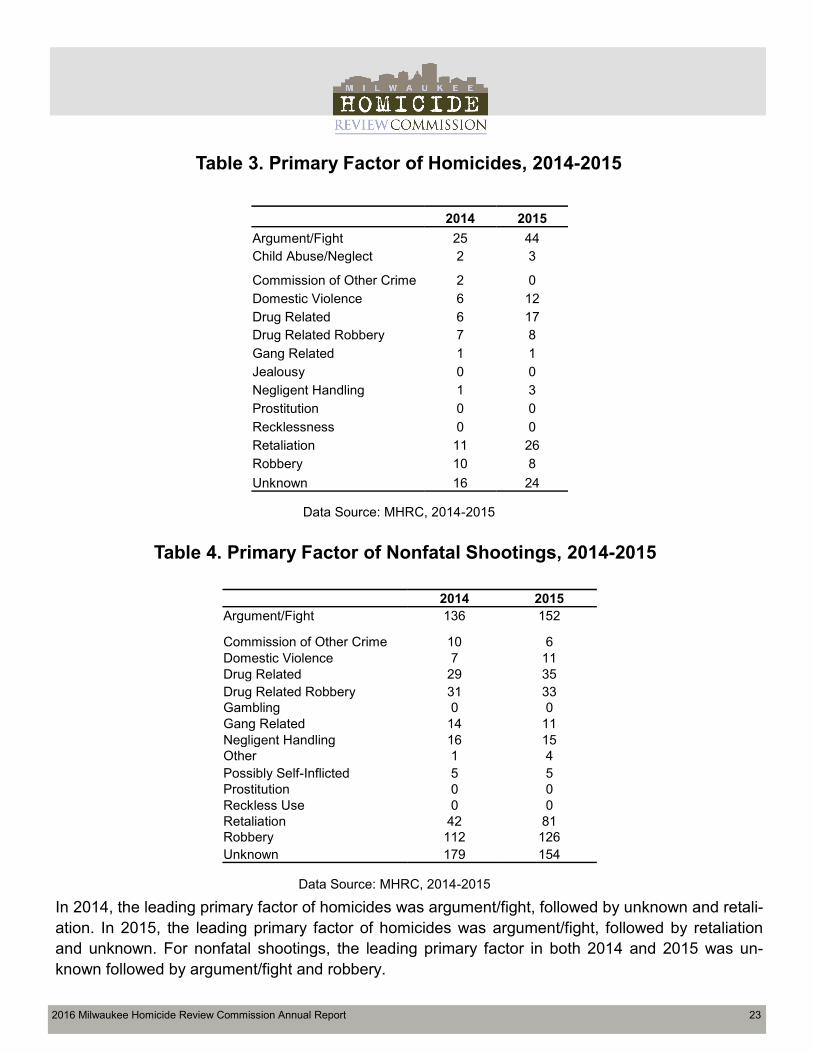
In 2014, the leading primary factor of homicides was argument/fight, followed by unknown and retali-
ation. In 2015, the leading primary factor of homicides was argument/fight, followed by retaliation
and unknown. For nonfatal shootings, the leading primary factor in both 2014 and 2015 was un-
known followed by argument/fight and robbery.
2014 2015
Argument/Fight 25 44
Child Abuse/Neglect 2 3
Commission of Other Crime 2 0
Domestic Violence 6 12
Drug Related 6 17
Drug Related Robbery 7 8
Gang Related 1 1
Jealousy 0 0
Negligent Handling 1 3
Prostitution 0 0
Recklessness 0 0
Retaliation 11 26
Robbery 10 8
Unknown 16 24
Table 3. Primary Factor of Homicides, 2014-2015
Table 4. Primary Factor of Nonfatal Shootings, 2014-2015
2014 2015
Argument/Fight 136 152
Commission of Other Crime 10 6
Domestic Violence 7 11
Drug Related 29 35
Drug Related Robbery 31 33
Gambling 0 0
Gang Related 14 11
Negligent Handling 16 15
Other 1 4
Possibly Self-Inflicted 5 5
Prostitution 0 0
Reckless Use 0 0
Retaliation 42 81
Robbery 112 126
Unknown 179 154
Data Source: MHRC, 2014-2015
Data Source: MHRC, 2014-2015

24 2016 Milwaukee Homicide Review Commission Annual Report
In 2016, the City of Milwaukee tallied 139 homicides, which is a 5% decrease from 2015 (n=146
homicides) but a 60% increase compared to 2014 (n=87). By month, there was an increase in homi-
cides during March (56%), June (8%), August (130%), October (69%), and December (75%) com-
pared to 2015.
11
18
912
9
16
12
28
1518
13
18
27 2727
21
14 15
19
9
34
Sunday Monday Tuesday Wednesday Thursday Friday Saturday
Year 2014 Year 2015 Year 2016
In 2016, 50% of homicides occurred on Friday, Saturday, or Sunday, compared to 56% of homicides in 2015. However, there was a decrease by 67% in homicides that happened on Friday, compared to 2015.
Figure 9. Homicides by Day of the Week, 2014-2016
13
7 6
118 9
14
4
8
4
1214
79
18
1412
21
10 9
1311
85
3
14 13
6
1315
23
5
22
6
14
Year 2014 Year 2015 Year 2016
Figure 8. Homicides by Month, 2014-2016
Data Source: MHRC, 2014-2015; MPD, 2016
Data Source: MHRC, 2014-2015; MPD, 2016

2016 Milwaukee Homicide Review Commission Annual Report 25
In 2016, there were 498 nonfatal shooting incidents and 555 nonfatal shooting victims. Compared to
2015, there was a decrease by 5% in nonfatal shooting incidents and 12% in nonfatal shooting vic-
tims. With the exception of February, March, and September, there was a decrease in the number of
nonfatal shooting victims in the remaining months. While August had a 130% increase in homicides
compared to 2015, there was a 16% decrease in the nonfatal shooting victims.
118
76 7365 70
8397
109
80 85 8071
90
118
92101
69 71 7363
86
Sunday Monday Tuesday Wednesday Thursday Friday Saturday
Year 2014 Year 2015 Year 2016
In 2016, 43% of all nonfatal shooting victims were shot on a Friday, Saturday or Sunday. There was
an increase by 26% in nonfatal shooting victims on Mondays.
35
17
28
4755
75
50
7369
43
32
58
39
24
40
57
74
64 63 61
49
62
49 51
37 3642
5448 51 54
5153 58
3932
Year 2014 Year 2015 Year 2016
Figure 11. Nonfatal Shootings by Day of the Week, 2014-2016
Data Source: MHRC, 2014-2015; MPD, 2016
Figure 10. Nonfatal Shootings by Month, 2014-2016
Data Source: MHRC, 2014-2015; MPD, 2016

26 2016 Milwaukee Homicide Review Commission Annual Report
53
1413
6
1315
23
5
22
6
14
0
5
10
15
20
25
0
10
20
30
40
50
60
70
80
Tem
pera
ture
2016 Homicides Temperature
Figure 12. Monthly Homicide Total and Temperature, 2016
Figure 12 visualizes the average temperature (calculated using temperatures on dates of homicides)
compared to the number of homicides per month. It is perceived that warmer temperatures lead to
more crime and cooler or inclement weather leads to less crime. However, this is not the pattern
seen in 2016 data for Milwaukee. While August had the highest number of homicides and average
temperature, October had the second highest number of homicides in the year but the average tem-
perature was 54 degrees.
Data Source: MPD, 2016
2016 Milwaukee Homicide Review Commission Annual Report 27
Case Fatality Rate
According to the Centers for Disease Control and Prevention, the case fatality rate is a measure of
the severity of the condition. It tells us the proportion of people who die from a particular disease.
Researchers have stratified firearm injury data to calculate case fatality rate by unintentional, as-
sault-related, or self-inflicted. In the 2015 MHRC Annual Report, case fatality rate was calculated for
assault-related firearm injury only. However, given the change in methodology for data collection
and validation in 2016, the current analysis includes all firearm injury cases to calculate a total case
fatality rate.
The total case fatality rate for firearm injury in the City of Milwaukee is 18.3%, which means that
18.3% of all firearm related injuries resulted in death.
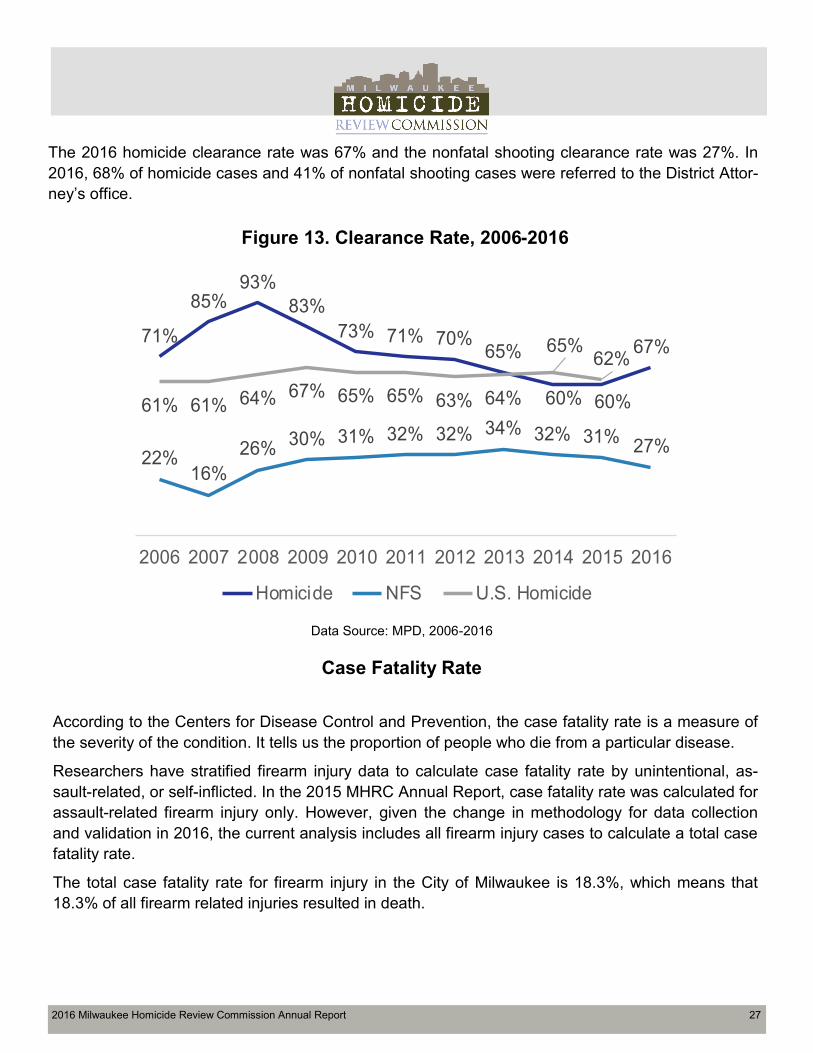
Figure 13. Clearance Rate, 2006-2016
The 2016 homicide clearance rate was 67% and the nonfatal shooting clearance rate was 27%. In
2016, 68% of homicide cases and 41% of nonfatal shooting cases were referred to the District Attor-
ney’s office.
71%
85%93%
83%
73% 71% 70%65%
60% 60%
67%
22%16%
26%30% 31% 32% 32% 34% 32% 31%
27%
61% 61% 64% 67% 65% 65% 63% 64%
65%62%
2006 2007 2008 2009 2010 2011 2012 2013 2014 2015 2016
Homicide NFS U.S. Homicide
Data Source: MPD, 2006-2016

28 2016 Milwaukee Homicide Review Commission Annual Report
2016 Milwaukee Homicide Review Commission Annual Report 29
VICTIM AND SUSPECT
DEMOGRAPHICS AND CHARACTERISTICS
30 2016 Milwaukee Homicide Review Commission Annual Report
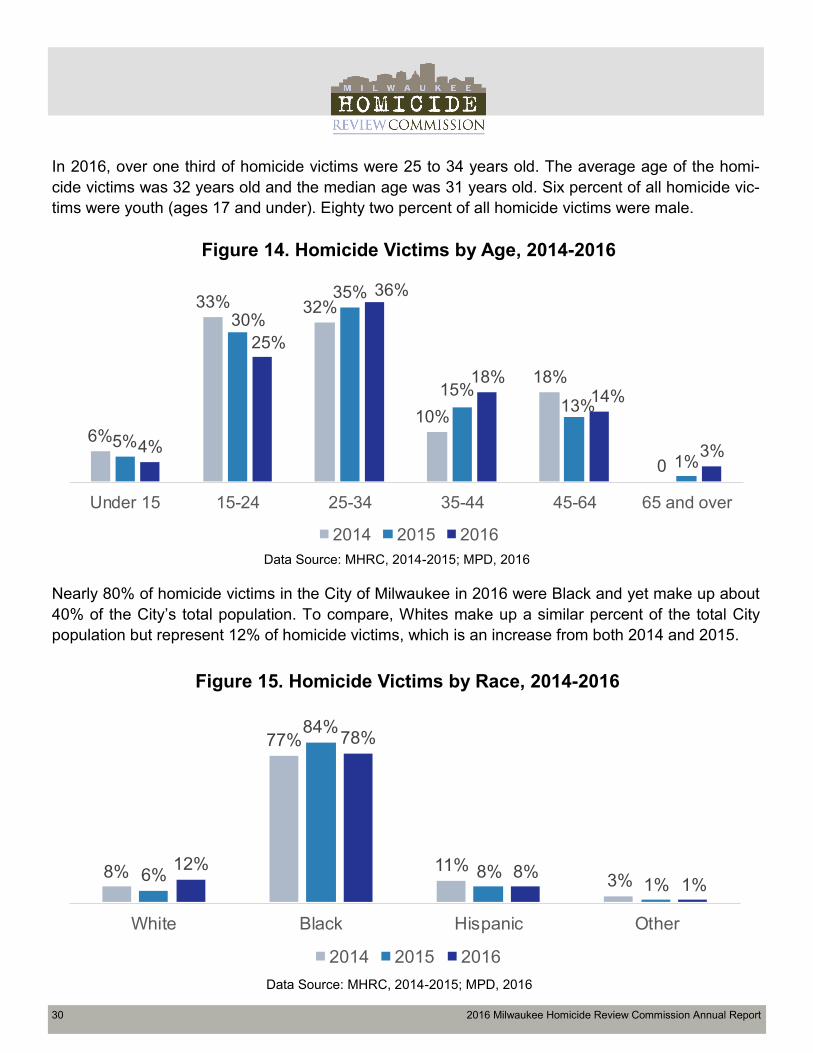
In 2016, over one third of homicide victims were 25 to 34 years old. The average age of the homi-
cide victims was 32 years old and the median age was 31 years old. Six percent of all homicide vic-
tims were youth (ages 17 and under). Eighty two percent of all homicide victims were male.
6%
33% 32%
10%
18%
0
5%
30%
35%
15%13%
1%4%
25%
36%
18%14%
3%
Under 15 15-24 25-34 35-44 45-64 65 and over
2014 2015 2016
Figure 14. Homicide Victims by Age, 2014-2016
8%
77%
11%3%6%
84%
8%1%
12%
78%
8%1%
White Black Hispanic Other
2014 2015 2016
Figure 15. Homicide Victims by Race, 2014-2016
Nearly 80% of homicide victims in the City of Milwaukee in 2016 were Black and yet make up about
40% of the City’s total population. To compare, Whites make up a similar percent of the total City
population but represent 12% of homicide victims, which is an increase from both 2014 and 2015.
Data Source: MHRC, 2014-2015; MPD, 2016
Data Source: MHRC, 2014-2015; MPD, 2016

2016 Milwaukee Homicide Review Commission Annual Report 31
0%
55%
32%
7% 6%
0%1%
51%
35%
8%4%
1%1%
45%
27%
15%10%
1%
Under 15 15-24 25-34 35-44 45-64 65 and over
2014 2015 2016
Figure 16. Homicide Suspects by Age, 2014-2016
4%
88%
5% 3%7%
84%
9%1%
10%
79%
11%
0%
White Black Hispanic Other
2014 2015 2016
Figure 17. Homicide Suspects by Race, 2014-2016
Data Source: MHRC, 2014-2015; MPD, 2016
Data Source: MHRC, 2014-2015; MPD, 2016
In 2016, over 70% of homicide suspects were 15 to 34 years old. There was a noticeable increase
in homicide suspects, ages 35-64 years. The average age of the homicide suspects was 29 years
old and the median age was 27 years old. Three percent of all homicide suspects were youth (ages
17 and under). Eighty four percent of all homicide suspects were male.
Similar to homicides victims, nearly 80% of homicide suspects in the City of Milwaukee in 2016
were Black, 10% were White, and 11% were Hispanic.

32 2016 Milwaukee Homicide Review Commission Annual Report
2%
50%
28%
12%
7%
1%3%
42%
34%
13%
8%
0%3%
44%
34%
10% 10%
0%
Under 15 15-24 25-34 35-44 45-64 65 and over
2014 2015 2016
Figure 18. Nonfatal Shooting Victims by Age, 2014-2016
7%
87%
6%1%
5%
87%
6%1%
6%
87%
6%1%
White Black Hispanic Other
2014 2015 2016
Figure 19. Nonfatal Shooting Victims by Race, 2014-2016
Data Source: MHRC, 2014-2015; MPD, 2016
In 2016, nearly 80% of nonfatal shooting victims were 15 to 34 years old. The average age of the
nonfatal shooting victims was 28 years old and the median age was 25 years old. Nine percent of all
nonfatal shooting victims were youth (ages 17 and under). Almost 90% of nonfatal shooting victims
were male.
In each year from 2014-2016, 87% of nonfatal shooting victims in the City of Milwaukee were Black.
To compare, Whites and Hispanics each represent, on average, 6% of nonfatal shooting victims
across the same timeframe.
Data Source: MHRC, 2014-2015; MPD, 2016
2016 Milwaukee Homicide Review Commission Annual Report 33
1%
57%
33%
7%
1% 0%0%
50%
37%
7%
5% 0%2%
39%34%
16%
8%
2%
Under 15 15-24 25-34 35-44 45-64 65 and over
2014 2015 2016
Figure 20. Nonfatal Shooting Suspects by Age, 2014-2016
2%
88%
9%0%2%
88%
9%1%
6%
88%
5%1%
White Black Hispanic Other
2014 2015 2016
Figure 21. Nonfatal Shooting Suspects by Race, 2014-2016
Data Source: MHRC, 2014-2015; MPD, 2016
Data Source: MHRC, 2014-2015; MPD, 2016
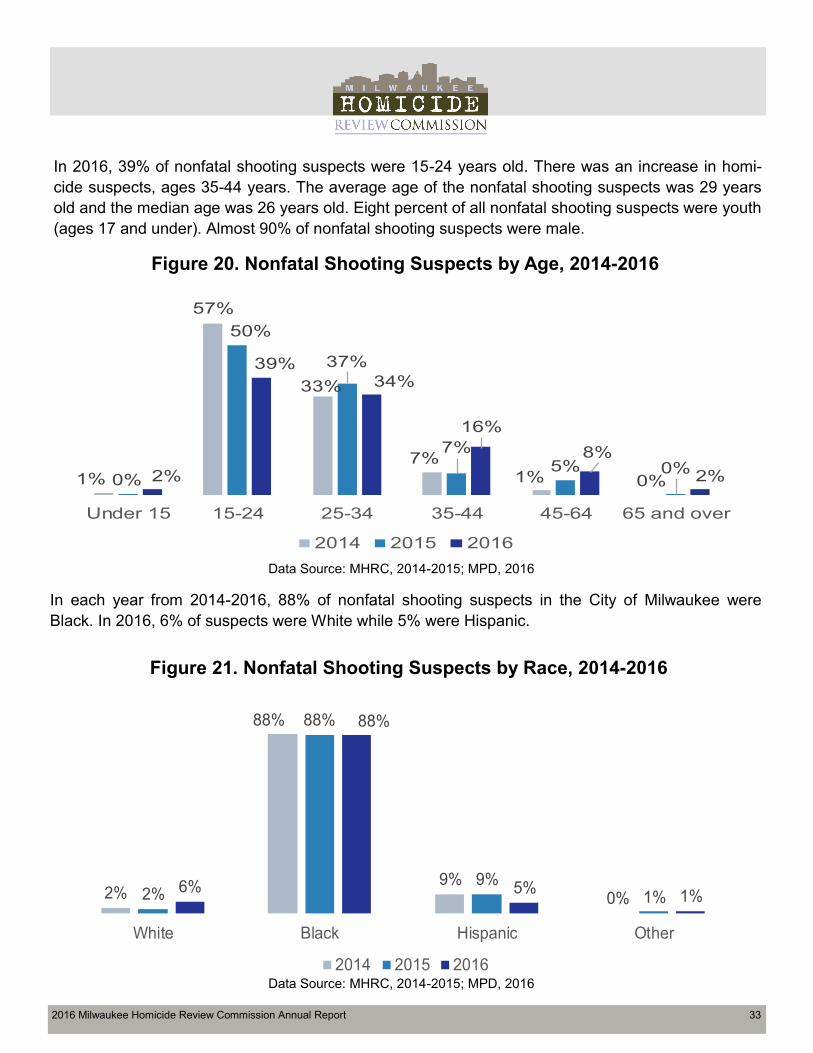
In 2016, 39% of nonfatal shooting suspects were 15-24 years old. There was an increase in homi-
cide suspects, ages 35-44 years. The average age of the nonfatal shooting suspects was 29 years
old and the median age was 26 years old. Eight percent of all nonfatal shooting suspects were youth
(ages 17 and under). Almost 90% of nonfatal shooting suspects were male.
In each year from 2014-2016, 88% of nonfatal shooting suspects in the City of Milwaukee were
Black. In 2016, 6% of suspects were White while 5% were Hispanic.

34 2016 Milwaukee Homicide Review Commission Annual Report
7.8
46.8
10.2 4.923.216.5
206.9
28.814.6
92.6
White alone Black alone Hispanic Other City
Homicide Rate Nonfatal Shooting Rate
Figure 22. Homicide and Nonfatal Shooting Rate per 100,000
by Race/Ethnicity, 2016
Data Source: MPD, 2016
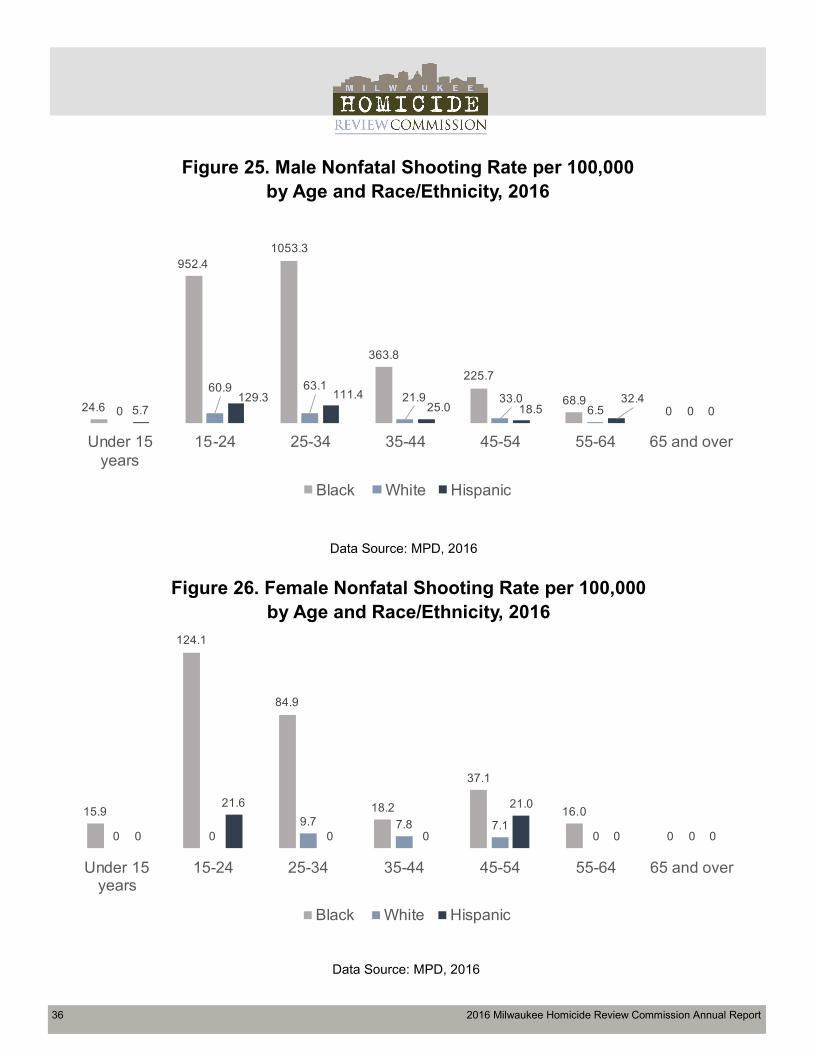
Figures 21 depicts homicide and nonfatal shooting victimization rates by race and ethnicity. Figures
22-25 further distinguishes homicide and nonfatal shooting victimization rates by age and race and
ethnicity.
Key findings:
Both the homicide and nonfatal shooting victimization rates of the Black population are more
than two times that of the City rate.
Black males, ages 15-24 years, are 16 times more likely to be a nonfatal shooting victim com-
pared to White males, ages 15-24 years.
Black males, ages 25-34 years, are 10 times more likely to be a victim of homicide and 17 times
more likely to be a nonfatal shooting victim compared to their White counterparts.
Black females, ages 25-34 years, are nine times more likely to be a nonfatal shooting victim
compared to White females, ages 25-34 years.
Hispanic females, ages 45-54 years, are almost three times more likely to be a victim of homi-
cide or a nonfatal shooting victim compared to White females, ages 45-54 years.
Both Hispanic males and females, ages 55-64 years, are five times more likely to be a homicide
victim compared to White males and females, ages 55-64 years, respectively.

2016 Milwaukee Homicide Review Commission Annual Report 35
6.2
139.6
247.0
132.3
64.5
19.7
44.0
0 0
24.329.2
6.6 6.5 7.35.721.6
10.125.0 18.5
32.4
0
Under 15
years
15-24 25-34 35-44 45-54 55-64 65 and over
Black White Hispanic
Figure 23. Male Homicide Rate per 100,000 by Age and Race/Ethnicity, 2016
6.4
18.4
31.9
12.1 12.4
0 00
6.1
9.7
0
7.1 6.6
00 0
11.0
0
21.0
35.2
0
Under 15
years
15-24 25-34 35-44 45-54 55-64 65 and over
Black White Hispanic
Figure 24. Female Homicide Rate per 100,000 by Age and Race/Ethnicity, 2016
Data Source: MPD, 2016
Data Source: MPD, 2016
36 2016 Milwaukee Homicide Review Commission Annual Report
15.9
124.1
84.9
18.2
37.1
16.0
00 0
9.7 7.8 7.10 00
21.6
0 0
21.0
0 0
Under 15years
15-24 25-34 35-44 45-54 55-64 65 and over
Black White Hispanic
Figure 26. Female Nonfatal Shooting Rate per 100,000
by Age and Race/Ethnicity, 2016
Figure 25. Male Nonfatal Shooting Rate per 100,000
by Age and Race/Ethnicity, 2016
24.6
952.4
1053.3
363.8
225.7
68.900
60.9 63.121.9 33.0
6.5 05.7129.3 111.4
25.0 18.532.4
0
Under 15
years
15-24 25-34 35-44 45-54 55-64 65 and over
Black White Hispanic
Data Source: MPD, 2016
Data Source: MPD, 2016

2016 Milwaukee Homicide Review Commission Annual Report 37
55%
14%
36%
16%
46%
14%
Past Supervision Active Supervison
2014 2015 2016
Figure 27. Adult Supervision Status of Homicide Victims (%), 2014-2016
39%
14%
33%
21%
55%
17%
Past Supervision Active Supervision
2014 2015 2016
Figure 28. Adult Supervision Status of Homicide Suspects (%), 2014-2016
Data Source: Wisconsin Department of Corrections
Data Source: Wisconsin Department of Corrections
Figure 26 and 27 describe the adult supervision status of homicide victims and suspects at the time
of the homicide incident date. In 2016, 46% of homicide victims had a history of supervision com-
pared to 55% of homicide suspects. 14% of homicide victims were on active supervision compared
to 17% of homicide suspects at the time of the incident.

38 2016 Milwaukee Homicide Review Commission Annual Report

2016 Milwaukee Homicide Review Commission Annual Report 39
VIOLENCE BY ZIP CODE

40 2016 Milwaukee Homicide Review Commission Annual Report
Figure 29. Homicide (left) and Nonfatal Shooting (right) Rate per 100,000
in the City of Milwaukee, 2016
Data Source: MPD, 2016 Data Source: MPD, 2016
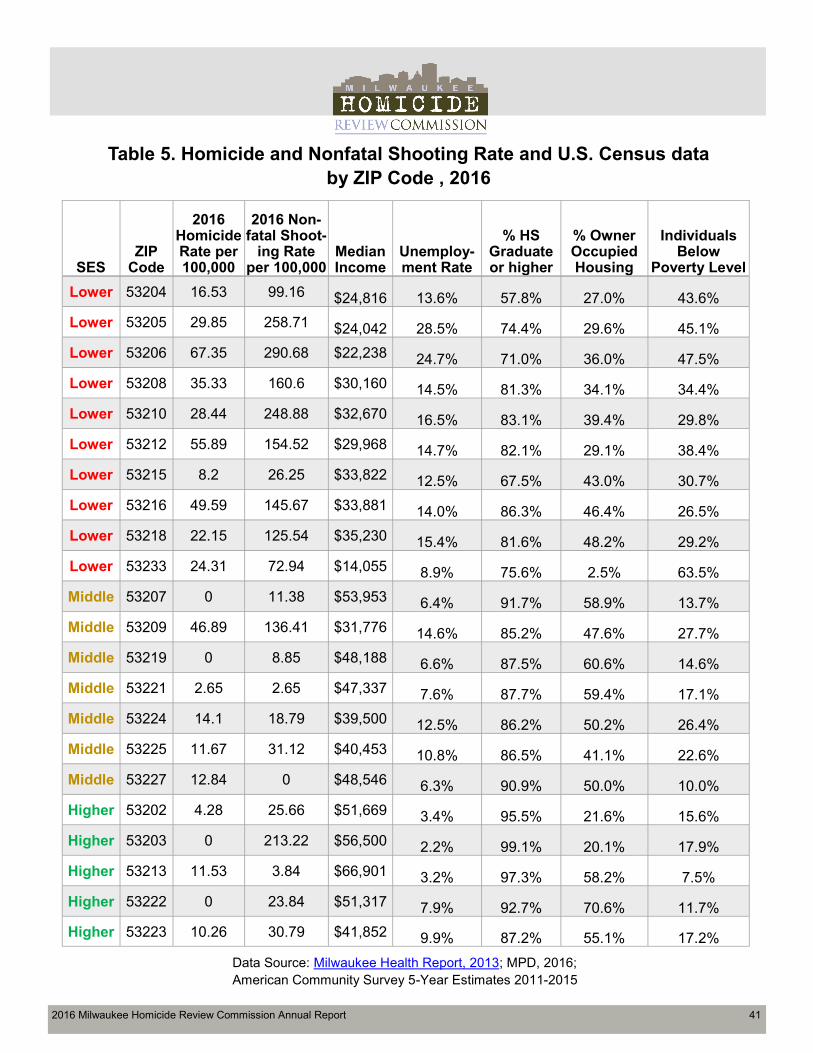
The relationship between how people experience their environments and the impact of those same
environments on health outcomes is critical to the distribution of violence. Socioeconomic status
(SES) is a measure of a person’s social and economic standing in relation to others. SES, for this
report, is based on income and education and was determined using the Milwaukee Health Report’s
methodology.
Figure 28 shows the rates of homicides and nonfatal shootings in ZIP codes in the City of Milwau-
kee. Table 3 adds information such as median income and unemployment rate of the ZIP codes.
Note: Some ZIP codes encompass areas outside of the City of Milwaukee’s boundaries.
Key findings:
The ZIP code, 53206, had both the highest homicide and nonfatal shooting rate in 2016.
ZIP codes with higher percentages of individuals below the poverty level and unemployment
rates also had higher rates of homicide and nonfatal shooting in 2016.
2016 Milwaukee Homicide Review Commission Annual Report 41
SES ZIP
Code
2016 Homicide Rate per 100,000
2016 Non-fatal Shoot-
ing Rate per 100,000
Median Income
Unemploy-ment Rate
% HS Graduate or higher
% Owner Occupied Housing
Individuals Below
Poverty Level
Lower 53204 16.53 99.16 $24,816 13.6% 57.8% 27.0% 43.6%
Lower 53205 29.85 258.71 $24,042 28.5% 74.4% 29.6% 45.1%
Lower 53206 67.35 290.68 $22,238 24.7% 71.0% 36.0% 47.5%
Lower 53208 35.33 160.6 $30,160 14.5% 81.3% 34.1% 34.4%
Lower 53210 28.44 248.88 $32,670 16.5% 83.1% 39.4% 29.8%
Lower 53212 55.89 154.52 $29,968 14.7% 82.1% 29.1% 38.4%
Lower 53215 8.2 26.25 $33,822 12.5% 67.5% 43.0% 30.7%
Lower 53216 49.59 145.67 $33,881 14.0% 86.3% 46.4% 26.5%
Lower 53218 22.15 125.54 $35,230 15.4% 81.6% 48.2% 29.2%
Lower 53233 24.31 72.94 $14,055 8.9% 75.6% 2.5% 63.5%
Middle 53207 0 11.38 $53,953 6.4% 91.7% 58.9% 13.7%
Middle 53209 46.89 136.41 $31,776 14.6% 85.2% 47.6% 27.7%
Middle 53219 0 8.85 $48,188 6.6% 87.5% 60.6% 14.6%
Middle 53221 2.65 2.65 $47,337 7.6% 87.7% 59.4% 17.1%
Middle 53224 14.1 18.79 $39,500 12.5% 86.2% 50.2% 26.4%
Middle 53225 11.67 31.12 $40,453 10.8% 86.5% 41.1% 22.6%
Middle 53227 12.84 0 $48,546 6.3% 90.9% 50.0% 10.0%
Higher 53202 4.28 25.66 $51,669 3.4% 95.5% 21.6% 15.6%
Higher 53203 0 213.22 $56,500 2.2% 99.1% 20.1% 17.9%
Higher 53213 11.53 3.84 $66,901 3.2% 97.3% 58.2% 7.5%
Higher 53222 0 23.84 $51,317 7.9% 92.7% 70.6% 11.7%
Higher 53223 10.26 30.79 $41,852 9.9% 87.2% 55.1% 17.2%
Table 5. Homicide and Nonfatal Shooting Rate and U.S. Census data
by ZIP Code , 2016
Data Source: Milwaukee Health Report, 2013; MPD, 2016;
American Community Survey 5-Year Estimates 2011-2015

42 2016 Milwaukee Homicide Review Commission Annual Report
VIOLENCE BY NEIGHBORHOOD

2016 Milwaukee Homicide Review Commission Annual Report 43
The influence of a person’s environment on their health and the opportunities and challenges pre-
sented in those spaces are profound. Efforts across the City of Milwaukee, including the City of Mil-
waukee Health Department Office of Violence Prevention’s community wide plan, focus on the
neighborhood level. Similar to ZIP codes, neighborhoods are geographic boundaries that can help
elucidate the prevalence or incidence of health concerns, such as violence.
Figures 29-31 are maps that describe the assault, nonfatal shooting, and homicide frequency by
neighborhood in 2016. Tables 4-6 list the 10 neighborhoods with the highest frequency of assaults,
nonfatal shootings, and homicides, respectively.
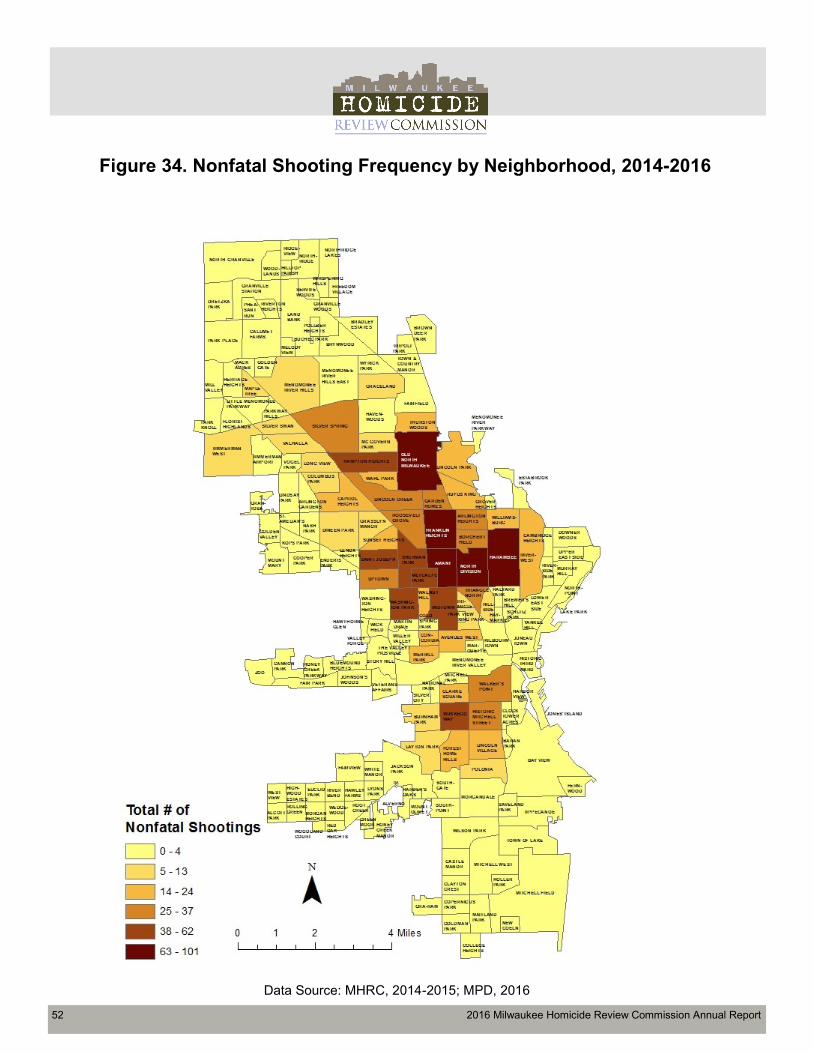
Figures 32-34 are maps that describe the assault, nonfatal shooting, and homicide frequency by
neighborhood from 2014 to 2016. Tables 7-9 list the 10 neighborhoods with the highest frequency of
assaults, nonfatal shootings, and homicides, respectively.
Key findings:
Assaults
Old North Milwaukee had the highest frequency of assaults both in 2016 and across 2014
to 2016.
Other areas with high frequencies of assaults in this timeframe, include: Franklin Heights,
Harambee, and Silver Spring.
Nonfatal Shootings
Similar to assaults, Old North Milwaukee had the highest frequency of nonfatal shootings
both in 2016 and from 2014 to 2016.
Additional neighborhoods with high frequencies of nonfatal shootings in this timeframe,
include: Amani, Franklin Heights, Harambee, and Sherman Park.
Homicides
In 2016, Harambee experienced the highest frequency of homicides at 10, followed by
Franklin Heights with nine, and Sherman Park with eight.
From 2014 to 2016, Franklin Heights had 24 homicides, Harambee had 23, and Old North
Milwaukee had 19.

44 2016 Milwaukee Homicide Review Commission Annual Report
Figure 30. Assault Frequency by Neighborhood, 2016
Data Source: COMPASS

2016 Milwaukee Homicide Review Commission Annual Report 45
Table 6. Assault Frequency by Neighborhood, Top 10, 2016
Neighborhood Assault Frequency
OLD NORTH MILWAUKEE 359
HARAMBEE 324
FRANKLIN HEIGHTS 285
SILVER SPRING 254
HISTORIC MITCHELL STREET
251
NORTH DIVISION 228
SHERMAN PARK 226
AMANI 210
LINCOLN VILLAGE 202
MIDTOWN 194
Data Source: COMPASS
Note: See Appendix A for full neighborhood chart.

46 2016 Milwaukee Homicide Review Commission Annual Report
Figure 31. Nonfatal Shooting Frequency by Neighborhood, 2016
Data Source: MPD, 2016

2016 Milwaukee Homicide Review Commission Annual Report 47
Table 7. Nonfatal Shooting Frequency by Neighborhood, Top 10, 2016
Neighborhood Nonfatal Shooting Frequency
OLD NORTH MILWAUKEE 34
HARAMBEE 26
SHERMAN PARK 26
AMANI 22
FRANKLIN HEIGHTS 21
NORTH DIVISION 18
MIDTOWN 15
SILVER SPRING 14
MUSKEGO WAY 13
WASHINGTON PARK 12
Data Source: MPD, 2016
Note: See Appendix A for full neighborhood chart.

48 2016 Milwaukee Homicide Review Commission Annual Report
Figure 32. Homicide Frequency by Neighborhood in the City of Milwaukee, 2016
Data Source: MPD, 2016

2016 Milwaukee Homicide Review Commission Annual Report 49
Table 8. Homicide Frequency by Neighborhood, Top 10, 2016
Neighborhood Homicide Frequency
HARAMBEE 10
FRANKLIN HEIGHTS 9
SHERMAN PARK 8
OLD NORTH MILWAUKEE 7
RUFUS KING 7
NORTH DIVISION 5
AVENUES WEST 4
MERRILL PARK 4
MIDTOWN 4
SILVER SPRING 4
Data Source: MPD, 2016
Note: See Appendix A for full neighborhood chart.

50 2016 Milwaukee Homicide Review Commission Annual Report
Figure 33. Assault Frequency by Neighborhood, 2014-2016
Data Source: COMPASS

2016 Milwaukee Homicide Review Commission Annual Report 51
Table 9. Assault Frequency by Neighborhood, Top 10, 2014-2016
Neighborhood Assault Frequency
OLD NORTH MILWAUKEE 1103
HARAMBEE 983
SILVER SPRING 830
FRANKLIN HEIGHTS 786
NORTH DIVISION 748
AMANI 692
HISTORIC MITCHELL STREET
681
SHERMAN PARK 646
LINCOLN VILLAGE 641
MIDTOWN 584
Data Source: COMPASS
Note: See Appendix A for full neighborhood chart.
52 2016 Milwaukee Homicide Review Commission Annual Report
Figure 34. Nonfatal Shooting Frequency by Neighborhood, 2014-2016
Data Source: MHRC, 2014-2015; MPD, 2016

2016 Milwaukee Homicide Review Commission Annual Report 53
Table 10. Nonfatal Shooting Frequency by Neighborhood, Top 10, 2014-2016
Neighborhood Nonfatal Shooting Frequency
OLD NORTH MILWAUKEE 101
AMANI 92
FRANKLIN HEIGHTS 86
HARAMBEE 84
NORTH DIVISION 70
SHERMAN PARK 62
MIDTOWN 47
WASHINGTON PARK 47
SAINT JOSEPH 46
HAMPTON HEIGHTS 43
Data Source: MHRC, 2014-2015; MPD, 2016
Note: See Appendix A for full neighborhood chart.

54 2016 Milwaukee Homicide Review Commission Annual Report
Figure 35. Homicide Frequency by Neighborhood, 2014-2016
Data Source: MHRC, 2014-2015; MPD, 2016

2016 Milwaukee Homicide Review Commission Annual Report 55
Table 11. Homicide Frequency by Neighborhood, Top 10, 2014-2016
Neighborhood Homicide Frequency
FRANKLIN HEIGHTS 24
HARAMBEE 23
OLD NORTH MILWAUKEE 19
NORTH DIVISION 17
AMANI 15
SHERMAN PARK 14
MIDTOWN 12
LINCOLN VILLAGE 11
RUFUS KING 11
ARLINGTON HEIGHTS 10
Data Source: MHRC, 2014-2015; MPD, 2016
Note: See Appendix A for full neighborhood chart.

56 2016 Milwaukee Homicide Review Commission Annual Report
APPENDIX

2016 Milwaukee Homicide Review Commission Annual Report 57
Table 12. Assault Frequency by Neighborhood, 2016
ALCOTT PARK 0
ALVERNO 6
AMANI 210
ARLINGTON GARDENS 22
ARLINGTON HEIGHTS 148
AVENUES WEST 124
BARAN PARK 5
BAY VIEW 76
BLUEMOUND HEIGHTS 14
BORCHERT FIELD 129
BRADLEY ES-TATES 34
BREWER'S HILL 22
BROWN DEER PARK 0
BRYNWOOD 7
BUCHEL PARK 0
BURNHAM PARK 62
CALUMET FARMS 28
CAMBRIDGE HEIGHTS 11
CANNON PARK 13
CAPITOL HEIGHTS 88
CASTLE MAN-OR 24
CLARKE SQUARE 142
CLAYTON CREST 3
CLOCK TOWER ACRES 28
COLD SPRING PARK 49
COLLEGE HEIGHTS 3
COLUMBUS PARK 56
CONCORDIA 113
COOPER PARK 17
COPERNICUS PARK 1
DINEEN PARK 72
DOWNER WOODS 6
DRETZKA PARK 1
ENDERIS PARK 22
ESTABROOK PARK 6
EUCLID PARK 8
FAIR PARK 6
FAIRFIELD 43
FAIRVIEW 17
FERNWOOD 6
FLORIST HIGHLANDS 7
FOREST HOME HILLS 83
FRANKLIN HEIGHTS 285
FREEDOM VILLAGE 0
GARDEN HOMES 83
GOLDEN GATE 2
GOLDEN VALLEY 13
GOLDMAN PARK 8
GRACELAND 35
GRANTOSA 15
GRANVILLE STATION 22
GRANVILLE WOODS 1
GRA-RAM 9
GRASSLYN MANOR 50
GREEN MOOR 3
GROVER HEIGHTS 8
HALYARD PARK 8
HAMPTON HEIGHTS 134
HARAMBEE 324
HARBOR VIEW 11
HARDER'S OAKS 9
HAVEN-WOODS 18
HAWLEY FARMS 5
HAWTHORNE GLEN 0
HAYMARKET 6
HERITAGE HEIGHTS 0
HIGHWOOD ESTATES 3
HILLSIDE 30
HILLTOP PARISH 14
HISTORIC MITCHELL STREET 251
HISTORIC THIRD WARD 9
HOLLER PARK 0
HONEY CREEK MAN-
OR 16
HONEY CREEK
PARKWAY 5
JACKSON PARK 50
JOHNSON'S WOODS 18
JONES' IS-LAND 0
JUNEAU TOWN 40
KILBOURN TOWN 72
KING PARK 55
KOPS PARK 16
LAKE PARK 1
LAND BANK 2
LAYTON PARK 65
LENOX HEIGHTS 22
LINCOLN CREEK 130
LINCOLN PARK 84
LINCOLN VILLAGE 202
LINDSAY PARK 59
LITTLE ME-NOMONEE PARKWAY 8
LONG VIEW 49
LOWER EAST SIDE 62
LYONS PARK 5
MACK ACRES 1
MAITLAND PARK 4
MAPLE TREE 47
MARQUETTE 5
MARTIN DRIVE 20
MC GOVERN PARK 70
MELODY VIEW 10
MENOMONEE RIVER HILLS 112
MENOMONEE RIVER HILLS EAST 40
MENOMONEE RIVER PARKWAY 1
MENOMONEE RIVER VALLEY 14
MERRILL PARK 75
METCALFE PARK 126
MIDTOWN 194
MILL VALLEY 1
MILLER VALLEY 25
MITCHELL FIELD 5
MITCHELL PARK 5
MITCHELL WEST 18
MORGAN HEIGHTS 10
MORGANDALE 64
MOUNT MARY 2
MOUNT OLIVET 1
MURRAY HILL 23
MUSKEGO WAY 178
NASH PARK 23
NATIONAL PARK 30
NEW COELN 1
NORTH DIVISION 228
NORTH GRAN-VILLE 0
NORTHPOINT 11
NORTHRIDGE 25
NORTHRIDGE LAKES 49
OLD NORTH MIL-WAUKEE 359
PARK KNOLL 2
PARK PLACE 0
PARK VIEW 7
PARKWAY HILLS 15
PHEASANT RUN 13
POLLBER HEIGHTS 11
POLONIA 70
RED OAK HEIGHTS 2
RIDGEVIEW 5
RIVER BEND 5
RIVERSIDE PARK 10
RIVERTON HEIGHTS 4
RIVERWEST 73
ROLLING GREEN 7
ROOSEVELT GROVE 126
ROOT CREEK 14
RUFUS KING 84
SAINT JOSEPH 172
SAVELAND PARK 2
SCHLITZ PARK 2
SERVITE WOODS 17
SHERMAN PARK 226
SILVER CITY 54
SILVER SPRING 254
SILVER SWAN 61
SOUTHGATE 40
SOUTHPOINT 22
ST. AMELIAN'S 24
STORY HILL 9
SUNSET HEIGHTS 56
THE VALLEY / PIGSVILLE 1
THURSTON WOODS 87
TIMMERMAN AIRPORT 3
TIMMERMAN WEST 57
TIPPECANOE 11
TOWN & COUN-TRY MANOR 59
TOWN OF LAKE 20
TRIANGLE 9
TRIANGLE NORTH 76
TRIPOLI PARK 19
UPPER EAST SIDE 22
UPTOWN 185
VALHALLA 95
VALLEY FORGE 0
VETERANS AF-FAIRS 1
VOGEL PARK 35
WAHL PARK 66
WALKER'S POINT 143
WALNUT HILL 56
WASHINGTON HEIGHTS 25
WASHINGTON PARK 155
WEDGEWOOD 3
WEST VIEW 5
WHISPERING HILLS 2
WHITE MANOR 5
WICK FIELD 2
WILLIAMSBURG 79
WILSON PARK 13
WOODLAND COURT 3
WOODLANDS 73
WYRICK PARK 15
YANKEE HILL 19
ZOO 0

58 2016 Milwaukee Homicide Review Commission Annual Report
Table 13. Nonfatal Shooting Frequency by Neighborhood, 2016
ALCOTT PARK 0
ALVERNO 0
AMANI 22
ARLINGTON GARDENS 0
ARLINGTON HEIGHTS 8
AVENUES WEST 4
BARAN PARK 0
BAY VIEW 1
BLUEMOUND HEIGHTS 0
BORCHERT FIELD 9
BRADLEY ESTATES 2
BREWER'S HILL 3
BROWN DEER PARK 0
BRYNWOOD 1
BUCHEL PARK 0
BURNHAM PARK 1
CALUMET FARMS 1
CAMBRIDGE HEIGHTS 0
CANNON PARK 0
CAPITOL HEIGHTS 8
CASTLE MAN-OR 0
CLARKE SQUARE 9
CLAYTON CREST 0
CLOCK TOW-ER ACRES 1
COLD SPRING PARK 0
COLLEGE HEIGHTS 0
COLUMBUS PARK 5
CONCORDIA 9
COOPER PARK 1
COPERNICUS PARK 0
DINEEN PARK 2 DOWNER WOODS 0
DRETZKA PARK 0
ENDERIS PARK 1
ESTABROOK PARK 0
EUCLID PARK 0
FAIR PARK 0
FAIRFIELD 2
FAIRVIEW 0
FERNWOOD 0 FLORIST
HIGHLANDS 0 FOREST
HOME HILLS 4 FRANKLIN HEIGHTS 21
FREEDOM VILLAGE 0 GARDEN HOMES 6
GOLDEN GATE 1
GOLDEN VALLEY 0
GOLDMAN PARK 0
GRACELAND 2
GRANTOSA 0 GRANVILLE
STATION 0 GRANVILLE
WOODS 0
GRA-RAM 0 GRASSLYN
MANOR 3 GREEN MOOR 0
GROVER HEIGHTS 0 HALYARD
PARK 0 HAMPTON HEIGHTS 9
HARAMBEE 26 HARBOR
VIEW 0 HARDER'S
OAKS 0 HAVEN-WOODS 1 HAWLEY FARMS 1 HAW-
THORNE GLEN 0
HAYMARKET 0 HERITAGE HEIGHTS 0
HIGHWOOD ESTATES 0
HILLSIDE 2 HILLTOP PARISH 0
HISTORIC MITCHELL STREET 9
HISTORIC THIRD WARD 0
HOLLER PARK 0
HONEY CREEK MANOR 0 HONEY CREEK
PARKWAY 0 JACKSON
PARK 1 JOHNSON'S
WOODS 0 JONES' ISLAND 0 JUNEAU TOWN 2
KILBOURN TOWN 2
KING PARK 2
KOPS PARK 0
LAKE PARK 0
LAND BANK 0 LAYTON
PARK 2 LENOX
HEIGHTS 0 LINCOLN CREEK 10
LINCOLN PARK 5
LINCOLN VILLAGE 4 LINDSAY
PARK 0 LITTLE ME-NOMONEE PARKWAY 0
LONG VIEW 1 LOWER
EAST SIDE 1
LYONS PARK 0 MACK ACRES 0
MAITLAND PARK 0
MAPLE TREE 1
MARQUETTE 0 MARTIN DRIVE 2
MC GOVERN PARK 7
MELODY VIEW 0 ME-
NOMONEE RIVER HILLS 4
ME-NOMONEE
RIVER HILLS EAST 0 ME-
NOMONEE RIVER PARK-
WAY 0 ME-
NOMONEE RIVER VAL-
LEY 0 MERRILL
PARK 7 METCALFE
PARK 11
MIDTOWN 15
MILL VALLEY 0 MILLER VAL-
LEY 0 MITCHELL
FIELD 0 MITCHELL
PARK 0 MITCHELL
WEST 1
MORGAN HEIGHTS 0 MORGAN-
DALE 3 MOUNT MARY 0
MOUNT OLIVET 0
MURRAY HILL 0
MUSKEGO WAY 13
NASH PARK 2 NATIONAL
PARK 0
NEW COELN 0 NORTH DIVI-
SION 18 NORTH
GRANVILLE 0 NORTH-POINT 0
NORTHRIDGE 0
NORTHRIDGE LAKES 1
OLD NORTH MILWAUKEE 34
PARK KNOLL 0
PARK PLACE 0
PARK VIEW 0 PARKWAY
HILLS 0 PHEASANT
RUN 0 POLLBER HEIGHTS 0
POLONIA 3 RED OAK HEIGHTS 0
RIDGEVIEW 0
RIVER BEND 0 RIVERSIDE
PARK 1 RIVERTON HEIGHTS 0
RIVERWEST 5 ROLLING GREEN 0
ROOSEVELT GROVE 8 ROOT
CREEK 1
RUFUS KING 6 SAINT JO-
SEPH 10 SAVELAND
PARK 0 SCHLITZ
PARK 0 SERVITE WOODS 0
SHERMAN PARK 26
SILVER CITY 0 SILVER SPRING 14 SILVER SWAN 1
SOUTHGATE 0
SOUTH-POINT 0
ST. AME-LIAN'S 2
STORY HILL 0 SUNSET HEIGHTS 6 THE VAL-
LEY / PIGS-VILLE 0
THURSTON WOODS 8
TIMMERMAN AIRPORT 1
TIMMERMAN WEST 1
TIPPECANOE 0 TOWN &
COUNTRY MANOR 0
TOWN OF LAKE 0
TRIANGLE 1 TRIANGLE
NORTH 10 TRIPOLI
PARK 1 UPPER EAST
SIDE 0
UPTOWN 10
VALHALLA 5 VALLEY FORGE 0
VETERANS AFFAIRS 0
VOGEL PARK 2
WAHL PARK 5 WALKER'S
POINT 11 WALNUT
HILL 6 WASHING-
TON HEIGHTS 0
WASHING-TON PARK 12 WEDGE-WOOD 0
WEST VIEW 0 WHISPERING
HILLS 0
WHITE MAN-OR 1
WICK FIELD 0 WILLIAMS-
BURG 5 WILSON
PARK 1
WOODLAND COURT 0 WOOD-LANDS 1
WYRICK PARK 1
YANKEE HILL 0
ZOO 0

2016 Milwaukee Homicide Review Commission Annual Report 59
Table 14. Homicide Frequency by Neighborhood, 2016
ALCOTT PARK 0
ALVERNO 0
AMANI 3
ARLINGTON GAR-DENS 1
ARLINGTON HEIGHTS 2
AVENUES WEST 4
BARAN PARK 0
BAY VIEW 0
BLUEMOUND HEIGHTS 3
BORCHERT FIELD 3
BRADLEY ESTATES 0
BREWER'S HILL 0
BROWN DEER PARK 0
BRYNWOOD 0
BUCHEL PARK 0
BURNHAM PARK 0
CALUMET FARMS 1
CAMBRIDGE HEIGHTS 0
CANNON PARK 0
CAPITOL HEIGHTS 0
CASTLE MANOR 0
CLARKE SQUARE 1
CLAYTON CREST 0
CLOCK TOWER ACRES 0
COLD SPRING PARK 0
COLLEGE HEIGHTS 0
COLUMBUS PARK 1
CONCORDIA 0
COOPER PARK 0
COPERNICUS PARK 0
DINEEN PARK 1
DOWNER WOODS 0
DRETZKA PARK 0
ENDERIS PARK 1
ESTABROOK PARK 0
EUCLID PARK 3
FAIR PARK 0
FAIRFIELD 0
FAIRVIEW 0
FERNWOOD 0
FLORIST HIGH-LANDS 2
FOREST HOME HILLS 1
FRANKLIN HEIGHTS 9
FREEDOM VILLAGE 0
GARDEN HOMES 3
GOLDEN GATE 0
GOLDEN VALLEY 0
GOLDMAN PARK 0
GRACELAND 0
GRANTOSA 0
GRANVILLE STATION 0
GRANVILLE WOODS 0
GRA-RAM 0
GRASSLYN MANOR 1
GREEN MOOR 0
GROVER HEIGHTS 0
HALYARD PARK 1
HAMPTON HEIGHTS 1
HARAMBEE 10
HARBOR VIEW 0
HARDER'S OAKS 0
HAVENWOODS 0
HAWLEY FARMS 0
HAWTHORNE GLEN 0
HAYMARKET 1
HERITAGE HEIGHTS 0
HIGHWOOD ES-TATES 0
HILLSIDE 0
HILLTOP PARISH 0
HISTORIC MITCHELL STREET 2
HISTORIC THIRD WARD 0
HOLLER PARK 0
HONEY CREEK MAN-OR 0
HONEY CREEK PARKWAY 0
JACKSON PARK 0
JOHNSON'S WOODS 0
JONES' ISLAND 0
JUNEAU TOWN 0
KILBOURN TOWN 0
KING PARK 0
KOPS PARK 0
LAKE PARK 0
LAND BANK 0
LAYTON PARK 1
LENOX HEIGHTS 1
LINCOLN CREEK 2
LINCOLN PARK 1
LINCOLN VILLAGE 2
LINDSAY PARK 0
LITTLE ME-NOMONEE PARK-
WAY 0
LONG VIEW 1
LOWER EAST SIDE 2
LYONS PARK 0
MACK ACRES 0
MAITLAND PARK 0
MAPLE TREE 1
MARQUETTE 0
MARTIN DRIVE 0
MC GOVERN PARK 0
MELODY VIEW 0
MENOMONEE RIVER HILLS 0
MENOMONEE RIVER HILLS EAST 1
MENOMONEE RIVER PARKWAY 0
MENOMONEE RIVER VALLEY 0
MERRILL PARK 4
METCALFE PARK 2
MIDTOWN 4
MILL VALLEY 0
MILLER VALLEY 0
MITCHELL FIELD 0
MITCHELL WEST 0
MORGAN HEIGHTS 0
MORGANDALE 1
MOUNT MARY 0
MOUNT OLIVET 0
MURRAY HILL 0
MUSKEGO WAY 2
NASH PARK 0
NATIONAL PARK 1
NEW COELN 0
NORTH DIVI-SION 5
NORTH GRAN-VILLE 0
NORTHPOINT 0
NORTHRIDGE 0
NORTHRIDGE LAKES 2
OLD NORTH MILWAUKEE 7
PARK KNOLL 0
PARK PLACE 0
PARK VIEW 1
PARKWAY HILLS 0
PHEASANT RUN 0
POLLBER HEIGHTS 0
POLONIA 0
RED OAK HEIGHTS 0
RIDGEVIEW 0
RIVER BEND 0
RIVERSIDE PARK 0
RIVERTON HEIGHTS 0
RIVERWEST 1
ROLLING GREEN 0
ROOSEVELT GROVE 3
ROOT CREEK 0
RUFUS KING 7
SAINT JOSEPH 0
SAVELAND PARK 0
SCHLITZ PARK 0
SERVITE WOODS 0
SHERMAN PARK 8
SILVER CITY 0
SILVER SPRING 4
SILVER SWAN 0
SOUTHGATE 1
SOUTHPOINT 0
ST. AMELIAN'S 0
STORY HILL 0
SUNSET HEIGHTS 1
THE VALLEY / PIGSVILLE 0
THURSTON WOODS 2
TIMMERMAN AIR-PORT 0
TIMMERMAN WEST 0
TIPPECANOE 0
TOWN & COUN-TRY MANOR 0
TOWN OF LAKE 0
TRIANGLE 1
TRIANGLE NORTH 0
TRIPOLI PARK 1
UPPER EAST SIDE 0
UPTOWN 1
VALHALLA 0
VALLEY FORGE 0
VETERANS AF-FAIRS 0
VOGEL PARK 1
WAHL PARK 2
WALKER'S POINT 2
WALNUT HILL 0
WASHINGTON HEIGHTS 0
WASHINGTON PARK 2
WEDGEWOOD 0
WEST VIEW 0
WHISPERING HILLS 0
WHITE MANOR 0
WICK FIELD 0
WILLIAMSBURG 4
WILSON PARK 0
WOODLAND COURT 0
WOODLANDS 1
WYRICK PARK 0
YANKEE HILL 0
ZOO 0

60 2016 Milwaukee Homicide Review Commission Annual Report
Table 15. Assault Frequency by Neighborhood, 2014-2016
ALCOTT PARK 5
ALVERNO 18
AMANI 692
ARLINGTON GARDENS 70
ARLINGTON HEIGHTS 374
AVENUES WEST 384
BARAN PARK 22
BAY VIEW 199
BLUEMOUND HEIGHTS 40
BORCHERT FIELD 365
BRADLEY ES-TATES 85
BREWER'S HILL 61
BROWN DEER PARK 0
BRYNWOOD 16
BUCHEL PARK 0
BURNHAM PARK 172
CALUMET FARMS 82
CAMBRIDGE HEIGHTS 25
CANNON PARK 34
CAPITOL HEIGHTS 276
CASTLE MANOR 69
CLARKE SQUARE 388
CLAYTON CREST 7
CLOCK TOWER ACRES 67
COLD SPRING PARK 177
COLLEGE HEIGHTS 9
COLUMBUS PARK 165
CONCORDIA 323
COOPER PARK 39
COPERNICUS PARK 5
DINEEN PARK 212
DOWNER WOODS 12
DRETZKA PARK 5
ENDERIS PARK 62
ESTABROOK PARK 15
EUCLID PARK 21
FAIR PARK 29
FOREST HOME HILLS 258
FRANKLIN HEIGHTS 786
FREEDOM VIL-LAGE 2
GARDEN HOMES 230
GOLDEN GATE 3
GOLDEN VALLEY 29
GOLDMAN PARK 31
GRACELAND 94
GRANTOSA 56
GRANVILLE STA-TION 58
GRANVILLE WOODS 1
GRA-RAM 38
GRASSLYN MAN-OR 174
GREEN MOOR 9
GROVER HEIGHTS 19
HALYARD PARK 35
HAMPTON HEIGHTS 459
HARAMBEE 983
HARBOR VIEW 20
HARDER'S OAKS 15
HAVENWOODS 58
HAWLEY FARMS 15
HAWTHORNE GLEN 0
HAYMARKET 12
HERITAGE HEIGHTS 2
HIGHWOOD ES-TATES 20
HILLSIDE 89
HILLTOP PARISH 21
HISTORIC MITCH-ELL STREET 681
HISTORIC THIRD WARD 26
HOLLER PARK 7
HONEY CREEK MANOR 43
HONEY CREEK PARKWAY 15
JACKSON PARK 121
JOHNSON'S WOODS 56
JONES' ISLAND 0
JUNEAU TOWN 121
KILBOURN TOWN 212
KING PARK 174
KOPS PARK 41
LAKE PARK 5
LAND BANK 11
LAYTON PARK 197
LENOX HEIGHTS 64
LINCOLN CREEK 369
LINCOLN PARK 257
LINCOLN VILLAGE 641
LINDSAY PARK 164
LITTLE ME-NOMONEE PARK-
WAY 21
LONG VIEW 161
LOWER EAST SIDE 149
LYONS PARK 13
MACK ACRES 2
MAITLAND PARK 15
MAPLE TREE 152
MARQUETTE 16
MARTIN DRIVE 55
MC GOVERN PARK 209
MELODY VIEW 17
MENOMONEE RIVER HILLS 312
MENOMONEE RIVER HILLS EAST 126
MENOMONEE RIVER PARKWAY 5
MENOMONEE RIVER VALLEY 34
MERRILL PARK 263
METCALFE PARK 387
MIDTOWN 584
MILL VALLEY 2
MILLER VALLEY 72
MITCHELL FIELD 13
MITCHELL PARK 13
MITCHELL WEST 50
MORGAN HEIGHTS 28
MORGANDALE 168
MOUNT MARY 7
MOUNT OLIVET 2
MURRAY HILL 51
MUSKEGO WAY 553
NASH PARK 70
NATIONAL PARK 90
NEW COELN 4
NORTH DIVISION 748
NORTH GRAN-VILLE 0
NORTHPOINT 32
NORTHRIDGE 87
NORTHRIDGE LAKES 125
OLD NORTH MIL-WAUKEE 1103
PARK KNOLL 6
PARK PLACE 2
PARK VIEW 24
PARKWAY HILLS 40
PHEASANT RUN 30
POLLBER HEIGHTS 37
POLONIA 185
RED OAK HEIGHTS 4
RIDGEVIEW 10
RIVER BEND 14
RIVERSIDE PARK 35
RIVERTON HEIGHTS 23
RIVERWEST 254
ROLLING GREEN 24
ROOSEVELT GROVE 374
ROOT CREEK 50
RUFUS KING 280
SAINT JOSEPH 519
SAVELAND PARK 17
SCHLITZ PARK 4
SERVITE WOODS 50
SHERMAN PARK 646
SILVER CITY 170
SILVER SPRING 830
SILVER SWAN 196
SOUTHGATE 108
SOUTHPOINT 65
ST. AMELIAN'S 61
STORY HILL 23
SUNSET HEIGHTS 164
THE VALLEY / PIGSVILLE 22
THURSTON WOODS 267
TIMMERMAN AIRPORT 9
TIMMERMAN WEST 177
TIPPECANOE 51
TOWN & COUN-TRY MANOR 146
TOWN OF LAKE 54
TRIANGLE 39
TRIANGLE NORTH 172
TRIPOLI PARK 56
UPPER EAST SIDE 44
UPTOWN 528
VALHALLA 319
VALLEY FORGE 0
VETERANS AF-FAIRS 2
VOGEL PARK 106
WAHL PARK 210
WALKER'S POINT 427
WALNUT HILL 170
WASHINGTON HEIGHTS 114
WASHINGTON PARK 504
WEDGEWOOD 9
WEST VIEW 15
WHISPERING HILLS 4
WHITE MANOR 12
WICK FIELD 9
WILLIAMSBURG 203
WILSON PARK 41
WOODLAND COURT 10
WOODLANDS 234
WYRICK PARK 44
YANKEE HILL 34
ZOO 0
FAIRFIELD 117
FAIRVIEW 38
FERNWOOD 19
FLORIST HIGH-LANDS 17

2016 Milwaukee Homicide Review Commission Annual Report 61
Table 16. Nonfatal Shooting Frequency by Neighborhood, 2014-2016
ALCOTT PARK 0
ALVERNO 0
AMANI 92
ARLINGTON GARDENS 3
ARLINGTON HEIGHTS 37
AVENUES WEST 15
BARAN PARK 1
BAY VIEW 2
BLUEMOUND HEIGHTS 1
BORCHERT FIELD 34
BRADLEY ES-TATES 3
BREWER'S HILL 3
BROWN DEER PARK 0
BRYNWOOD 2
BUCHEL PARK 0
BURNHAM PARK 10
CALUMET FARMS 2
CAMBRIDGE HEIGHTS 2
CANNON PARK 0
CAPITOL HEIGHTS 21
CASTLE MANOR 1
CLARKE SQUARE 24
CLAYTON CREST 0
CLOCK TOWER ACRES 1
COLD SPRING PARK 4
COLLEGE HEIGHTS 0
COLUMBUS PARK 11
CONCORDIA 19
COOPER PARK 2
COPERNICUS PARK 0
DINEEN PARK 11
DOWNER WOODS 0
DRETZKA PARK 0
ENDERIS PARK 2
ESTABROOK PARK 0
EUCLID PARK 0
FAIR PARK 0
FAIRFIELD 3
FAIRVIEW 0
FERNWOOD 0
FLORIST HIGH-LANDS 0
FOREST HOME HILLS 16
FRANKLIN HEIGHTS 86
FREEDOM VIL-LAGE 0
GARDEN HOMES 29
GOLDEN GATE 1
GOLDEN VALLEY 0
GOLDMAN PARK 0
GRACELAND 5
GRANTOSA 3
GRANVILLE STA-TION 4
GRANVILLE WOODS 0
GRA-RAM 0
GRASSLYN MAN-OR 13
GREEN MOOR 0
GROVER HEIGHTS 1
HALYARD PARK 2
HAMPTON HEIGHTS 43
HARAMBEE 84
HARBOR VIEW 1
HARDER'S OAKS 0
HAVENWOODS 1
HAWLEY FARMS 1
HAWTHORNE GLEN 0
HAYMARKET 1
HERITAGE HEIGHTS 0
HIGHWOOD ES-TATES 0
HILLSIDE 6
HILLTOP PARISH 0
HISTORIC MITCH-ELL STREET 30
HISTORIC THIRD WARD 0
HOLLER PARK 0
HONEY CREEK MANOR 0
HONEY CREEK PARKWAY 2
JACKSON PARK 3
JOHNSON'S WOODS 0
JONES' ISLAND 0
JUNEAU TOWN 3
KILBOURN TOWN 4
KING PARK 7
KOPS PARK 1
LAKE PARK 0
LAND BANK 0
LAYTON PARK 9
LENOX HEIGHTS 2
LINCOLN CREEK 34
LINCOLN PARK 20
LINCOLN VIL-LAGE 23
LINDSAY PARK 3
LITTLE ME-NOMONEE PARKWAY 1
LONG VIEW 6
LOWER EAST SIDE 1
LYONS PARK 0
MACK ACRES 0
MAITLAND PARK 0
MAPLE TREE 5
MARQUETTE 0
MARTIN DRIVE 4
MC GOVERN PARK 11
MELODY VIEW 0
MENOMONEE RIVER HILLS 11
MENOMONEE RIVER HILLS
EAST 3
MENOMONEE RIVER PARK-
WAY 0
MENOMONEE RIVER VALLEY 0
MERRILL PARK 18
METCALFE PARK 40
MIDTOWN 47
MILL VALLEY 0
MILLER VALLEY 0
MITCHELL FIELD 0
MITCHELL PARK 0
MITCHELL WEST 2
MORGAN HEIGHTS 0
MORGANDALE 4
MOUNT MARY 0
MOUNT OLIVET 0
MURRAY HILL 0
MUSKEGO WAY 40
NASH PARK 3
NATIONAL PARK 3
NEW COELN 0
NORTH DIVISION 70
NORTH GRAN-VILLE 0
NORTHPOINT 1
NORTHRIDGE 2
NORTHRIDGE LAKES 2
OLD NORTH MIL-WAUKEE 101
PARK KNOLL 0
PARK PLACE 0
PARK VIEW 3
PARKWAY HILLS 0
PHEASANT RUN 0
POLLBER HEIGHTS 0
POLONIA 7
RED OAK HEIGHTS 0
RIDGEVIEW 0
RIVER BEND 0
RIVERSIDE PARK 2
RIVERTON HEIGHTS 0
RIVERWEST 16
ROLLING GREEN 0
ROOSEVELT GROVE 32
ROOT CREEK 1
RUFUS KING 24
SAINT JOSEPH 46
SAVELAND PARK 2
SCHLITZ PARK 0
SERVITE WOODS 0
SHERMAN PARK 62
SILVER CITY 3
SILVER SPRING 32
SILVER SWAN 8
SOUTHGATE 1
SOUTHPOINT 0
ST. AMELIAN'S 4
STORY HILL 0
SUNSET HEIGHTS 20
THE VALLEY / PIGS-VILLE 0
THURSTON WOODS 14
TIMMERMAN AIR-PORT 1
TIMMERMAN WEST 7
TIPPECANOE 0
TOWN & COUNTRY MANOR 3
TOWN OF LAKE 0
TRIANGLE 9
TRIANGLE NORTH 26
TRIPOLI PARK 2
UPPER EAST SIDE 0
UPTOWN 37
VALHALLA 11
VALLEY FORGE 0
VETERANS AFFAIRS 0
VOGEL PARK 3
WAHL PARK 14
WALKER'S POINT 27
WALNUT HILL 20
WASHINGTON HEIGHTS 0
WASHINGTON PARK 47
WEDGEWOOD 0
WEST VIEW 1
WHISPERING HILLS 0
WHITE MANOR 1
WICK FIELD 0
WILLIAMSBURG 14
WILSON PARK 1
WOODLAND COURT 0
WOODLANDS 4
WYRICK PARK 1
YANKEE HILL 0
ZOO 0

62 2016 Milwaukee Homicide Review Commission Annual Report
Table 17. Homicide Frequency by Neighborhood, 2014-2016
ALCOTT PARK 0
ALVERNO 0
AMANI 15
ARLINGTON GARDENS 3
ARLINGTON HEIGHTS 10
AVENUES WEST 7
BARAN PARK 0
BAY VIEW 1
BLUEMOUND HEIGHTS 3
BORCHERT FIELD 6
BRADLEY ES-TATES 0
BREWER'S HILL 1
BROWN DEER PARK 0
BRYNWOOD 0
BUCHEL PARK 0
BURNHAM PARK 3
CALUMET FARMS 1
CAMBRIDGE HEIGHTS 0
CANNON PARK 0
CAPITOL HEIGHTS 3
CASTLE MANOR 0
CLARKE SQUARE 6
CLAYTON CREST 0
CLOCK TOWER ACRES 1
COLD SPRING PARK 0
COLLEGE HEIGHTS 0
COLUMBUS PARK 3
CONCORDIA 4
COOPER PARK 0
COPERNICUS PARK 0
DINEEN PARK 3
DOWNER WOODS 0
DRETZKA PARK 0
ENDERIS PARK 1
ESTABROOK PARK 0
EUCLID PARK 3
FAIR PARK 0
FAIRFIELD 1
FAIRVIEW 0
FERNWOOD 0
FLORIST HIGH-LANDS 2
FOREST HOME HILLS 5
FRANKLIN HEIGHTS 24
FREEDOM VIL-LAGE 0
GARDEN HOMES 7
GOLDEN GATE 0
GOLDEN VAL-LEY 0
GOLDMAN PARK 0
GRACELAND 2
GRANTOSA 1
GRANVILLE STA-TION 0
GRANVILLE WOODS 0
GRA-RAM 0
GRASSLYN MANOR 5
GREEN MOOR 0
GROVER HEIGHTS 0
HALYARD PARK 2
HAMPTON HEIGHTS 7
HARAMBEE 23
HARBOR VIEW 0
HARDER'S OAKS 0
HAVENWOODS 0
HAWLEY FARMS 0
HAWTHORNE GLEN 0
HAYMARKET 1
HERITAGE HEIGHTS 0
HIGHWOOD ES-TATES 0
HILLSIDE 2
HILLTOP PARISH 0
HISTORIC MITCHELL STREET 4
HISTORIC THIRD WARD 0
HOLLER PARK 0
HONEY CREEK MANOR 1
HONEY CREEK PARKWAY 0
JACKSON PARK 0
JOHNSON'S WOODS 0
JONES' ISLAND 0
JUNEAU TOWN 0
KILBOURN TOWN 0
KING PARK 0
KOPS PARK 0
LAKE PARK 0
LAND BANK 0
LAYTON PARK 1
LENOX HEIGHTS 1
LINCOLN CREEK 5
LINCOLN PARK 3
LINCOLN VILLAGE 11
LINDSAY PARK 0
LITTLE ME-NOMONEE PARK-
WAY 0
LONG VIEW 2
LOWER EAST SIDE 2
LYONS PARK 1
MACK ACRES 0
MAITLAND PARK 0
MAPLE TREE 2
MARQUETTE 0
MARTIN DRIVE 0
MC GOVERN PARK 0
MELODY VIEW 0
MENOMONEE RIVER HILLS 3
MENOMONEE RIVER HILLS
EAST 2
MENOMONEE RIVER PARKWAY 0
MENOMONEE RIVER VALLEY 0
MERRILL PARK 6
METCALFE PARK 5
MIDTOWN 12
MILL VALLEY 0
MILLER VALLEY 0
MITCHELL FIELD 0
MITCHELL PARK 0
MITCHELL WEST 1
MORGAN HEIGHTS 0
MORGANDALE 2
MOUNT MARY 0
MOUNT OLIVET 0
MURRAY HILL 0
MUSKEGO WAY 6
NASH PARK 0
NATIONAL PARK 1
NEW COELN 0
NORTH DIVISION 17
NORTH GRAN-VILLE 0
NORTHPOINT 1
NORTHRIDGE 0
NORTHRIDGE LAKES 2
OLD NORTH MIL-WAUKEE 19
PARK KNOLL 0
PARK PLACE 0
PARK VIEW 1
PARKWAY HILLS 0
PHEASANT RUN 0
POLLBER HEIGHTS 0
POLONIA 0
RED OAK HEIGHTS 0
RIDGEVIEW 0
RIVER BEND 0
RIVERSIDE PARK 0
RIVERTON HEIGHTS 0
RIVERWEST 2
ROLLING GREEN 0
ROOSEVELT GROVE 7
ROOT CREEK 1
RUFUS KING 11
SAINT JOSEPH 3
SAVELAND PARK 0
SCHLITZ PARK 0
SERVITE WOODS 0
SHERMAN PARK 14
SILVER CITY 1
SILVER SPRING 10
SILVER SWAN 3
SOUTHGATE 1
SOUTHPOINT 0
ST. AMELIAN'S 0
STORY HILL 0
SUNSET HEIGHTS 4
THE VALLEY / PIGS-VILLE 2
THURSTON WOODS 5
TIMMERMAN AIR-PORT 0
TIMMERMAN WEST 0
TIPPECANOE 0
TOWN & COUNTRY MANOR 1
TOWN OF LAKE 0
TRIANGLE 1
TRIANGLE NORTH 1
TRIPOLI PARK 1
UPPER EAST SIDE 0
UPTOWN 7
VALHALLA 3
VALLEY FORGE 0
VETERANS AF-FAIRS 0
VOGEL PARK 1
WAHL PARK 7
WALKER'S POINT 4
WALNUT HILL 1
WASHINGTON HEIGHTS 0
WASHINGTON PARK 5
WEDGEWOOD 1
WEST VIEW 0
WHISPERING HILLS 0
WHITE MANOR 0
WICK FIELD 0
WILLIAMSBURG 4
WILSON PARK 0
WOODLAND COURT 0
WOODLANDS 3
WYRICK PARK 0
YANKEE HILL 0
ZOO 0

2016 Milwaukee Homicide Review Commission Annual Report 63