Embed Size (px)
Citation preview

Mid Range PlanFiscal Years 2008-2011
November 2007
2
Agenda
• Executive Summary
• Core Programs
• Programming
• Ad-Supported Digital Networks
• Strategic Investments
• Distribution and Licensing
• SPHE & SPTI Contribution to SPT Product
• Ad Sales
• APPENDIX: Financial Slides
3
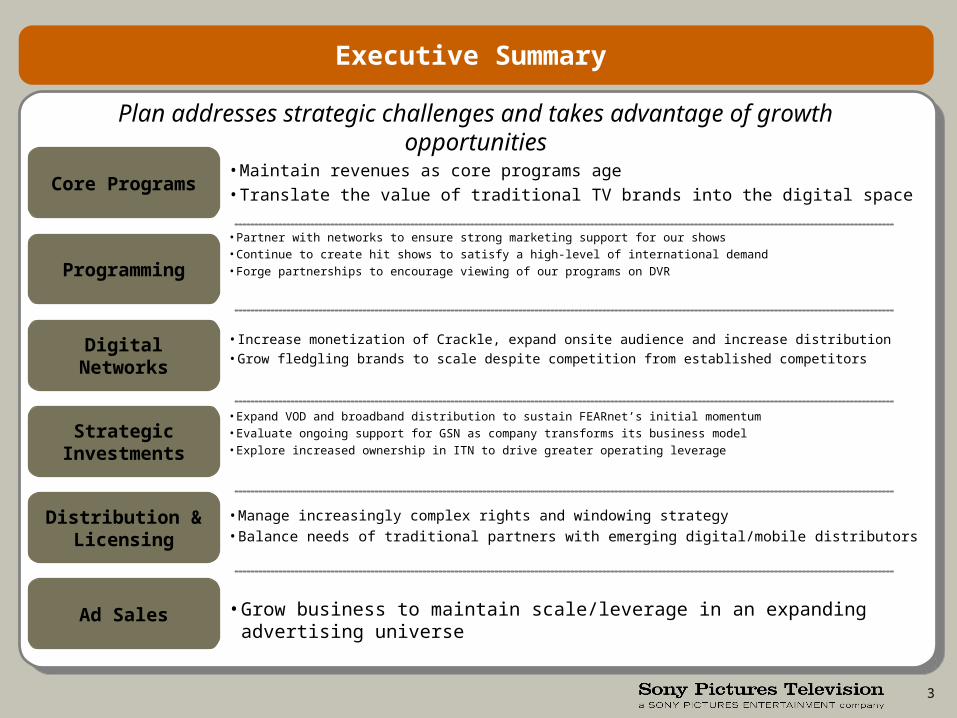
• Expand VOD and broadband distribution to sustain FEARnet’s initial momentum• Evaluate ongoing support for GSN as company transforms its business model• Explore increased ownership in ITN to drive greater operating leverage
• Manage increasingly complex rights and windowing strategy
• Balance needs of traditional partners with emerging digital/mobile distributors
• Increase monetization of Crackle, expand onsite audience and increase distribution
• Grow fledgling brands to scale despite competition from established competitors
• Partner with networks to ensure strong marketing support for our shows• Continue to create hit shows to satisfy a high-level of international demand• Forge partnerships to encourage viewing of our programs on DVR
Executive Summary
Core Programs• Maintain revenues as core programs age
• Translate the value of traditional TV brands into the digital space
Programming
Digital Networks
Strategic Investments
Distribution & Licensing
Ad Sales • Grow business to maintain scale/leverage in an expanding advertising universe
Plan addresses strategic challenges and takes advantage of growth opportunities
4
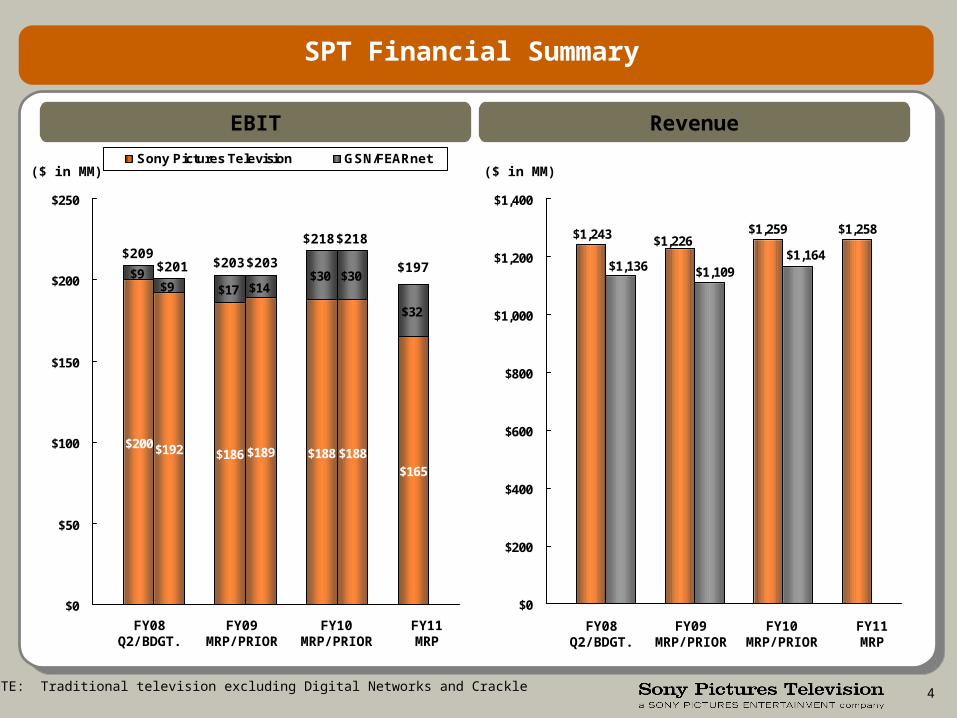
SPT Financial Summary
EBIT Revenue
$200$192 $186 $189 $188 $188$165
$9$9 $17 $14
$30 $30
$32
$0
$50
$100
$150
$200
$250
Sony Pictures Television GSN/FEARnet
FY08Q2/BDGT.
FY09MRP/PRIOR
FY10MRP/PRIOR
FY11MRP
($ in MM)
$1,258
$1,164
$1,259
$1,109
$1,226
$1,136
$1,243
$0
$200
$400
$600
$800
$1,000
$1,200
$1,400
FY08Q2/BDGT.
FY09MRP/PRIOR
FY10MRP/PRIOR
FY11MRP
($ in MM)
$209$201 $203 $203
$218 $218
$197
NOTE: Traditional television excluding Digital Networks and Crackle
5
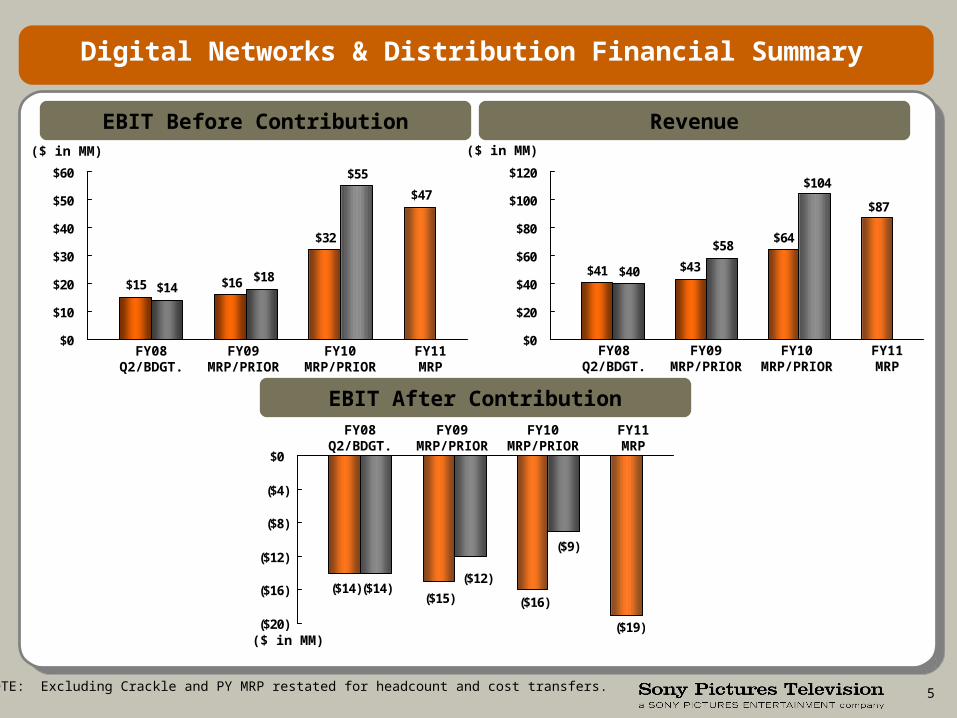
Digital Networks & Distribution Financial Summary
EBIT Before Contribution Revenue
FY08Q2/BDGT.
FY09MRP/PRIOR
FY10MRP/PRIOR
FY11MRP
($ in MM)
EBIT After ContributionFY08
Q2/BDGT.FY09
MRP/PRIORFY10
MRP/PRIORFY11MRP
($ in MM)
FY08Q2/BDGT.
FY09MRP/PRIOR
FY10MRP/PRIOR
FY11MRP
($ in MM)
$47
$55
$32
$18$16$14$15
$0
$10
$20
$30
$40
$50
$60
($19)
($9)
($16)
($12)
($15)($14)($14)
($20)
($16)
($12)
($8)
($4)
$0
$87
$104
$64$58
$43$40$41
$0
$20
$40
$60
$80
$100
$120
NOTE: Excluding Crackle and PY MRP restated for headcount and cost transfers.
6
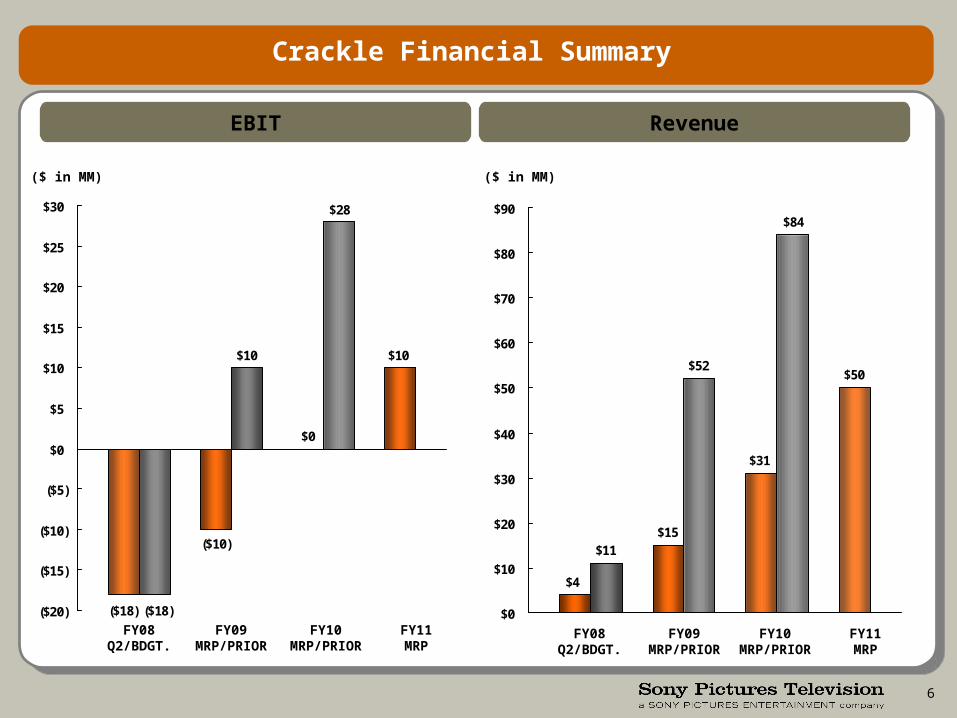
Crackle Financial Summary
EBIT Revenue
FY08Q2/BDGT.
FY09MRP/PRIOR
FY10MRP/PRIOR
FY11MRP
($ in MM)
FY08Q2/BDGT.
FY09MRP/PRIOR
FY10MRP/PRIOR
FY11MRP
($ in MM)
$10
($10)
($18)
$0
$28
($18)
$10
($20)
($15)
($10)
($5)
$0
$5
$10
$15
$20
$25
$30
$50
$31
$15
$4
$84
$11
$52
$0
$10
$20
$30
$40
$50
$60
$70
$80
$90
7
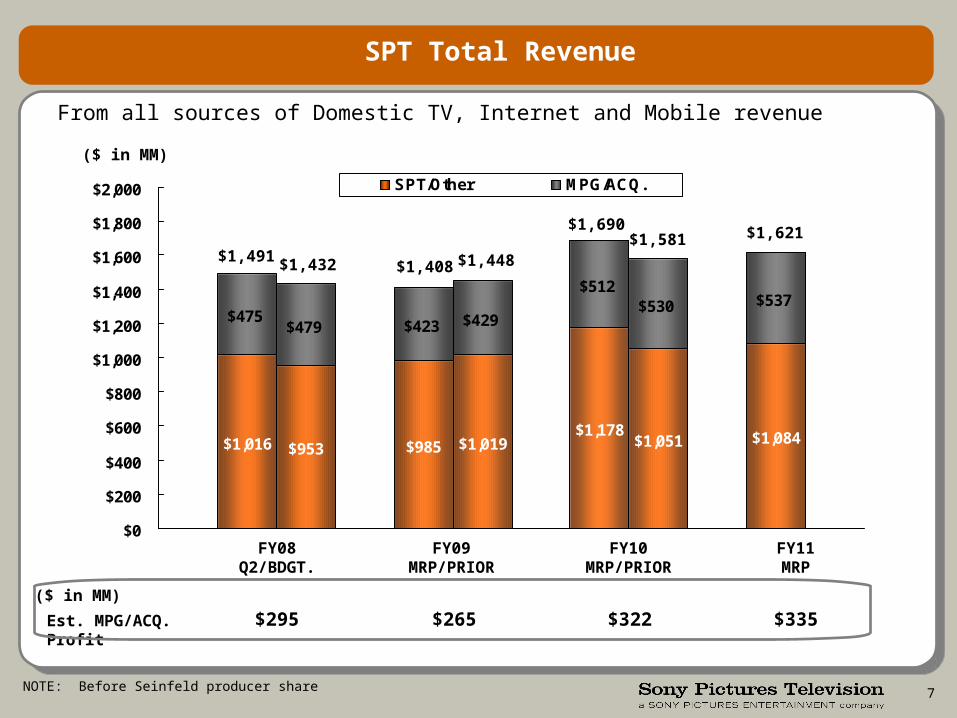
SPT Total Revenue
From all sources of Domestic TV, Internet and Mobile revenue
Est. MPG/ACQ. Profit $295 $265 $322 $335
$1,016 $953 $985 $1,019$1,178
$1,051 $1,084
$475$479 $423 $429
$512$530 $537
$0
$200
$400
$600
$800
$1,000
$1,200
$1,400
$1,600
$1,800
$2,000 SPT/Other MPG/ACQ.
($ in MM)
FY08Q2/BDGT.
FY09MRP/PRIOR
FY10MRP/PRIOR
FY11MRP
NOTE: Before Seinfeld producer share
$1,491 $1,432 $1,408 $1,448
$1,690$1,581 $1,621
($ in MM)
8
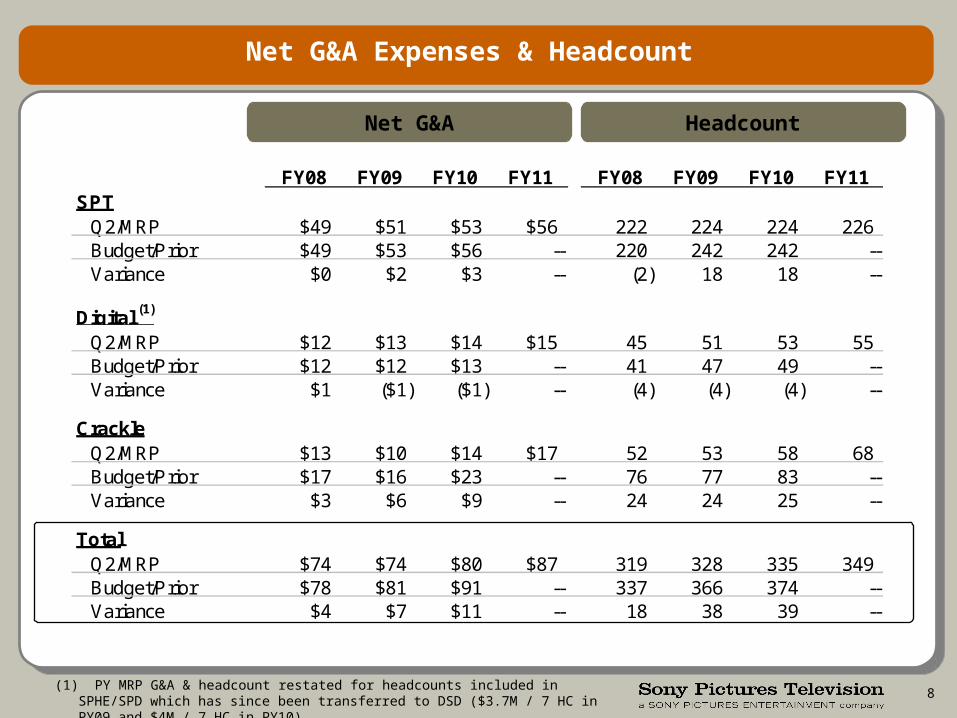
Net G&A Expenses & Headcount
FY08 FY09 FY10 FY11 FY08 FY09 FY10 FY11SPT
Q2/MRP $49 $51 $53 $56 222 224 224 226Budget/Prior $49 $53 $56 -- 220 242 242 --Variance $0 $2 $3 -- (2) 18 18 --
Digital (1)
Q2/MRP $12 $13 $14 $15 45 51 53 55Budget/Prior $12 $12 $13 -- 41 47 49 --Variance $1 ($1) ($1) -- (4) (4) (4) --
CrackleQ2/MRP $13 $10 $14 $17 52 53 58 68Budget/Prior $17 $16 $23 -- 76 77 83 --Variance $3 $6 $9 -- 24 24 25 --
TotalQ2/MRP $74 $74 $80 $87 319 328 335 349Budget/Prior $78 $81 $91 -- 337 366 374 --Variance $4 $7 $11 -- 18 38 39 --
Net G&A Headcount
(1) PY MRP G&A & headcount restated for headcounts included in SPHE/SPD which has since been transferred to DSD ($3.7M / 7 HC in PY09 and $4M / 7 HC in PY10)

CORE PROGRAMS
10
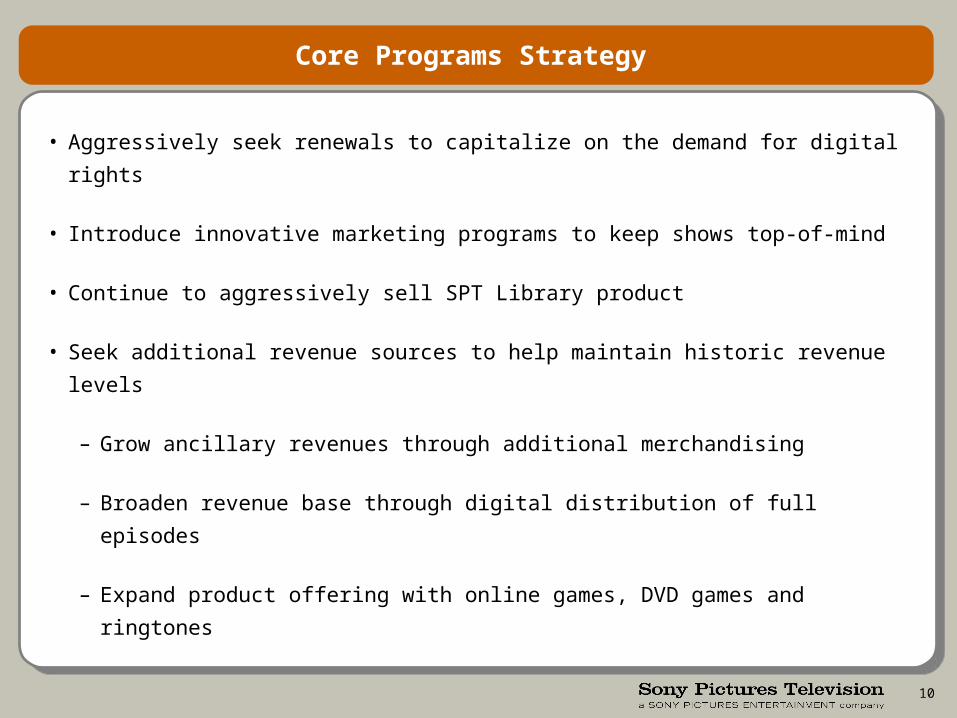
Core Programs Strategy
• Aggressively seek renewals to capitalize on the demand for digital rights
• Introduce innovative marketing programs to keep shows top-of-mind
• Continue to aggressively sell SPT Library product
• Seek additional revenue sources to help maintain historic revenue levels
– Grow ancillary revenues through additional merchandising
– Broaden revenue base through digital distribution of full episodes
– Expand product offering with online games, DVD games and ringtones
11
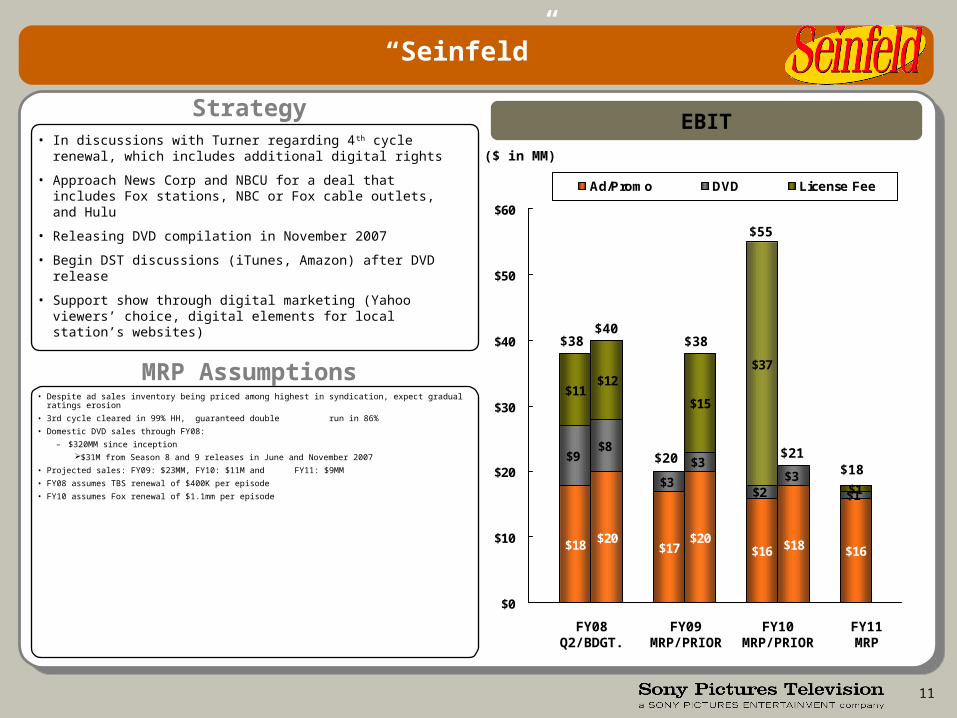
“Seinfeld”
EBIT
$18 $20$17
$20$16 $18 $16
$9$8
$3
$3
$2$3
$1
$11$12
$15
$37
$1
$0
$10
$20
$30
$40
$50
$60
Ad/Promo DVD License Fee
FY08Q2/BDGT.
FY09MRP/PRIOR
FY10MRP/PRIOR
FY11MRP
($ in MM)• In discussions with Turner regarding 4th cycle renewal,
which includes additional digital rights
• Approach News Corp and NBCU for a deal that includes Fox stations, NBC or Fox cable outlets, and Hulu
• Releasing DVD compilation in November 2007
• Begin DST discussions (iTunes, Amazon) after DVD release
• Support show through digital marketing (Yahoo viewers’ choice, digital elements for local station’s websites)
• Despite ad sales inventory being priced among highest in syndication, expect gradual ratings erosion
• 3rd cycle cleared in 99% HH, guaranteed double run in 86%
• Domestic DVD sales through FY08:
– $320MM since inception
$31M from Season 8 and 9 releases in June and November 2007
• Projected sales: FY09: $23MM, FY10: $11M and FY11: $9MM
• FY08 assumes TBS renewal of $400K per episode
• FY10 assumes Fox renewal of $1.1mm per episode
MRP Assumptions
Strategy
$38$40
$20
$38
$55
$21$18
12
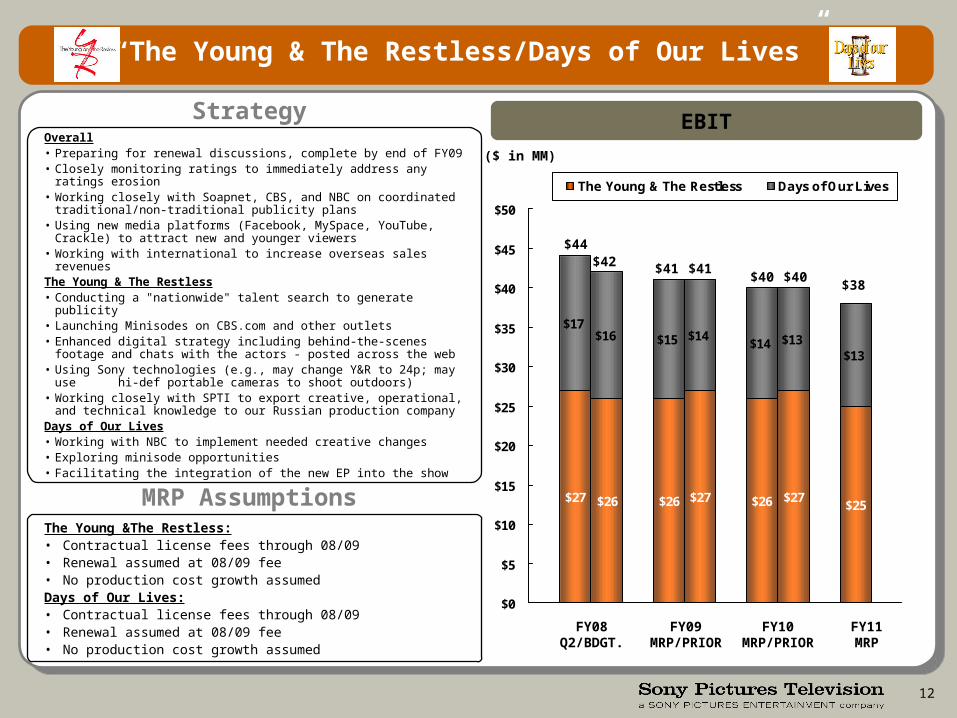
“The Young & The Restless/Days of Our Lives”
EBIT
$27 $26 $26 $27 $26 $27$25
$17$16 $15 $14
$14 $13$13
$0
$5
$10
$15
$20
$25
$30
$35
$40
$45
$50
The Young & The Restless Days of Our Lives
FY08Q2/BDGT.
FY09MRP/PRIOR
FY10MRP/PRIOR
FY11MRP
($ in MM)Overall• Preparing for renewal discussions, complete by end of FY09• Closely monitoring ratings to immediately address any ratings erosion• Working closely with Soapnet, CBS, and NBC on coordinated
traditional/non-traditional publicity plans• Using new media platforms (Facebook, MySpace, YouTube, Crackle)
to attract new and younger viewers• Working with international to increase overseas sales revenuesThe Young & The Restless• Conducting a "nationwide" talent search to generate publicity• Launching Minisodes on CBS.com and other outlets• Enhanced digital strategy including behind-the-scenes footage and
chats with the actors - posted across the web• Using Sony technologies (e.g., may change Y&R to 24p; may use
hi-def portable cameras to shoot outdoors)• Working closely with SPTI to export creative, operational, and
technical knowledge to our Russian production company Days of Our Lives• Working with NBC to implement needed creative changes• Exploring minisode opportunities• Facilitating the integration of the new EP into the show
The Young &The Restless:• Contractual license fees through 08/09• Renewal assumed at 08/09 fee• No production cost growth assumedDays of Our Lives:• Contractual license fees through 08/09• Renewal assumed at 08/09 fee• No production cost growth assumed
Strategy
MRP Assumptions
$44$42 $41 $41
$40 $40$38
13
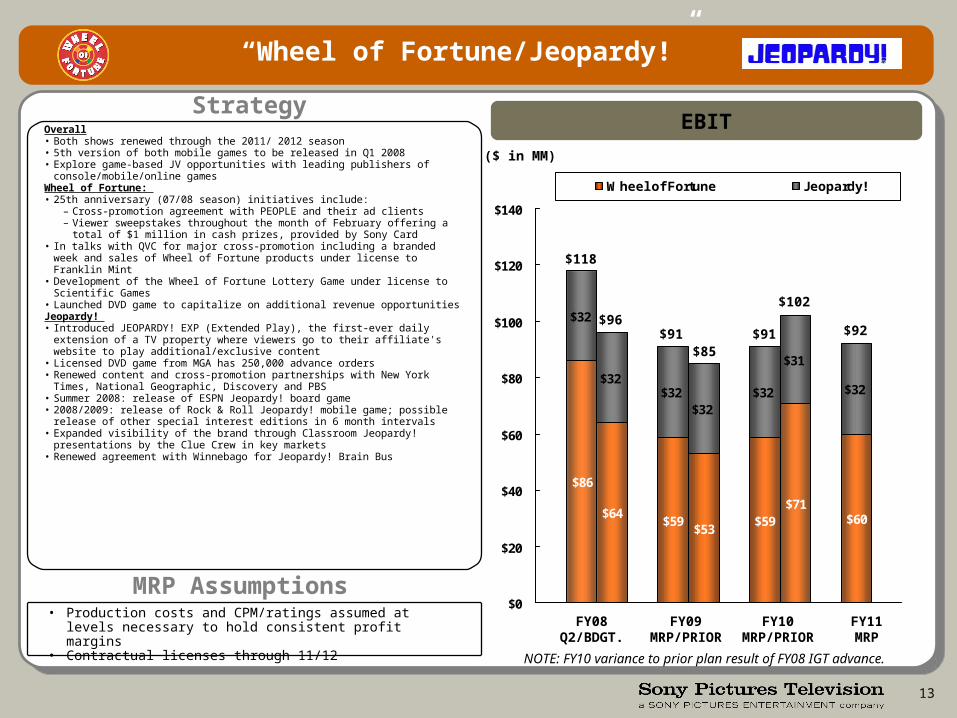
“Wheel of Fortune/Jeopardy!”
EBIT
NOTE: FY10 variance to prior plan result of FY08 IGT advance.
$86
$64$59
$53$59
$71$60
$32
$32$32
$32$32
$31
$32
$0
$20
$40
$60
$80
$100
$120
$140
Wheel of Fortune Jeopardy!
FY08Q2/BDGT.
FY09MRP/PRIOR
FY10MRP/PRIOR
FY11MRP
($ in MM)
• Production costs and CPM/ratings assumed at levels necessary to hold consistent profit margins
• Contractual licenses through 11/12
MRP Assumptions
StrategyOverall• Both shows renewed through the 2011/ 2012 season• 5th version of both mobile games to be released in Q1 2008• Explore game-based JV opportunities with leading publishers of
console/mobile/online gamesWheel of Fortune: • 25th anniversary (07/08 season) initiatives include:
– Cross-promotion agreement with PEOPLE and their ad clients– Viewer sweepstakes throughout the month of February offering a total of $1
million in cash prizes, provided by Sony Card• In talks with QVC for major cross-promotion including a branded week and sales
of Wheel of Fortune products under license to Franklin Mint • Development of the Wheel of Fortune Lottery Game under license to Scientific
Games • Launched DVD game to capitalize on additional revenue opportunities Jeopardy! • Introduced JEOPARDY! EXP (Extended Play), the first-ever daily extension of a
TV property where viewers go to their affiliate's website to play additional/exclusive content
• Licensed DVD game from MGA has 250,000 advance orders• Renewed content and cross-promotion partnerships with New York Times,
National Geographic, Discovery and PBS • Summer 2008: release of ESPN Jeopardy! board game• 2008/2009: release of Rock & Roll Jeopardy! mobile game; possible release of
other special interest editions in 6 month intervals• Expanded visibility of the brand through Classroom Jeopardy! presentations by
the Clue Crew in key markets• Renewed agreement with Winnebago for Jeopardy! Brain Bus
$118
$96$91
$85$91
$102
$92
14
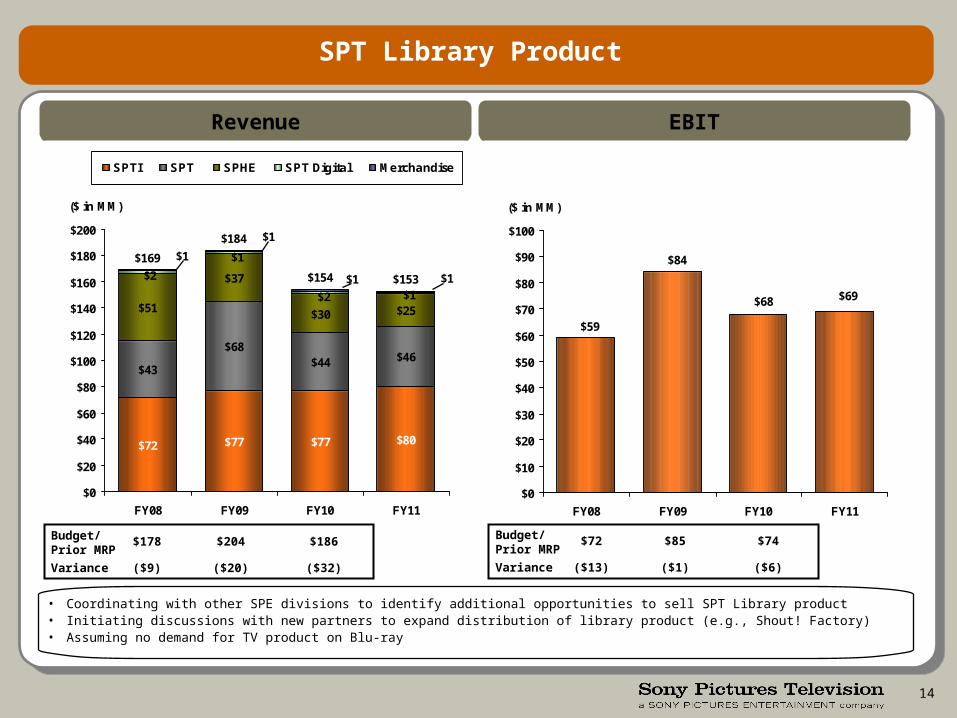
SPT Library Product
Revenue EBIT
$72 $77 $77 $80
$43
$68$44 $46
$51
$37
$30 $25
$169
$184
$154 $153$1$2
$1
$2 $1$1
$1
$1
$0
$20
$40
$60
$80
$100
$120
$140
$160
$180
$200
FY08 FY09 FY10 FY11
($ in MM)
SPTI SPT SPHE SPT Digital Merchandise
Budget/Prior MRP
Variance
$178
($9)
$204
($20)
$186
($32)
• Coordinating with other SPE divisions to identify additional opportunities to sell SPT Library product• Initiating discussions with new partners to expand distribution of library product (e.g., Shout! Factory)• Assuming no demand for TV product on Blu-ray
Budget/Prior MRP
Variance
$72
($13)
$85
($1)
$74
($6)
$69$68
$84
$59
$0
$10
$20
$30
$40
$50
$60
$70
$80
$90
$100
FY08 FY09 FY10 FY11
($ in MM)

PROGRAMMING
16
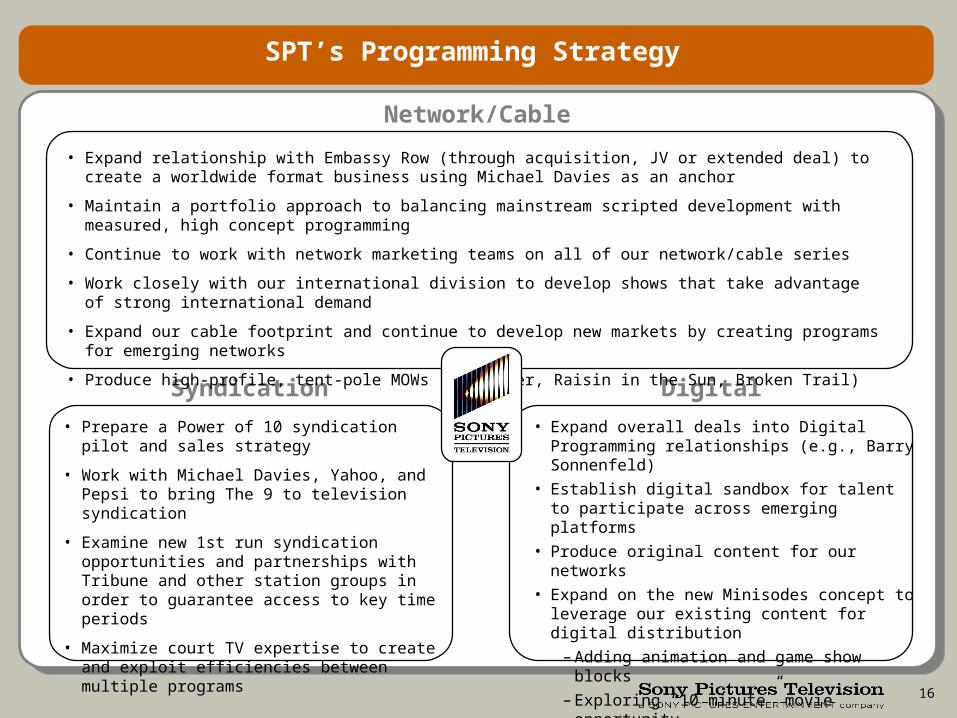
SPT’s Programming Strategy
Network/Cable
DigitalSyndication
• Expand relationship with Embassy Row (through acquisition, JV or extended deal) to create a worldwide format business using Michael Davies as an anchor
• Maintain a portfolio approach to balancing mainstream scripted development with measured, high concept programming
• Continue to work with network marketing teams on all of our network/cable series
• Work closely with our international division to develop shows that take advantage of strong international demand
• Expand our cable footprint and continue to develop new markets by creating programs for emerging networks
• Produce high-profile, tent-pole MOWs (Mayflower, Raisin in the Sun, Broken Trail)
• Expand overall deals into Digital Programming relationships (e.g., Barry Sonnenfeld)
• Establish digital sandbox for talent to participate across emerging platforms
• Produce original content for our networks
• Expand on the new Minisodes concept to leverage our existing content for digital distribution
– Adding animation and game show blocks
– Exploring “10 minute” movie opportunity
– Licensing 3rd party content for Minisodes (e.g., Voltron)
• Prepare a Power of 10 syndication pilot and sales strategy
• Work with Michael Davies, Yahoo, and Pepsi to bring The 9 to television syndication
• Examine new 1st run syndication opportunities and partnerships with Tribune and other station groups in order to guarantee access to key time periods
• Maximize court TV expertise to create and exploit efficiencies between multiple programs
17
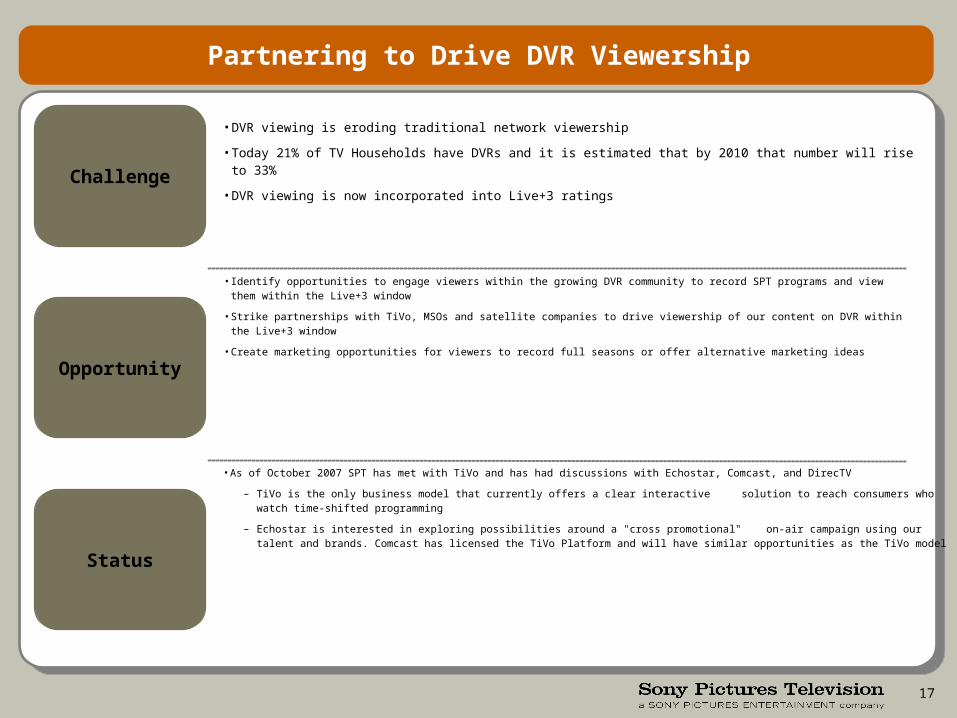
Partnering to Drive DVR Viewership
• As of October 2007 SPT has met with TiVo and has had discussions with Echostar, Comcast, and DirecTV
– TiVo is the only business model that currently offers a clear interactive solution to reach consumers who watch time-shifted programming
– Echostar is interested in exploring possibilities around a "cross promotional" on-air campaign using our talent and brands. Comcast has licensed the TiVo Platform and will have similar opportunities as the TiVo model
• Identify opportunities to engage viewers within the growing DVR community to record SPT programs and view them within the Live+3 window
• Strike partnerships with TiVo, MSOs and satellite companies to drive viewership of our content on DVR within the Live+3 window
• Create marketing opportunities for viewers to record full seasons or offer alternative marketing ideas
Challenge
• DVR viewing is eroding traditional network viewership
• Today 21% of TV Households have DVRs and it is estimated that by 2010 that number will rise to 33%
• DVR viewing is now incorporated into Live+3 ratings
Opportunity
Status
18
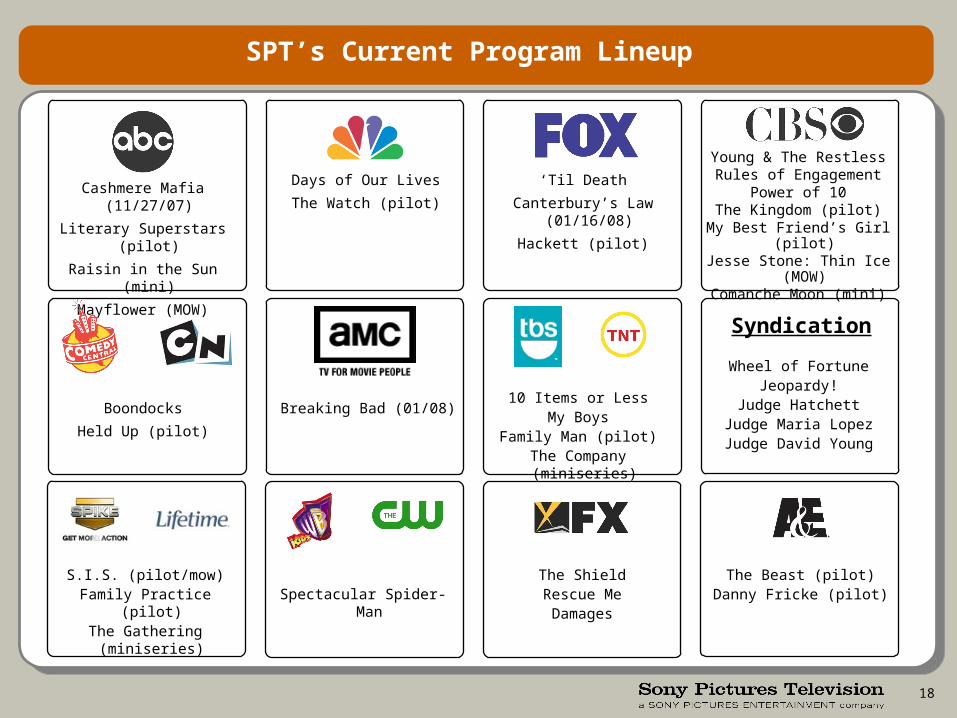
Days of Our Lives
The Watch (pilot)
Young & The RestlessRules of Engagement
Power of 10The Kingdom (pilot)
My Best Friend’s Girl (pilot)Jesse Stone: Thin Ice (MOW)
Comanche Moon (mini)
SPT’s Current Program Lineup
Cashmere Mafia (11/27/07)
Literary Superstars (pilot)
Raisin in the Sun (mini)
Mayflower (MOW)
‘Til Death
Canterbury’s Law (01/16/08)
Hackett (pilot)
Wheel of FortuneJeopardy!
Judge HatchettJudge Maria LopezJudge David Young
10 Items or LessMy Boys
Family Man (pilot)The Company (miniseries)
Breaking Bad (01/08)Boondocks
Held Up (pilot)
The ShieldRescue MeDamages
Spectacular Spider-Man
Syndication
The Beast (pilot)Danny Fricke (pilot)
S.I.S. (pilot/mow)Family Practice (pilot)
The Gathering (miniseries)
19
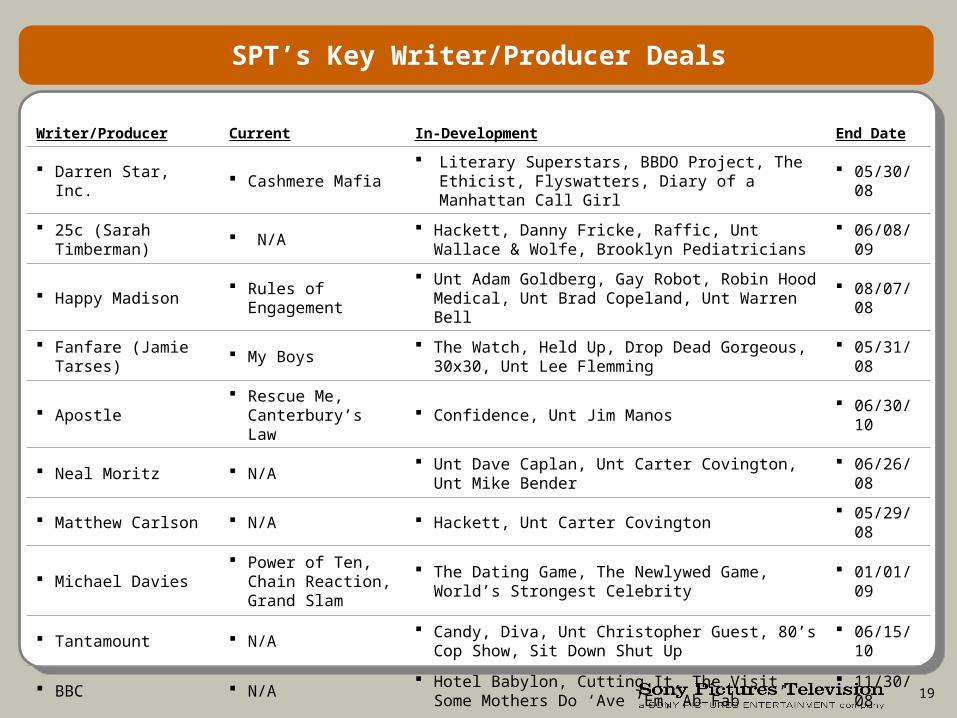
SPT’s Key Writer/Producer Deals
Writer/Producer Current In-Development End Date
Darren Star, Inc. Cashmere Mafia Literary Superstars, BBDO Project, The Ethicist,
Flyswatters, Diary of a Manhattan Call Girl 05/30/08
25c (Sarah Timberman)
N/A Hackett, Danny Fricke, Raffic, Unt Wallace & Wolfe,
Brooklyn Pediatricians 06/08/09
Happy Madison Rules of
Engagement Unt Adam Goldberg, Gay Robot, Robin Hood
Medical, Unt Brad Copeland, Unt Warren Bell 08/07/08
Fanfare (Jamie Tarses)
My Boys The Watch, Held Up, Drop Dead Gorgeous, 30x30,
Unt Lee Flemming 05/31/08
Apostle Rescue Me,
Canterbury’s Law Confidence, Unt Jim Manos 06/30/10
Neal Moritz N/A Unt Dave Caplan, Unt Carter Covington, Unt Mike
Bender 06/26/08
Matthew Carlson N/A Hackett, Unt Carter Covington 05/29/08
Michael Davies Power of Ten, Chain
Reaction, Grand Slam
The Dating Game, The Newlywed Game, World’s Strongest Celebrity
01/01/09
Tantamount N/A Candy, Diva, Unt Christopher Guest, 80’s Cop Show,
Sit Down Shut Up 06/15/10
BBC N/A Hotel Babylon, Cutting It, The Visit, Some Mothers Do
‘Ave ‘Em, Ab Fab 11/30/08
20
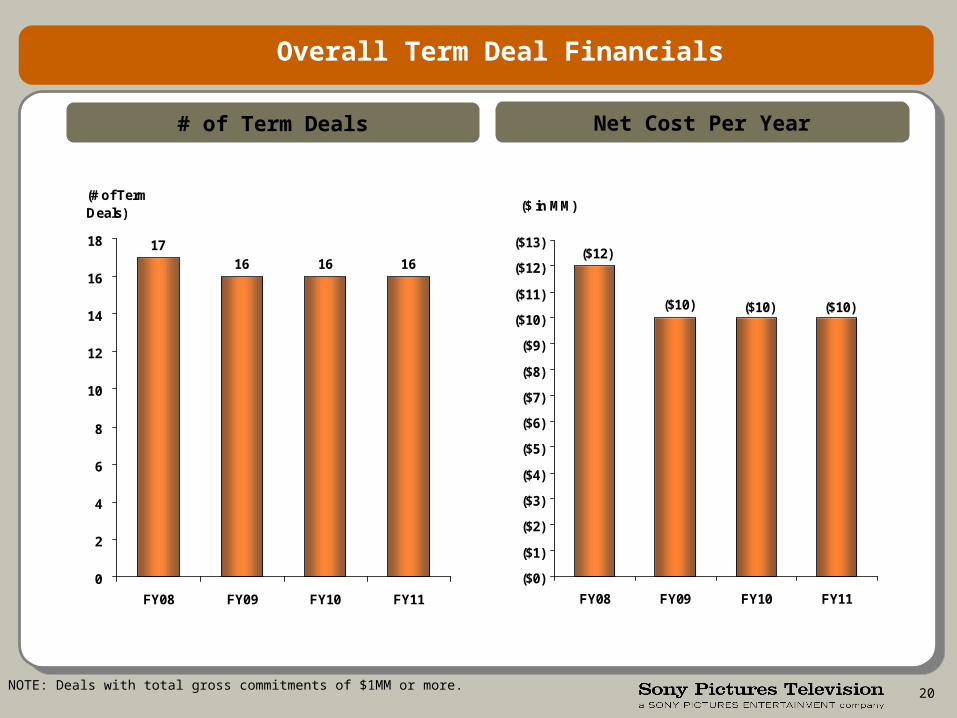
1716 1616
0
2
4
6
8
10
12
14
16
18
FY08 FY09 FY10 FY11
(# of Term Deals)
# of Term Deals
Overall Term Deal Financials
($10)($10)
($12)
($10)
($0)
($1)
($2)
($3)
($4)
($5)
($6)
($7)
($8)
($9)
($10)
($11)
($12)
($13)
FY08 FY09 FY10 FY11
($ in MM)
Net Cost Per Year
NOTE: Deals with total gross commitments of $1MM or more.
21
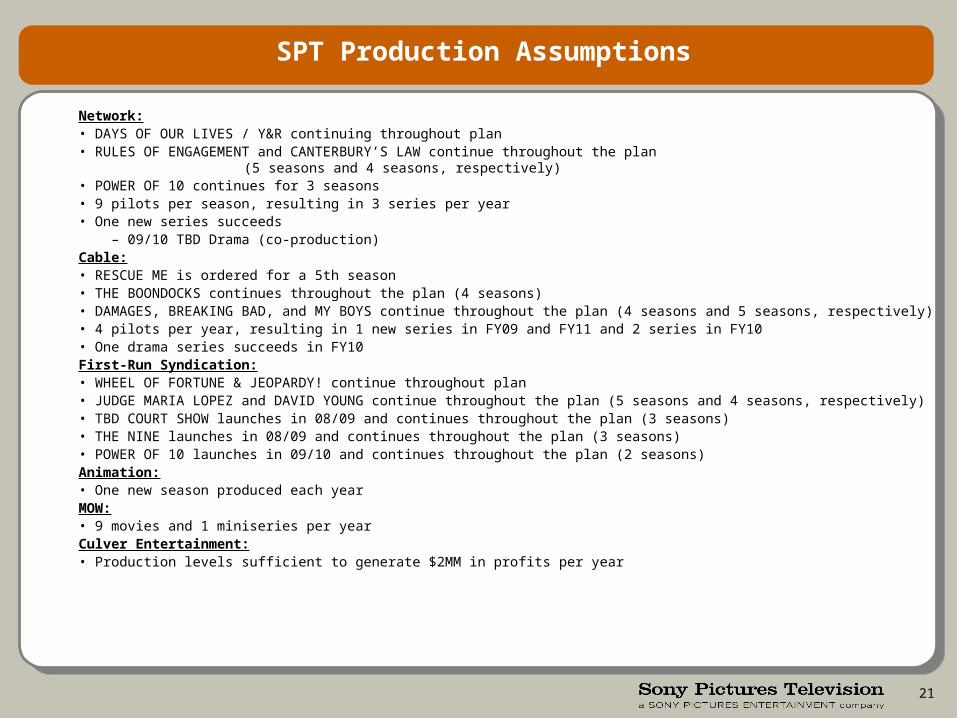
Network:• DAYS OF OUR LIVES / Y&R continuing throughout plan• RULES OF ENGAGEMENT and CANTERBURY’S LAW continue throughout the plan (5 seasons
and 4 seasons, respectively)• POWER OF 10 continues for 3 seasons• 9 pilots per season, resulting in 3 series per year• One new series succeeds – 09/10 TBD Drama (co-production)Cable:• RESCUE ME is ordered for a 5th season• THE BOONDOCKS continues throughout the plan (4 seasons)• DAMAGES, BREAKING BAD, and MY BOYS continue throughout the plan (4 seasons and 5 seasons, respectively)• 4 pilots per year, resulting in 1 new series in FY09 and FY11 and 2 series in FY10• One drama series succeeds in FY10First-Run Syndication:• WHEEL OF FORTUNE & JEOPARDY! continue throughout plan• JUDGE MARIA LOPEZ and DAVID YOUNG continue throughout the plan (5 seasons and 4 seasons, respectively)• TBD COURT SHOW launches in 08/09 and continues throughout the plan (3 seasons)• THE NINE launches in 08/09 and continues throughout the plan (3 seasons)• POWER OF 10 launches in 09/10 and continues throughout the plan (2 seasons)Animation:• One new season produced each yearMOW:• 9 movies and 1 miniseries per yearCulver Entertainment:• Production levels sufficient to generate $2MM in profits per year
SPT Production Assumptions
22
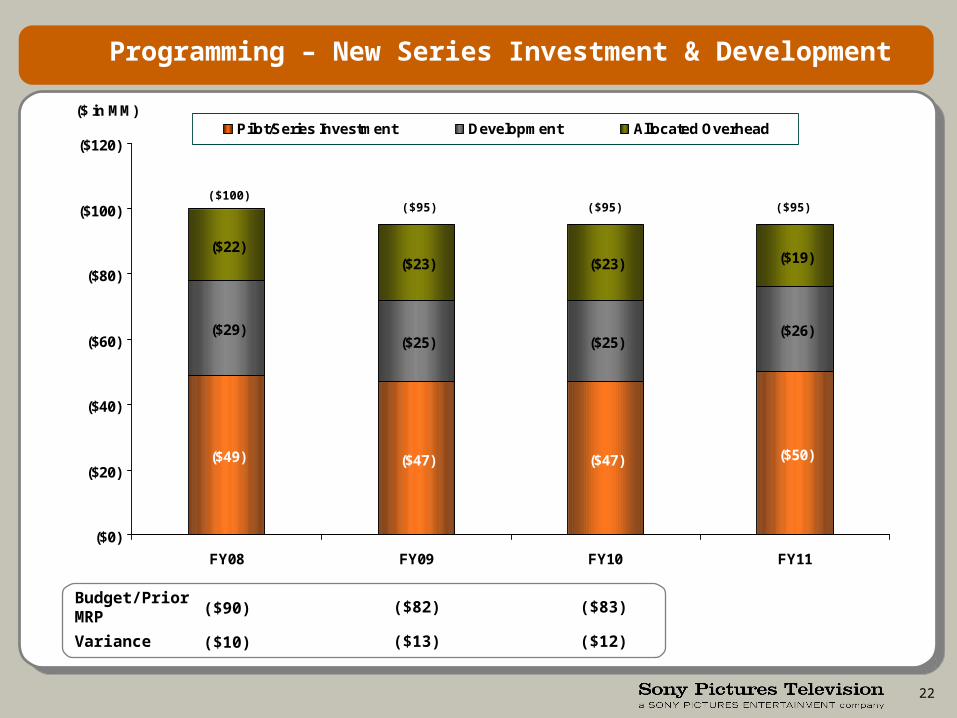
Programming – New Series Investment & Development
($49) ($47) ($47) ($50)
($29)($25) ($25)
($26)
($22)($23) ($23) ($19)
($0)
($20)
($40)
($60)
($80)
($100)
($120)
FY08 FY09 FY10 FY11
($ in MM)
Pilot/Series Investment Development Allocated Overhead
($95)($95) ($95)($100)
Budget/Prior MRP ($90)
Variance ($10)
($82)
($13)
($83)
($12)

AD-SUPPORTED DIGITAL NETWORKS
24
Strategy Overview
• Focus Crackle on high quality short-form content to differentiate the service and drive monetization of the site
– Addresses advertisers’ need for quality and control and users’ desire for higher quality content
– Shifts competition away from the entry-level “UGV” segment where YouTube is a clear leader
• Launch new digital networks to create valuable channel brands and retain value currently captured by our distribution partners
– Launched Minisodes, Funny Bone, AXN
– Launching Screening Room this fiscal year
• Share resources across our networks, increase programming to build scale– Create programs that build depth within our existing networks
– Share programming, technology, advertisers, and distribution partners across networks
• Evaluate strategic alternatives to increase scale in light of increasing competition from traditional network brands
– Considering the creation of a single “umbrella” brand across our networks
– Evaluating acquisition and partnership opportunities
25
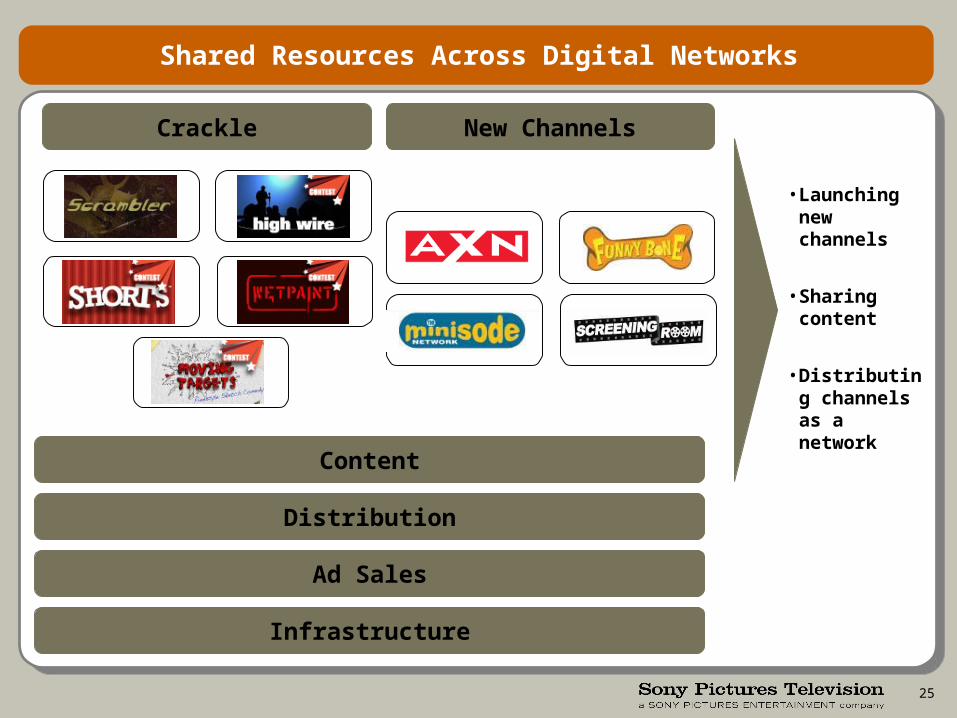
Content
Shared Resources Across Digital Networks
Distribution
Ad Sales
Infrastructure
New ChannelsCrackle
• Launching new channels
• Sharing content
• Distributing channels as a network
scrambler highwire
wet paintshorts
moving target
26
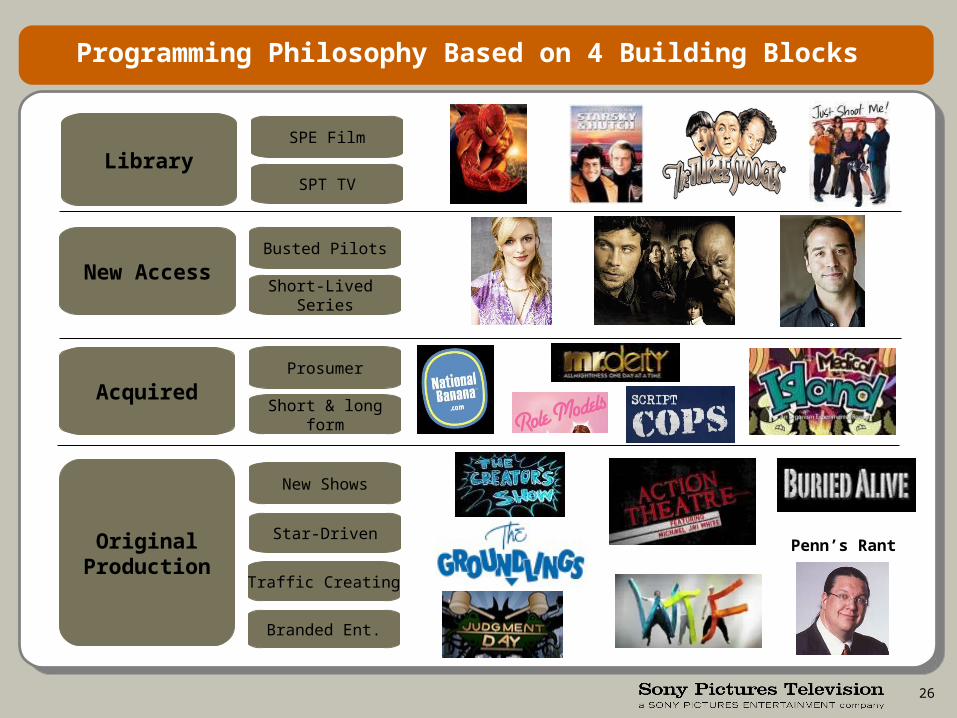
Programming Philosophy Based on 4 Building Blocks
Acquired
Original Production
Library
New Shows
Star-Driven
Branded Ent.
Traffic Creating
New Access
SPE Film
SPT TV
Prosumer
Short & longform
Penn’s Rant
Busted Pilots
Short-Lived Series
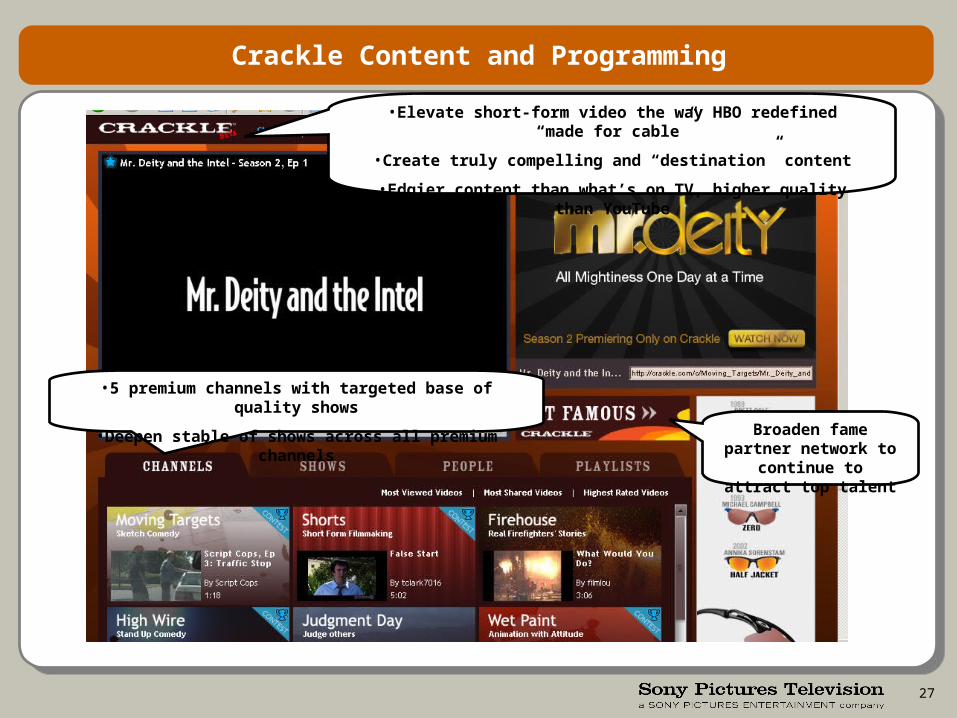
27
Crackle Content and Programming
Broaden fame partner network to continue to
attract top talent
•5 premium channels with targeted base of quality shows
•Deepen stable of shows across all premium channels
•Elevate short-form video the way HBO redefined “made for cable”
•Create truly compelling and “destination” content
•Edgier content than what’s on TV, higher quality than YouTube
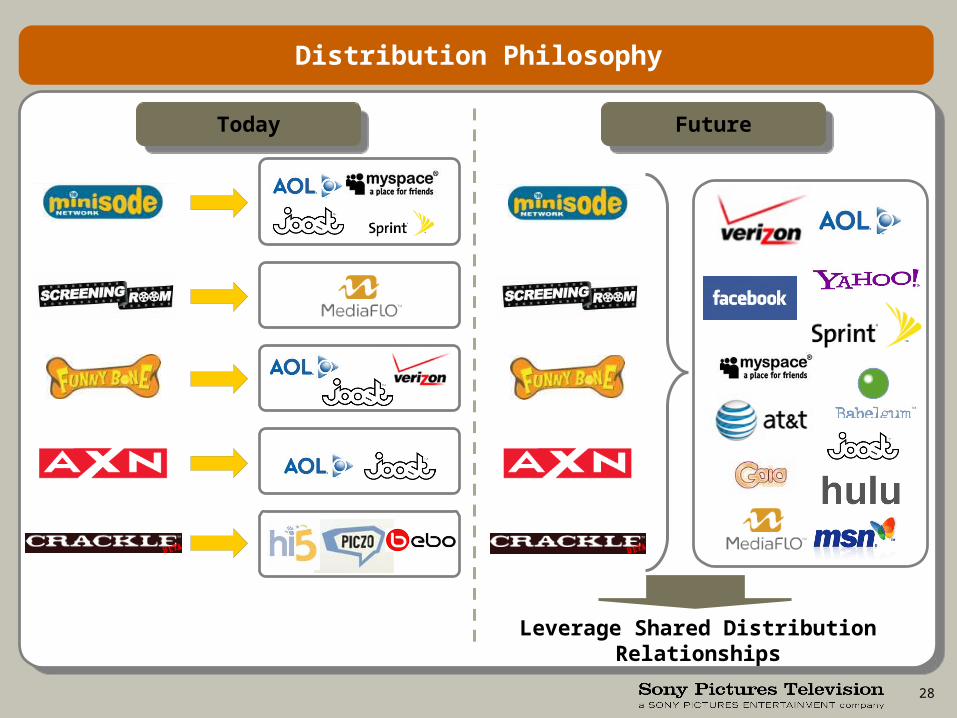
28
Distribution Philosophy
Today
Leverage Shared Distribution Relationships
Future
29
Revenue Plan for Digital Networks
• As online video advertising grows, SPTAS has demonstrated early traction but significant growth is still needed
– Crackle relaunch attracting top advertisers who seek quality content and a controlled environment
• Integrated with 4 international rep partners covering a large % of monetizable inventory
• Secured 4 Blue-chip advertisers: Pepsi, Honda, Sony and Epson
• $1MM in booked Crackle revenues; additional $750K in the pipeline
• SPTAS must address the challenges of a young, evolving digital advertising market to drive further revenue growth
– Integrate our new networks and leveraging our content to deliver larger-scale audience and experience to advertisers
– Focus on sponsorships; continue to modify ad units and targeting tools to meet advertiser needs
– Drive additional revenue through international rep firms
30
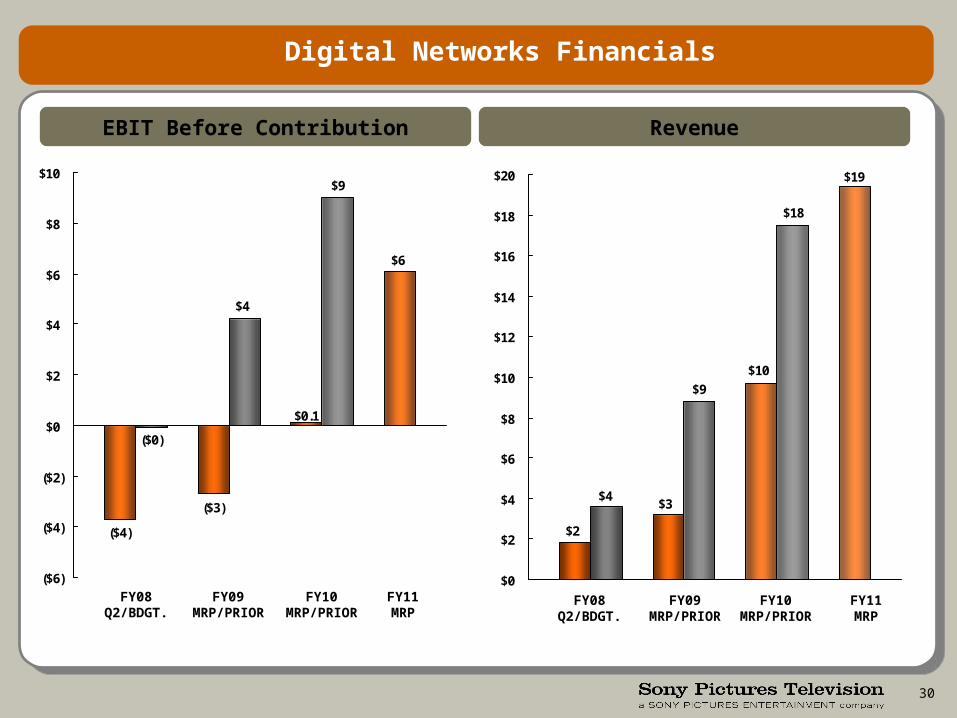
Digital Networks Financials
EBIT Before Contribution Revenue
FY08Q2/BDGT.
FY09MRP/PRIOR
FY10MRP/PRIOR
FY11MRP
FY08Q2/BDGT.
FY09MRP/PRIOR
FY10MRP/PRIOR
FY11MRP
$6
($3)
($4)
$0.1
$9
($0)
$4
($6)
($4)
($2)
$0
$2
$4
$6
$8
$10 $19
$10
$3
$2
$18
$4
$9
$0
$2
$4
$6
$8
$10
$12
$14
$16
$18
$20

31
Crackle Financial Summary
EBIT Revenue
FY08Q2/BDGT.
FY09MRP/PRIOR
FY10MRP/PRIOR
FY11MRP
($ in MM)
FY08Q2/BDGT.
FY09MRP/PRIOR
FY10MRP/PRIOR
FY11MRP
($ in MM)
$10
($10)
($18)
$0
$28
($18)
$10
($20)
($15)
($10)
($5)
$0
$5
$10
$15
$20
$25
$30
$50
$31
$15
$4
$84
$11
$52
$0
$10
$20
$30
$40
$50
$60
$70
$80
$90

STRATEGIC INVESTMENTS
33
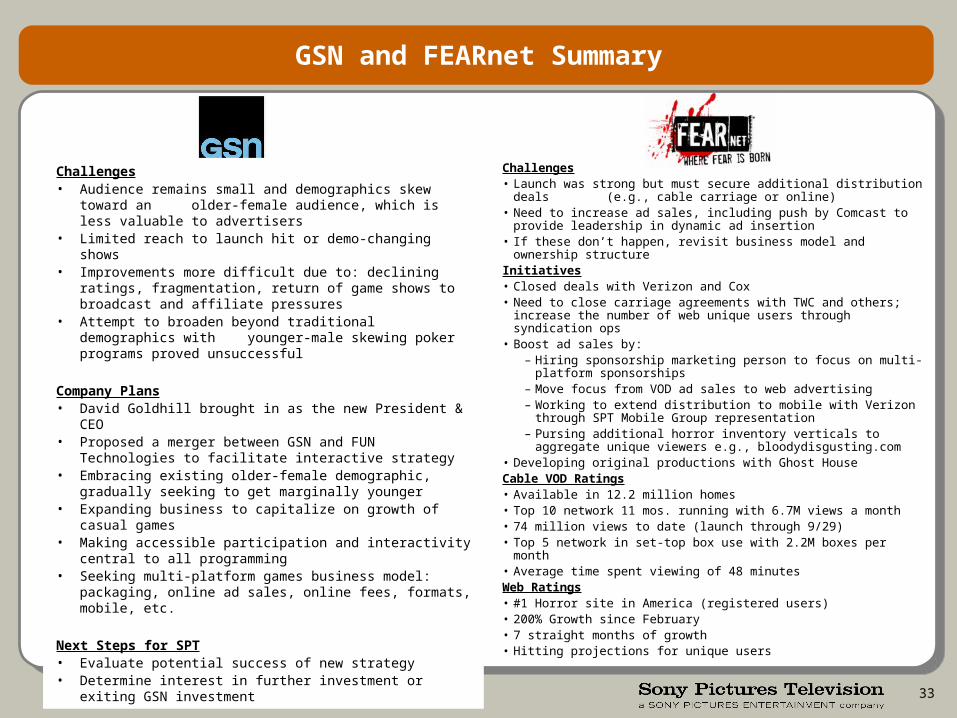
GSN and FEARnet Summary
Challenges• Launch was strong but must secure additional distribution deals
(e.g., cable carriage or online) • Need to increase ad sales, including push by Comcast to provide
leadership in dynamic ad insertion• If these don’t happen, revisit business model and ownership structureInitiatives• Closed deals with Verizon and Cox• Need to close carriage agreements with TWC and others; increase the
number of web unique users through syndication ops• Boost ad sales by:
– Hiring sponsorship marketing person to focus on multi-platform sponsorships
– Move focus from VOD ad sales to web advertising– Working to extend distribution to mobile with Verizon through SPT
Mobile Group representation– Pursing additional horror inventory verticals to aggregate unique
viewers e.g., bloodydisgusting.com• Developing original productions with Ghost HouseCable VOD Ratings• Available in 12.2 million homes• Top 10 network 11 mos. running with 6.7M views a month• 74 million views to date (launch through 9/29)• Top 5 network in set-top box use with 2.2M boxes per month • Average time spent viewing of 48 minutesWeb Ratings• #1 Horror site in America (registered users)• 200% Growth since February• 7 straight months of growth • Hitting projections for unique users
Challenges• Audience remains small and demographics skew toward an
older-female audience, which is less valuable to advertisers• Limited reach to launch hit or demo-changing shows• Improvements more difficult due to: declining ratings, fragmentation,
return of game shows to broadcast and affiliate pressures• Attempt to broaden beyond traditional demographics with
younger-male skewing poker programs proved unsuccessful
Company Plans• David Goldhill brought in as the new President & CEO• Proposed a merger between GSN and FUN Technologies to
facilitate interactive strategy• Embracing existing older-female demographic, gradually seeking to
get marginally younger• Expanding business to capitalize on growth of casual games • Making accessible participation and interactivity central to all
programming• Seeking multi-platform games business model: packaging, online
ad sales, online fees, formats, mobile, etc.
Next Steps for SPT• Evaluate potential success of new strategy• Determine interest in further investment or exiting GSN investment
34
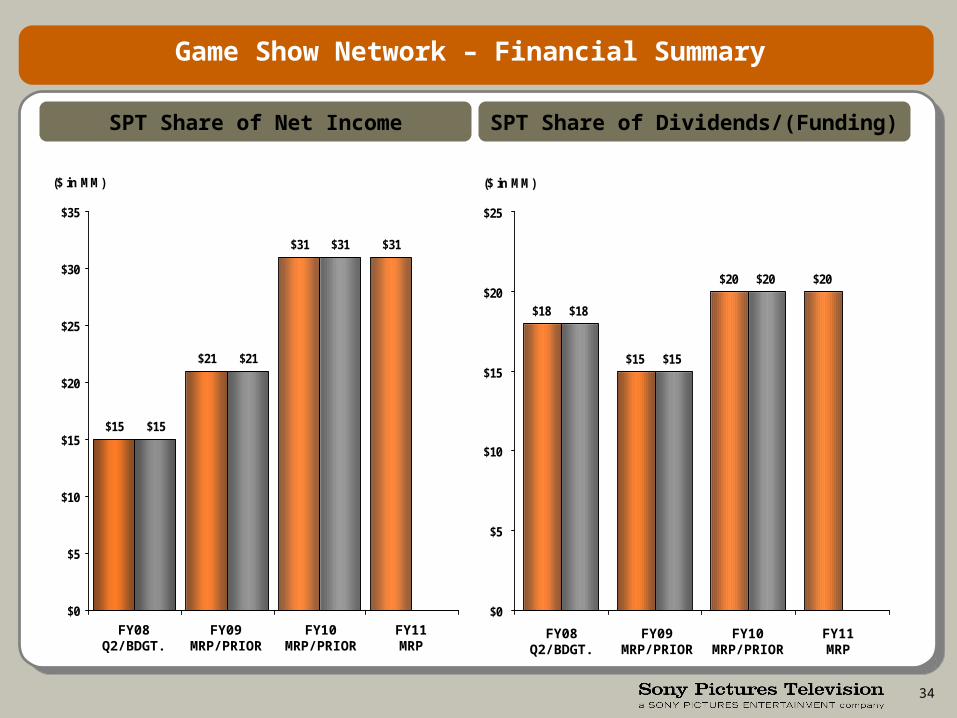
Game Show Network – Financial Summary
SPT Share of Net Income SPT Share of Dividends/(Funding)
$21$21
$15
$31 $31$31
$15
$0
$5
$10
$15
$20
$25
$30
$35
($ in MM)
$15
$20
$15
$18
$20 $20
$18
$0
$5
$10
$15
$20
$25
($ in MM)
FY08Q2/BDGT.
FY09MRP/PRIOR
FY10MRP/PRIOR
FY11MRP
FY08Q2/BDGT.
FY09MRP/PRIOR
FY10MRP/PRIOR
FY11MRP
35
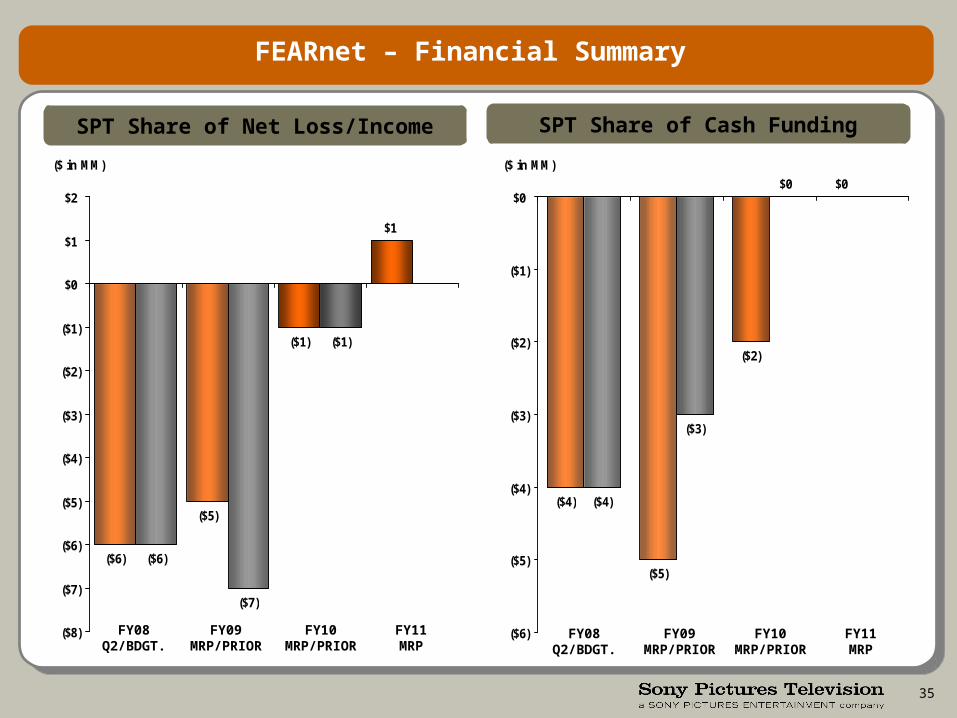
SPT Share of Net Loss/Income SPT Share of Cash Funding
FEARnet – Financial Summary
($6)
($5)
($1)
$1
($7)
($1)
($6)
($8)
($7)
($6)
($5)
($4)
($3)
($2)
($1)
$0
$1
$2
($ in MM)
($4)
($5)
($2)
$0
($3)
$0
($4)
($6)
($5)
($4)
($3)
($2)
($1)
$0
($ in MM)
FY08Q2/BDGT.
FY09MRP/PRIOR
FY10MRP/PRIOR
FY11MRP
FY08Q2/BDGT.
FY09MRP/PRIOR
FY10MRP/PRIOR
FY11MRP

DISTRIBUTION AND LICENSING
37
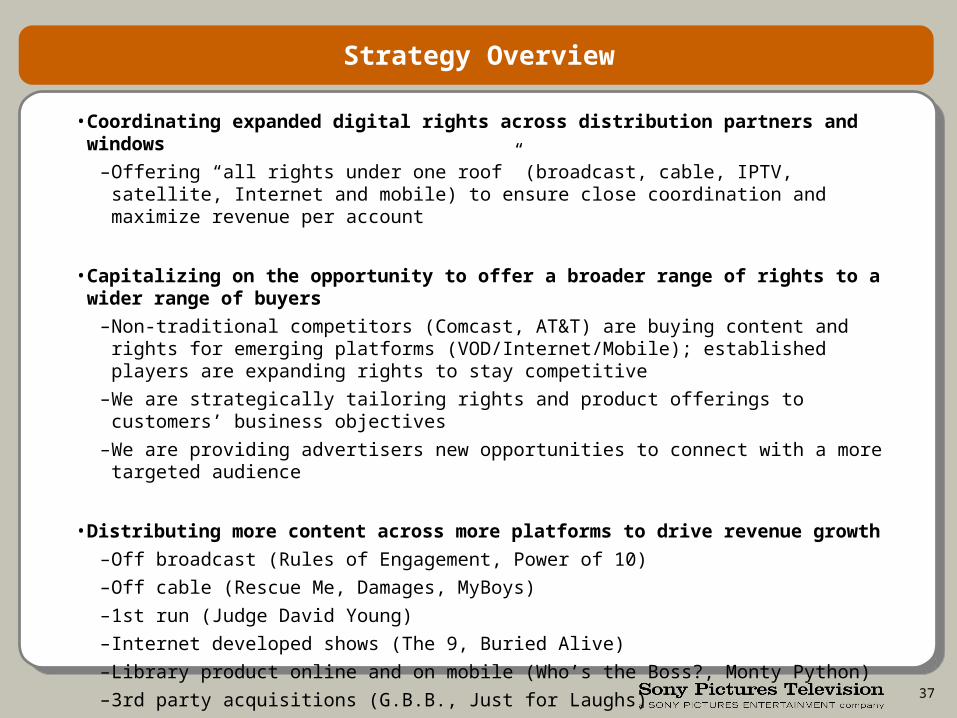
Strategy Overview
• Coordinating expanded digital rights across distribution partners and windows
–Offering “all rights under one roof” (broadcast, cable, IPTV, satellite, Internet and mobile) to ensure close coordination and maximize revenue per account
• Capitalizing on the opportunity to offer a broader range of rights to a wider range of buyers
–Non-traditional competitors (Comcast, AT&T) are buying content and rights for emerging platforms (VOD/Internet/Mobile); established players are expanding rights to stay competitive
–We are strategically tailoring rights and product offerings to customers’ business objectives
–We are providing advertisers new opportunities to connect with a more targeted audience
• Distributing more content across more platforms to drive revenue growth
–Off broadcast (Rules of Engagement, Power of 10)
–Off cable (Rescue Me, Damages, MyBoys)
–1st run (Judge David Young)
–Internet developed shows (The 9, Buried Alive)
–Library product online and on mobile (Who’s the Boss?, Monty Python)
–3rd party acquisitions (G.B.B., Just for Laughs)
–New library strategies (Minisodes network)
–Work with feature acquisitions to monetize product
38
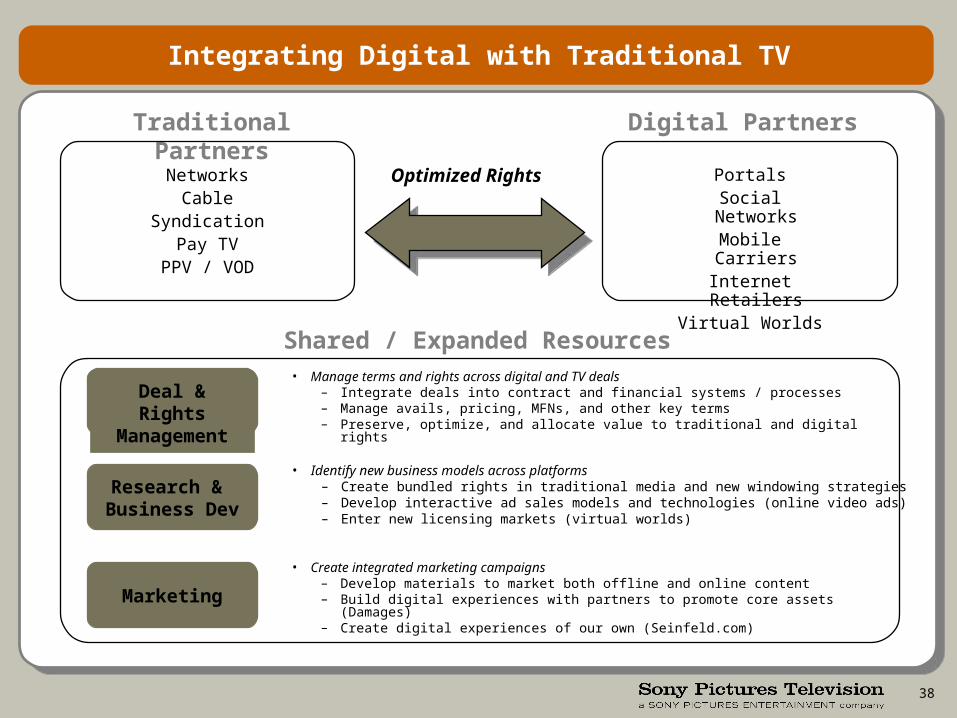
Integrating Digital with Traditional TV
Shared / Expanded Resources
Traditional Partners
Digital Partners
NetworksCable
SyndicationPay TV
PPV / VOD
Optimized Rights
• Manage terms and rights across digital and TV deals– Integrate deals into contract and financial systems / processes– Manage avails, pricing, MFNs, and other key terms– Preserve, optimize, and allocate value to traditional and digital rights
Deal & Rights
Management
Research & Business Dev
Marketing
• Identify new business models across platforms– Create bundled rights in traditional media and new windowing strategies– Develop interactive ad sales models and technologies (online video ads)– Enter new licensing markets (virtual worlds)
• Create integrated marketing campaigns– Develop materials to market both offline and online content– Build digital experiences with partners to promote core assets (Damages)– Create digital experiences of our own (Seinfeld.com)
PortalsSocial NetworksMobile Carriers
Internet RetailersVirtual Worlds
39
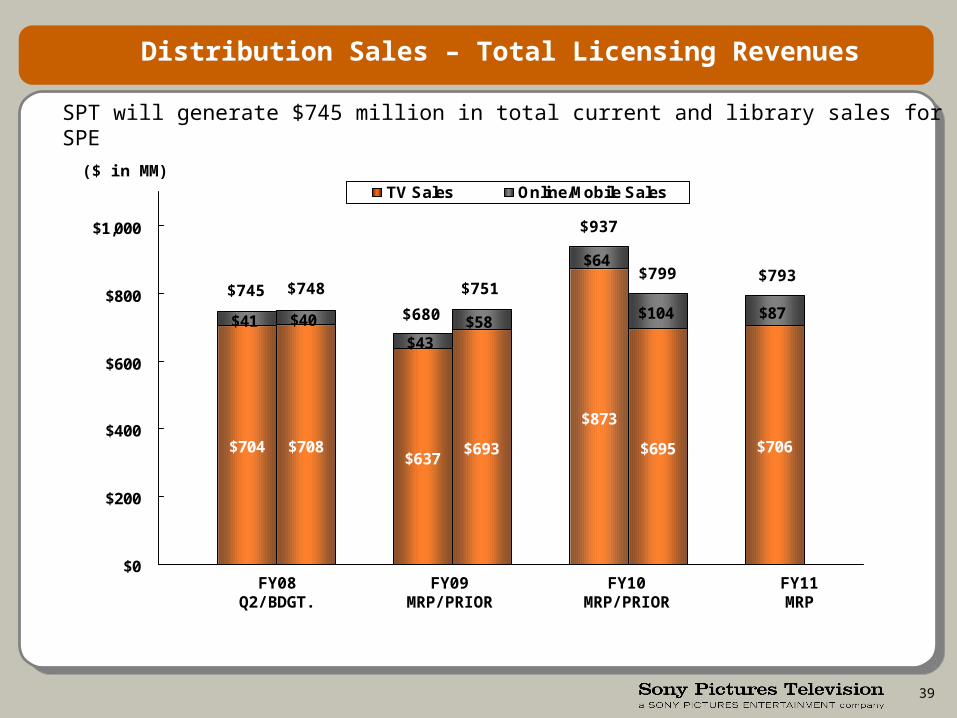
Distribution Sales – Total Licensing Revenues
SPT will generate $745 million in total current and library sales for SPE
$704 $708$637
$693
$873
$695 $706
$41 $40
$43$58
$64
$104 $87
$0
$200
$400
$600
$800
$1,000
TV Sales Online/Mobile Sales($ in MM)
FY08Q2/BDGT.
FY09MRP/PRIOR
FY10MRP/PRIOR
FY11MRP
$745 $748
$680
$751
$937
$799 $793
40
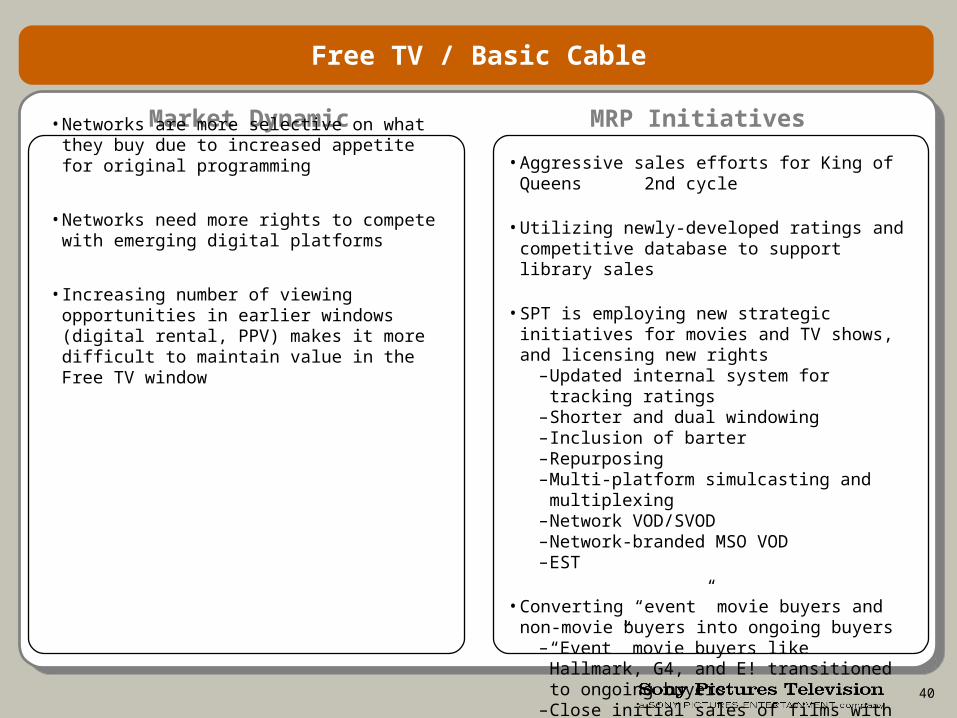
Free TV / Basic Cable
Market Dynamic MRP Initiatives
• Networks are more selective on what they buy due to increased appetite for original programming
• Networks need more rights to compete with emerging digital platforms
• Increasing number of viewing opportunities in earlier windows (digital rental, PPV) makes it more difficult to maintain value in the Free TV window
• Aggressive sales efforts for King of Queens 2nd cycle
• Utilizing newly-developed ratings and competitive database to support library sales
• SPT is employing new strategic initiatives for movies and TV shows, and licensing new rights
–Updated internal system for tracking ratings–Shorter and dual windowing–Inclusion of barter–Repurposing–Multi-platform simulcasting and multiplexing–Network VOD/SVOD–Network-branded MSO VOD–EST
• Converting “event” movie buyers and non-movie buyers into ongoing buyers
–“Event” movie buyers like Hallmark, G4, and E! transitioned to ongoing buyers
–Close initial sales of films with current non-movie buyers like TV Land, Nick @ Nite, and Soapnet
41
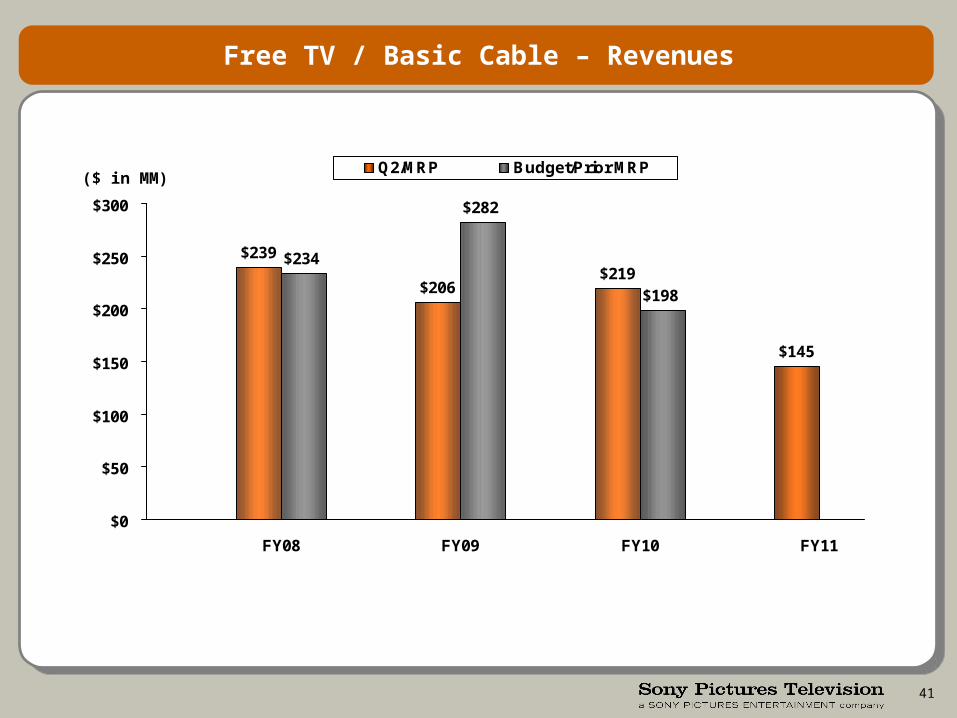
Free TV / Basic Cable – Revenues
$239
$206$219
$145
$234
$282
$198
$0
$50
$100
$150
$200
$250
$300
FY08 FY09 FY10 FY11
Q2/MRP Budget/Prior MRP($ in MM)
42
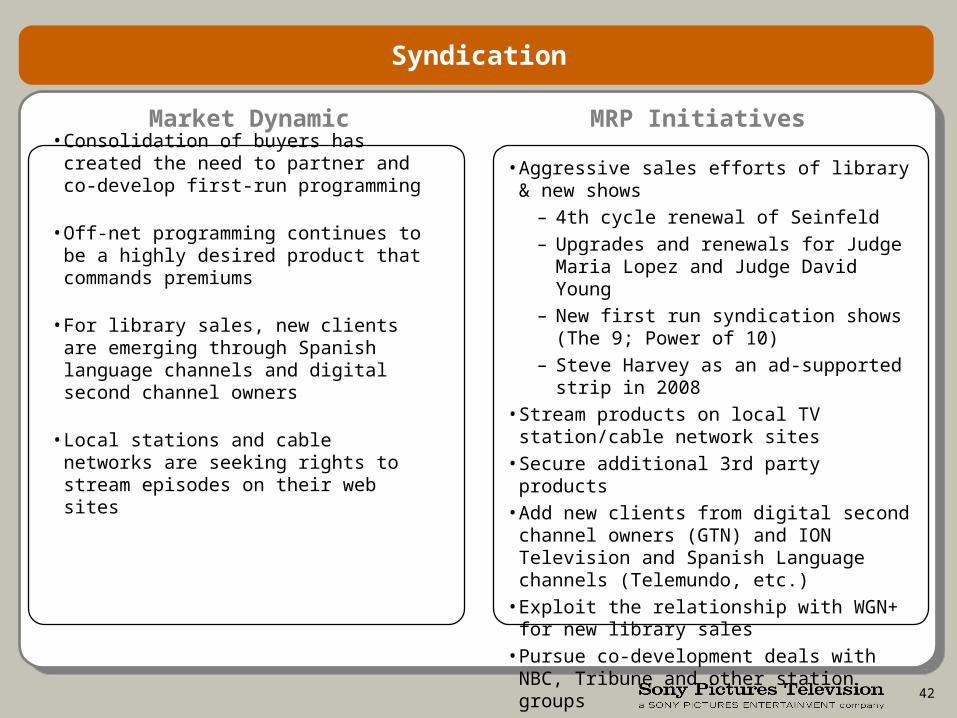
Syndication
Market Dynamic MRP Initiatives
• Consolidation of buyers has created the need to partner and co-develop first-run programming
• Off-net programming continues to be a highly desired product that commands premiums
• For library sales, new clients are emerging through Spanish language channels and digital second channel owners
• Local stations and cable networks are seeking rights to stream episodes on their web sites
• Aggressive sales efforts of library & new shows– 4th cycle renewal of Seinfeld– Upgrades and renewals for Judge Maria
Lopez and Judge David Young– New first run syndication shows (The 9;
Power of 10)– Steve Harvey as an ad-supported strip in
2008• Stream products on local TV station/cable
network sites• Secure additional 3rd party products• Add new clients from digital second channel
owners (GTN) and ION Television and Spanish Language channels (Telemundo, etc.)
• Exploit the relationship with WGN+ for new library sales
• Pursue co-development deals with NBC, Tribune and other station groups
43
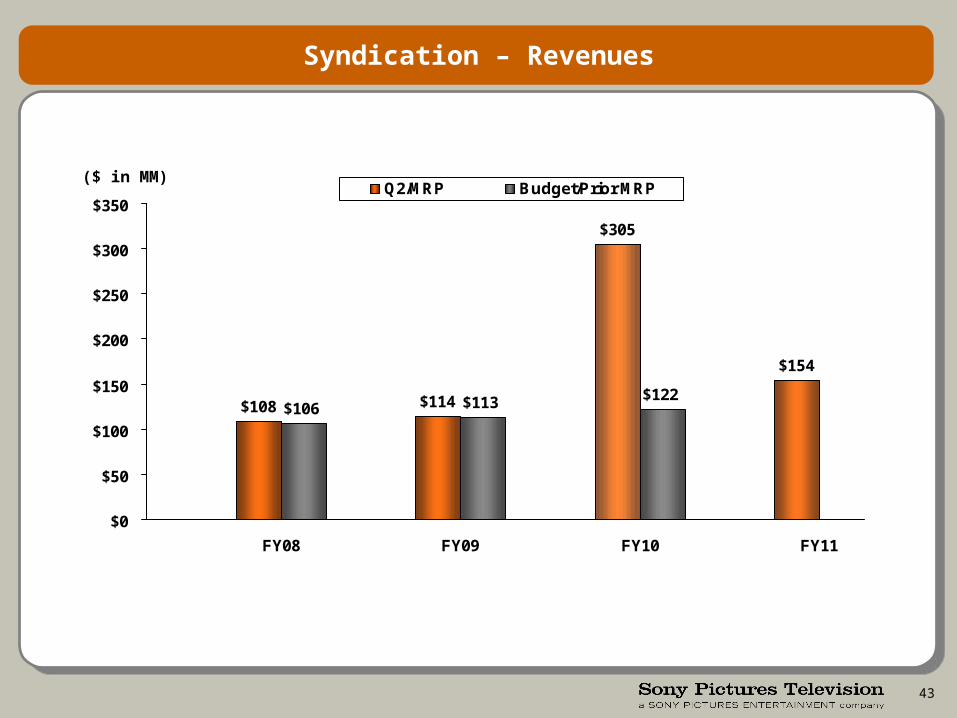
Syndication – Revenues
$108 $114
$305
$154
$106 $113 $122
$0
$50
$100
$150
$200
$250
$300
$350
FY08 FY09 FY10 FY11
Q2/MRP Budget/Prior MRP($ in MM)
44
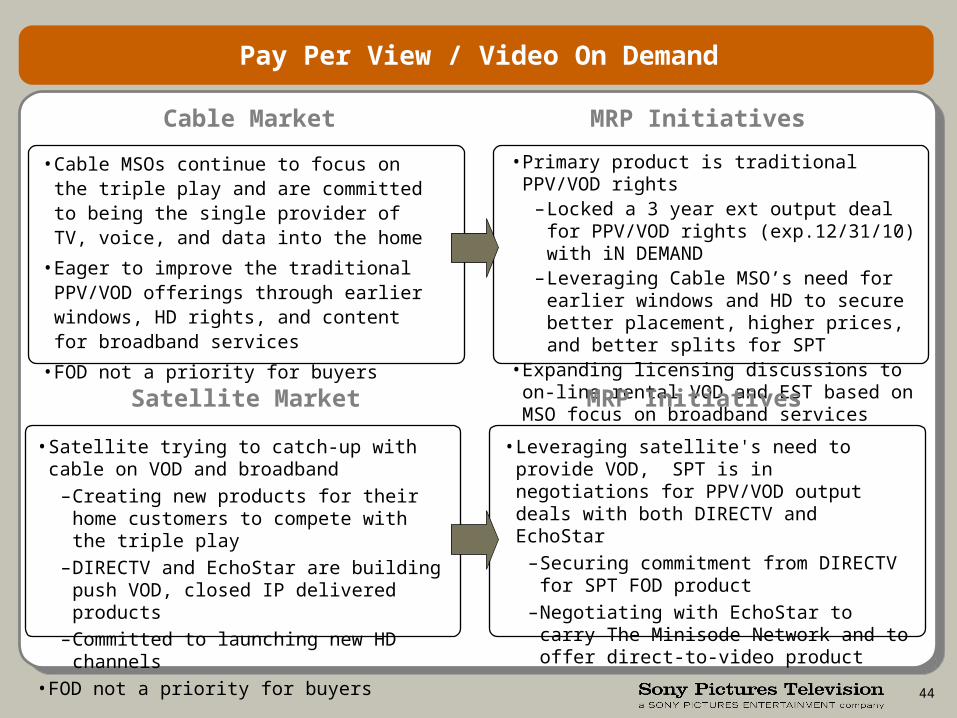
• Satellite trying to catch-up with cable on VOD and broadband
–Creating new products for their home customers to compete with the triple play
–DIRECTV and EchoStar are building push VOD, closed IP delivered products
–Committed to launching new HD channels• FOD not a priority for buyers
• Primary product is traditional PPV/VOD rights–Locked a 3 year ext output deal for PPV/VOD
rights (exp.12/31/10) with iN DEMAND–Leveraging Cable MSO’s need for earlier
windows and HD to secure better placement, higher prices, and better splits for SPT
• Expanding licensing discussions to on-line rental VOD and EST based on MSO focus on broadband services
Pay Per View / Video On Demand
Cable Market MRP Initiatives
Satellite Market MRP Initiatives
• Cable MSOs continue to focus on the triple play and are committed to being the single provider of TV, voice, and data into the home
• Eager to improve the traditional PPV/VOD offerings through earlier windows, HD rights, and content for broadband services
• FOD not a priority for buyers
• Leveraging satellite's need to provide VOD, SPT is in negotiations for PPV/VOD output deals with both DIRECTV and EchoStar
–Securing commitment from DIRECTV for SPT FOD product
–Negotiating with EchoStar to carry The Minisode Network and to offer direct-to-video product
45
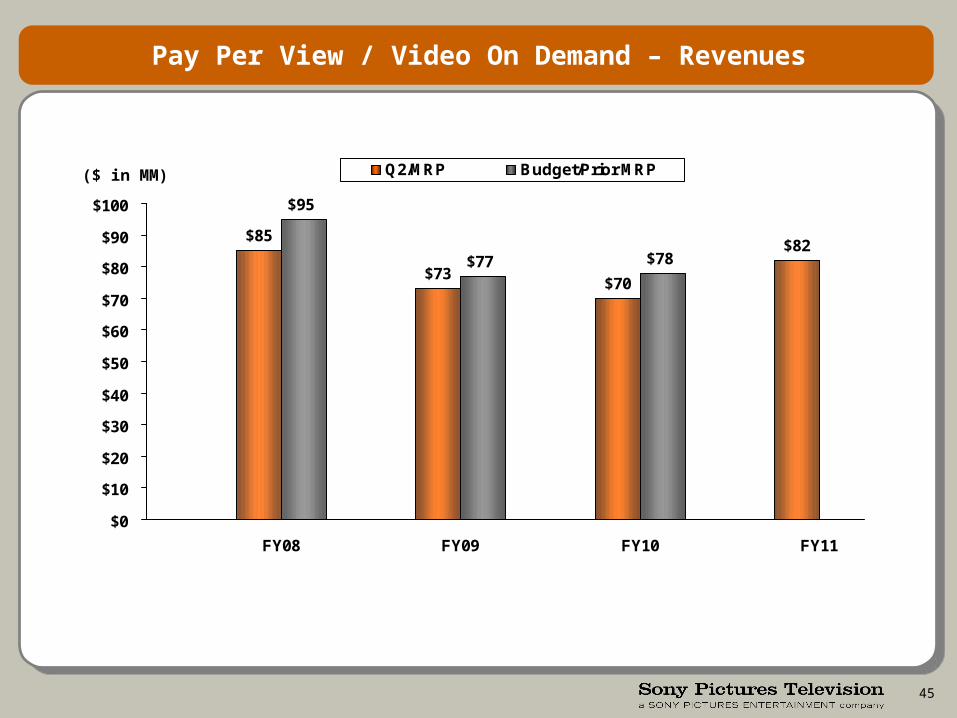
Pay Per View / Video On Demand – Revenues
$85
$73$70
$82
$95
$77 $78
$0
$10
$20
$30
$40
$50
$60
$70
$80
$90
$100
FY08 FY09 FY10 FY11
Q2/MRP Budget/Prior MRP($ in MM)
46
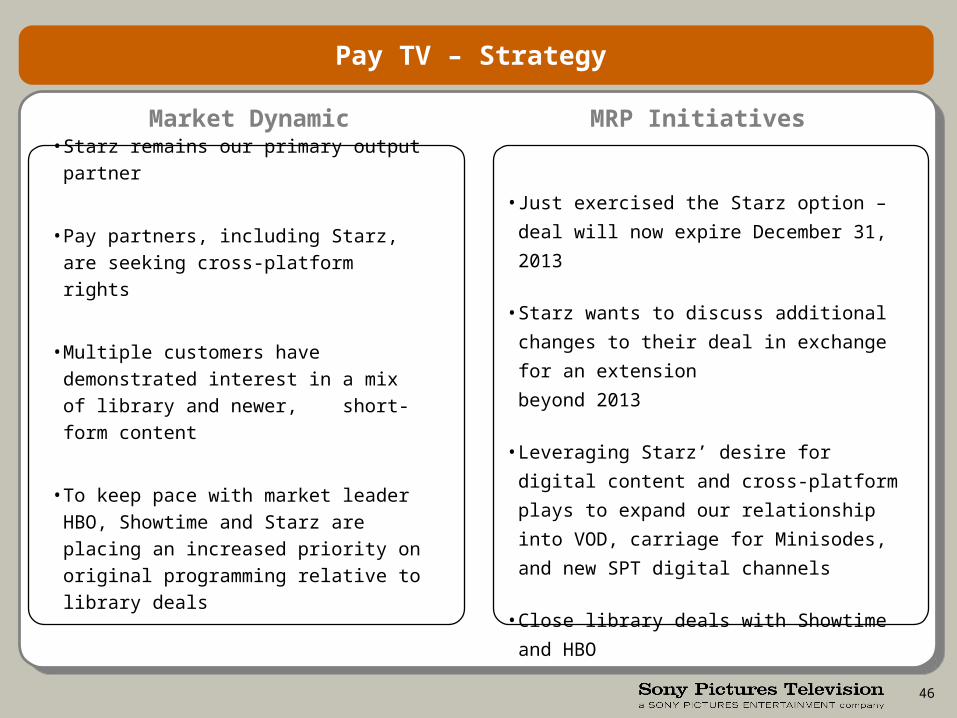
Pay TV – Strategy
Market Dynamic MRP Initiatives
• Starz remains our primary output partner
• Pay partners, including Starz, are seeking
cross-platform rights
• Multiple customers have demonstrated
interest in a mix of library and newer,
short-form content
• To keep pace with market leader HBO,
Showtime and Starz are placing an
increased priority on original programming
relative to library deals
• Just exercised the Starz option – deal will now
expire December 31, 2013
• Starz wants to discuss additional changes to
their deal in exchange for an extension
beyond 2013
• Leveraging Starz’ desire for digital content and
cross-platform plays to expand our relationship
into VOD, carriage for Minisodes, and new SPT
digital channels
• Close library deals with Showtime and HBO
47
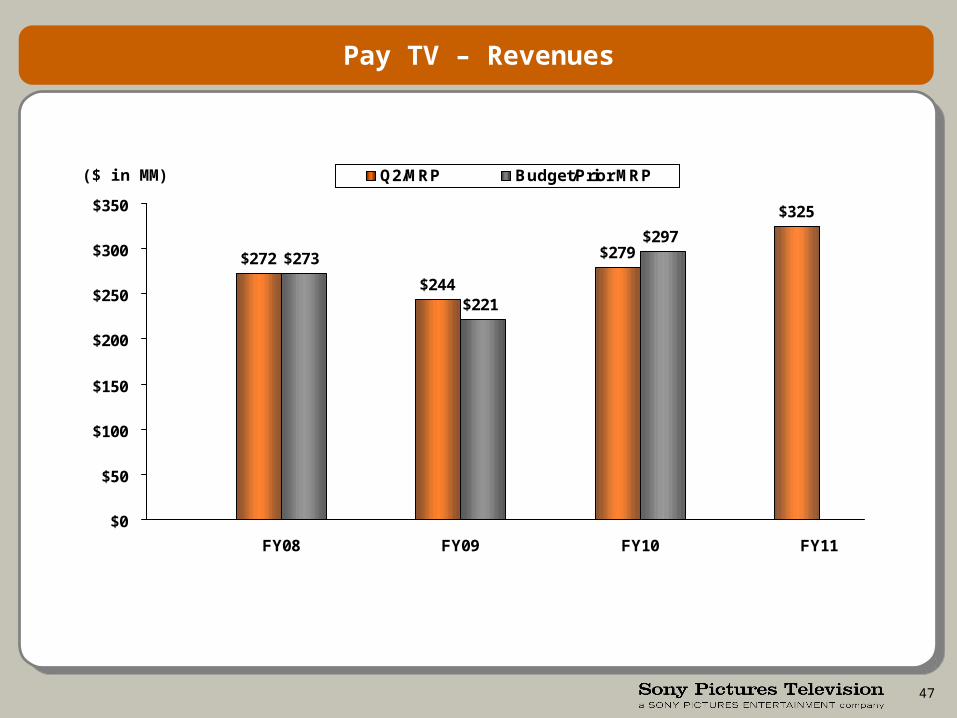
Pay TV – Revenues
$272
$244
$279
$325
$273
$221
$297
$0
$50
$100
$150
$200
$250
$300
$350
FY08 FY09 FY10 FY11
Q2/MRP Budget/Prior MRP($ in MM)
48
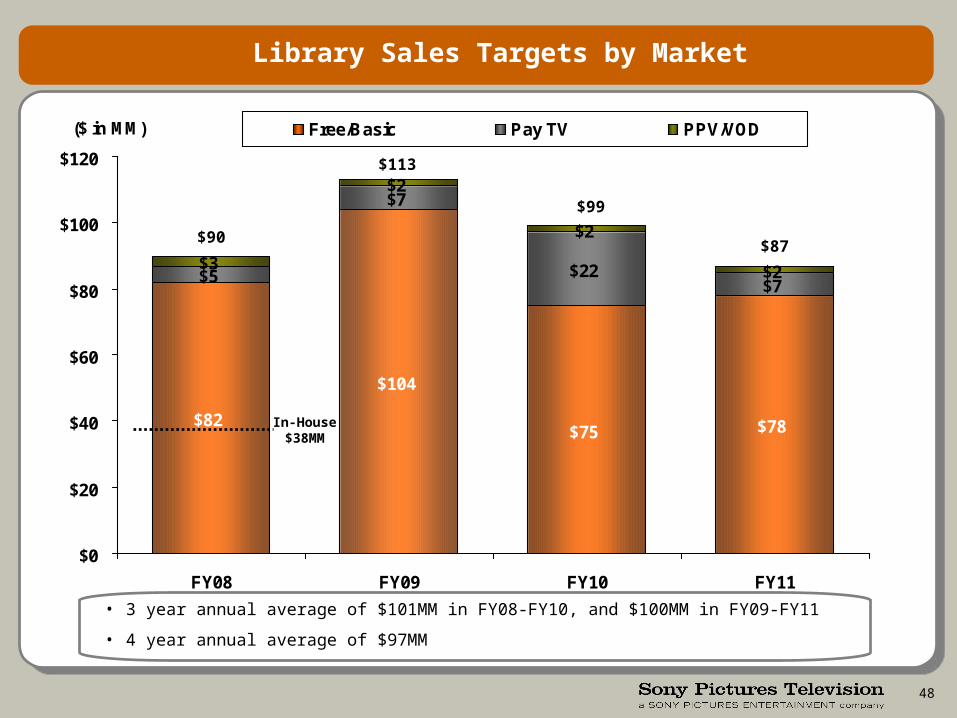
Library Sales Targets by Market
• 3 year annual average of $101MM in FY08-FY10, and $100MM in FY09-FY11
• 4 year annual average of $97MM
$82
$104
$75 $78
$5
$7
$22$7
$3
$2
$2
$2
$0
$20
$40
$60
$80
$100
$120
FY08 FY09 FY10 FY11
($ in MM) Free/Basic Pay TV PPV/VOD
$90
In-House $38MM
$113
$99
$87
49
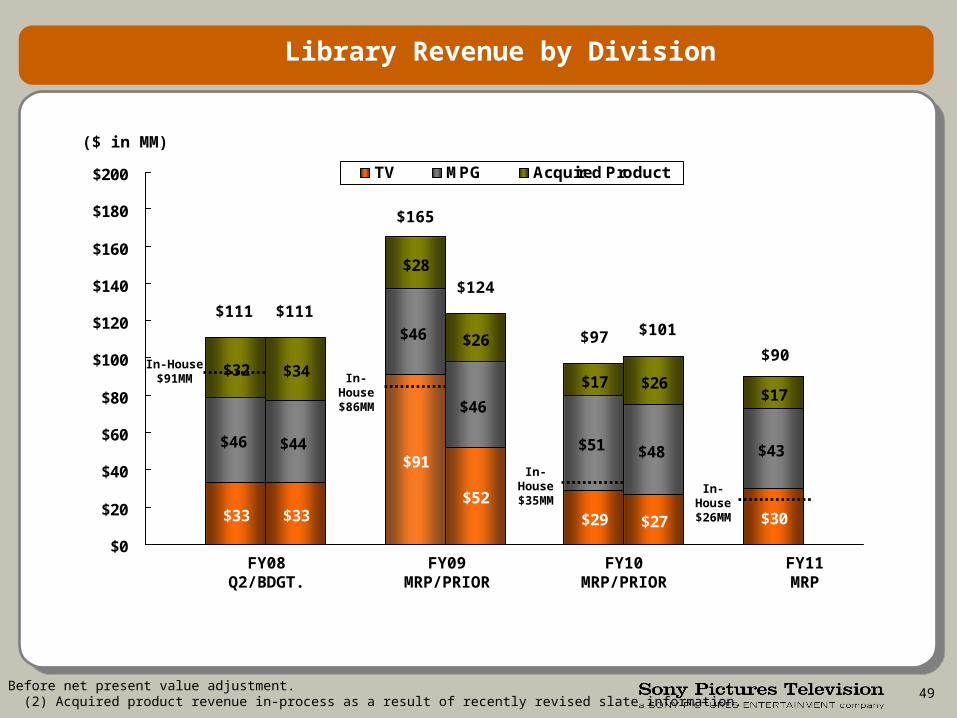
$33 $33
$91
$52$29 $27 $30
$46 $44
$46
$46
$51 $48 $43
$32 $34
$28
$26
$17 $26$17
$0
$20
$40
$60
$80
$100
$120
$140
$160
$180
$200 TV MPG Acquired Product
Library Revenue by Division
In-House $91MM In-House
$86MM
In-House $35MM In-House
$26MM
NOTE: (1) Before net present value adjustment. (2) Acquired product revenue in-process as a result of recently revised slate information.
($ in MM)
FY08Q2/BDGT.
FY09MRP/PRIOR
FY10MRP/PRIOR
FY11MRP
$111 $111
$165
$124
$97 $101
$90
50
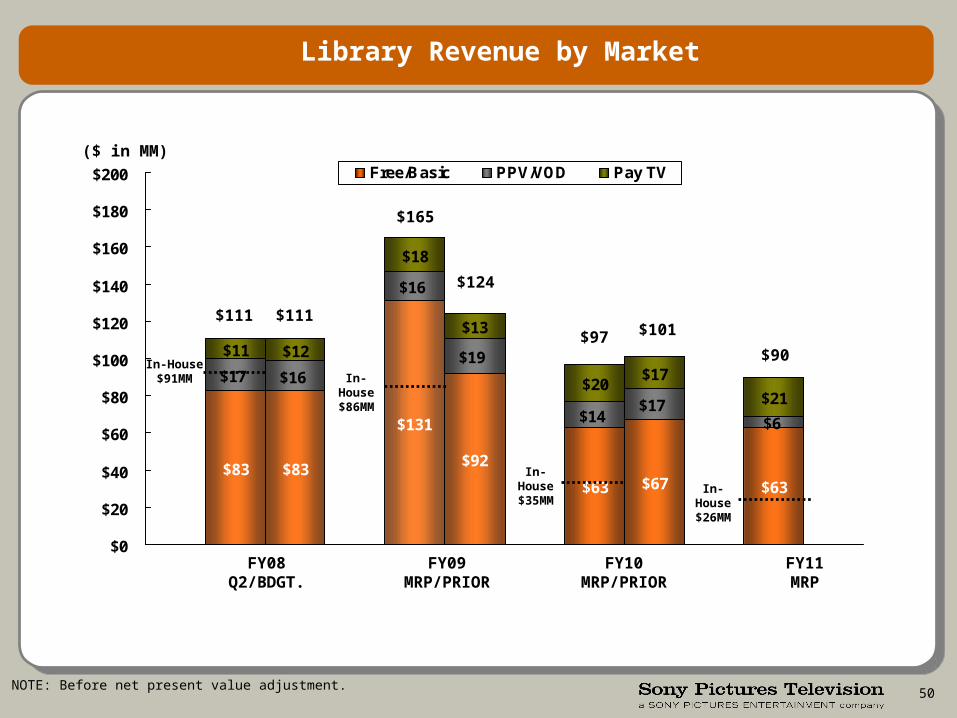
Library Revenue by Market
$83 $83
$131
$92
$63 $67 $63
$17 $16
$16
$19
$14$17
$6
$11 $12
$18
$13
$20$17
$21
$0
$20
$40
$60
$80
$100
$120
$140
$160
$180
$200 Free/Basic PPV/VOD Pay TV
In-House $91MM In-House
$86MM
In-House $35MM In-House
$26MM
($ in MM)
FY08Q2/BDGT.
FY09MRP/PRIOR
FY10MRP/PRIOR
FY11MRP
$111 $111
$165
$124
$97 $101
$90
NOTE: Before net present value adjustment.
51
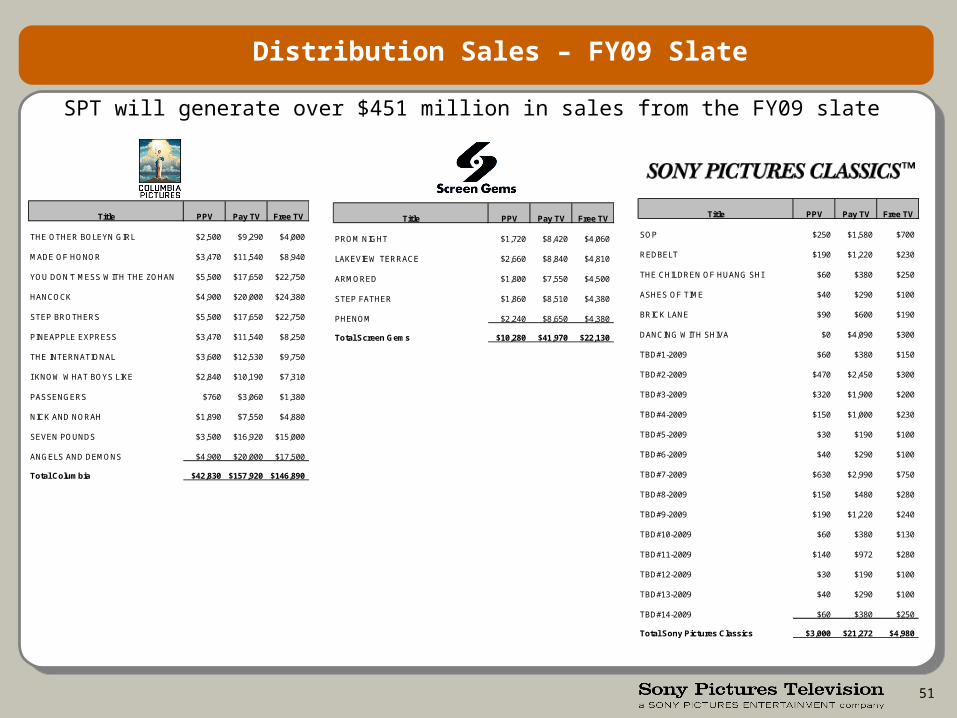
SPT will generate over $451 million in sales from the FY09 slate
Distribution Sales – FY09 Slate
Title PPV Pay TV Free TV
THE OTHER BOLEYN GIRL $2,500 $9,290 $4,000
MADE OF HONOR $3,470 $11,540 $8,940
YOU DON'T MESS WITH THE ZOHAN $5,500 $17,650 $22,750
HANCOCK $4,900 $20,000 $24,380
STEP BROTHERS $5,500 $17,650 $22,750
PINEAPPLE EXPRESS $3,470 $11,540 $8,250
THE INTERNATIONAL $3,600 $12,530 $9,750
I KNOW WHAT BOYS LIKE $2,840 $10,190 $7,310
PASSENGERS $760 $3,060 $1,380
NICK AND NORAH $1,890 $7,550 $4,880
SEVEN POUNDS $3,500 $16,920 $15,000
ANGELS AND DEMONS $4,900 $20,000 $17,500
Total Columbia $42,830 $157,920 $146,890
Title PPV Pay TV Free TV
PROM NIGHT $1,720 $8,420 $4,060
LAKEVIEW TERRACE $2,660 $8,840 $4,810
ARMORED $1,800 $7,550 $4,500
STEP FATHER $1,860 $8,510 $4,380
PHENOM $2,240 $8,650 $4,380
Total Screen Gems $10,280 $41,970 $22,130
Title PPV Pay TV Free TV
SOP $250 $1,580 $700
REDBELT $190 $1,220 $230
THE CHILDREN OF HUANG SHI $60 $380 $250
ASHES OF TIME $40 $290 $100
BRICK LANE $90 $600 $190
DANCING WITH SHIVA $0 $4,090 $300
TBD#1-2009 $60 $380 $150
TBD#2-2009 $470 $2,450 $300
TBD#3-2009 $320 $1,900 $200
TBD#4-2009 $150 $1,000 $230
TBD#5-2009 $30 $190 $100
TBD#6-2009 $40 $290 $100
TBD#7-2009 $630 $2,990 $750
TBD#8-2009 $150 $480 $280
TBD#9-2009 $190 $1,220 $240
TBD#10-2009 $60 $380 $130
TBD#11-2009 $140 $972 $280
TBD#12-2009 $30 $190 $100
TBD#13-2009 $40 $290 $100
TBD#14-2009 $60 $380 $250
Total Sony Pictures Classics $3,000 $21,272 $4,980
52
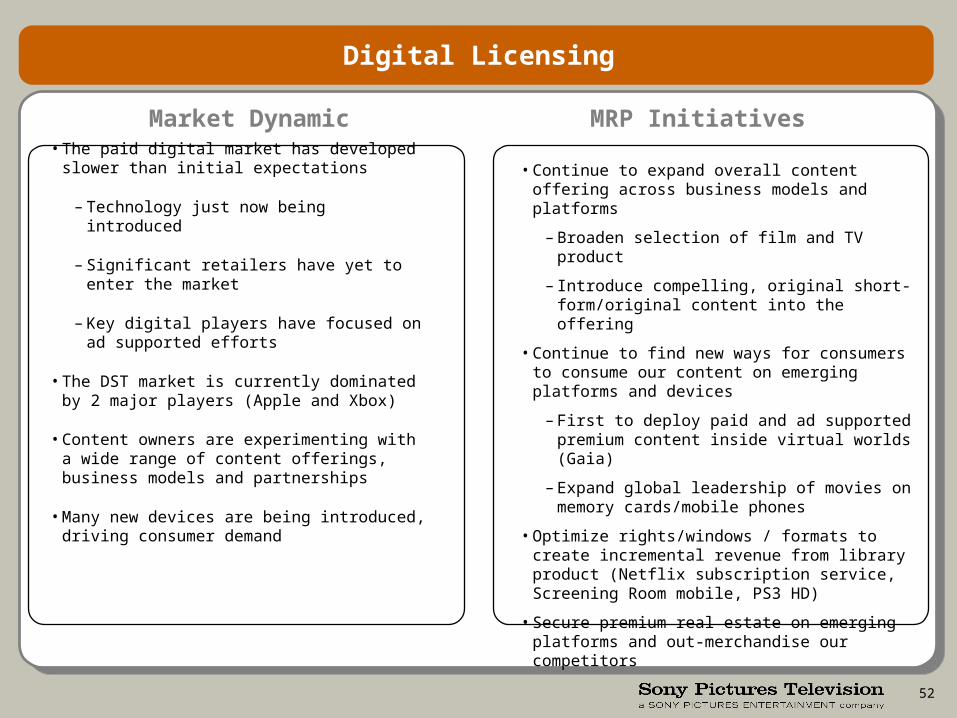
Digital Licensing
Market Dynamic MRP Initiatives
• The paid digital market has developed slower than initial expectations
– Technology just now being introduced
– Significant retailers have yet to enter the market
– Key digital players have focused on ad supported efforts
• The DST market is currently dominated by 2 major players (Apple and Xbox)
• Content owners are experimenting with a wide range of content offerings, business models and partnerships
• Many new devices are being introduced, driving consumer demand
• Continue to expand overall content offering across business models and platforms
– Broaden selection of film and TV product
– Introduce compelling, original short-form/original content into the offering
• Continue to find new ways for consumers to consume our content on emerging platforms and devices
– First to deploy paid and ad supported premium content inside virtual worlds (Gaia)
– Expand global leadership of movies on memory cards/mobile phones
• Optimize rights/windows / formats to create incremental revenue from library product (Netflix subscription service, Screening Room mobile, PS3 HD)
• Secure premium real estate on emerging platforms and out-merchandise our competitors
53
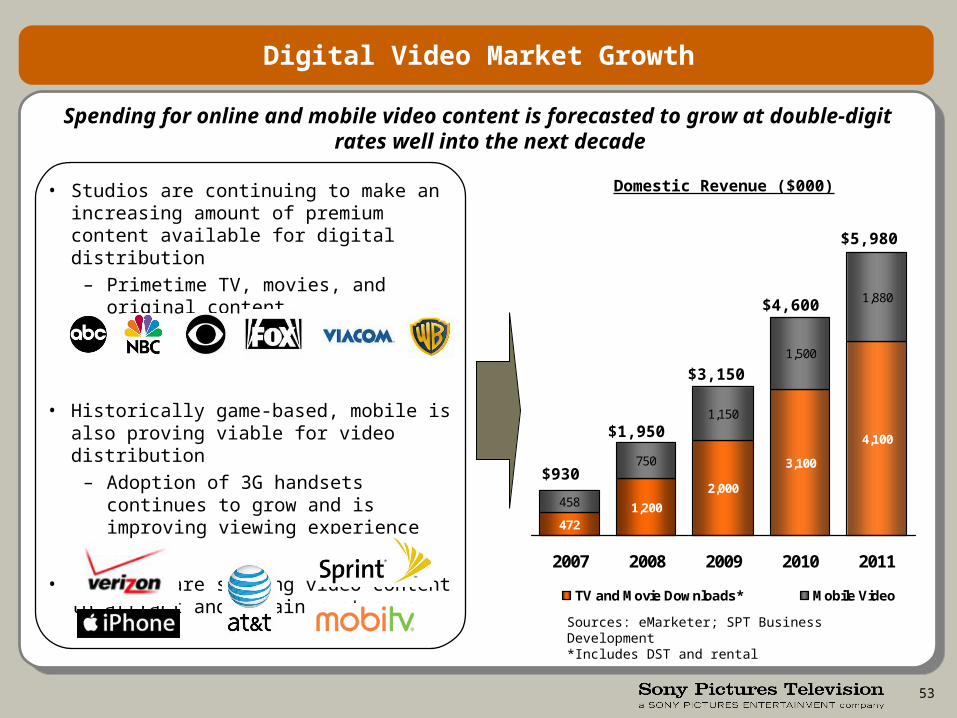
4721,200
2,000
3,100
4,100
458
750
1,150
1,500
1,880
2007 2008 2009 2010 2011
TV and Movie Downloads* Mobile Video
Digital Video Market Growth
Domestic Revenue ($000)
Sources: eMarketer; SPT Business Development*Includes DST and rental
Spending for online and mobile video content is forecasted to grow at double-digit rates well into the next decade
• Studios are continuing to make an increasing amount of premium content available for digital distribution
– Primetime TV, movies, and original content
• Historically game-based, mobile is also proving viable for video distribution
– Adoption of 3G handsets continues to grow and is improving viewing experience
• Carriers are seeking video content to attract and retain customers
$930
$1,950
$3,150
$4,600
$5,980
54
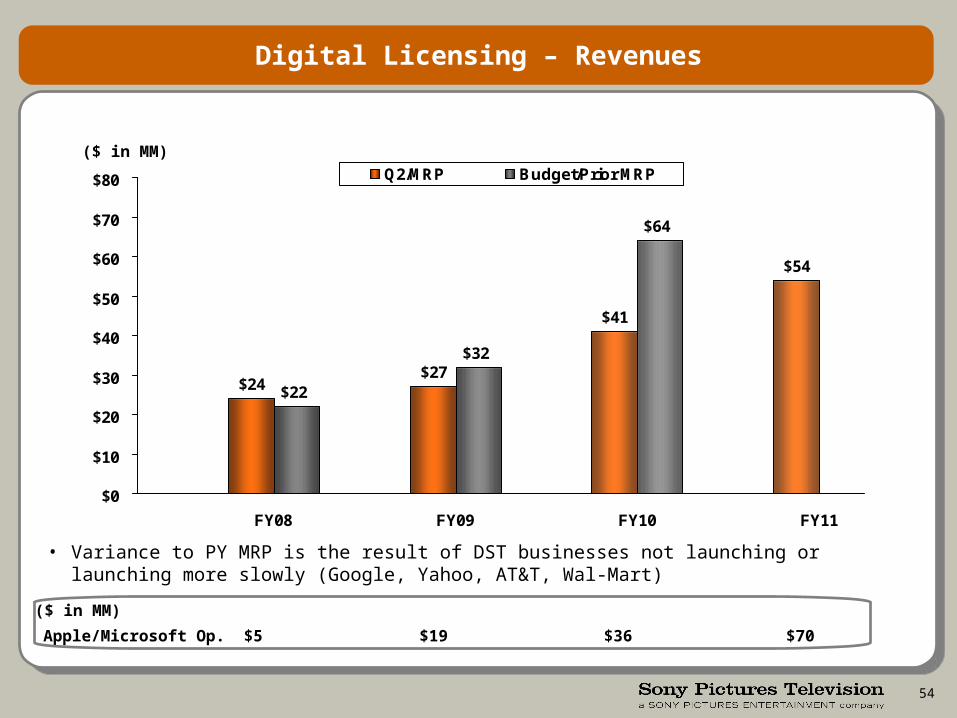
Digital Licensing – Revenues
$24$27
$41
$54
$22
$32
$64
$0
$10
$20
$30
$40
$50
$60
$70
$80
FY08 FY09 FY10 FY11
Q2/MRP Budget/Prior MRP
Apple/Microsoft Op. $5 $19 $36 $70
($ in MM)
($ in MM)
• Variance to PY MRP is the result of DST businesses not launching or launching more slowly (Google, Yahoo, AT&T, Wal-Mart)
55
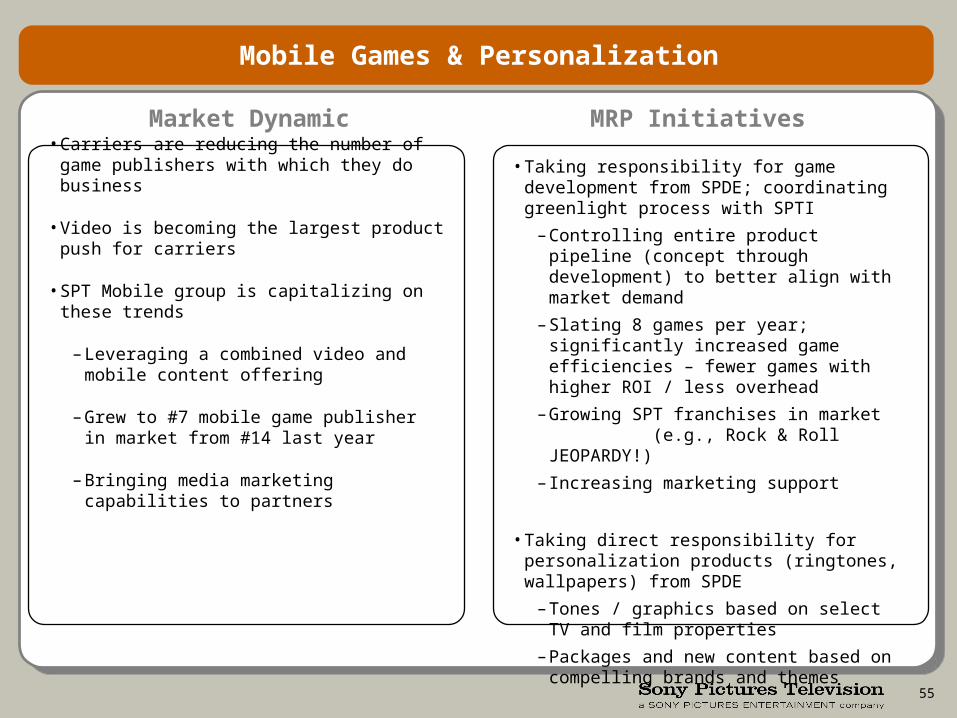
Mobile Games & Personalization
Market Dynamic MRP Initiatives
• Carriers are reducing the number of game publishers with which they do business
• Video is becoming the largest product push for carriers
• SPT Mobile group is capitalizing on these trends
– Leveraging a combined video and mobile content offering
– Grew to #7 mobile game publisher in market from #14 last year
– Bringing media marketing capabilities to partners
• Taking responsibility for game development from SPDE; coordinating greenlight process with SPTI
– Controlling entire product pipeline (concept through development) to better align with market demand
– Slating 8 games per year; significantly increased game efficiencies – fewer games with higher ROI / less overhead
– Growing SPT franchises in market (e.g., Rock & Roll JEOPARDY!)
– Increasing marketing support
• Taking direct responsibility for personalization products (ringtones, wallpapers) from SPDE
– Tones / graphics based on select TV and film properties
– Packages and new content based on compelling brands and themes
56
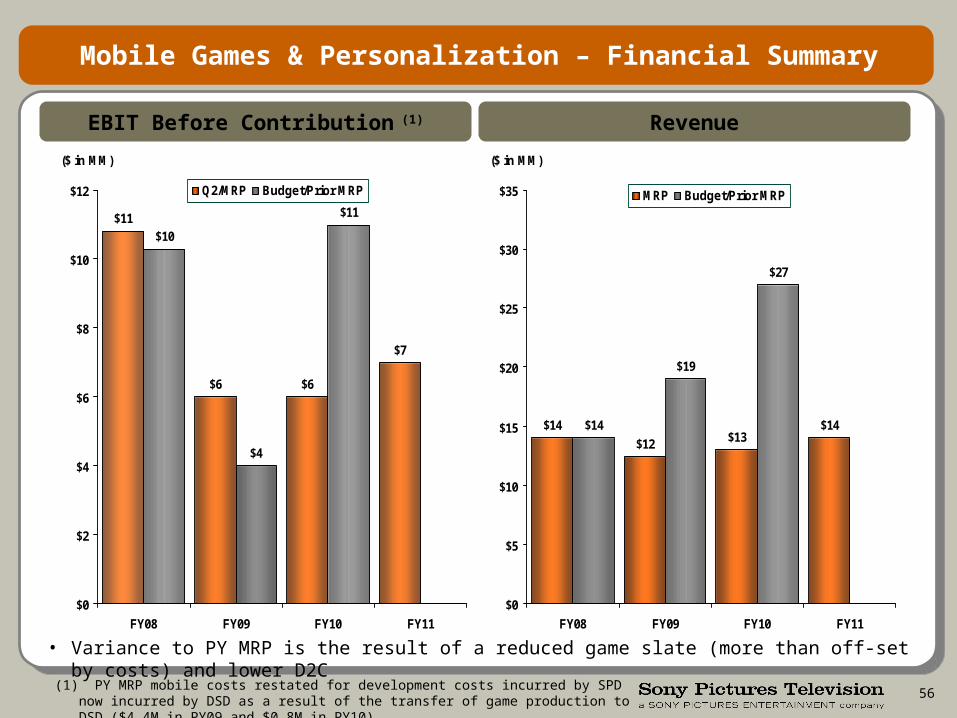
Mobile Games & Personalization – Financial Summary
EBIT Before Contribution (1) Revenue
$4
$6
$11
$6
$7
$11
$10
$0
$2
$4
$6
$8
$10
$12
FY08 FY09 FY10 FY11
($ in MM)
Q2/MRP Budget/Prior MRP
$19
$12
$14$13
$14
$27
$14
$0
$5
$10
$15
$20
$25
$30
$35
FY08 FY09 FY10 FY11
($ in MM)
MRP Budget/Prior MRP
(1) PY MRP mobile costs restated for development costs incurred by SPD now incurred by DSD as a result of the transfer of game production to DSD ($4.4M in PY09 and $0.8M in PY10).
• Variance to PY MRP is the result of a reduced game slate (more than off-set by costs) and lower D2C
SPHE & SPTI CONTRIBUTION TO SPT PRODUCT
58
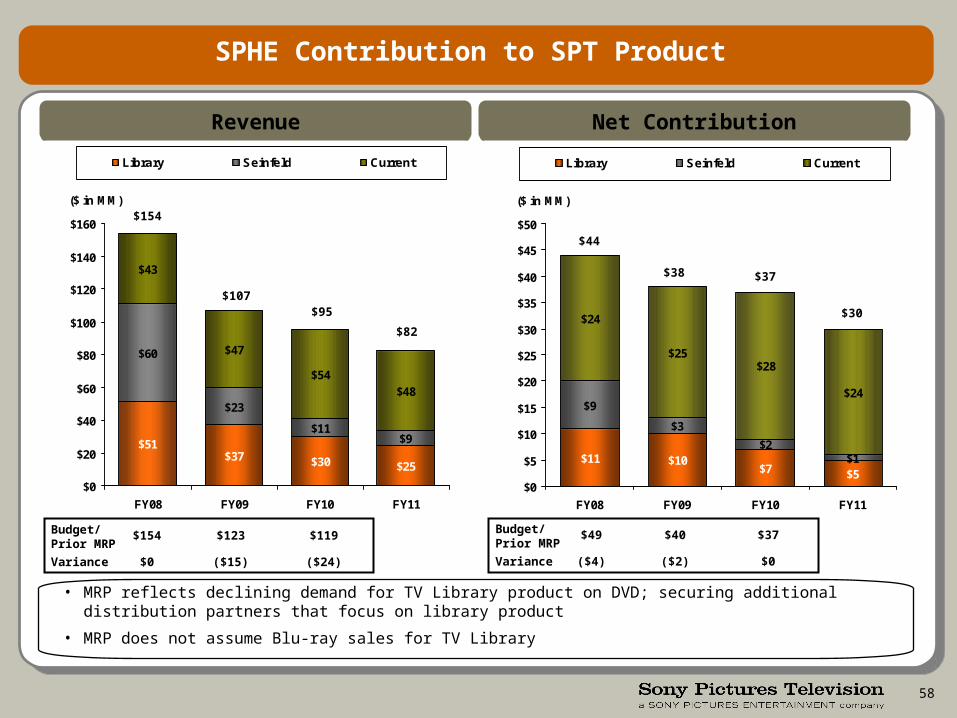
SPHE Contribution to SPT Product
Revenue Net Contribution
Budget/Prior MRP
Variance
$154
$0
$123
($15)
$119
($24)
• MRP reflects declining demand for TV Library product on DVD; securing additional distribution partners that focus on library product
• MRP does not assume Blu-ray sales for TV Library
Budget/Prior MRP
Variance
$49
($4)
$40
($2)
$37
$0
$51$37 $30 $25
$60
$23
$11$9
$43
$47
$54$48
$0
$20
$40
$60
$80
$100
$120
$140
$160
FY08 FY09 FY10 FY11
($ in MM)
Library Seinfeld Current
$11 $10$7 $5
$9
$3
$2$1
$24
$25$28
$24
$0
$5
$10
$15
$20
$25
$30
$35
$40
$45
$50
FY08 FY09 FY10 FY11
($ in MM)
Library Seinfeld Current
$154
$107$95
$82
$44
$38 $37
$30
59
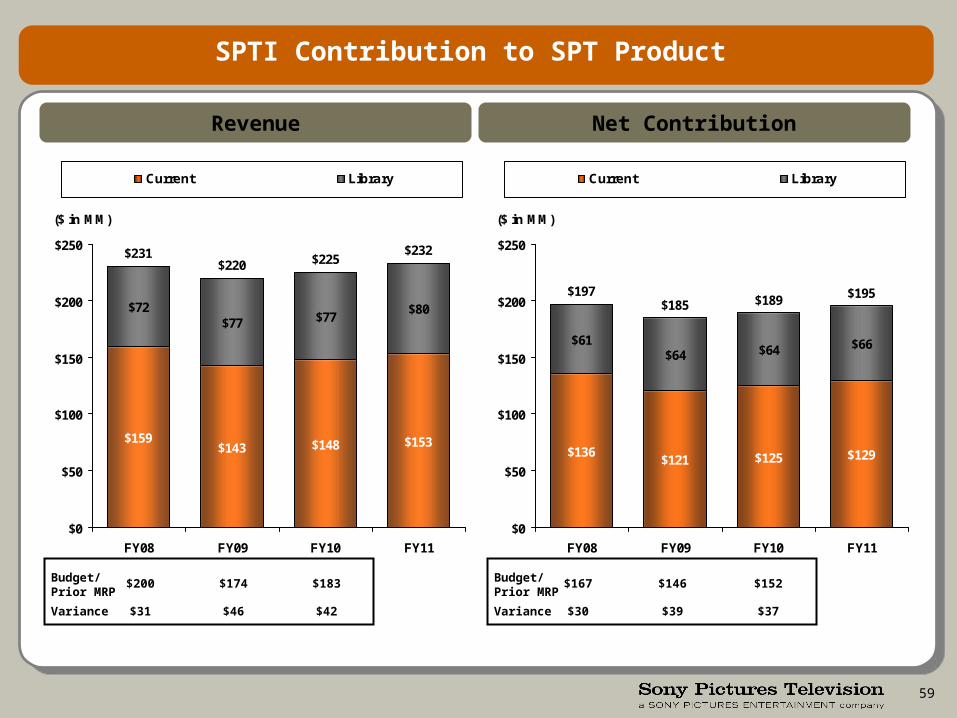
SPTI Contribution to SPT Product
Revenue Net Contribution
$159$143 $148 $153
$77 $77$80
$231$220 $225
$232
$72
$0
$50
$100
$150
$200
$250
FY08 FY09 FY10 FY11
($ in MM)
Current Library
Budget/Prior MRP
Variance
$200
$31
$174
$46
$183
$42
$136$121 $125 $129
$64 $64 $66
$197$185 $189 $195
$61
$0
$50
$100
$150
$200
$250
FY08 FY09 FY10 FY11
($ in MM)
Current Library
Budget/Prior MRP
Variance
$167
$30
$146
$39
$152
$37

AD SALES
61
Overview of Ad Sales Environment
• The market has improved recently, driven partly by the new C3 ratings system– C3 coincided with recovery in the up-front market– The new system decreased total ratings points, driving near-term price increases– C3 is also creating opportunities for product integration
• We are addressing the aging of our core programs and continuing to seek growth in traditional TV categories
– We are partially offsetting rating declines for our older shows by reformatting commercial placements and taking advantage of C3 benefits for syndicated shows
– Expanding our cable business (Tennis Channel, Mojo) given the challenges of securing satellite representation
– Selling program-by-program to grow the :10 business
• We are also driving growth by expanding beyond our traditional TV business– Increased 3rd party representation– HD advertising marketplace still growing– Emerging opportunities in digital ad sales (e.g., Screening Room/MediaFlo)– Growth in new platforms, including in-game advertising
62
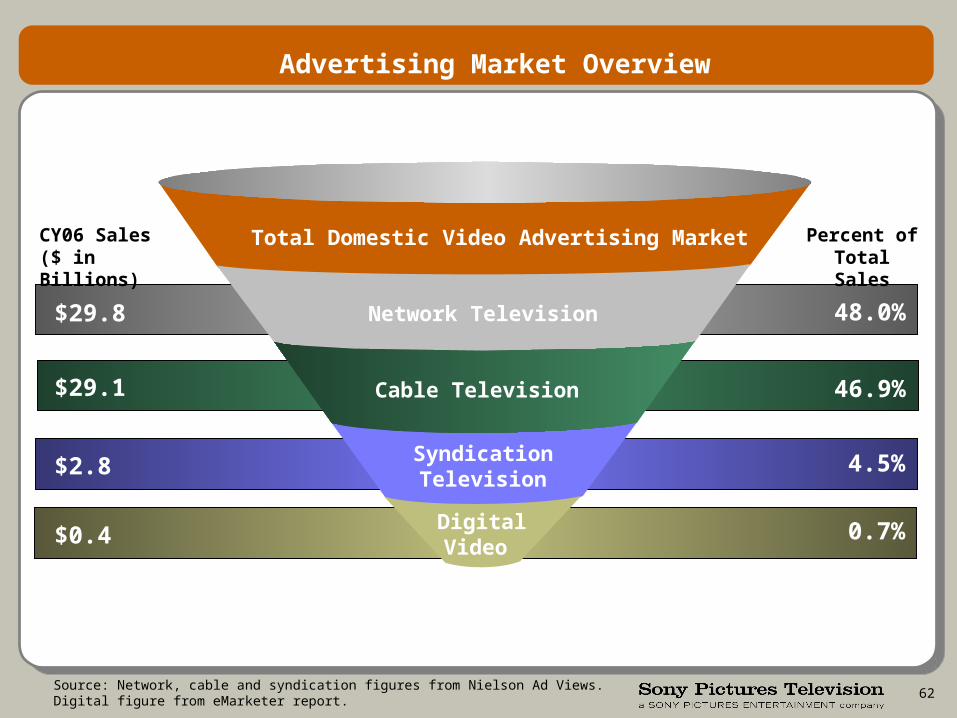
Advertising Market Overview
$0.4
Total Domestic Video Advertising Market
Network Television
Syndication Television
Digital Video
Cable Television
48.0%
46.9%
4.5%
0.7%
$29.8
$29.1
$2.8
Percent of Total Sales
CY06 Sales ($ in Billions)
Source: Network, cable and syndication figures from Nielson Ad Views. Digital figure from eMarketer report.
63
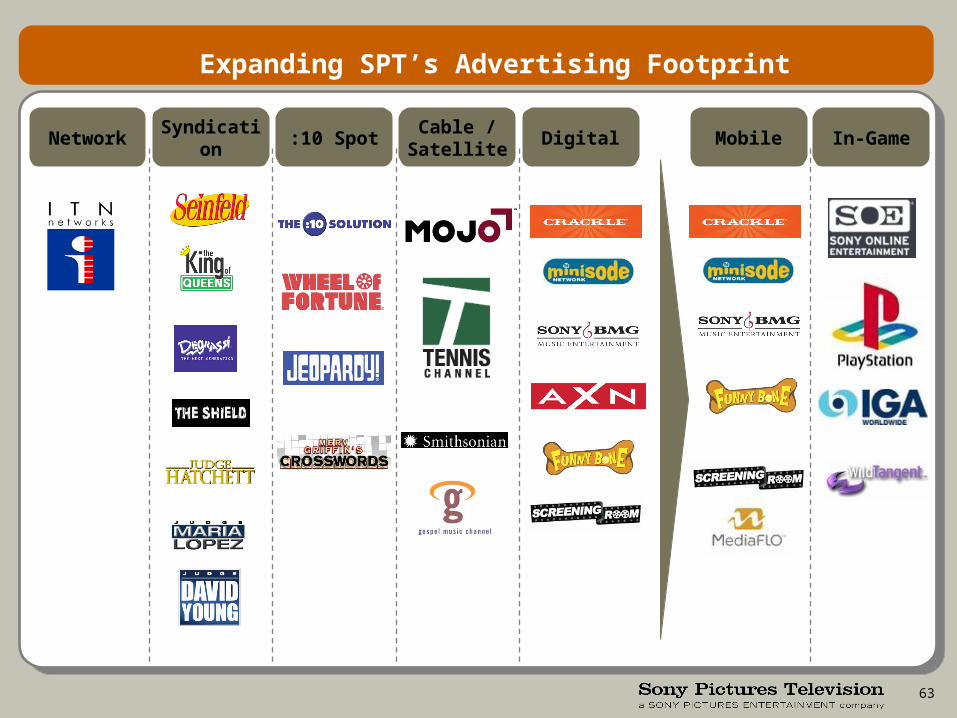
Network Syndication :10 SpotCable /
SatelliteDigital Mobile In-Game
Expanding SPT’s Advertising Footprint
64
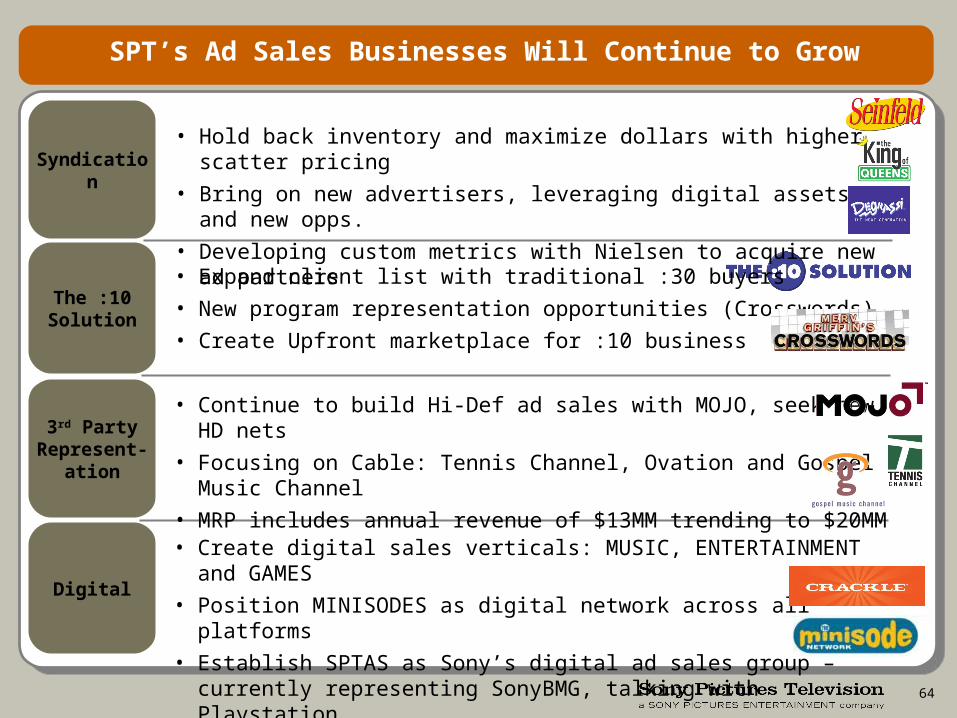
SPT’s Ad Sales Businesses Will Continue to Grow
Syndication
The :10 Solution
3rd Party Represent-
ation
Digital
• Hold back inventory and maximize dollars with higher scatter pricing
• Bring on new advertisers, leveraging digital assets and new opps.
• Developing custom metrics with Nielsen to acquire new ad partners
• Expand client list with traditional :30 buyers
• New program representation opportunities (Crosswords)
• Create Upfront marketplace for :10 business
• Continue to build Hi-Def ad sales with MOJO, seek new HD nets
• Focusing on Cable: Tennis Channel, Ovation and Gospel Music Channel
• MRP includes annual revenue of $13MM trending to $20MM
• Create digital sales verticals: MUSIC, ENTERTAINMENT and GAMES
• Position MINISODES as digital network across all platforms
• Establish SPTAS as Sony’s digital ad sales group – currently representing SonyBMG, talking with Playstation
65
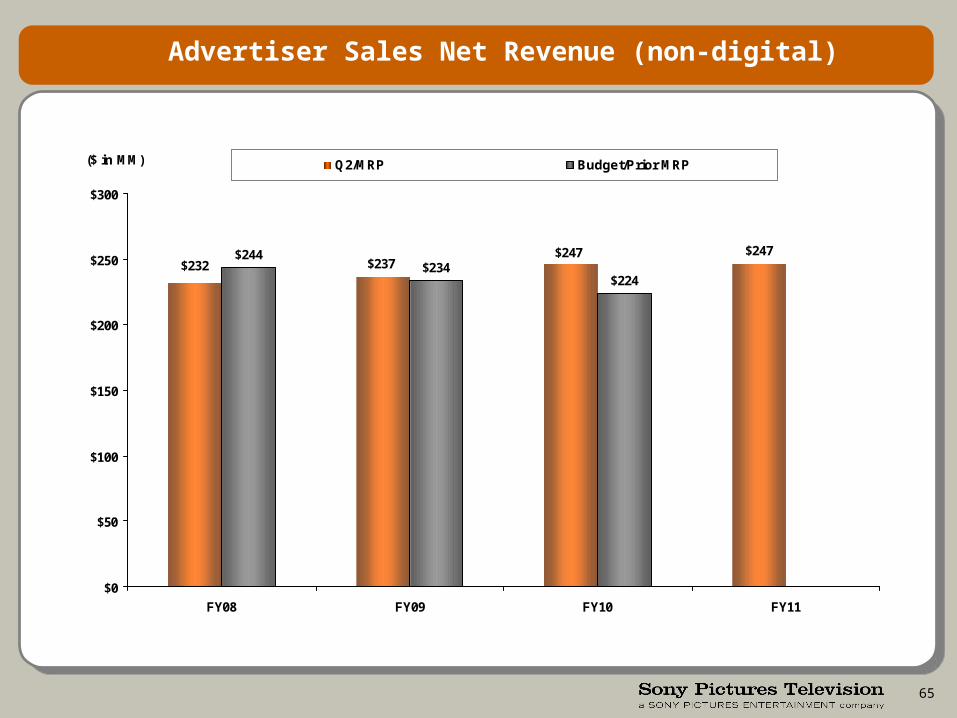
Advertiser Sales Net Revenue (non-digital)
$244$234
$224$237$232
$247 $247
$0
$50
$100
$150
$200
$250
$300
FY08 FY09 FY10 FY11
($ in MM)Q2/MRP Budget/Prior MRP
66
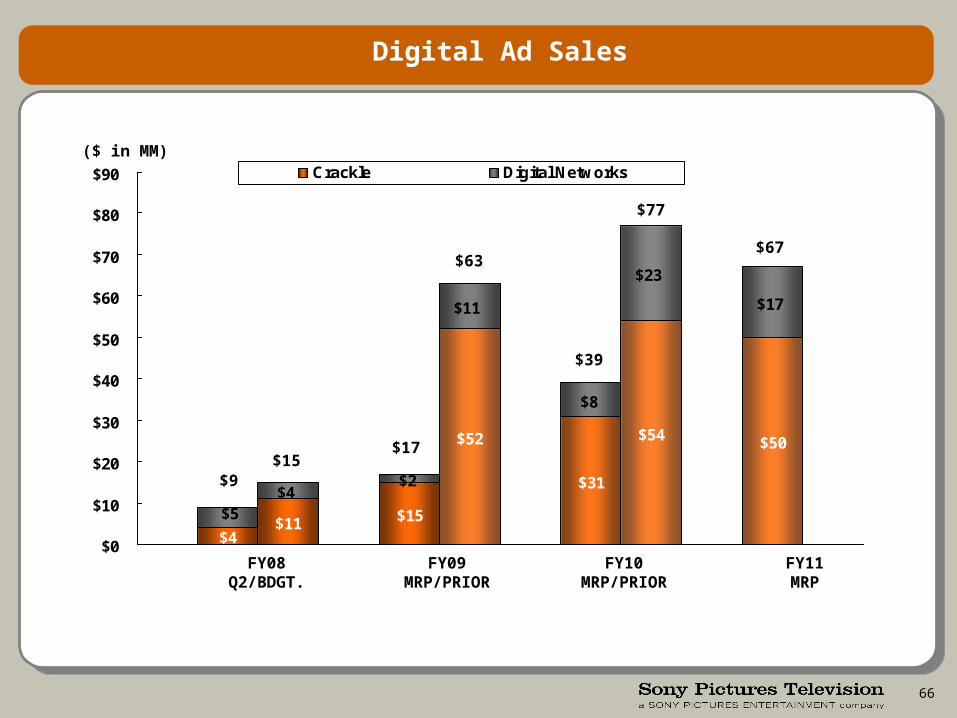
$4$11 $15
$52
$31
$54 $50
$4$2
$11
$8
$23
$17
$5
$0
$10
$20
$30
$40
$50
$60
$70
$80
$90 Crackle Digital Networks
Digital Ad Sales
($ in MM)
FY08Q2/BDGT.
FY09MRP/PRIOR
FY10MRP/PRIOR
FY11MRP
$9$15
$17
$63
$39
$77
$67

APPENDIX: Financial Slides

68
SPT – Major Contributions to Earnings
($ in MM) FY08 FY09 FY10 FY11
Wheel of Fortune 86$ 56% 59$ 51% 59$ 50% 60$ 50%
Jeopardy! 32 42% 32 42% 32 42% 32 42%
Library - SPT 17 37% 40 57% 26 57% 28 58%
Library - HE 5 10% 5 14% 4 13% 2 8%
Library - SPTI 38 53% 40 52% 39 51% 40 50%
The Young and the Restless 27 19% 26 18% 26 18% 25 18%
Days of Our Lives 17 19% 15 17% 14 16% 13 15%
Seinfeld Fee 38 100% 20 100% 55 100% 18 100%
King of Queens 13 18% 13 18% 6 15% 6 19%
Rescue Me 6 15% 11 19% 7 16% 1 23%
The Shield 3 15% 3 19% 1 37% - 37%
ENCORE Bonus 48 100% 48 100% 48 100% 48 100%
Long Form 6 8% 4 7% 5 9% 5 9%
Culver Entertainment 2 20% 3 16% 2 19% 2 19%
Power of 10 / The Nine 1 - 2 4% 6 9%
Rules of Engagement & Canterbury's Law n/a n/a n/a 18 18%
New Series Investment (100) (95) (95) (95)
All Other Products 10 14 10 12
Net G&A (49) (51) (53) (56)
GSN 15 21 31 31
FearNet (6) (5) (1) 1
Total 209$ 17% 203$ 17% 218$ 17% 197$ 16%
69
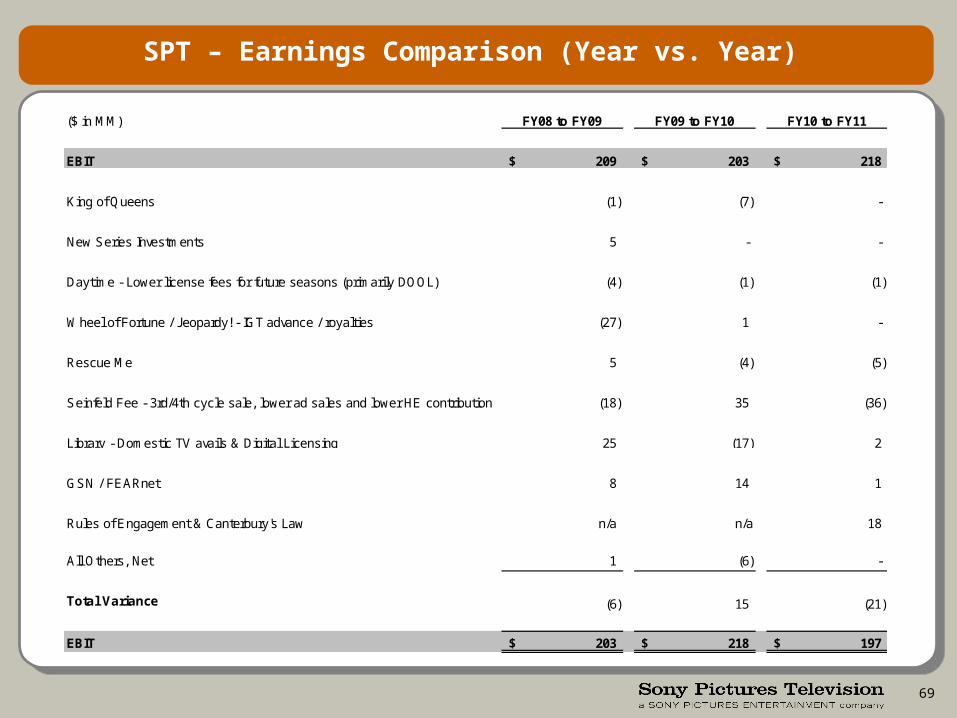
SPT – Earnings Comparison (Year vs. Year)
($ in MM) FY08 to FY09 FY09 to FY10 FY10 to FY11
EBIT 209$ 203$ 218$
King of Queens (1) (7) -
New Series Investments 5 - -
Daytime - Lower license fees for future seasons (primarily DOOL) (4) (1) (1)
Wheel of Fortune / Jeopardy! - IGT advance / royalties (27) 1 -
Rescue Me 5 (4) (5)
Seinfeld Fee - 3rd/4th cycle sale, lower ad sales and lower HE contribution (18) 35 (36)
Library - Domestic TV avails & Digital Licensing 25 (17) 2
GSN / FEARnet 8 14 1
Rules of Engagement & Canterbury's Law n/a n/a 18
All Others, Net 1 (6) -
Total Variance (6) 15 (21)
EBIT 203$ 218$ 197$
70
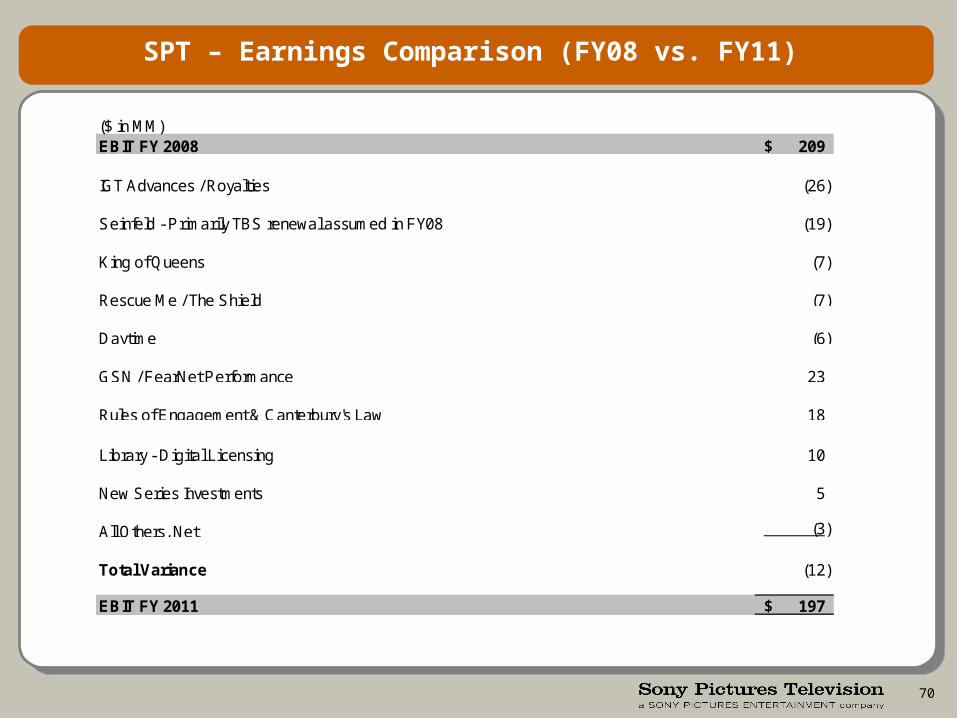
SPT – Earnings Comparison (FY08 vs. FY11)
($ in MM)EBIT FY 2008 209$
IGT Advances / Royalties (26)
Seinfeld - Primarily TBS renewal assumed in FY08 (19)
King of Queens (7)
Rescue Me / The Shield (7)
Daytime (6)
GSN / FearNet Performance 23
Rules of Engagement & Canterbury's Law 18
Library - Digital Licensing 10
New Series Investments 5
All Others, Net (3)
Total Variance (12)
EBIT FY 2011 197$
71
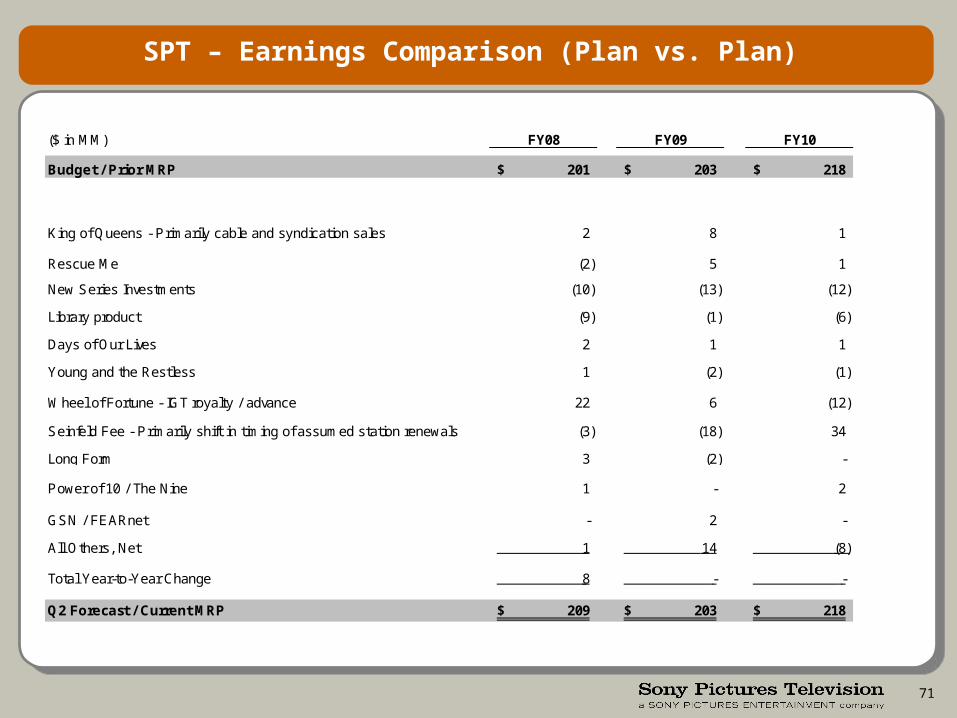
SPT – Earnings Comparison (Plan vs. Plan)
($ in MM) FY08 FY09 FY10
Budget / Prior MRP 201$ 203$ 218$
King of Queens - Primarily cable and syndication sales 2 8 1
Rescue Me (2) 5 1
New Series Investments (10) (13) (12)
Library product (9) (1) (6)
Days of Our Lives 2 1 1
Young and the Restless 1 (2) (1)
Wheel of Fortune - IGT royalty / advance 22 6 (12)
Seinfeld Fee - Primarily shift in timing of assumed station renewals (3) (18) 34
Long Form 3 (2) -
Power of 10 / The Nine 1 - 2
GSN / FEARnet - 2 -
All Others, Net 1 14 (8)
Total Year-to-Year Change 8 - -
Q2 Forecast / Current MRP 209$ 203$ 218$
72
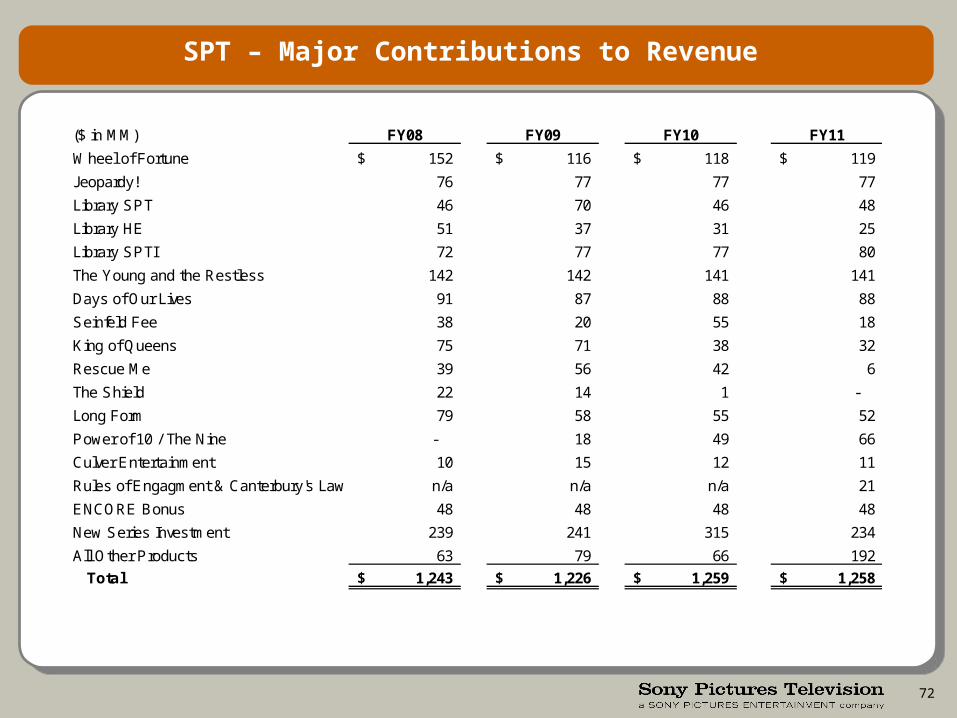
SPT – Major Contributions to Revenue
($ in MM) FY08 FY09 FY10 FY11
Wheel of Fortune 152$ 116$ 118$ 119$
Jeopardy! 76 77 77 77
Library SPT 46 70 46 48
Library HE 51 37 31 25
Library SPTI 72 77 77 80
The Young and the Restless 142 142 141 141
Days of Our Lives 91 87 88 88
Seinfeld Fee 38 20 55 18
King of Queens 75 71 38 32
Rescue Me 39 56 42 6
The Shield 22 14 1 -
Long Form 79 58 55 52
Power of 10 / The Nine - 18 49 66
Culver Entertainment 10 15 12 11
Rules of Engagment & Canterbury's Law n/a n/a n/a 21
ENCORE Bonus 48 48 48 48
New Series Investment 239 241 315 234
All Other Products 63 79 66 192
Total 1,243$ 1,226$ 1,259$ 1,258$
73
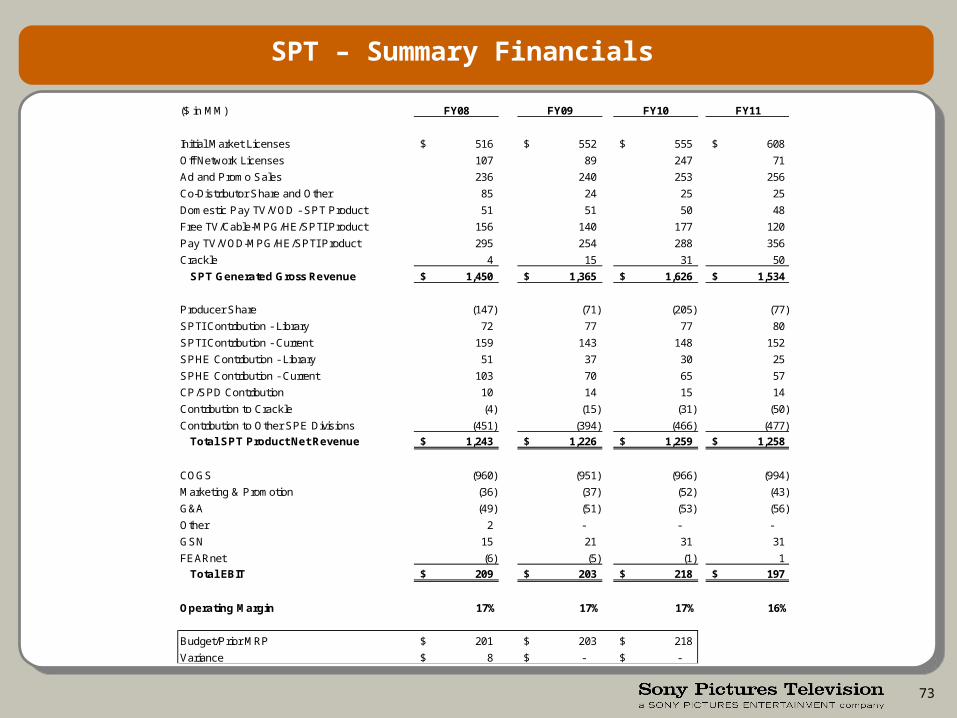
SPT – Summary Financials
($ in MM) FY08 FY09 FY10 FY11
Initial Market Licenses 516$ 552$ 555$ 608$
Off Network Licenses 107 89 247 71
Ad and Promo Sales 236 240 253 256
Co-Distributor Share and Other 85 24 25 25
Domestic Pay TV/VOD - SPT Product 51 51 50 48
Free TV/Cable-MPG/HE/SPTI Product 156 140 177 120
Pay TV/VOD-MPG/HE/SPTI Product 295 254 288 356
Crackle 4 15 31 50
SPT Generated Gross Revenue 1,450$ 1,365$ 1,626$ 1,534$
Producer Share (147) (71) (205) (77)
SPTI Contribution - Library 72 77 77 80
SPTI Contribution - Current 159 143 148 152
SPHE Contribution - Library 51 37 30 25
SPHE Contribution - Current 103 70 65 57
CP/SPD Contribution 10 14 15 14
Contribution to Crackle (4) (15) (31) (50)
Contribution to Other SPE Divisions (451) (394) (466) (477)
Total SPT Product Net Revenue 1,243$ 1,226$ 1,259$ 1,258$
COGS (960) (951) (966) (994)
Marketing & Promotion (36) (37) (52) (43)
G&A (49) (51) (53) (56)
Other 2 - - -
GSN 15 21 31 31
FEARnet (6) (5) (1) 1
Total EBIT 209$ 203$ 218$ 197$
Operating Margin 17% 17% 17% 16%
Budget/Prior MRP 201$ 203$ 218$
Variance 8$ -$ -$
74
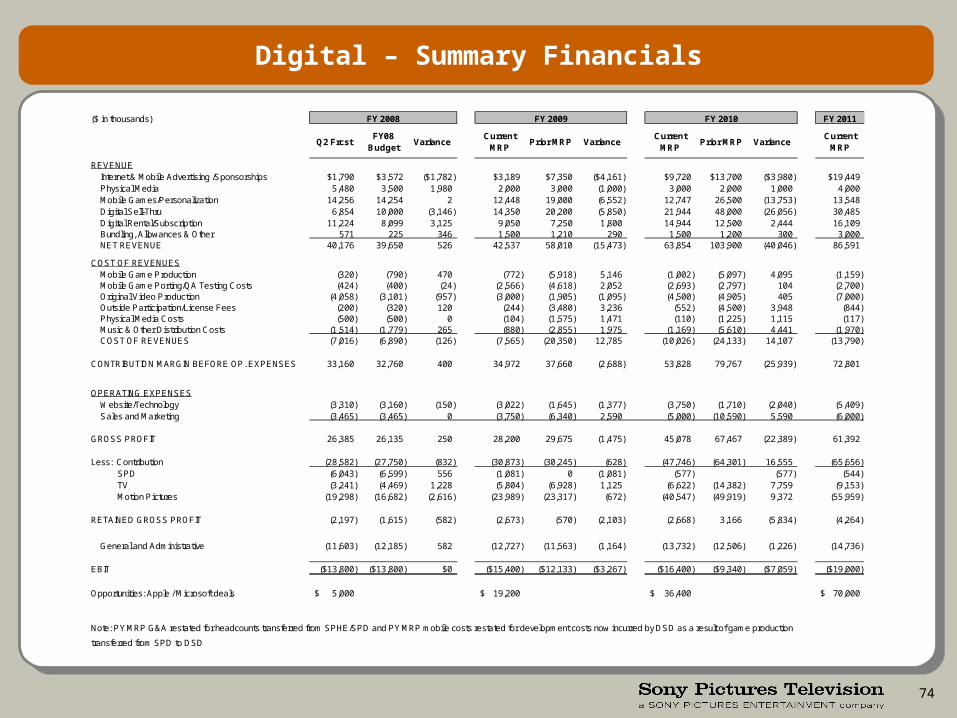
Digital – Summary Financials
($ in thousands) FY 2011
Q2 FrcstFY08
BudgetVariance
Current MRP
Prior MRP VarianceCurrent
MRPPrior MRP Variance
Current MRP
REVENUEInternet & Mobile Advertising /Sponsorships $1,790 $3,572 ($1,782) $3,189 $7,350 ($4,161) $9,720 $13,700 ($3,980) $19,449Physical Media 5,480 3,500 1,980 2,000 3,000 (1,000) 3,000 2,000 1,000 4,000Mobile Games/Personalization 14,256 14,254 2 12,448 19,000 (6,552) 12,747 26,500 (13,753) 13,548Digital Sell-Thru 6,854 10,000 (3,146) 14,350 20,200 (5,850) 21,944 48,000 (26,056) 30,485Digital Rental/Subscription 11,224 8,099 3,125 9,050 7,250 1,800 14,944 12,500 2,444 16,109Bundling, Allowances & Other 571 225 346 1,500 1,210 290 1,500 1,200 300 3,000NET REVENUE 40,176 39,650 526 42,537 58,010 (15,473) 63,854 103,900 (40,046) 86,591
COST OF REVENUESMobile Game Production (320) (790) 470 (772) (5,918) 5,146 (1,002) (5,097) 4,095 (1,159)Mobile Game Porting/QA Testing Costs (424) (400) (24) (2,566) (4,618) 2,052 (2,693) (2,797) 104 (2,700)Original Video Production (4,058) (3,101) (957) (3,000) (1,905) (1,095) (4,500) (4,905) 405 (7,000)Outside Participation/License Fees (200) (320) 120 (244) (3,480) 3,236 (552) (4,500) 3,948 (844)Physical Media Costs (500) (500) 0 (104) (1,575) 1,471 (110) (1,225) 1,115 (117)Music & Other Distribution Costs (1,514) (1,779) 265 (880) (2,855) 1,975 (1,169) (5,610) 4,441 (1,970)COST OF REVENUES (7,016) (6,890) (126) (7,565) (20,350) 12,785 (10,026) (24,133) 14,107 (13,790)
CONTRIBUTION MARGIN BEFORE OP. EXPENSES 33,160 32,760 400 34,972 37,660 (2,688) 53,828 79,767 (25,939) 72,801
OPERATING EXPENSESWebsite/Technology (3,310) (3,160) (150) (3,022) (1,645) (1,377) (3,750) (1,710) (2,040) (5,409)Sales and Marketing (3,465) (3,465) 0 (3,750) (6,340) 2,590 (5,000) (10,590) 5,590 (6,000)
GROSS PROFIT 26,385 26,135 250 28,200 29,675 (1,475) 45,078 67,467 (22,389) 61,392
Less: Contribution (28,582) (27,750) (832) (30,873) (30,245) (628) (47,746) (64,301) 16,555 (65,656)SPD (6,043) (6,599) 556 (1,081) 0 (1,081) (577) (577) (544)TV (3,241) (4,469) 1,228 (5,804) (6,928) 1,125 (6,622) (14,382) 7,759 (9,153)Motion Pictures (19,298) (16,682) (2,616) (23,989) (23,317) (672) (40,547) (49,919) 9,372 (55,959)
RETAINED GROSS PROFIT (2,197) (1,615) (582) (2,673) (570) (2,103) (2,668) 3,166 (5,834) (4,264)
General and Administrative (11,603) (12,185) 582 (12,727) (11,563) (1,164) (13,732) (12,506) (1,226) (14,736)
EBIT ($13,800) ($13,800) $0 ($15,400) ($12,133) ($3,267) ($16,400) ($9,340) ($7,059) ($19,000)
Opportunities: Apple / Microsoft deals 5,000$ 19,200$ 36,400$ 70,000$
Note: PY MRP G&A restated for headcounts transferred from SPHE/SPD and PY MRP mobile costs restated for development costs now incurred by DSD as a result of game production
transferred from SPD to DSD
FY 2008 FY 2009 FY 2010
75
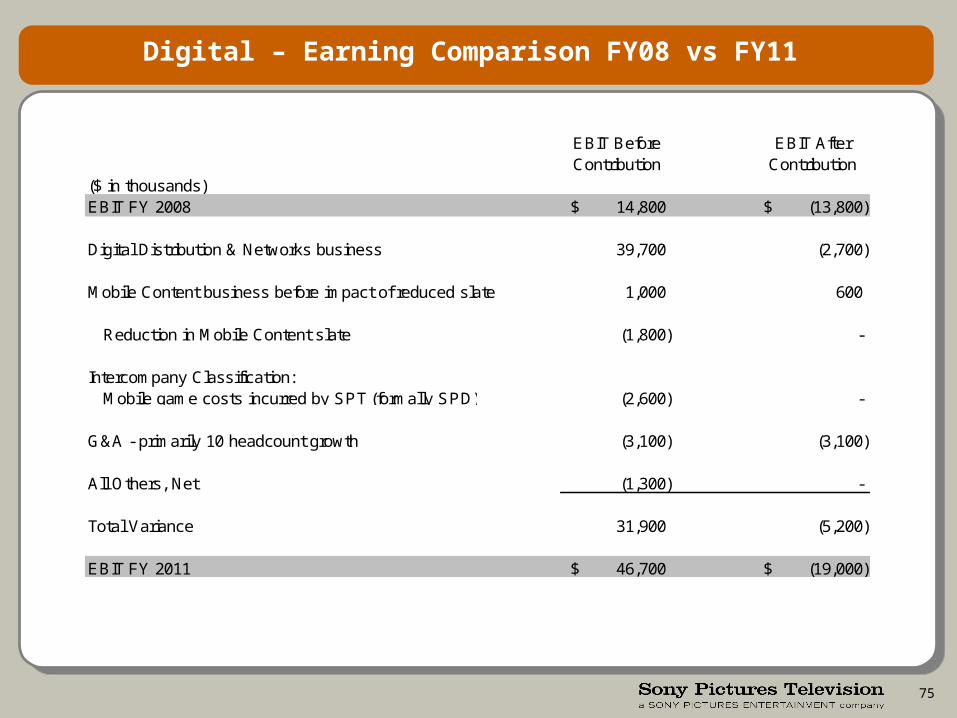
Digital – Earning Comparison FY08 vs FY11
EBIT Before Contribution
EBIT AfterContribution
($ in thousands)EBIT FY 2008 14,800$ (13,800)$
Digital Distribution & Networks business 39,700 (2,700)
Mobile Content business before impact of reduced slate 1,000 600
Reduction in Mobile Content slate (1,800) -
Intercompany Classification:Mobile game costs incurred by SPT (formally SPD) (2,600) -
G&A - primarily 10 headcount growth (3,100) (3,100)
All Others, Net (1,300) -
Total Variance 31,900 (5,200)
EBIT FY 2011 46,700$ (19,000)$
76
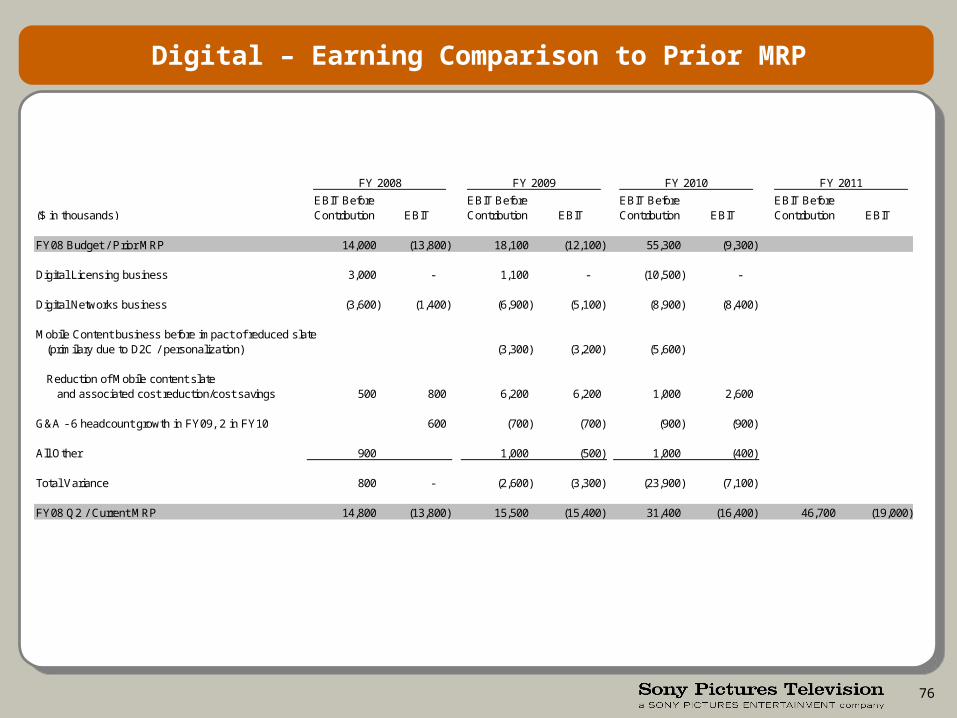
Digital – Earning Comparison to Prior MRP
($ in thousands)EBIT Before Contribution EBIT
EBIT Before Contribution EBIT
EBIT Before Contribution EBIT
EBIT Before Contribution EBIT
FY08 Budget / Prior MRP 14,000 (13,800) 18,100 (12,100) 55,300 (9,300)
Digital Licensing business 3,000 - 1,100 - (10,500) -
Digital Networks business (3,600) (1,400) (6,900) (5,100) (8,900) (8,400)
Mobile Content business before impact of reduced slate(primilary due to D2C / personalization) (3,300) (3,200) (5,600)
Reduction of Mobile content slateand associated cost reduction/cost savings 500 800 6,200 6,200 1,000 2,600
G&A - 6 headcount growth in FY09, 2 in FY10 600 (700) (700) (900) (900)
All Other 900 1,000 (500) 1,000 (400)
Total Variance 800 - (2,600) (3,300) (23,900) (7,100)
FY08 Q2 / Current MRP 14,800 (13,800) 15,500 (15,400) 31,400 (16,400) 46,700 (19,000)
FY 2008 FY 2009 FY 2010 FY 2011
77
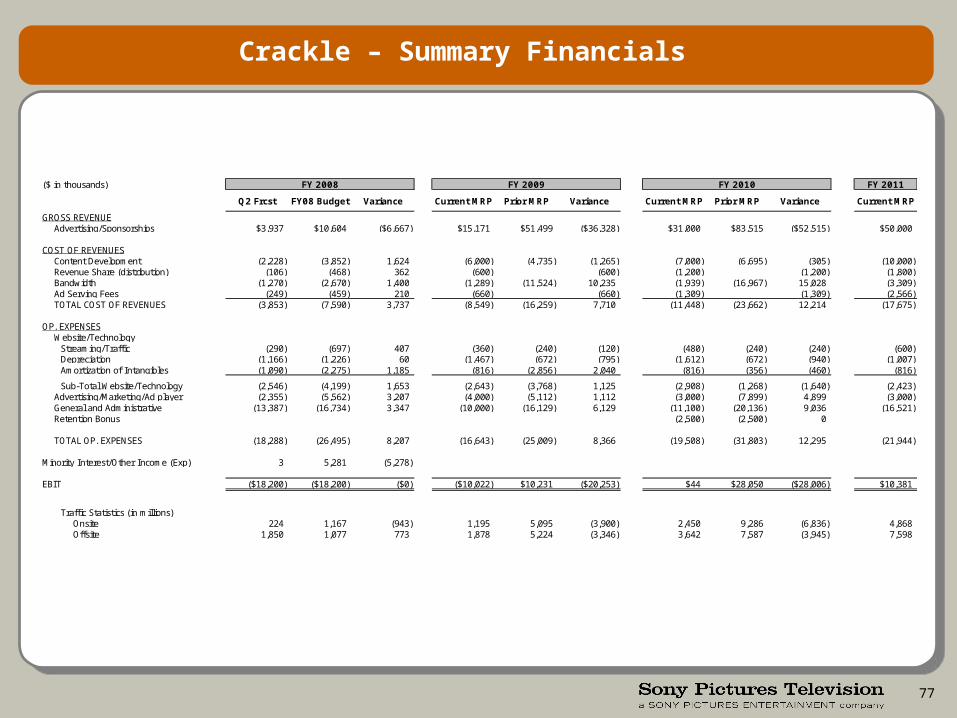
Crackle – Summary Financials
($ in thousands) FY 2011
Q2 Frcst FY08 Budget Variance Current MRP Prior MRP Variance Current MRP Prior MRP Variance Current MRP
GROSS REVENUEAdvertising/Sponsorships $3,937 $10,604 ($6,667) $15,171 $51,499 ($36,328) $31,000 $83,515 ($52,515) $50,000
COST OF REVENUESContent Development (2,228) (3,852) 1,624 (6,000) (4,735) (1,265) (7,000) (6,695) (305) (10,000)Revenue Share (distribution) (106) (468) 362 (600) (600) (1,200) (1,200) (1,800)Bandwidth (1,270) (2,670) 1,400 (1,289) (11,524) 10,235 (1,939) (16,967) 15,028 (3,309)Ad Serving Fees (249) (459) 210 (660) (660) (1,309) (1,309) (2,566)TOTAL COST OF REVENUES (3,853) (7,590) 3,737 (8,549) (16,259) 7,710 (11,448) (23,662) 12,214 (17,675)
OP. EXPENSESWebsite/Technology
Streaming/Traffic (290) (697) 407 (360) (240) (120) (480) (240) (240) (600)Depreciation (1,166) (1,226) 60 (1,467) (672) (795) (1,612) (672) (940) (1,007)Amortization of Intangibles (1,090) (2,275) 1,185 (816) (2,856) 2,040 (816) (356) (460) (816)
Sub-Total Website/Technology (2,546) (4,199) 1,653 (2,643) (3,768) 1,125 (2,908) (1,268) (1,640) (2,423)Advertising/Marketing/Ad player (2,355) (5,562) 3,207 (4,000) (5,112) 1,112 (3,000) (7,899) 4,899 (3,000)General and Administrative (13,387) (16,734) 3,347 (10,000) (16,129) 6,129 (11,100) (20,136) 9,036 (16,521)Retention Bonus (2,500) (2,500) 0
TOTAL OP. EXPENSES (18,288) (26,495) 8,207 (16,643) (25,009) 8,366 (19,508) (31,803) 12,295 (21,944)
Minority Interest/Other Income (Exp) 3 5,281 (5,278)
EBIT ($18,200) ($18,200) ($0) ($10,022) $10,231 ($20,253) $44 $28,050 ($28,006) $10,381
Traffic Statistics (in millions)Onsite 224 1,167 (943) 1,195 5,095 (3,900) 2,450 9,286 (6,836) 4,868 Offsite 1,850 1,077 773 1,878 5,224 (3,346) 3,642 7,587 (3,945) 7,598
FY 2008 FY 2009 FY 2010


![Mid Range Plan Presentation Fiscal Year 2009-2011 October 2007 [DRAFT 09.19.07]](https://img.pdfslide.us/doc/110x75/56649ea45503460f94ba841a/mid-range-plan-presentation-fiscal-year-2009-2011-october-2007-draft-091907.jpg)