Embed Size (px)
Citation preview

MID-ATLANTIC STATES RACCOON RABIES OUTBREAK
Suzanne R . Jenkins, V.M.D., M.P,H ., Assistant State Epidemiologist, Division of Epidemiology, Virginia Department of Health, 109 Governor Street, Richmond, VA 23219 and William G. Winkler, D. V.M., M.S., Chief, Viral and Rickettsial Zoonoses Branch, Division of Viral Diseases, Centers for Disease Control, Atlanta, GA 30333
INTRODUCTION
In the mid-195Os, an outbreak ofraccoon rabies was recognized in South Florida and marked the beginning of epizootic/enzootic rabies in raccoons in this country . It spread at a rate of about 25 miles per year and currently includes eastern Alabama and most of Georgia and South Carolina. Up until the recent mid-Atlantic outbreak, the southern focus accounted for about 85 to 90% of the approximately 400 confirmed rabid raccoons reported in the United States each year .1-5
In 1977, one rabid raccoon was reported from West Virginia and in 1978, 3 from contiguous counties in Virginia . By 1979 there had been a total of 12 from both states. What were at first perceived as typical, isolated, sporadic cases were soon recognized as the beginning of a significant epizootic .5-7
Mid-1977 1978 1979 1980 1981 1982 October
1983 West Virginia
Virginia
Maryland
Penn .
D.C.
Total
3
3
8
4
12
14 22 43
7 102 645 7 118
21 131
26 5
837
Eighty-five percent of the rabid animals reported
83
489
591 58
139 1361
have been raccoons, but spillover to other species has occurred. Skunks have accounted for approximately 7% of the positive animals and foxes 1 %. At least 22 groundhogs, 2 opossums and 2 beavers have also been reported. Domestic animals affected have included 1 horse, 12 cows, 12 dogs and 39 cats . Nationally, more rabid cats than dogs have also been reported for the past 2 years .5 To date, no human cases are known to have occurred as a result of the Mid-Atlantic outbreak.
There are several theories on the origin of this epizootic. Direct extension from the southeast focus seems unlikely, given the gap of25O miles between the leading fronts of the 2 outbreaks ; surveillance should have detected the disease on its move northward .
293
Raccoons could initially have been infected by other indigenous vectors and have then established intraspecies transmission. There is a lack of good evidence to support this . West Virginia had reported little ter restrial rabies in the recent years prior to this raccoon outbreak . Similarly, Virginia had also been relatively free of terrestrial rabies, although the area presently affected with raccoon rabies had formerly been a major fox rabies area . Surveillance data suggest that the Virginia fox rabies problem had subsided dramatically at about the time the raccoon problem developed . The District of Columbia and Maryland had experienced only bat rabies for 20 years or more prior to this new outbreak.5 Bats are a possible source of infection for the raccoons, but bat rabies has rarely been thought to have much effect on terrestrial rabies . Recent monoclonal antibody studies at the Centers for Disease Con trol (CDC) support the contention that raccoons from the southeast and Mid-Atlantic areas are infected with a similar virus, but bats and Midwest skunks are in fected with strains that differ from that of the eastern raccoons .8
It is known that large numbers ofraccoons have regu larly been imported into Virginia and West Virginia by hunting clubs for restocking purposes .9,10 Most of these animals were taken from the rabies enzootic area of the southeast and rabies was confirmed in 1 such shipment of raccoons . IO Trans location seems a very plausible explanation for the origin of the new outbreak, but likely never will be proven .
The outbreak ofrabies in the Mid-Atlantic region is unique because of the species involved, because of the intensity of the epizootic and because it is occurring in an urban/suburban setting . There may be a significant relationship between these 3 features . The urbanized parts of our country appear to provide rac coons with an excellent habitat, resulting in unprece dented numbers of raccoons in these areas. These large raccoon populations which have had no prior experience with rabies are very susceptible and provide ideal conditions for the transmission of the disease. In addition, there is more opportunity for rabid animals to be observed, captured and tested because of the large human population living in close proximity to the raccoons .
Unfortunately, there are no effective methods known for directly controlling epidemics of rabies in wildlife . Trapping has been used extensively in some areas but has been shown to be oflimited usefulness . Effective rabies vaccines are not available for raccoons . Consequently, the only public health measures employed during this epidemic have been indirect ones; i.e., protecting human beings from transmission of the disease through their pets, by increasing the numbers of cats and dogs immunized against rabies and educating the

public about the potential dangers of contact with wild animals, especially raccoons.
MATERIALS AND METHODS
Since 1982, CDC and cooperating state and local health departments have been collecting data on the wildlife submitted for rabies testing and on the human/animal interactions that result in human exposure to rabies. A form (Figure 1) is completed by the local game or animal warden or local health department person with first hand knowledge of each circumstance. Presently, data on approximately 700 raccoons from 6 counties and cities in 4 states have been collected. This information does not necessarily include every raccoon submitted from any l jurisdiction during the entire 18 month period. For instance, the majority of information on positive raccoons is from 1982 in Loudoun and Fairfax counties of Virginia, whereas most of the information on negative animals comes from Washington, D.C. and includes both 1982 and 1983 data.
Figure 1. CDC Wildlife Rabies Outbreak Investigation
Source ofreport
County State
RESULTS-RACCOONS
Age determinations (Table 1) were based mainly on raccoon size although at least 1 locality used reproductive status and tooth wear. Approximately 20% of the raccoons on whom age was reported were identified as juveniles, and most (93%) of these were positive for rabies. Seventy-four percent of the adults were rabid.
Approximately half the animals on which sex was reported were males (Table 1). They had a positivity rate of74% while that for females was 92%.
Yards were the most frequent site of collection (Table 2). Sixteen percent of the animals were found in buildings; this included occupied houses as well as out buildings. Entrance to houses usually was through uncapped chimneys or open basement windows.
As shown in Table 3, residential was the most common land use reported at 68%; recreational, i.e., park land, was next at 13%, and agriculture land followed with 9%.
The most frequently reported method of collection was the "other" category (63%) (Table 4). This included raccoons captured by animal wardens and subse-
! 1-3) (4-5) (6-11) County Specimen ID No. ___________ _
Part I Animal Investigation
(12) 1. Species: l) Raccoon 2) Skunk 3) Fox 4) Other 9) Unknown
(13) 2. Age: 1) Juvenile 2) Adult 9) Unknown
(14) 3. Sex: 1) Male 2) Female 9) Unknown !15-20) 4. Dateanimalcollected ____________ _ Month, Day, Year
5. Location where human exposure occurred or where animal was collected,
ifno human exposure -------------------------------------
!21-27) 6. CDC grid number
(28) 7. Collection site characteristics: l) Yard 2) Building 3) Cultivated land 4) Unimproved land 5) Other 9) Unknown
!29) 8. Major land use at collection site: l) Residential 2) Agricultural 3) Commercial 4) Industrial 5) Recreational 6) Other 9) Unknown
<30) 9. How was animal collected: 1) Road kill 2) Found dead, cause unknown 3) Trapped, part of study 4) Trapped as nuisance by landowner/resident 6) Other 9) Unknown
!31) 10. Animal behavior/health at time of capture: I) Dead 2) Normal 3) Abnormal 9) Unknown
Circle any one or more that apply: 132) ll Sick 133) l) Aggressive 134) 1) Overly friendly 135) ll Wobbly gait !36) l l Paralyzed !37) I) Injured
138-40) 11. When was animal first observed? 1) Dawn 2) Daylight 3) Dusk 4) Dark 9) Unknown
(41) 12. Animal ownership: 1) Owned 2) Unowned 9) Unknown
!42) 13. Animal vaccinated against rabies: 1) Yes 2) No 9) Unknown
(43) 14. Was animal known to be bitten by proven/suspect rabid animal: 1) Yes 2) No 9) Unknown
(44-45) 15. Number of persons exposed to this animal:
(46) 16. If other animals were known to be exposed by this animal, identify : 1) Raccoon 2) Skunk 3) Fox 4) Dog 5) Cat 6) Other 9) Unknown/No
(47) 17. Laboratory results of animal examination for rabies: 1) Positive 2) Negative 3) Unsatisfactory specimen 4) Not submitted 9) Unknown
(continued next page)
294

Figure l. (continued)
Part II Human Exposure Investigation Patient Informatjon·
(48-53) County Specimen ID No. from Part I
(54) 1. Sex: 1) Male 2) Female 9) Unknown
(55-60l 2. Date of birth:
(61-66) 3. Dateofexposure
Month, Day, Year
Month,Day, Year
(67-69) 4. Hourofexposure -------4a.m.> (p.m .l Pleasecircleappropriate .
(70) 5. Site of exposure: ll Head/neck 2) Arm/hand 3) Leg/foot 4) Torso 9) Unknown
(71) 6. Type of exposure: 1) Single bite 2) Multiple bite 3) Scratch 4) Saliva in open wound 5) Saliva on mucous membrane 6) Touching animal 7) Skinning/dressing animal 8) Other 9) Unknown
(72) 7. Circumstancesofexposure: 1) Person approached animal 2) Animal approached person 3) Other 9) Unknown
(73) 8. Persons activity leading to exposure: 1) Petting animal 2) Feedinganimal 3) Skinning/dissecting animal 4) Eating animal 5) Attacked by animal 6) Separating fighting animals 7) Picking up animal 8> Playing with animal 9) Unknown
(74) 9. Was exposed person pre-immunized against rabies? 1) Yes 2) No 9l Unknown
(75) 10. Did person receive rabies postexposure treatment: 1) Yes 2) No 9) Unknown
Table l. Age and sex of raccoons submitted for rabies testing, Mid-Atlantic region, January 1982 - July 1983.
Number Number Age Rabid<%> Nonrabid (%) Total
Juvenile 80 (93) 6 (7) 86 Adult 247 ill2 87 (26) 334 Total 327 (78) 93 (22) 420
Sex Male 173 (74) 60 (26) 233 Femal£ 245 ~ 22 ill 267 Total 418 (84) 82 (16) 500
Table 2. Site of raccoon collection, Mid-Atlantic region, January 1982 - July 1983.
Number Number Site Rabid Nonrabid Total
Yard 219 29 248 (61)
Building 51 14 65 (16) Cultivated Area 56 12 68 <17) UnimprovedArea 8 0 8 (2)
Other 1§_ ! 19 \.§2
Total 349 59 408 (100)
Table 3. Land use at raccoon collection, Mid-Atlantic r-egion, January 1982 - July 1983.
Number Number Land Use Rabid Nonrabid Total(%)
Residential 144 86 230 (68) Agricultural 28 29 (9)
Commercial 3 15 18 (5) Industrial 3 4 (1) Recreatwnal 28 16 44 (13) Other ..l .!Q .!.l (3)
Total 207 129 336 I 100)
Table 4. Circumstances of r-accoon collection, Mid -Atlantic r-egion,January 1982 - July 1983.
Number '.If umber Circumstances Rabid Nonrabid Total<%>
Roadkill 21 14 35 15)
Found dead 121 12 133 120)
Trapped 21 52 • 73 ( 11)
"'Other 383 35 418 (63)
Total 546 113 659 I 100)
• Killed by citizens, killed by dog(s), or captured and euthanized by animal warden .
quently euthanized and animals killed by citizens and/or dogs . Although the number of negative animals for comparison is limited, a ranking of the collec tion methods by positivity rates revealed the follow ing: other (93%), found dead (90%), road kill (60%), trapped (29%).
As seen in Table 5, the majority !73%) of raccoons were first sighted during the day .
Over 50% of the raccoons submitted were dead at time of collection (Table 6) ; 33% were perceived as abnormal and 12% normal. The lowest positivity rate (45%) occurred in the normal group . The most frequently reported abnormalities were aggressiveness and wobbly gait (Table 7).
Approximately one third of the rabid raccoons exposed at least 1 domestic animal; most commonly a dog .
DISCUSSION· RACCOONS
Comparisons based on positivity rates cannot be weighed very heavily. Positivity rates are very dependent on the submission policies of the locality involved. In the Mid-Atlantic area, actual positivity rates ranged from 15% to 80% depending on the
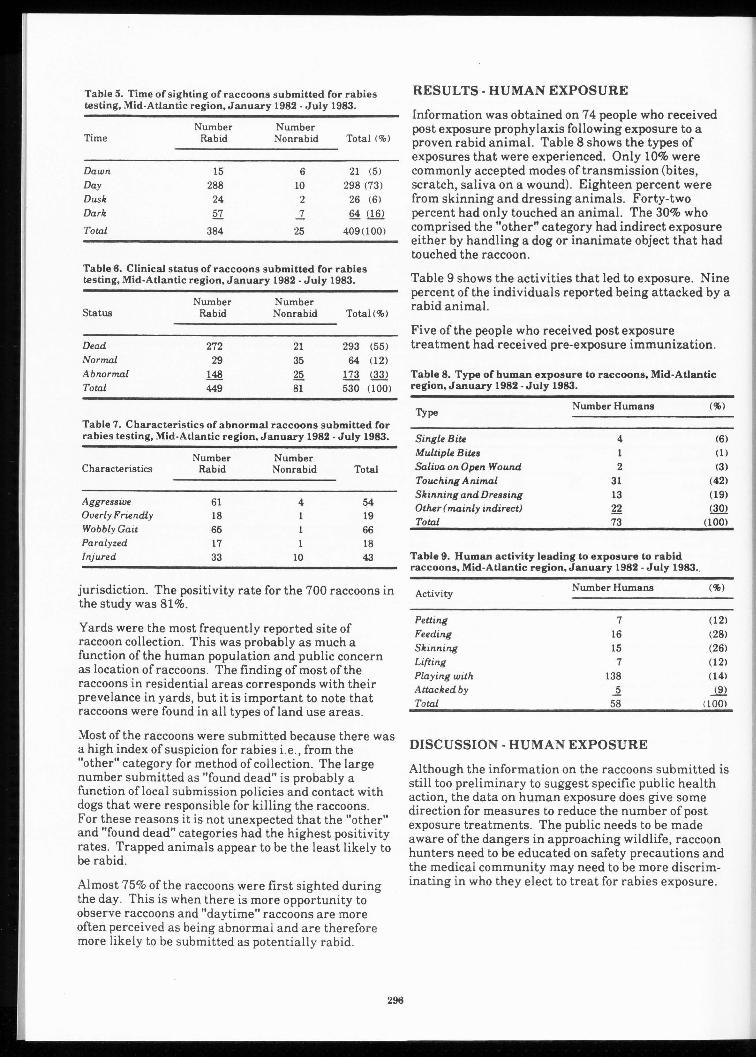
Table 5. Time of sighting of raccoons submitted for rabies testing, Mid-Atlantic region, January 1982 - July 1983.
Number Number Time Rabid Nonrab id Total( %)
Dawn 15 6 21 (5)
Day 288 10 298 (73) Dusk 24 2 26 (6)
Dark 57 ..1 64 ill.2 Total 384 25 409(100)
Table 6. Clinical status of raccoons submitted for rabies testing, Mid-Atlantic region, January 1982 - July 1983.
Number Number Status Rabid Nonrabid Total(%)
Dead 272 21 293 (55) Normal 29 35 64 (12) Abnormal 148 25 173 (33) Total 449 81 530 (100)
Table 7. Characteristics of abnormal raccoons submitted for rabies testing, Mid-Atlantic region, January 1982 - July 1983.
Number Number Characteristics Rabid Nonrabid Total
Aggressiue 61 4 54 Overly Friendty 18 19 Wobbly Gait 65 66 Paralyzed 17 1 18 lnjured 33 10 43
jurisdiction . The positivity rate for the 700 raccoons in the study was 81 %.
Yards were the most frequently reported site of raccoon collection . This was probably as much a function of the human population and public concern as location of raccoons . The finding of most of the raccoons in residential areas corresponds with their prevelance in yards, but it is important to note that raccoons were found in all types of land use areas .
Most of the raccoons were submitted because there was a high index of suspicion for rabies i.e., from the "other" category for method of collection. The large number submitted as "found dead" is probably a function oflocal submission policies and contact with dogs that were responsible for killing the raccoons . For these reasons it is not unexpected that the "other" and "found dead" categories had the highest positivity rates . Trapped animals appear to be the least likely to be rabid .
Almost 75% of the raccoons were first sighted dur ing the day. This is when there is more opportunity to observe raccoons and "daytime" raccoons are more often perceived as being abnormal and are therefore more likely to be submitted as potentiall y rabid .
296
RESULTS - HUMAN EXPOSURE
Information was obtained on 7 4 people who received post exposure prophylaxis following exposure to a proven rabid animal. Table 8 shows the types of exposures that were experienced . Only 10% were commonly accepted modes of transmission (bites, scratch, saliva on a wound) . Eighteen percent were from skinning and dressing animals . Forty-two percent had only touched an animal. The 30% who comprised the "other" category had indirect exposure either by handling a dog or inanimate object that had touched the raccoon.
Table 9 shows the activities that led to exposure . Nine percent of the individuals reported being attacked by a rabid animal.
Five of the people who received post exposure treatment had received pre-exposure immunization .
Table 8. Type of human exposure to raccoons, Mid-Atlantic region, January 1982 • July 1983.
Type
Single Biu Multiple Bius Saliva on Open Wound Touching Animal Skinning and Dresaing Other ( mainly indirect) Total
Number Humans
4
2
31 13 22 73
Table 9. Human activity leading to exposure to rabid raccoons , Mid-Atlantic region , January 1982 - July 1983 ..
Activity Number Humans
Petting 7 Feeding 16 Skinning 15 Li~ing 7 Play ing with 138 Attacked by ...§. Total 58
DISCUSSION - HUMAN EXPOSURE
(%)
(6)
(1)
(3)
(42) (19)
Q.Ql (100)
(%)
(12) (28) (26) (12) (14)
.J.fil. (100)
Although the information on the raccoons submitted is still too preliminary to suggest specific public health action, the data on human exposure does give some direction for measures to reduce the number of post exposure treatments . The public needs to be made aware of the dangers in approaching wildlife, raccoon hunters need to be educated on safety precautions and the medical community may need to be more discriminating in who they elect to treat for rabies exposure .

REFERENCES
1. Baer , G.M., ed . The Natural History of Rabies , Academic Press, N.Y., 1975 .
2. Bigler, W.J ., McLean , R.G., Trevino , H.A., Epizootiologic aspects ofraccoon rabies in Florida, Am. J . Epidemiol., 98, 236, 1973 .
3. McLean, R.G ., Rabies in raccoons in the ·southeastern United States, J . Infect . Dis ., 123, 680, 1971.
4. Kappus, K.D., Bigler, W.J ., McLean, R.G ., Trevino, H.A., The raccoon as an emerging rabies host, J . Wild!. Dis . 6, 507 , 1970 .
5. Centers for Disease Control, Rabies Surveillance Annual Summaries 1961-1982 .
6. Centers for Disease Control , '.Vlorbidity and Mortality Weekly Report, 31, 44 Nov . 12, 1982; 592-3.
7. Centers for Disease Control , Morbidity and Mortality Weekly Report , 32, 7 Feb . 25, 1983; 97-8 .
8. Smith, Jean, Rabies Isolates and Monoclonal Anti body presented at North American Symposium on Rabies in Wildlife , November 7 and 8, 1983, Baltimore, MD.
9. Haddy, L., State epidemiologist, West Virginia Department of Health , personal communication .
10. Miller , G.B., State epidemiologist, Virginia Department of Health, personal communication .
297