Embed Size (px)
Citation preview
J. Sep. Sci. 2013, 36, 781–788 781
Sarah Montesdeoca-Esponda
Zoraida Sosa-FerreraJose Juan Santana-
Rodrıguez
Departamento de Quımica,Universidad de Las Palmas deG.C., Las Palmas de G.C., Spain
Received July 11, 2012Revised October 31, 2012Accepted November 01, 2012
Research Article
Microwave-assisted extraction combinedwith on-line solid phase extraction followedby ultra-high-performance liquidchromatography with tandem massspectrometric determination of benzotriazoleUV stabilizers in marine sediments andsewage sludges
Benzotriazole ultra-violet stabilisers are compounds widely used in personal care products,which can reach the environment after passing through wastewater treatment plants. In thiswork, we develop a novel method to evaluate the presence of seven compounds in marinesediments and sewage sludges using microwave-assisted extraction followed by a clean-up step based in on-line solid phase extraction coupled to ultra-high-performance liquidchromatography with MS/MS detection. This method allows for fast and efficient extractionfrom the solid matrix, subsequent automatic on-line purification and preconcentration, andanalysis. For the optimised method, LOD were from 53.3 to 146 ng/kg and LOQ were inthe range of 176–486 ng/kg. The method was validated for different environmental solidsamples with satisfactory recoveries and relative standard deviations, between 46.1 and83.9 and 7.8 and 15.5% (sludges) and 50.1 and 87.1% and 8.83 and 16.3% (sediments),respectively. Finally, the studied analytes were quantified in concentrations between 0.18and 24.0 ng/g in real samples of marine sediments and sewage sludges from Gran CanariaIsland (Spain).
Keywords: Benzotriazole / Microwave-assisted extraction / Sludges / Solid phaseextraction / Ultra-violet stabilizersDOI 10.1002/jssc.201200664
1 Introduction
Benzotriazole ultra-violet stabilisers (BUVSs) belong to agroup of UV absorbing compounds that are considered to beemerging contaminants. These compounds are employed indifferent personal care products. The growing concern aboutthe link between sunlight exposure and skin cancer has ledto an increased use of BUVSs in sunscreens, soaps, sham-poos, lip gloss, hair dyes and makeup, due to the presenceof a phenolic group and benzotriazole structure that reflectand absorb the solar radiation (UVA 320–400 nm and UVB290–320 nm) [1]. The usual concentration of UV filters incosmetics is between 0.1 and 10% [2].
Correspondence: Professor Jose Juan Santana Rodriguez, Cam-pus Universitario de Tafira, Las Palmas de Gran Canaria, Las Pal-mas 35017, SpainE-mail: [email protected]: +34 928452922
Abbreviations: ASE, accelerated solvent extraction; BUVS,benzotriazole ultra-violet stabilizer; MAE, microwave-assistedextraction; UHPLC, ultra-high-performance liquid chromatog-raphy; WWTP, wastewater treatment plant
It is necessary to develop methods for investigatingthe presence of BUVSs in the environment because theyare not completely removed by wastewater treatment plants(WWTPs) and their continuous introduction through efflu-ents allows them to pseudo-persist [3]. The BUVSs com-pounds can also reach the environment from recreationalactivities such as swimming and bathing in oceans, lakes orrivers (direct inputs) [4]. Little information is available regard-ing the contamination of these organic UV filters in environ-mental samples, especially in solid samples where the morelipophilic compounds are accumulated. Relevant concentra-tions of BUVSs have been found in different sediment sam-ples [5,6] and sewage sludges [7]. The fact that the compoundsthat enter the environment in dissolved form can be accumu-lated in sediments implies that they can also be bioaccumu-lated in living organisms. Thus, some BUVSs have been de-tected in several marine organisms [8,9] and even in birds andmammals [10,11]. It has been demonstrated that their deriva-tives are mutagenic in bacterial systems and toxic in plants[12], and adverse effects on the fecundity and reproductionof fish have also been reported [13, 14]. Some of these com-pounds have been identified by the United States Environ-mental Protection Agency as inert ingredients of unknown
C© 2013 WILEY-VCH Verlag GmbH & Co. KGaA, Weinheim www.jss-journal.com
782 S. Montesdeoca-Esponda et al. J. Sep. Sci. 2013, 36, 781–788
toxicity (www.epa.gov/opprd001/inerts/oldlists.html). Re-cent papers have carried out toxicity studies of these sub-stances in aquatic species such as arthropods [15–17],chordates [18] and fishes [17].
The analysis of emerging contaminants in environmen-tal samples is characterized by the difficulty in the deter-mination of low concentrations in complex matrices. Theextraction of analytes from solid samples in environmen-tal applications presents added complications, because thesolute-matrix interactions are very difficult to predict andovercome [19]. In the literature we can find several extractionmethods employed for different compounds in solid samples:ultrasonic extraction, USE (acidic pharmaceuticals and phe-nolic endocrine disrupting chemicals in sewage sludge) [20],soxhlet extraction (4-nonylphenols, phthalates and polychlo-rinated biphenyls in soils and biosolids) [21], supercriticalfluid extraction (microbial phospholipid fatty acids in acti-vated sludge) [22], accelerated solvent extraction (ASE), (syn-thetic musks in lake sediment) [23], pressurised fluid ex-traction (polycyclic aromatic hydrocarbons in urban streetdust) [24] and focussed microwave-assisted extraction (theo-bromine and caffeine in cacao) [25].
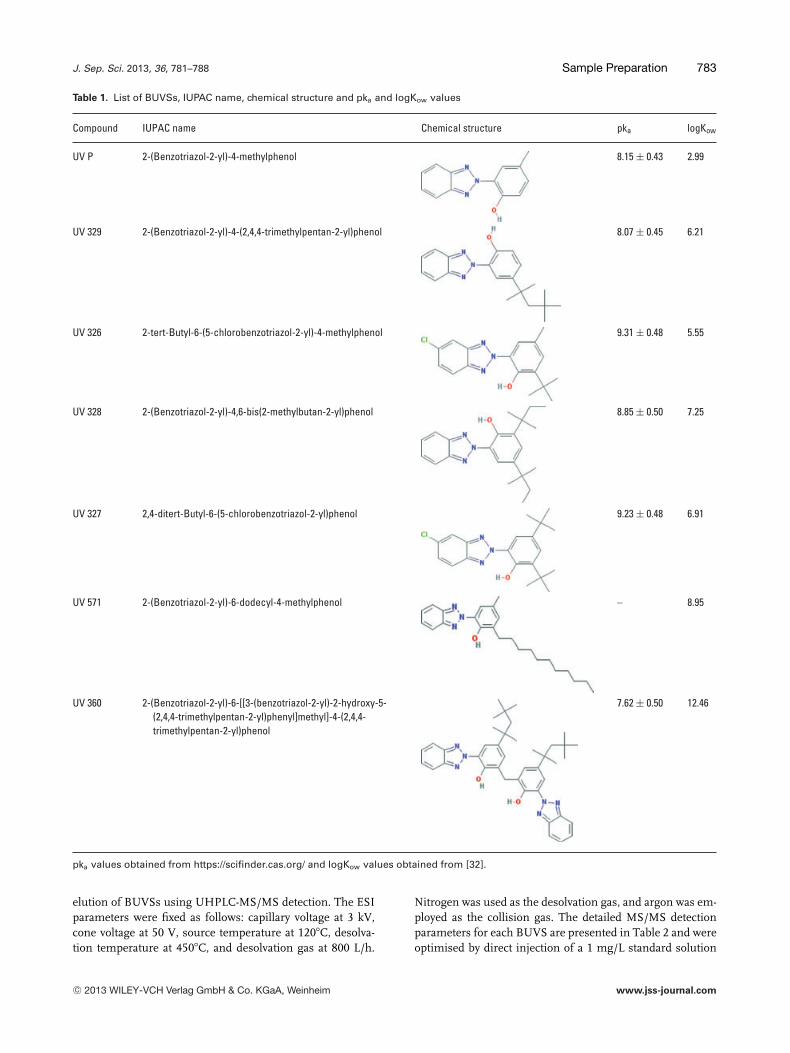
We chose microwave-assisted extraction (MAE) for theextraction of seven BUVSs (UV P, UV 329, UV 326, UV 328,UV 327, UV 571 and UV 360, Table 1) from different solidsamples (sewage sludges and marine sediments taken closeto shore and near to a marine outfall) prior to their deter-mination by ultra-high-performance liquid chromatography(UHPLC) with MS/MS. This method represents a viable alter-native to other methodologies, because it requires much lowervolumes of organic solvents, reduces extraction time and al-lows preparation of multiple samples in one single step [26].Other methods employed for BUVSs in solid samples re-quire large volume of strong solvents, such as ultrasonication(10 mL of dichloromethane and 10 mL of acetone) [6], succes-sive shaken (25 mL of ethylacetate/dichloromethane) [7] orSoxhlet apparatus (200 mL of dichloromethane/hexane) [9].
On the other hand, the extraction of the selected solidsamples requires the use of a clean-up step for purification,and this often causes the method becomes even more tediousand time consuming. This occurs in the study of Ruan et al.,where 12 BUVSs are determined in sewage sludges usingthree cycles of ASE. Then the extract is concentrated by evap-oration, fractionated on a gel permeation chromatographiccolumn, anew concentrated, passed through Florisil columnand concentrate once again before injecting [27]. Evapora-tion steps were needed also employing other extraction meth-ods [6, 7, 9].
To solve this problem, in this work an on-line SPE proce-dure coupled to a UHPLC system was selected as the cleaningand preconcentration protocol to be used prior to the deter-mination by mass spectrometry. This automated SPE systemminimises sample loss or contamination during handlingand improves the repeatability when compared with the con-ventional off-line SPE procedure. Evaporation/concentrationis not necessary. Moreover, the UHPLC technology provideshigh separation efficiency, enhances chromatographic resolu-
tion and leads to shorter analysis time [28–31]. The reductionof the total time employed in the preparation and analysis ofthe complex matrix is a very important aspect when a largenumber of samples are involved.
In this work, we optimised the parameters affecting themicrowave extraction process (i.e., extraction time, power andextractant volume) by means of an experimental design toachieve the maximum extraction efficiency for seven selectedanalytes. We then investigated the best conditions for puri-fying and analysing the MAE extract using an on-line SPE-UHLPC-MS/MS. Once each step of the procedure was opti-mised and validated, we evaluated the concentrations of theBUVSs in sediments close to shore and the sediments arounda marine outfall from several coastal points around Gran Ca-naria Island (Spain) that had not been studied previously.Sludge samples from different WWTPs were also analysed.
2 Experimental
2.1 Reagents
The benzotriazoles were obtained from Sigma-Aldrich(Madrid, Spain). Stock solutions (500 �g/mL) were preparedin methanol and stored in glass-stoppered bottles at 4�C priorto use. The mobile phase was prepared with LC-MS grademethanol and formic acid obtained from Panreac Quımica(Barcelona, Spain). The solvents used for the on-line SPEwere LC-MS grade methanol, LC-MS grade water, hexaneand acetone and were purchased from Panreac Quımica. The0.45-�m syringe-driven filter used for filtration of the MAEextract was provided by Scharlau Chemie (Barcelona, Spain).For the on-line SPE an Oasis HLB Direct Connect HP Col-umn (2.1 × 30 mm, 20 �m) from Waters (Madrid, Spain)was used.
2.2 Instrumentation
The microwave oven used for the extraction was a multiwavewith a 6 EVAP rotor and 6 MF100 vessels (Anton Paar, Graz,Austria).
The purification and analysis system included an AC-QUITY quaternary solvent manager to load samples, washand recondition the extraction column, an ACQUITY BinarySolvent Manager for the elution of the analytes, a columnmanager, a 2777 autosampler with 25 and 5000 �L syringesand trays for 2 and 20 mL vials, and an ACQUITY tandemtriple quadrupole mass spectrometer with an ESI interface.All components from Waters (Madrid, Spain) were controlledby MassLinx Mass Spectrometry Software.
2.3 Chromatographic conditions and mass detection
An ACQUITY UHPLC BEH Waters C18 column (50 ×2.1 mm, 1.7 �m particle size) at 40�C under a 100% methanolisocratic mobile phase adjusted to pH 2.5 with 0.1%, v/v,formic acid at a flow rate of 0.9 mL/min was used for the
C© 2013 WILEY-VCH Verlag GmbH & Co. KGaA, Weinheim www.jss-journal.com
J. Sep. Sci. 2013, 36, 781–788 Sample Preparation 783
Table 1. List of BUVSs, IUPAC name, chemical structure and pka and logKow values
Compound IUPAC name Chemical structure pka logKow
UV P 2-(Benzotriazol-2-yl)-4-methylphenol 8.15 ± 0.43 2.99
UV 329 2-(Benzotriazol-2-yl)-4-(2,4,4-trimethylpentan-2-yl)phenol 8.07 ± 0.45 6.21
UV 326 2-tert-Butyl-6-(5-chlorobenzotriazol-2-yl)-4-methylphenol 9.31 ± 0.48 5.55
UV 328 2-(Benzotriazol-2-yl)-4,6-bis(2-methylbutan-2-yl)phenol 8.85 ± 0.50 7.25
UV 327 2,4-ditert-Butyl-6-(5-chlorobenzotriazol-2-yl)phenol 9.23 ± 0.48 6.91
UV 571 2-(Benzotriazol-2-yl)-6-dodecyl-4-methylphenol – 8.95
UV 360 2-(Benzotriazol-2-yl)-6-[[3-(benzotriazol-2-yl)-2-hydroxy-5-(2,4,4-trimethylpentan-2-yl)phenyl]methyl]-4-(2,4,4-trimethylpentan-2-yl)phenol
7.62 ± 0.50 12.46
pka values obtained from https://scifinder.cas.org/ and logKow values obtained from [32].
elution of BUVSs using UHPLC-MS/MS detection. The ESIparameters were fixed as follows: capillary voltage at 3 kV,cone voltage at 50 V, source temperature at 120�C, desolva-tion temperature at 450�C, and desolvation gas at 800 L/h.
Nitrogen was used as the desolvation gas, and argon was em-ployed as the collision gas. The detailed MS/MS detectionparameters for each BUVS are presented in Table 2 and wereoptimised by direct injection of a 1 mg/L standard solution
C© 2013 WILEY-VCH Verlag GmbH & Co. KGaA, Weinheim www.jss-journal.com
784 S. Montesdeoca-Esponda et al. J. Sep. Sci. 2013, 36, 781–788
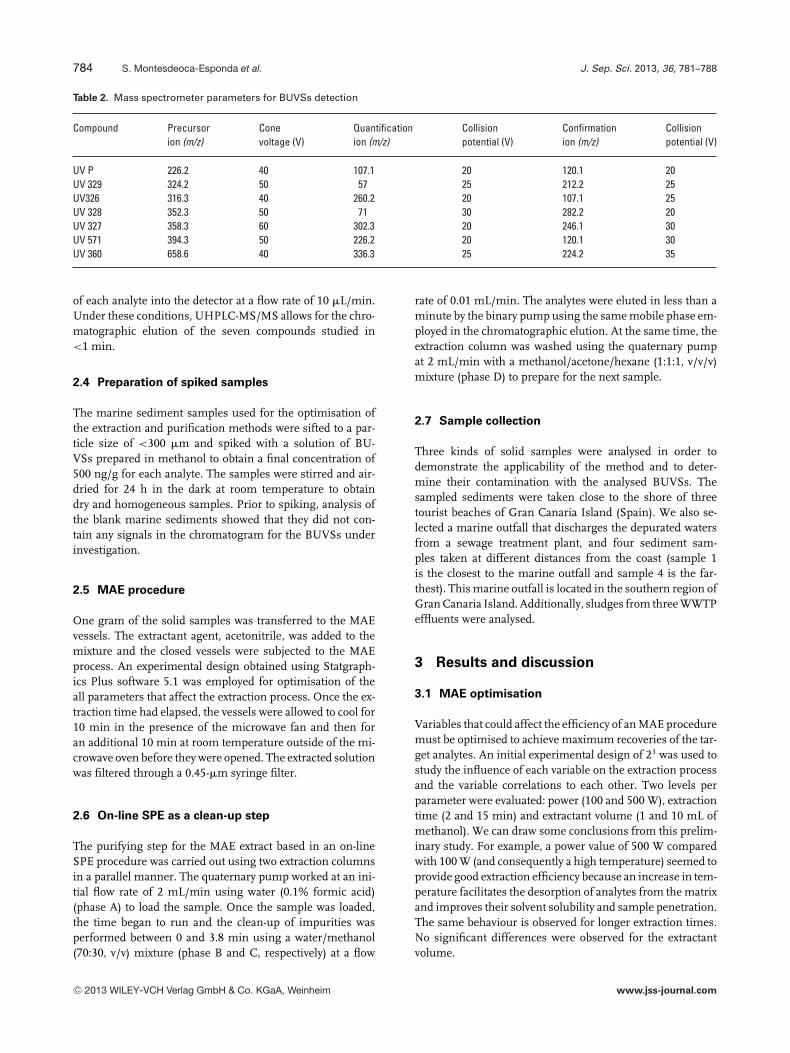
Table 2. Mass spectrometer parameters for BUVSs detection
Compound Precursor Cone Quantification Collision Confirmation Collisionion (m/z) voltage (V) ion (m/z) potential (V) ion (m/z) potential (V)
UV P 226.2 40 107.1 20 120.1 20UV 329 324.2 50 57 25 212.2 25UV326 316.3 40 260.2 20 107.1 25UV 328 352.3 50 71 30 282.2 20UV 327 358.3 60 302.3 20 246.1 30UV 571 394.3 50 226.2 20 120.1 30UV 360 658.6 40 336.3 25 224.2 35
of each analyte into the detector at a flow rate of 10 �L/min.Under these conditions, UHPLC-MS/MS allows for the chro-matographic elution of the seven compounds studied in<1 min.
2.4 Preparation of spiked samples
The marine sediment samples used for the optimisation ofthe extraction and purification methods were sifted to a par-ticle size of <300 �m and spiked with a solution of BU-VSs prepared in methanol to obtain a final concentration of500 ng/g for each analyte. The samples were stirred and air-dried for 24 h in the dark at room temperature to obtaindry and homogeneous samples. Prior to spiking, analysis ofthe blank marine sediments showed that they did not con-tain any signals in the chromatogram for the BUVSs underinvestigation.
2.5 MAE procedure
One gram of the solid samples was transferred to the MAEvessels. The extractant agent, acetonitrile, was added to themixture and the closed vessels were subjected to the MAEprocess. An experimental design obtained using Statgraph-ics Plus software 5.1 was employed for optimisation of theall parameters that affect the extraction process. Once the ex-traction time had elapsed, the vessels were allowed to cool for10 min in the presence of the microwave fan and then foran additional 10 min at room temperature outside of the mi-crowave oven before they were opened. The extracted solutionwas filtered through a 0.45-�m syringe filter.
2.6 On-line SPE as a clean-up step
The purifying step for the MAE extract based in an on-lineSPE procedure was carried out using two extraction columnsin a parallel manner. The quaternary pump worked at an ini-tial flow rate of 2 mL/min using water (0.1% formic acid)(phase A) to load the sample. Once the sample was loaded,the time began to run and the clean-up of impurities wasperformed between 0 and 3.8 min using a water/methanol(70:30, v/v) mixture (phase B and C, respectively) at a flow
rate of 0.01 mL/min. The analytes were eluted in less than aminute by the binary pump using the same mobile phase em-ployed in the chromatographic elution. At the same time, theextraction column was washed using the quaternary pumpat 2 mL/min with a methanol/acetone/hexane (1:1:1, v/v/v)mixture (phase D) to prepare for the next sample.
2.7 Sample collection
Three kinds of solid samples were analysed in order todemonstrate the applicability of the method and to deter-mine their contamination with the analysed BUVSs. Thesampled sediments were taken close to the shore of threetourist beaches of Gran Canaria Island (Spain). We also se-lected a marine outfall that discharges the depurated watersfrom a sewage treatment plant, and four sediment sam-ples taken at different distances from the coast (sample 1is the closest to the marine outfall and sample 4 is the far-thest). This marine outfall is located in the southern region ofGran Canaria Island. Additionally, sludges from three WWTPeffluents were analysed.
3 Results and discussion
3.1 MAE optimisation
Variables that could affect the efficiency of an MAE proceduremust be optimised to achieve maximum recoveries of the tar-get analytes. An initial experimental design of 23 was used tostudy the influence of each variable on the extraction processand the variable correlations to each other. Two levels perparameter were evaluated: power (100 and 500 W), extractiontime (2 and 15 min) and extractant volume (1 and 10 mL ofmethanol). We can draw some conclusions from this prelim-inary study. For example, a power value of 500 W comparedwith 100 W (and consequently a high temperature) seemed toprovide good extraction efficiency because an increase in tem-perature facilitates the desorption of analytes from the matrixand improves their solvent solubility and sample penetration.The same behaviour is observed for longer extraction times.No significant differences were observed for the extractantvolume.
C© 2013 WILEY-VCH Verlag GmbH & Co. KGaA, Weinheim www.jss-journal.com
J. Sep. Sci. 2013, 36, 781–788 Sample Preparation 785
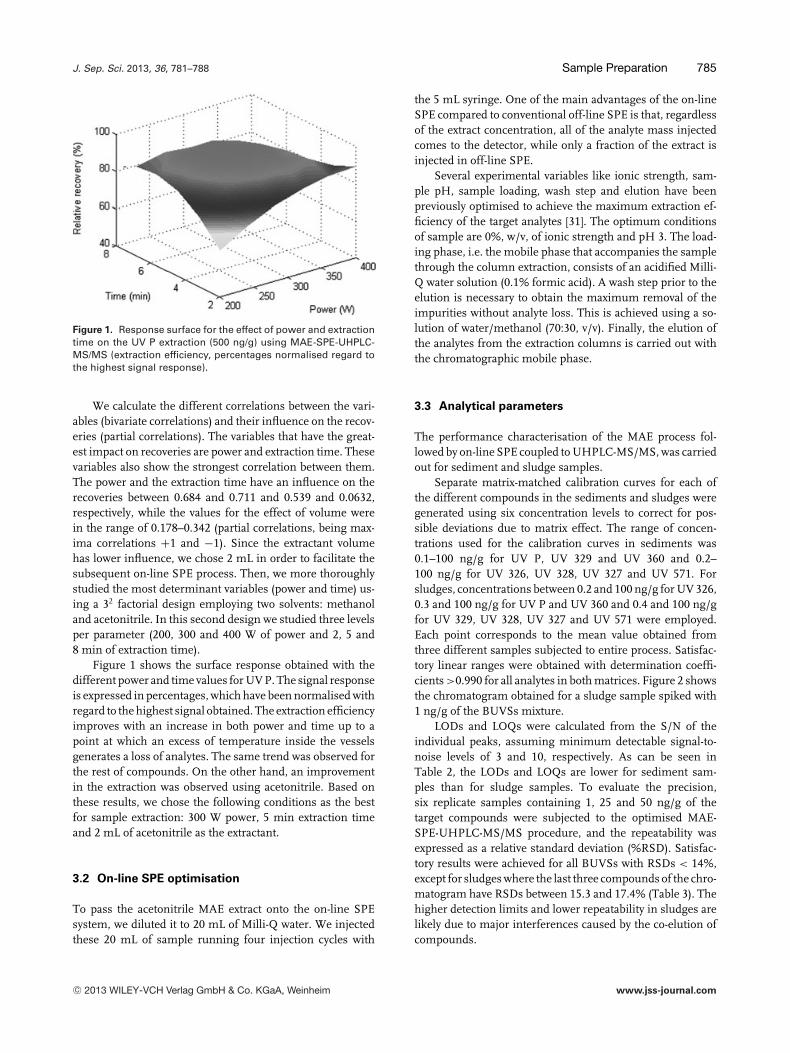
Figure 1. Response surface for the effect of power and extractiontime on the UV P extraction (500 ng/g) using MAE-SPE-UHPLC-MS/MS (extraction efficiency, percentages normalised regard tothe highest signal response).
We calculate the different correlations between the vari-ables (bivariate correlations) and their influence on the recov-eries (partial correlations). The variables that have the great-est impact on recoveries are power and extraction time. Thesevariables also show the strongest correlation between them.The power and the extraction time have an influence on therecoveries between 0.684 and 0.711 and 0.539 and 0.0632,respectively, while the values for the effect of volume werein the range of 0.178–0.342 (partial correlations, being max-ima correlations +1 and −1). Since the extractant volumehas lower influence, we chose 2 mL in order to facilitate thesubsequent on-line SPE process. Then, we more thoroughlystudied the most determinant variables (power and time) us-ing a 32 factorial design employing two solvents: methanoland acetonitrile. In this second design we studied three levelsper parameter (200, 300 and 400 W of power and 2, 5 and8 min of extraction time).
Figure 1 shows the surface response obtained with thedifferent power and time values for UV P. The signal responseis expressed in percentages, which have been normalised withregard to the highest signal obtained. The extraction efficiencyimproves with an increase in both power and time up to apoint at which an excess of temperature inside the vesselsgenerates a loss of analytes. The same trend was observed forthe rest of compounds. On the other hand, an improvementin the extraction was observed using acetonitrile. Based onthese results, we chose the following conditions as the bestfor sample extraction: 300 W power, 5 min extraction timeand 2 mL of acetonitrile as the extractant.
3.2 On-line SPE optimisation
To pass the acetonitrile MAE extract onto the on-line SPEsystem, we diluted it to 20 mL of Milli-Q water. We injectedthese 20 mL of sample running four injection cycles with
the 5 mL syringe. One of the main advantages of the on-lineSPE compared to conventional off-line SPE is that, regardlessof the extract concentration, all of the analyte mass injectedcomes to the detector, while only a fraction of the extract isinjected in off-line SPE.
Several experimental variables like ionic strength, sam-ple pH, sample loading, wash step and elution have beenpreviously optimised to achieve the maximum extraction ef-ficiency of the target analytes [31]. The optimum conditionsof sample are 0%, w/v, of ionic strength and pH 3. The load-ing phase, i.e. the mobile phase that accompanies the samplethrough the column extraction, consists of an acidified Milli-Q water solution (0.1% formic acid). A wash step prior to theelution is necessary to obtain the maximum removal of theimpurities without analyte loss. This is achieved using a so-lution of water/methanol (70:30, v/v). Finally, the elution ofthe analytes from the extraction columns is carried out withthe chromatographic mobile phase.
3.3 Analytical parameters
The performance characterisation of the MAE process fol-lowed by on-line SPE coupled to UHPLC-MS/MS, was carriedout for sediment and sludge samples.
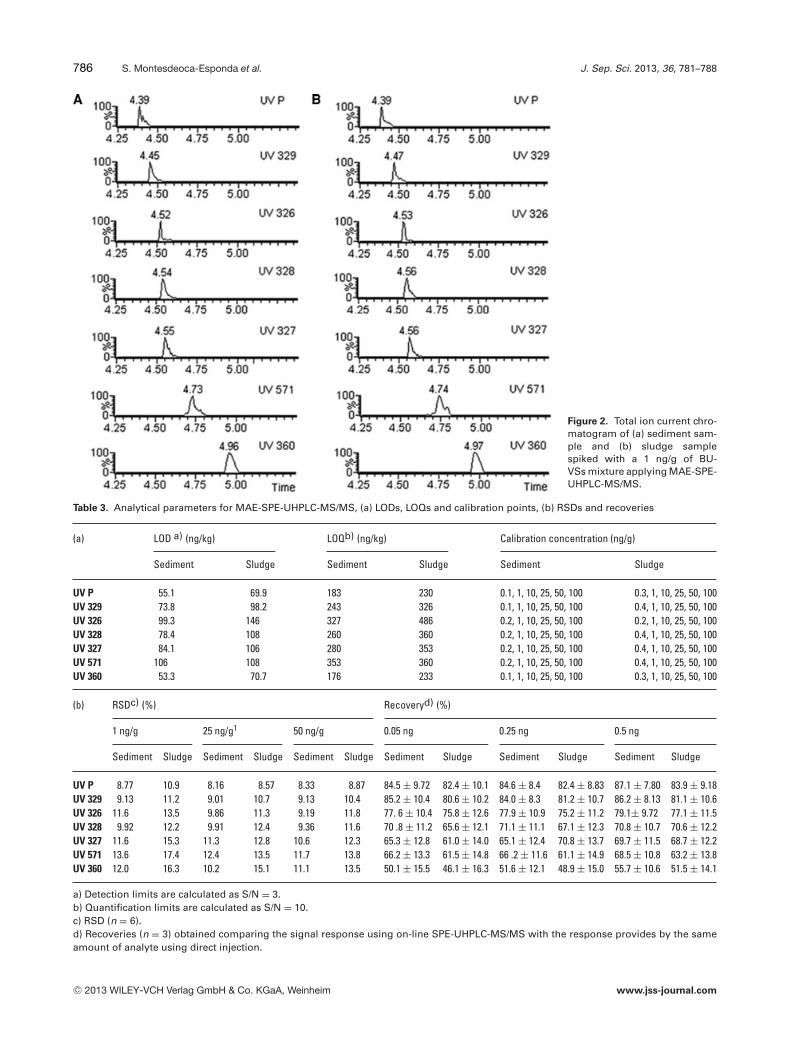
Separate matrix-matched calibration curves for each ofthe different compounds in the sediments and sludges weregenerated using six concentration levels to correct for pos-sible deviations due to matrix effect. The range of concen-trations used for the calibration curves in sediments was0.1–100 ng/g for UV P, UV 329 and UV 360 and 0.2–100 ng/g for UV 326, UV 328, UV 327 and UV 571. Forsludges, concentrations between 0.2 and 100 ng/g for UV 326,0.3 and 100 ng/g for UV P and UV 360 and 0.4 and 100 ng/gfor UV 329, UV 328, UV 327 and UV 571 were employed.Each point corresponds to the mean value obtained fromthree different samples subjected to entire process. Satisfac-tory linear ranges were obtained with determination coeffi-cients >0.990 for all analytes in both matrices. Figure 2 showsthe chromatogram obtained for a sludge sample spiked with1 ng/g of the BUVSs mixture.
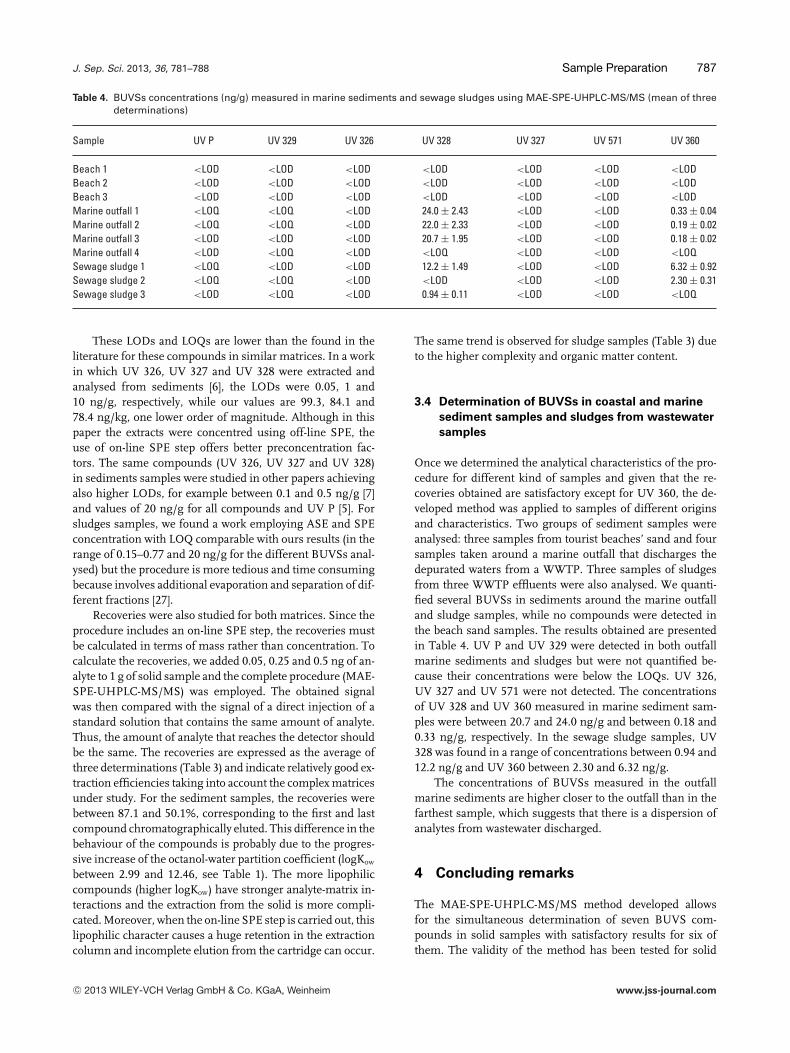
LODs and LOQs were calculated from the S/N of theindividual peaks, assuming minimum detectable signal-to-noise levels of 3 and 10, respectively. As can be seen inTable 2, the LODs and LOQs are lower for sediment sam-ples than for sludge samples. To evaluate the precision,six replicate samples containing 1, 25 and 50 ng/g of thetarget compounds were subjected to the optimised MAE-SPE-UHPLC-MS/MS procedure, and the repeatability wasexpressed as a relative standard deviation (%RSD). Satisfac-tory results were achieved for all BUVSs with RSDs < 14%,except for sludges where the last three compounds of the chro-matogram have RSDs between 15.3 and 17.4% (Table 3). Thehigher detection limits and lower repeatability in sludges arelikely due to major interferences caused by the co-elution ofcompounds.
C© 2013 WILEY-VCH Verlag GmbH & Co. KGaA, Weinheim www.jss-journal.com
786 S. Montesdeoca-Esponda et al. J. Sep. Sci. 2013, 36, 781–788
Figure 2. Total ion current chro-matogram of (a) sediment sam-ple and (b) sludge samplespiked with a 1 ng/g of BU-VSs mixture applying MAE-SPE-UHPLC-MS/MS.
Table 3. Analytical parameters for MAE-SPE-UHPLC-MS/MS, (a) LODs, LOQs and calibration points, (b) RSDs and recoveries
(a) LOD a) (ng/kg) LOQb) (ng/kg) Calibration concentration (ng/g)
Sediment Sludge Sediment Sludge Sediment Sludge
UV P 55.1 69.9 183 230 0.1, 1, 10, 25, 50, 100 0.3, 1, 10, 25, 50, 100UV 329 73.8 98.2 243 326 0.1, 1, 10, 25, 50, 100 0.4, 1, 10, 25, 50, 100UV 326 99.3 146 327 486 0.2, 1, 10, 25, 50, 100 0.2, 1, 10, 25, 50, 100UV 328 78.4 108 260 360 0.2, 1, 10, 25, 50, 100 0.4, 1, 10, 25, 50, 100UV 327 84.1 106 280 353 0.2, 1, 10, 25, 50, 100 0.4, 1, 10, 25, 50, 100UV 571 106 108 353 360 0.2, 1, 10, 25, 50, 100 0.4, 1, 10, 25, 50, 100UV 360 53.3 70.7 176 233 0.1, 1, 10, 25, 50, 100 0.3, 1, 10, 25, 50, 100
(b) RSDc) (%) Recoveryd) (%)
1 ng/g 25 ng/g1 50 ng/g 0.05 ng 0.25 ng 0.5 ng
Sediment Sludge Sediment Sludge Sediment Sludge Sediment Sludge Sediment Sludge Sediment Sludge
UV P 8.77 10.9 8.16 8.57 8.33 8.87 84.5 ± 9.72 82.4 ± 10.1 84.6 ± 8.4 82.4 ± 8.83 87.1 ± 7.80 83.9 ± 9.18UV 329 9.13 11.2 9.01 10.7 9.13 10.4 85.2 ± 10.4 80.6 ± 10.2 84.0 ± 8.3 81.2 ± 10.7 86.2 ± 8.13 81.1 ± 10.6UV 326 11.6 13.5 9.86 11.3 9.19 11.8 77. 6 ± 10.4 75.8 ± 12.6 77.9 ± 10.9 75.2 ± 11.2 79.1± 9.72 77.1 ± 11.5UV 328 9.92 12.2 9.91 12.4 9.36 11.6 70 .8 ± 11.2 65.6 ± 12.1 71.1 ± 11.1 67.1 ± 12.3 70.8 ± 10.7 70.6 ± 12.2UV 327 11.6 15.3 11.3 12.8 10.6 12.3 65.3 ± 12.8 61.0 ± 14.0 65.1 ± 12.4 70.8 ± 13.7 69.7 ± 11.5 68.7 ± 12.2UV 571 13.6 17.4 12.4 13.5 11.7 13.8 66.2 ± 13.3 61.5 ± 14.8 66 .2 ± 11.6 61.1 ± 14.9 68.5 ± 10.8 63.2 ± 13.8UV 360 12.0 16.3 10.2 15.1 11.1 13.5 50.1 ± 15.5 46.1 ± 16.3 51.6 ± 12.1 48.9 ± 15.0 55.7 ± 10.6 51.5 ± 14.1
a) Detection limits are calculated as S/N = 3.b) Quantification limits are calculated as S/N = 10.c) RSD (n = 6).d) Recoveries (n = 3) obtained comparing the signal response using on-line SPE-UHPLC-MS/MS with the response provides by the sameamount of analyte using direct injection.
C© 2013 WILEY-VCH Verlag GmbH & Co. KGaA, Weinheim www.jss-journal.com
J. Sep. Sci. 2013, 36, 781–788 Sample Preparation 787
Table 4. BUVSs concentrations (ng/g) measured in marine sediments and sewage sludges using MAE-SPE-UHPLC-MS/MS (mean of threedeterminations)
Sample UV P UV 329 UV 326 UV 328 UV 327 UV 571 UV 360
Beach 1 <LOD <LOD <LOD <LOD <LOD <LOD <LODBeach 2 <LOD <LOD <LOD <LOD <LOD <LOD <LODBeach 3 <LOD <LOD <LOD <LOD <LOD <LOD <LODMarine outfall 1 <LOQ <LOQ <LOD 24.0 ± 2.43 <LOD <LOD 0.33 ± 0.04Marine outfall 2 <LOQ <LOQ <LOD 22.0 ± 2.33 <LOD <LOD 0.19 ± 0.02Marine outfall 3 <LOD <LOD <LOD 20.7 ± 1.95 <LOD <LOD 0.18 ± 0.02Marine outfall 4 <LOD <LOQ <LOD <LOQ <LOD <LOD <LOQSewage sludge 1 <LOQ <LOD <LOD 12.2 ± 1.49 <LOD <LOD 6.32 ± 0.92Sewage sludge 2 <LOQ <LOQ <LOD <LOD <LOD <LOD 2.30 ± 0.31Sewage sludge 3 <LOD <LOQ <LOD 0.94 ± 0.11 <LOD <LOD <LOQ
These LODs and LOQs are lower than the found in theliterature for these compounds in similar matrices. In a workin which UV 326, UV 327 and UV 328 were extracted andanalysed from sediments [6], the LODs were 0.05, 1 and10 ng/g, respectively, while our values are 99.3, 84.1 and78.4 ng/kg, one lower order of magnitude. Although in thispaper the extracts were concentred using off-line SPE, theuse of on-line SPE step offers better preconcentration fac-tors. The same compounds (UV 326, UV 327 and UV 328)in sediments samples were studied in other papers achievingalso higher LODs, for example between 0.1 and 0.5 ng/g [7]and values of 20 ng/g for all compounds and UV P [5]. Forsludges samples, we found a work employing ASE and SPEconcentration with LOQ comparable with ours results (in therange of 0.15–0.77 and 20 ng/g for the different BUVSs anal-ysed) but the procedure is more tedious and time consumingbecause involves additional evaporation and separation of dif-ferent fractions [27].
Recoveries were also studied for both matrices. Since theprocedure includes an on-line SPE step, the recoveries mustbe calculated in terms of mass rather than concentration. Tocalculate the recoveries, we added 0.05, 0.25 and 0.5 ng of an-alyte to 1 g of solid sample and the complete procedure (MAE-SPE-UHPLC-MS/MS) was employed. The obtained signalwas then compared with the signal of a direct injection of astandard solution that contains the same amount of analyte.Thus, the amount of analyte that reaches the detector shouldbe the same. The recoveries are expressed as the average ofthree determinations (Table 3) and indicate relatively good ex-traction efficiencies taking into account the complex matricesunder study. For the sediment samples, the recoveries werebetween 87.1 and 50.1%, corresponding to the first and lastcompound chromatographically eluted. This difference in thebehaviour of the compounds is probably due to the progres-sive increase of the octanol-water partition coefficient (logKow
between 2.99 and 12.46, see Table 1). The more lipophiliccompounds (higher logKow) have stronger analyte-matrix in-teractions and the extraction from the solid is more compli-cated. Moreover, when the on-line SPE step is carried out, thislipophilic character causes a huge retention in the extractioncolumn and incomplete elution from the cartridge can occur.
The same trend is observed for sludge samples (Table 3) dueto the higher complexity and organic matter content.
3.4 Determination of BUVSs in coastal and marine
sediment samples and sludges from wastewater
samples
Once we determined the analytical characteristics of the pro-cedure for different kind of samples and given that the re-coveries obtained are satisfactory except for UV 360, the de-veloped method was applied to samples of different originsand characteristics. Two groups of sediment samples wereanalysed: three samples from tourist beaches’ sand and foursamples taken around a marine outfall that discharges thedepurated waters from a WWTP. Three samples of sludgesfrom three WWTP effluents were also analysed. We quanti-fied several BUVSs in sediments around the marine outfalland sludge samples, while no compounds were detected inthe beach sand samples. The results obtained are presentedin Table 4. UV P and UV 329 were detected in both outfallmarine sediments and sludges but were not quantified be-cause their concentrations were below the LOQs. UV 326,UV 327 and UV 571 were not detected. The concentrationsof UV 328 and UV 360 measured in marine sediment sam-ples were between 20.7 and 24.0 ng/g and between 0.18 and0.33 ng/g, respectively. In the sewage sludge samples, UV328 was found in a range of concentrations between 0.94 and12.2 ng/g and UV 360 between 2.30 and 6.32 ng/g.
The concentrations of BUVSs measured in the outfallmarine sediments are higher closer to the outfall than in thefarthest sample, which suggests that there is a dispersion ofanalytes from wastewater discharged.
4 Concluding remarks
The MAE-SPE-UHPLC-MS/MS method developed allowsfor the simultaneous determination of seven BUVS com-pounds in solid samples with satisfactory results for six ofthem. The validity of the method has been tested for solid
C© 2013 WILEY-VCH Verlag GmbH & Co. KGaA, Weinheim www.jss-journal.com
788 S. Montesdeoca-Esponda et al. J. Sep. Sci. 2013, 36, 781–788
samples of different origin and physical characteristics, andits application to the analysis of environmental sediments andsewage sludges reveals the presence of BUVSs. Although theextraction method shows some limitations for the most ap-olar compounds, the combination of the preconcentrationprovided by the SPE procedure and the efficiency and sensi-tivity of the UHPLC-MS/MS system allows the achievementof very low detection limits, between 53.3 and 146 ng/kg forthis kind of analytes. In addition to sensitivity, on-line SPEcoupled to UHPLC-MS/MS provides high selectivity, morerepeatability, minimum sample preparation and automationof the process.
The concentrations measured in the sludge samples in-dicate that, due to the physico-chemical characteristics, anappreciable amount of the studied compounds that entersinto WWTPs is accumulated in this kind of solid matrices.An accumulation of BUVSs in the sediments around the ma-rine outfall also occurs.
This procedure is a viable, selective and easy analyticaltool that can be used on environmental samples or solid prod-ucts from WWTPs.
This work was supported by funds provided by the SpanishMinistry of Science and Innovation, Research Project CTQ2010–20554. Sarah Montesdeoca Esponda would like to thank the Ca-nary Agency of Investigation, Innovation and Information Societyfor her PhD Student Grant.
The authors have declared no conflict of interest.
5 References
[1] Dıaz-Cruz, M. S., Llorca, M., Barcelo, D., Trends Anal.Chem. 2008, 27, 873–887.
[2] De Orsi, D., Giannini, G., Gagliardi, L., Porra, R., Berri,S., Bolasco, A., Carpani, I., Tonelli, D., Chromatographia2006, 64, 509–515.
[3] Barcelo, D., Trends Anal. Chem. 2007, 26, 454–455.
[4] Balmer, M. E., Buser, H. R., Muller, M. D., Poiger, T., En-viron. Sci. Technol. 2005, 39, 953–962.
[5] Reddy, C. M., Quinn, J.G, King, J. W., Environ. Sci. Tech-nol. 2000, 34, 973–979.
[6] Kameda, Y., Kimura, K., Miyazaki, M., Environ. Pollut.2011, 159, 1570–1576.
[7] Zhang, Z., Ren, N., Li, Y., Kunisue, T., Gao, D., Kannan,K., Environ. Sci. Technol. 2011, 45, 3909–3916.
[8] Kim, J. W., Ramaswamy, B. R., Chang, K. H., Isobe, T.,Tanabe, S., J. Chromatogr. A 2011, 1218, 3511–3520.
[9] Nakata, H., Murata, M., Filatreau, J., Environ. Sci. Tech-nol. 2009, 43, 6920–6926.
[10] Nakata, H., Murata, M., Shinohara, R., Filatreau, J., Isobe,T., Takahashi, S., Tanabe, S., Int. Stud. Environ. Chem.2009, 2, 239–246.
[11] Nakata, H., Shinohara, R., Murata, S., Watanabe, M., J.Environ. Monit. 2010, 12, 2088–2092.
[12] Farre, M. I., Perez, S., Kantiani, L., Barcelo, D., TrendsAnal. Chem. 2008, 27, 991–1007.
[13] Kunz, P. Y., Fent, K., Aquat. Toxicol. 2006, 79, 305–324.
[14] Fent, K., Kunz, P. Y., Gomez, E., Chimia 2008, 62, 368–375.
[15] Kim, J. W., Chang, K. H., Isobe, T., Tanabe, S., J. Toxicol.Sci. 2011, 36, 247–251.
[16] Fent, K., Kunz, P. Y., Zenker, A., Rapp, M., Mar. Environ.Res. 2010, 69, S4-S6.
[17] Pillard, D. A., Cornell, J. S., Dufresne, D. L., Hernandez,M. T., Water Res. 2001, 35, 557–560.
[18] Kadar, E., Dashfield, S., Hutchinson, T. H., Anal. Bional.Chem. 2010, 396, 641–647.
[19] Camel, V., Analyst 2001, 126, 1182–1193.
[20] Samaras, V. G., Thomaidis, N. S., Stasinakis, A. S.,Lekkas, T. D., Anal. Bioanal. Chem. 2011, 399, 2549–2561.
[21] Gibson, R., Wang, M. J., Padgett, E., Beck, A. J., Chemo-sphere 2005, 61, 1336–1344.
[22] Hanif, M., Atsuta, Y., Fujie, K., Daimon, H., J. Chromatogr.A 2010, 1217, 6704–6708.
[23] Che, J. S., Yu, R. P., Song, Q. J., Wang, L. P., Wu, S. F., Int.J. Environ. Anal. Chem. 2011, 91, 387–399.
[24] Lorenzi, D., Entwistle, J. A, Cave, M., Dean, J. R., Chemo-sphere 2011, 83, 970–977.
[25] Gonzalez-Nunez, L. N., Canizares-Macıas, M. P., FoodChem. 2011, 129, 1819–1824.
[26] Esteve-Turrillas, F. A., Aman, C. S, Pastor, A., DeLa Guardia, M., Anal. Chim. Acta 2004, 522, 73–78.
[27] Ruan, T., Liu, R., Fu, Q., Wang, T., Wang, Y., Song, S.,Wang, P., Teng, M., Jiang, G., Environ. Sci. Technol. 2012,46, 2071–2079.
[28] Zhou, Y., Huang, S. X., Pu, J. X., Li, J. R., Ding, L. S., Chen,D. F., Sun, H. D., Xu, H. X., J. Pharm. Biomed. 2011, 56,916–927.
[29] Qin, F. Liu, L., Wu, H., Zhu, G., Adv. Mater. Res. 2012, 343,855–861.
[30] Klapoetke, S. C., Zhang, J., Becht, S., J. Pharm. Biomed.2011, 56, 513–520.
[31] Montesdeoca-Esponda, S., Sosa-Ferrera, Z., Santana-Rodriguez, J. J, Anal. Bioanal. Chem. 2012, 403, 867–876.
[32] US EPA, Estimation Programs Interface SuiteTM v4.10,United States Environmental Protection 319 Agency,Washington, DC, USA 2011.
C© 2013 WILEY-VCH Verlag GmbH & Co. KGaA, Weinheim www.jss-journal.com