Embed Size (px)
Citation preview
A
ogpuohap2t©
K
1
iieemrTttsl
1d
Available online at www.sciencedirect.com
Journal of Chromatography B, 862 (2008) 100–112
Development of a liquid chromatography–tandem mass spectrometrymethod for the determination of 23 endogenous steroids
in small quantities of primate urine
Barbara Hauser ∗, Tobias Deschner, Christophe BoeschMax Planck Institute for Evolutionary Anthropology, Department of Primatology,
Deutscher Platz 6, D-04103 Leipzig, Germany
Received 26 June 2007; accepted 7 November 2007Available online 19 November 2007
bstract
A quantitative method using liquid chromatography–tandem mass spectrometry (LC–MS–MS) was developed for the simultaneous determinationf 23 endogenous steroids in primate urine. The introduced method includes estrone, pregnandiol, cortisol, testosterone and several human urinarylucocorticoid and androgen metabolites. As the method is intended for the analysis of steroid hormones in behavioral studies on wild-livingrimates, it was adapted for a sample volume of 200 �L urine. The sample preparation consisted of an enzymatic hydrolysis of steroid glucuronidessing �-glucuronidase from E. coli followed by a solvolytic cleavage of steroid sulfates employing sulfuric acid/ethyl acetate. The extractionf steroids from urine was optimized with respect to pH during extraction, type of ether and the amount of enzyme necessary for completeydrolysis of glucuronides. The recovery of steroids spiked into urine before hydrolysis was 58.9–103.7% with an intra-day precision of 2.7–14.3%nd an inter-day precision of 2.9–14.8%. Detection limits ranged from 0.1–0.5 ng/mL. The reproducibility of the whole sample preparation
rocess was also demonstrated for unspiked urine (CV 1.2–16.5%). The proportion of steroid hormone excreted as sulfate was determined for1 steroids in chimpanzee urine. The solvolysis proved to be essential for all investigated steroids except for pregnandiol, tetrahydrocortisol andetrahydrocortisone, which were found to be less then 10% in the solvolysis fraction. 2007 Elsevier B.V. All rights reserved.ous st
ahf4tnttlub
eywords: Primate urine; Cortisol; Testosterone; Estrone; Pregnandiol; Endogen
. Introduction
The analysis of steroid hormone concentrations in non-nvasively collected samples has become increasingly importantn a variety of behavioral ecology study contexts such as thevaluation of reproductive status, the impact of stress or thexpression of aggression [1–4]. With respect to non-human pri-ates, hormonal analyses have been carried out mostly with
adioimmunoassays (RIA) or enzyme immunoassays (EIA).hese methods have proven to be cost-effective and sensitive, but
hey have limitations with respect to specificity [5]. An impor-
ant point is that the assays can show cross-reactivities of thepecific antibody with other steroids that have different physio-ogical functions than the hormone of interest [6,7]. For example,∗ Corresponding author. Tel.: +49 341 3550 231; fax: +49 341 3550 299.E-mail address: [email protected] (B. Hauser).
csatTbk
570-0232/$ – see front matter © 2007 Elsevier B.V. All rights reserved.oi:10.1016/j.jchromb.2007.11.009
eroids; Liquid chromatography–mass spectrometry; Solvolysis; Steroid sulfates
group-specific antibody raised against 11-oxoetiocholanoloneas been suggested for monitoring adrenocortical activity ineces of several primate species [7]. However, this assay has.8% cross-reactivity towards etiocholanolone, which is a quan-itatively important metabolite of testosterone. Given the greatumber of steroid metabolites present in urine, the determina-ion of all relevant cross-reactivities is a difficult task. Therefore,he identity and the origin of the immunoreactive metabo-ites responsible for the response of the assay remain partiallynclear. These uncertainties can lead to controversial results inehavioral endocrinological studies. For instance, the use of aortisol-directed antibody has been described for monitoringtress reactions in fecal extracts of chimpanzees [8]. However,s known from a radio metabolism study, native cortisol is vir-
ually absent in the feces of the macaque and chimpanzee [9].herefore, the response measured must be exclusively causedy cross-reacting metabolites, whose identity is not exactlynown. Because different behavioral ecologists use different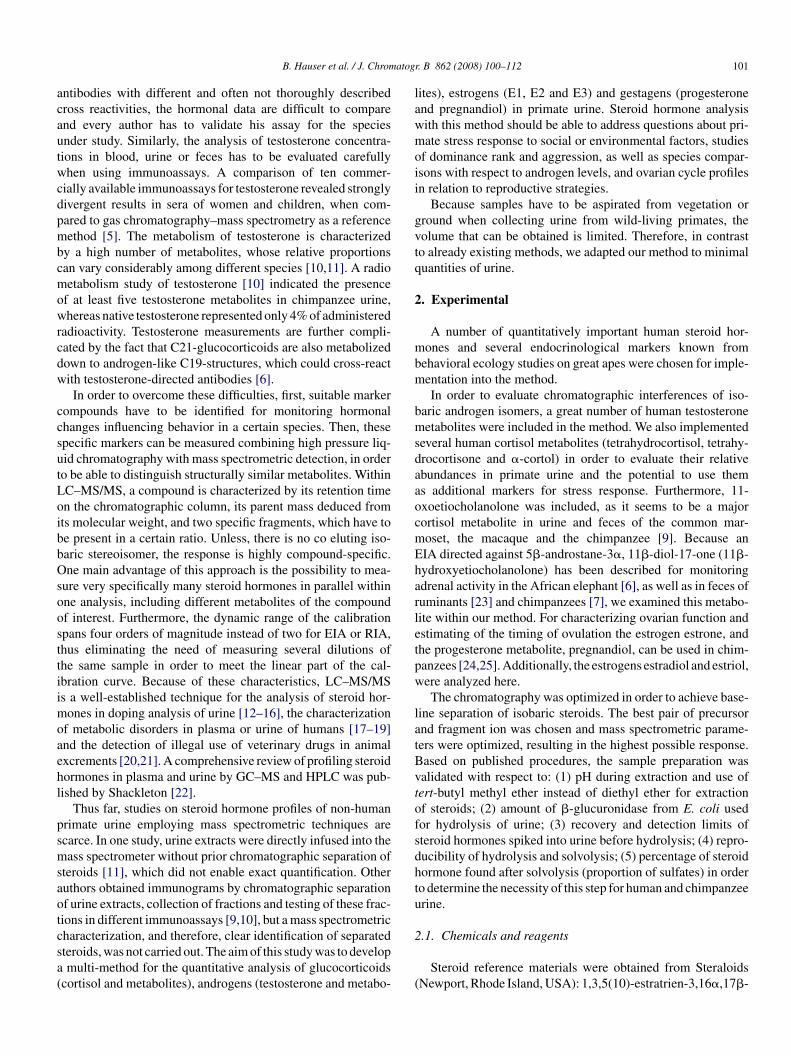
atog
acautwcdpmbcmowrcdw
ccsutLoibbOsoosttiimoaehl
psmsaotcsa(
lawmoii
gvtq
2
mbm
bmsdaaocmEharletpw
latBvtofsdhtu
B. Hauser et al. / J. Chrom
ntibodies with different and often not thoroughly describedross reactivities, the hormonal data are difficult to comparend every author has to validate his assay for the speciesnder study. Similarly, the analysis of testosterone concentra-ions in blood, urine or feces has to be evaluated carefullyhen using immunoassays. A comparison of ten commer-
ially available immunoassays for testosterone revealed stronglyivergent results in sera of women and children, when com-ared to gas chromatography–mass spectrometry as a referenceethod [5]. The metabolism of testosterone is characterized
y a high number of metabolites, whose relative proportionsan vary considerably among different species [10,11]. A radioetabolism study of testosterone [10] indicated the presence
f at least five testosterone metabolites in chimpanzee urine,hereas native testosterone represented only 4% of administered
adioactivity. Testosterone measurements are further compli-ated by the fact that C21-glucocorticoids are also metabolizedown to androgen-like C19-structures, which could cross-reactith testosterone-directed antibodies [6].In order to overcome these difficulties, first, suitable marker
ompounds have to be identified for monitoring hormonalhanges influencing behavior in a certain species. Then, thesepecific markers can be measured combining high pressure liq-id chromatography with mass spectrometric detection, in ordero be able to distinguish structurally similar metabolites. WithinC–MS/MS, a compound is characterized by its retention timen the chromatographic column, its parent mass deduced fromts molecular weight, and two specific fragments, which have toe present in a certain ratio. Unless, there is no co eluting iso-aric stereoisomer, the response is highly compound-specific.ne main advantage of this approach is the possibility to mea-
ure very specifically many steroid hormones in parallel withinne analysis, including different metabolites of the compoundf interest. Furthermore, the dynamic range of the calibrationpans four orders of magnitude instead of two for EIA or RIA,hus eliminating the need of measuring several dilutions ofhe same sample in order to meet the linear part of the cal-bration curve. Because of these characteristics, LC–MS/MSs a well-established technique for the analysis of steroid hor-
ones in doping analysis of urine [12–16], the characterizationf metabolic disorders in plasma or urine of humans [17–19]nd the detection of illegal use of veterinary drugs in animalxcrements [20,21]. A comprehensive review of profiling steroidormones in plasma and urine by GC–MS and HPLC was pub-ished by Shackleton [22].
Thus far, studies on steroid hormone profiles of non-humanrimate urine employing mass spectrometric techniques arecarce. In one study, urine extracts were directly infused into theass spectrometer without prior chromatographic separation of
teroids [11], which did not enable exact quantification. Otheruthors obtained immunograms by chromatographic separationf urine extracts, collection of fractions and testing of these frac-ions in different immunoassays [9,10], but a mass spectrometric
haracterization, and therefore, clear identification of separatedteroids, was not carried out. The aim of this study was to developmulti-method for the quantitative analysis of glucocorticoidscortisol and metabolites), androgens (testosterone and metabo-
2
(
r. B 862 (2008) 100–112 101
ites), estrogens (E1, E2 and E3) and gestagens (progesteronend pregnandiol) in primate urine. Steroid hormone analysisith this method should be able to address questions about pri-ate stress response to social or environmental factors, studies
f dominance rank and aggression, as well as species compar-sons with respect to androgen levels, and ovarian cycle profilesn relation to reproductive strategies.
Because samples have to be aspirated from vegetation orround when collecting urine from wild-living primates, theolume that can be obtained is limited. Therefore, in contrasto already existing methods, we adapted our method to minimaluantities of urine.
. Experimental
A number of quantitatively important human steroid hor-ones and several endocrinological markers known from
ehavioral ecology studies on great apes were chosen for imple-entation into the method.In order to evaluate chromatographic interferences of iso-
aric androgen isomers, a great number of human testosteroneetabolites were included in the method. We also implemented
everal human cortisol metabolites (tetrahydrocortisol, tetrahy-rocortisone and �-cortol) in order to evaluate their relativebundances in primate urine and the potential to use thems additional markers for stress response. Furthermore, 11-xoetiocholanolone was included, as it seems to be a majorortisol metabolite in urine and feces of the common mar-oset, the macaque and the chimpanzee [9]. Because anIA directed against 5�-androstane-3�, 11�-diol-17-one (11�-ydroxyetiocholanolone) has been described for monitoringdrenal activity in the African elephant [6], as well as in feces ofuminants [23] and chimpanzees [7], we examined this metabo-ite within our method. For characterizing ovarian function andstimating of the timing of ovulation the estrogen estrone, andhe progesterone metabolite, pregnandiol, can be used in chim-anzees [24,25]. Additionally, the estrogens estradiol and estriol,ere analyzed here.The chromatography was optimized in order to achieve base-
ine separation of isobaric steroids. The best pair of precursornd fragment ion was chosen and mass spectrometric parame-ers were optimized, resulting in the highest possible response.ased on published procedures, the sample preparation wasalidated with respect to: (1) pH during extraction and use ofert-butyl methyl ether instead of diethyl ether for extractionf steroids; (2) amount of �-glucuronidase from E. coli usedor hydrolysis of urine; (3) recovery and detection limits ofteroid hormones spiked into urine before hydrolysis; (4) repro-ucibility of hydrolysis and solvolysis; (5) percentage of steroidormone found after solvolysis (proportion of sulfates) in ordero determine the necessity of this step for human and chimpanzeerine.
.1. Chemicals and reagents
Steroid reference materials were obtained from SteraloidsNewport, Rhode Island, USA): 1,3,5(10)-estratrien-3,16�,17�-
1 matog
t33222213oooa4s3(53(d((TaCp(Gmaa
fHpN(Kt(barTEM
2
qg
(r(
2a0rBait
2
dwga21osw5ctDswdcrtHT
2f
(op2caopfct6r
02 B. Hauser et al. / J. Chro
riol (estriol, E3); 1,3,5(10)-estratrien-3ol-17-on (estrone, E1);, 5(10)-estratrien-3, 17�-diol (�-estradiol, E2); 5�-pregnan-�, 11�, 17, 20�, 21-pentol (�-cortol); 4-pregnene-11�, 17,1-triol-3, 20-dione (cortisol, C); 5�-Pregnan-3�, 11�, 17,1-tetrol-20-one (tetrahydrocortisol); 5�-pregnan-3�, 11�, 17,1-tetrol-20-one (allotetrahydrocortisol); 5�-pregnan-3�,17�,1-triol-11,20-dione (tetrahydrocortisone); 5�-androstane-3�,1�-diol-17-one (11�-hydroxyetiocholanolone); 5�-androsten-�-ol-11, 17-dione (11-oxoetiocholanolone, 11-oxo); 4-andr-stene-17�-ol-3-one (testosterone, T); 4-androstene-17�-ol-3-ne 17-glucuronide (testosterone glucuronide, TG); 4-andr-sten-17� -methyl-17�-ol-3-on (methyl testosterone); 5-ndrostene-3�-ol-17-one (dehydroepiandrosterone, DHEA);-androstene-17�-ol-3-one (epitestosterone, epiT); 5�-andro-tan-3�-ol-17-on (epiandrosterone, epiA); 5�-androstan-�,17�-diol (androstandiol); 5�-androstan-17�-ol-3-onDHT); 5�-Androstan-3�-ol-17-on (epietiocholanolone,epiE);�-androstan-3�-ol-17-on (etiocholanolone, E); 5�-androstan-.17-dion (androstandione); 5�-androstan-3�-ol-17-onandrosterone, A); 5�-androstan-17�-ol-3-on (epiallodihy-rotestosterone); 5�-pregnan-3�-20�-diol 3-glucoronidepregnandiol glucuronide, PdG); 5�-pregnan-3�-20�-diolpregnandiol, Preg); 4-pregnen-3,20-dion (progesterone).he deuterated internal standards 16,16,17-d3-testosteronend 2,4,16,16-d4-estrone were supplied by Sigma Chemicalo.(St. Louis, MO, USA), while 2,2,4,6,6,17,21,21,21-d9-rogesterone (d9-progesterone) and 9,11,12,12-d4-cortisold4-cortisol) were purchased from Dr. Ehrenstorfer (Augsburg,ermany). Standard solutions were prepared at 1 mg/mL inethanol and stored at −20 ◦C. A mix standard was prepared
t 10 �g/mL in methanol and diluted to give working solutionst 0.1–1000 ng/mL with 30% acetonitrile in water.
LC–MS grade methanol and acetonitrile, together withormic acid, were purchased from Fluka (Chromasolv, Riedel-deaen/Fluka, Buchs, Switzerland). Water for chromatogra-hy was gradient grade (Mallinckrodt Baker, Phillipsburg,J, USA). For extraction of steroids, tert-butyl methyl ether
TBME) (VWR, Darmstadt, Germany) and ethyl acetate (Roth,arlsruhe, Germany) were used. Deionized water for prepara-
ion of buffers came from a MilliQ® water purification systemMillipore, Bedford, MA, USA). The buffer salts potassium car-onate, sodium acetate, sodium dihydrogen phosphate, as wells disodium hydrogen phosphate, sodium hydroxide and sulfu-ic acid (98%) were supplied by VWR (Darmstadt, Germany).he lyophilized enzyme, �-glucuronidase type VII-A from. coli, was purchased from Sigma Chemical Co. (St. Louis,O, USA).
.2. Liquid chromatography
A Waters Alliance 2695 separation module, equipped with auaternary pump and a column oven, was used for chromato-raphic separation (Waters, Milford, MA, USA).
Separation was achieved at 30 ◦C on a Gemini C18 column150 mm × 2 mm, 3 �m), protected by a guard column (Secu-ity Guard 4 mm × 2 mm, 5 �m) of the same stationary phasePhenomenex, Torrance, CA, USA). The injection volume was
fatH
r. B 862 (2008) 100–112
0 �L. Eluent A was composed of water/acetonitrile (95/5, v/v)nd eluent B of acetonitrile/water (95/5, v/v), both containing.1% formic acid. A gradient elution was performed at a flowate of 0.2 mL/min: 30% B (0–2 min), linear increase to 70%
(2–20 min), 90% B (21–24 min), 30% B (24–34 min). Theutosampler tray was cooled to 5 ◦C. Due to the use of 150 �Lnserts in the HPLC vials, the injection depth had to be adjustedo 2 mm.
.3. Mass spectrometry
The analyses were carried out on a Quattro Premier XE tan-em mass spectrometer (Micromass, Manchester, UK) equippedith a Z spray ESI interface. Nitrogen (NGM-11 nitrogenenerator, CMC Instruments, Eschborn, Germany) was useds desolvation and cone gas, with flow rates of 900 L/h and50 L/h, respectively. Source and desolvation temperature were00 and 450 ◦C, respectively. The electric potential appliedn the capillary was 3.8 V, and the sample cone voltage waset individually for each compound. LC–MS/MS experimentsere performed using argon as collision gas at a pressure of.1 × 10−3 mbar and a collision energy setting adapted for eachompound. Steroids were detected using multiple reaction moni-oring (MRM) of the two most abundant product ions per analyte.well time for each transition was 50 ms. For identification of
teroids in urine extracts, the ion ratio of the two transitionsas not allowed to exceed more than 30% compared to stan-ards. The optimization of mass spectrometer parameters wasarried out by infusing standards of 1 or 5 ng/�L at a flowate of 10 �L/min into a carrier stream of 200 �L/min ace-onitrile/water/formic acid (50/50/0.1, v/v/v) generated by thePLC pump. Compound specific MRM parameters are listed inable 1.
.4. Enzymatic hydrolysis of urine with β-glucuronidaserom E. coli
Lyophilized �-glucuronidase type VII-A from E. coli25,000 U) was dissolved in 5 mL HPLC water. Each samplef 200 �L urine was diluted with 800 �L of 0.25 M potassiumhosphate buffer (pH 6.9). Then 40 �L enzyme (200 U) and0 �L of an internal standard mix, containing 250 ng/mL d4-ortisol, d4-estrone, d3-testosterone and d9-progesterone, weredded. The phosphate buffer was prepared by mixing 35 mLf 0.5 M sodium dihydrogen phosphate, 65 mL 0.5 M disodiumhosphate and 100 mL water. Samples were incubated at 37 ◦Cor 22 h under gentle agitation. Then, 150 �L 10% potassiumarbonate was added in order to stop the enzymatic reaction ando adjust the sample pH to 9.6. Steroids were extracted by addingmL TBME and vortexing for 10 min. Afterwards phase sepa-
ation was achieved by centrifugation at 1500 rpm for 5 min and
reezing at −21 ◦C for at least 3 h. The ether phase was decantednd evaporated with pressurized air. The residue was reconsti-uted in 100 �L 30% acetonitrile in water and transferred to anPLC vial.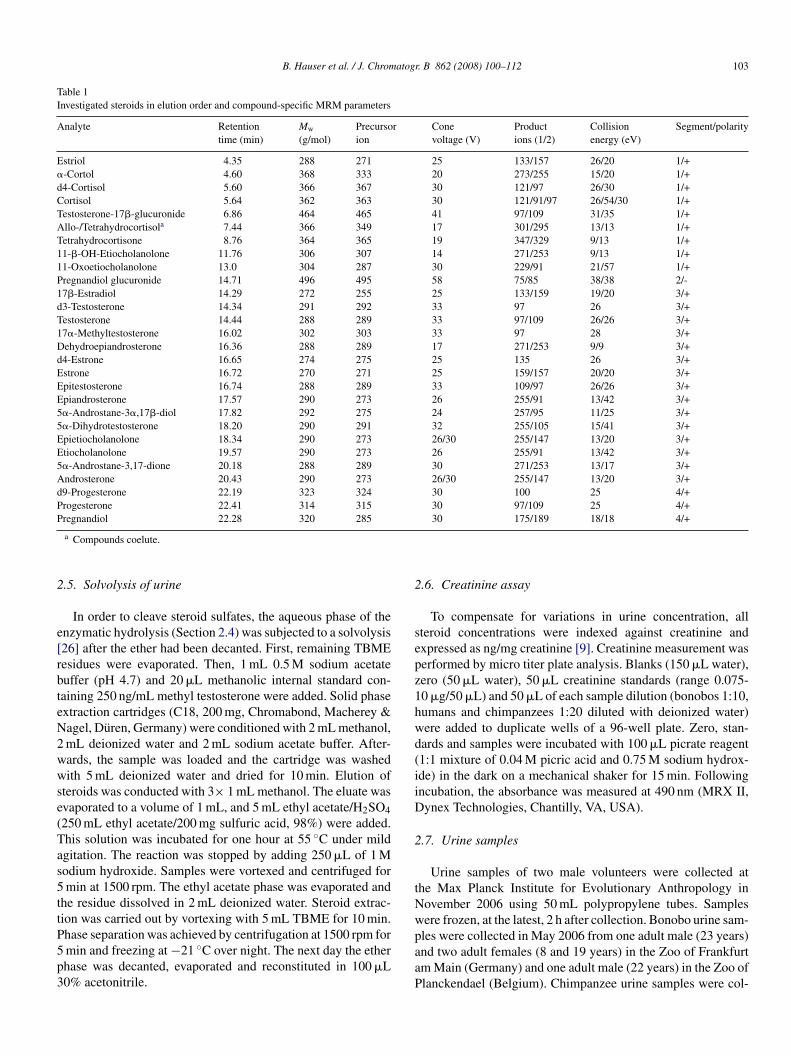
B. Hauser et al. / J. Chromatogr. B 862 (2008) 100–112 103
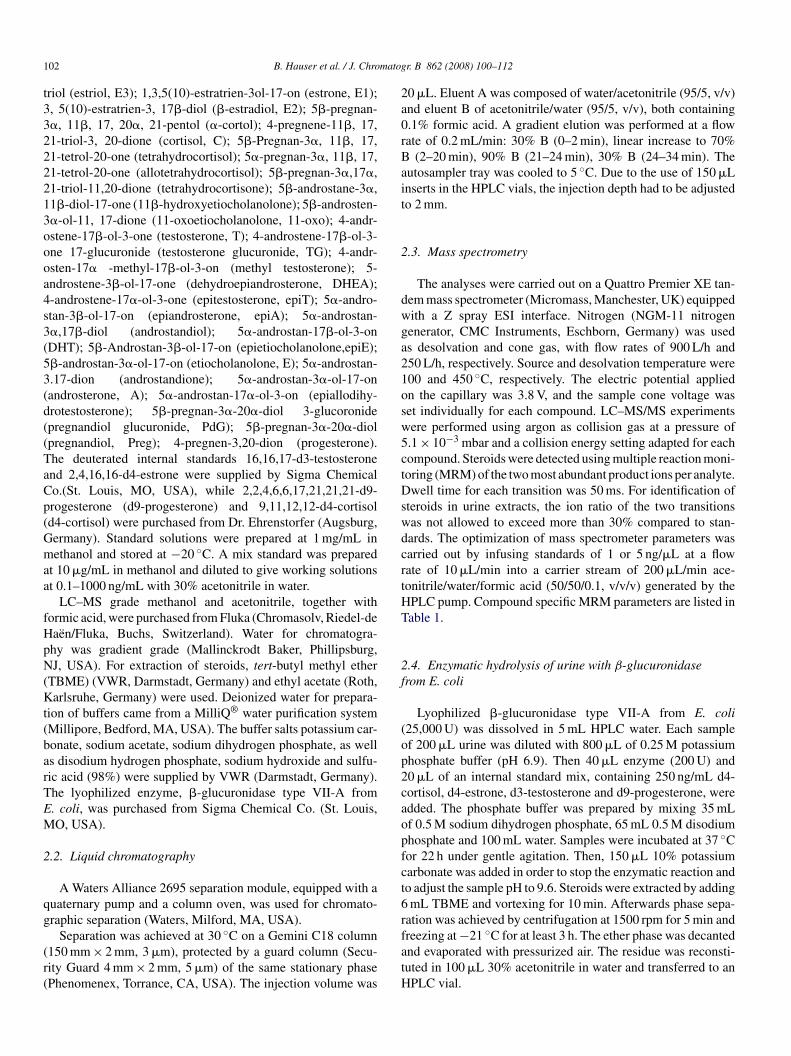
Table 1Investigated steroids in elution order and compound-specific MRM parameters
Analyte Retentiontime (min)
Mw
(g/mol)Precursorion
Conevoltage (V)
Productions (1/2)
Collisionenergy (eV)
Segment/polarity
Estriol 4.35 288 271 25 133/157 26/20 1/+�-Cortol 4.60 368 333 20 273/255 15/20 1/+d4-Cortisol 5.60 366 367 30 121/97 26/30 1/+Cortisol 5.64 362 363 30 121/91/97 26/54/30 1/+Testosterone-17�-glucuronide 6.86 464 465 41 97/109 31/35 1/+Allo-/Tetrahydrocortisola 7.44 366 349 17 301/295 13/13 1/+Tetrahydrocortisone 8.76 364 365 19 347/329 9/13 1/+11-�-OH-Etiocholanolone 11.76 306 307 14 271/253 9/13 1/+11-Oxoetiocholanolone 13.0 304 287 30 229/91 21/57 1/+Pregnandiol glucuronide 14.71 496 495 58 75/85 38/38 2/-17�-Estradiol 14.29 272 255 25 133/159 19/20 3/+d3-Testosterone 14.34 291 292 33 97 26 3/+Testosterone 14.44 288 289 33 97/109 26/26 3/+17�-Methyltestosterone 16.02 302 303 33 97 28 3/+Dehydroepiandrosterone 16.36 288 289 17 271/253 9/9 3/+d4-Estrone 16.65 274 275 25 135 26 3/+Estrone 16.72 270 271 25 159/157 20/20 3/+Epitestosterone 16.74 288 289 33 109/97 26/26 3/+Epiandrosterone 17.57 290 273 26 255/91 13/42 3/+5�-Androstane-3�,17�-diol 17.82 292 275 24 257/95 11/25 3/+5�-Dihydrotestosterone 18.20 290 291 32 255/105 15/41 3/+Epietiocholanolone 18.34 290 273 26/30 255/147 13/20 3/+Etiocholanolone 19.57 290 273 26 255/91 13/42 3/+5�-Androstane-3,17-dione 20.18 288 289 30 271/253 13/17 3/+Androsterone 20.43 290 273 26/30 255/147 13/20 3/+d9-Progesterone 22.19 323 324 30 100 25 4/+Progesterone 22.41 314 315 30 97/109 25 4/+P
2
e[rbteN2wwse(Tas5ttP5p3
2
sepz1hwd(iiD
2
tNw
regnandiol 22.28 320 285
a Compounds coelute.
.5. Solvolysis of urine
In order to cleave steroid sulfates, the aqueous phase of thenzymatic hydrolysis (Section 2.4) was subjected to a solvolysis26] after the ether had been decanted. First, remaining TBMEesidues were evaporated. Then, 1 mL 0.5 M sodium acetateuffer (pH 4.7) and 20 �L methanolic internal standard con-aining 250 ng/mL methyl testosterone were added. Solid phasextraction cartridges (C18, 200 mg, Chromabond, Macherey &agel, Duren, Germany) were conditioned with 2 mL methanol,mL deionized water and 2 mL sodium acetate buffer. After-ards, the sample was loaded and the cartridge was washedith 5 mL deionized water and dried for 10 min. Elution of
teroids was conducted with 3× 1 mL methanol. The eluate wasvaporated to a volume of 1 mL, and 5 mL ethyl acetate/H2SO4250 mL ethyl acetate/200 mg sulfuric acid, 98%) were added.his solution was incubated for one hour at 55 ◦C under mildgitation. The reaction was stopped by adding 250 �L of 1 Modium hydroxide. Samples were vortexed and centrifuged formin at 1500 rpm. The ethyl acetate phase was evaporated and
he residue dissolved in 2 mL deionized water. Steroid extrac-ion was carried out by vortexing with 5 mL TBME for 10 min.
hase separation was achieved by centrifugation at 1500 rpm formin and freezing at −21 ◦C over night. The next day the etherhase was decanted, evaporated and reconstituted in 100 �L0% acetonitrile.paaP
30 175/189 18/18 4/+
.6. Creatinine assay
To compensate for variations in urine concentration, allteroid concentrations were indexed against creatinine andxpressed as ng/mg creatinine [9]. Creatinine measurement waserformed by micro titer plate analysis. Blanks (150 �L water),ero (50 �L water), 50 �L creatinine standards (range 0.075-0 �g/50 �L) and 50 �L of each sample dilution (bonobos 1:10,umans and chimpanzees 1:20 diluted with deionized water)ere added to duplicate wells of a 96-well plate. Zero, stan-ards and samples were incubated with 100 �L picrate reagent1:1 mixture of 0.04 M picric acid and 0.75 M sodium hydrox-de) in the dark on a mechanical shaker for 15 min. Followingncubation, the absorbance was measured at 490 nm (MRX II,ynex Technologies, Chantilly, VA, USA).
.7. Urine samples
Urine samples of two male volunteers were collected athe Max Planck Institute for Evolutionary Anthropology inovember 2006 using 50 mL polypropylene tubes. Samplesere frozen, at the latest, 2 h after collection. Bonobo urine sam-
les were collected in May 2006 from one adult male (23 years)nd two adult females (8 and 19 years) in the Zoo of Frankfurtm Main (Germany) and one adult male (22 years) in the Zoo oflanckendael (Belgium). Chimpanzee urine samples were col-
1 matog
lfiftmf(dkoa
uatw2
2
2
t2tdmoaoudionacl
2
fwwtcvapa
2
sib8
cdrbspi
2
2ut
aac
2
pp2iats
2
acodomoegltdslqtaup
2
(
04 B. Hauser et al. / J. Chro
ected in Taı National Park (Cote d’Ivoire) in January 2006 fromve habituated adult males (15–42 years) and in January 2005rom eight habituated adult females (26–42 years); from Juneo July in Budongo Forest Reserve (Uganda) from three adult
ales (15–26 years); and in January 2007 in the Zoo of Leipzigrom two adult males (13 and 31 years) and one adult female26 years). Urine was aspirated from vegetation or ground usingisposable plastic pipettes. Samples collected in the field wereept at 4 ◦C for ∼1/2 day and then stored frozen. After shipmentn dry ice to the lab, all samples were stored at –20 ◦C untilnalysis.
For method comparison eight samples of lyophilized humanrine of four healthy individuals (two females, 27 and 55 yearsnd two males, 49 and 54 years) provided by the Dutch Founda-ion for Quality Assessment in Medical Laboratories (SKML:ww.skml.nl, Nijmegen, The Netherlands) were resuspended in0 mL deionzed water.
.8. Method evaluation
.8.1. Linearity, LOD and QLTo evaluate linearity, standards were prepared at concen-
rations of 0.2, 0.6, 1, 2, 6, 10, 20, 60, 100, 200, 1000 and000 ng/mL of each steroid in 30% acetonitrile. These werehen mixed 1:1 with an internal standard mix of each 100 ng/mL4-cortisol, d3-testosterone, d4-estrone, d9-progesterone andethyl testosterone, resulting in final calibration concentrations
f 0.1, 0.3, 0,5, 1, 3, 5, 10, 30, 50, 100, 500 and 1000 ng/mLnd 50 ng/mL of the internal standards. Calibration curves werebtained from the analyte to internal standard peak area ratiossing linear regression with 1/x weighing, except for pregnan-iol glucuronide, which was calibrated externally in the negativeonization mode. The limit of detection (LOD) was calculatedn the most intense transition, with the criterion of a signal tooise ratio exceeding 3. The quantitation limit (QL) was defineds the lowest calibration level, which fitted into the calibrationurve with a residual of less than 20% and an ion ratio deviatingess than 30% from that of a higher concentrated standard.
.8.2. SelectivityTwo MRMs for each steroid were measured to check for inter-
erence. The intensity ratio of the quantifier and qualifier MRMas required to be ±30% of the standard ratio. Interferencesere examined for each analyte within ±0.5 min of its reten-
ion time with all other analytes eluting in this time window. Toheck the selectivity of the method between the analytes, indi-idual standard solutions at 100 ng/mL were separately injectednd analyzed using the current MRM method. This should notroduce a peak area >20% of the analyte under question injectedt the quantitation limit.
.8.3. Ether extractionThe performance of the ether extraction was first checked by
piking steroids at 25 ng/mL in 200 �L water—once by adjust-ng the solution to pH 4.7 by adding 800 �L of sodium acetateuffer, and once by adjusting the solution to pH 9.6 by adding00 �L of sodium acetate buffer and 750 �L 10% potassium
mtos
r. B 862 (2008) 100–112
arbonate. The spiked samples were then extracted with 6 mLiethyl ether as described in Section 2.4. The extraction was thenepeated with 6 mL TBME in order to evaluate if the latter cane used instead of diethyl ether. Every experiment was repeatedix times. For determination of recovery, the response was com-ared with standards directly prepared in HPLC eluent withoutnternal standardization.
.8.4. Amount of β-glucuronidase used for hydrolysisThe completeness of the hydrolysis was examined by using
0, 40 and 80 �L �-glucuronidase (500, 1000 and 2000 U/mLrine) for hydrolysis of two male urines and looking for a poten-ial increase of determined steroid concentrations.
In this study, two male human urines with relatively high cre-tinine contents (0.85 mg/mL and 2.118 mg/mL), and thereforessumed high steroid concentrations, were used. Each enzymeoncentration was assayed in duplicate.
.8.5. Matrix effect/ion suppressionTwo pools of equal volumes of four bonobo and four chim-
anzee urines (two males, two females) were prepared. Theseools were submitted to hydrolysis and solvolysis (Sections.4 and 2.5) and evaporated. Dry extracts were dissolved usingnternal standard solutions at three concentration levels (2, 20nd 200 ng/mL). Matrix effect was determined by comparinghe analytical response of these samples with that of standardolutions. Each experiment was performed in duplicate.
.8.6. Precision and recoveryAs no commercial quality control samples containing all
nalytes implemented into our method were available, qualityontrols were prepared by spiking a low concentrated urine poolf a female bonobo (9 years) at three levels with appropriatelyiluted methanolic composite standards. First, the basal levelf the urine pool was determined. The concentration of hor-ones spiked was adjusted to the physiological relevant range
f each hormone. Hormones were spiked in their free from,xcept for testosterone and pregnandiol, which were spiked aslucuronides and DHEA, which was spiked as sulfate. Each QCevel was submitted to hydrolysis and solvolysis six times onhe same day (intra-day precision) and five times on differentays (inter-day precision). The response was compared with aet of calibration standards. The recoveries were calculated byinear regression. The precision acceptance criterion for eachuality control sample concentration was ≤15%. Additionally,he reproducibility of the whole method including hydrolysisnd solvolysis was determined by submitting two samples ofnspiked male human urine to the hydrolysis and solvolysisrocedure (Sections 2.4 and 2.5) eight times.
.8.7. Method comparisonEight human urine samples from an international survey
SKML, Nijmegen) were analyzed by the presented LC–MS/MS
ethod in duplicate. Results for 9 compounds were compared tohe median of the survey. The predominant method used by thether laboratories taking part in the survey was GC–MS. Regres-ion analysis was performed by Spearman’s rank correlation, in
B. Hauser et al. / J. Chromatogr. B 862 (2008) 100–112 105
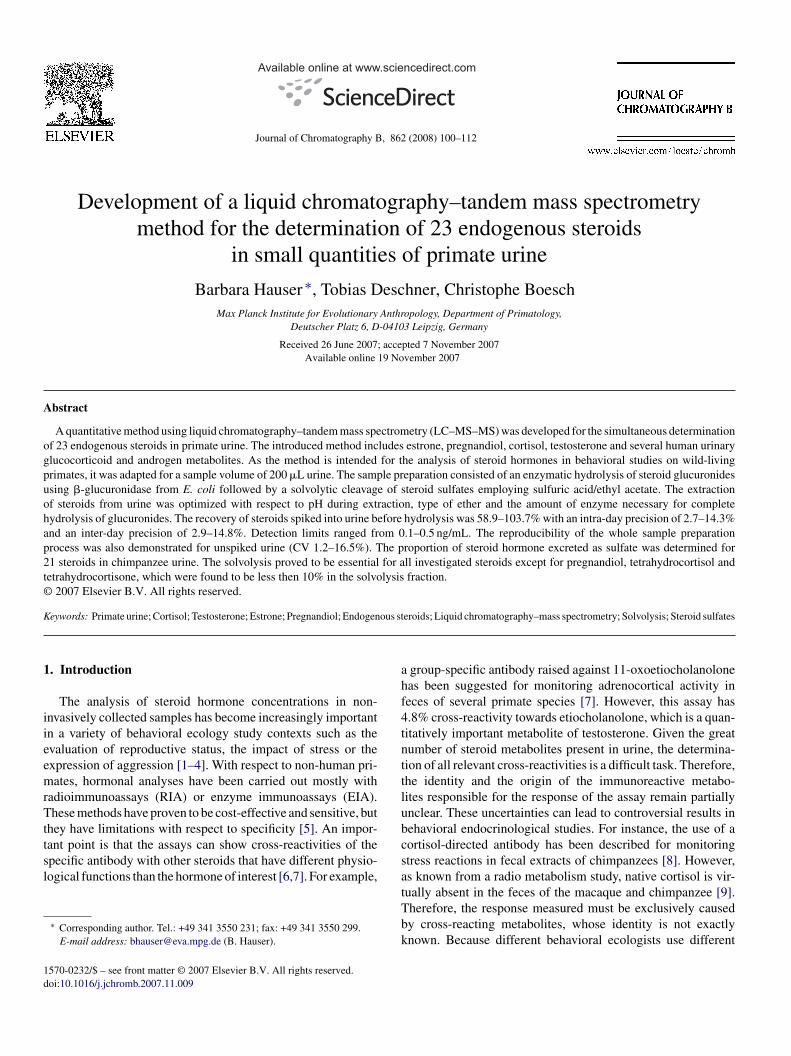
F s: reteg iT, et ediol5
ocb
3
3
isml
tncs2ptv(
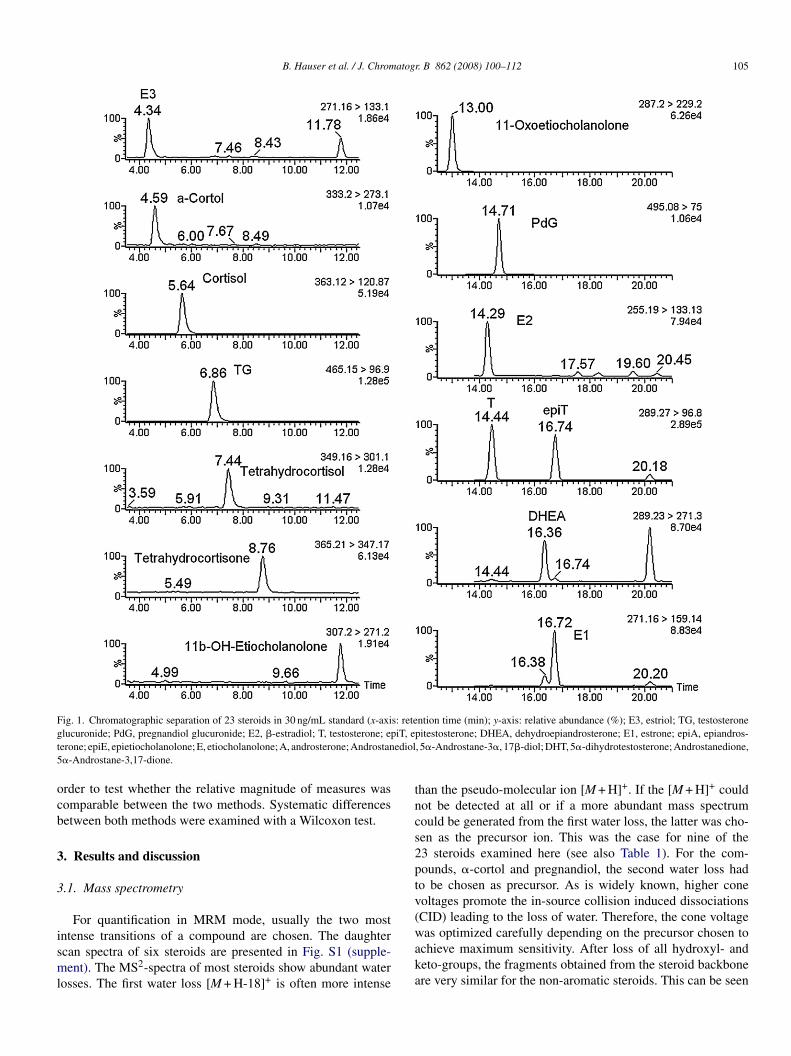
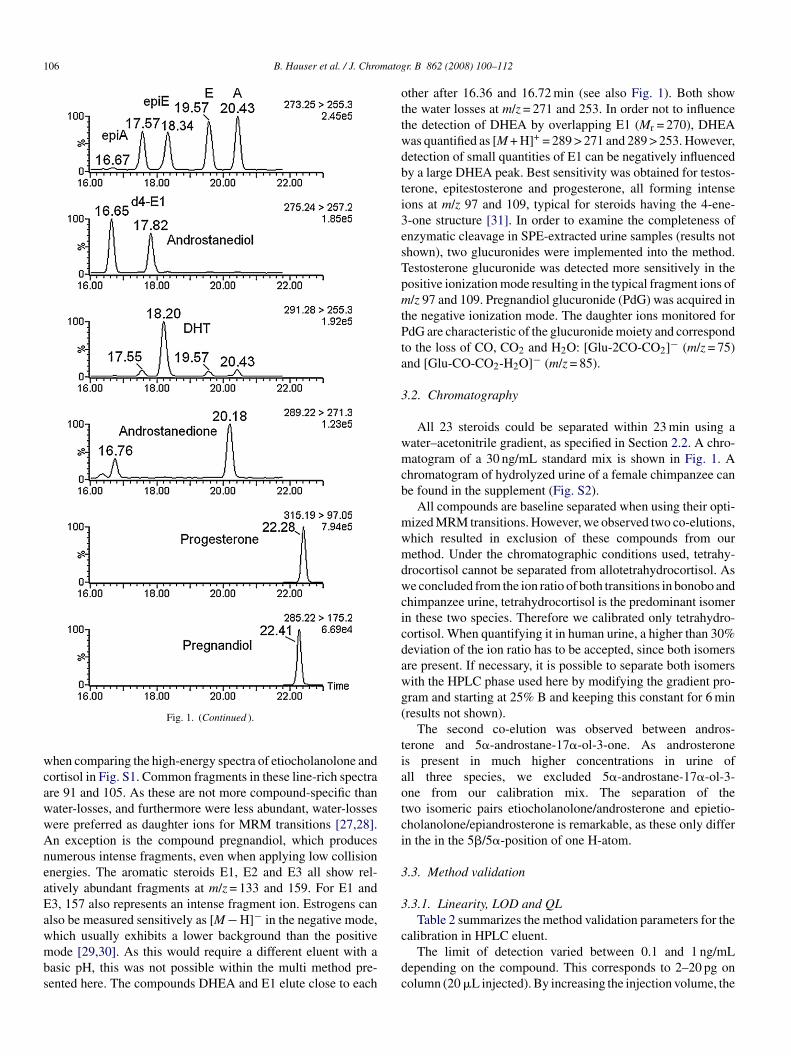
ig. 1. Chromatographic separation of 23 steroids in 30 ng/mL standard (x-axilucuronide; PdG, pregnandiol glucuronide; E2, �-estradiol; T, testosterone; eperone; epiE, epietiocholanolone; E, etiocholanolone; A, androsterone; Androstan�-Androstane-3,17-dione.
rder to test whether the relative magnitude of measures wasomparable between the two methods. Systematic differencesetween both methods were examined with a Wilcoxon test.
. Results and discussion
.1. Mass spectrometry
For quantification in MRM mode, usually the two most
ntense transitions of a compound are chosen. The daughtercan spectra of six steroids are presented in Fig. S1 (supple-ent). The MS2-spectra of most steroids show abundant waterosses. The first water loss [M + H-18]+ is often more intense
waka
ntion time (min); y-axis: relative abundance (%); E3, estriol; TG, testosteronepitestosterone; DHEA, dehydroepiandrosterone; E1, estrone; epiA, epiandros-, 5�-Androstane-3�, 17�-diol; DHT, 5�-dihydrotestosterone; Androstanedione,
han the pseudo-molecular ion [M + H]+. If the [M + H]+ couldot be detected at all or if a more abundant mass spectrumould be generated from the first water loss, the latter was cho-en as the precursor ion. This was the case for nine of the3 steroids examined here (see also Table 1). For the com-ounds, �-cortol and pregnandiol, the second water loss hado be chosen as precursor. As is widely known, higher coneoltages promote the in-source collision induced dissociationsCID) leading to the loss of water. Therefore, the cone voltage
as optimized carefully depending on the precursor chosen tochieve maximum sensitivity. After loss of all hydroxyl- andeto-groups, the fragments obtained from the steroid backbonere very similar for the non-aromatic steroids. This can be seen
106 B. Hauser et al. / J. Chromatog
wcawwAneaEawmbs
ottwdbti3esTpmtPta
3
wmcb
mwmdwcicdawg(
tiaotci
3
3
Fig. 1. (Continued ).
hen comparing the high-energy spectra of etiocholanolone andortisol in Fig. S1. Common fragments in these line-rich spectrare 91 and 105. As these are not more compound-specific thanater-losses, and furthermore were less abundant, water-lossesere preferred as daughter ions for MRM transitions [27,28].n exception is the compound pregnandiol, which producesumerous intense fragments, even when applying low collisionnergies. The aromatic steroids E1, E2 and E3 all show rel-tively abundant fragments at m/z = 133 and 159. For E1 and3, 157 also represents an intense fragment ion. Estrogens canlso be measured sensitively as [M − H]− in the negative mode,
hich usually exhibits a lower background than the positiveode [29,30]. As this would require a different eluent with aasic pH, this was not possible within the multi method pre-ented here. The compounds DHEA and E1 elute close to each
c
dc
r. B 862 (2008) 100–112
ther after 16.36 and 16.72 min (see also Fig. 1). Both showhe water losses at m/z = 271 and 253. In order not to influencehe detection of DHEA by overlapping E1 (Mr = 270), DHEAas quantified as [M + H]+ = 289 > 271 and 289 > 253. However,etection of small quantities of E1 can be negatively influencedy a large DHEA peak. Best sensitivity was obtained for testos-erone, epitestosterone and progesterone, all forming intenseons at m/z 97 and 109, typical for steroids having the 4-ene--one structure [31]. In order to examine the completeness ofnzymatic cleavage in SPE-extracted urine samples (results nothown), two glucuronides were implemented into the method.estosterone glucuronide was detected more sensitively in theositive ionization mode resulting in the typical fragment ions of/z 97 and 109. Pregnandiol glucuronide (PdG) was acquired in
he negative ionization mode. The daughter ions monitored fordG are characteristic of the glucuronide moiety and correspond
o the loss of CO, CO2 and H2O: [Glu-2CO-CO2]− (m/z = 75)nd [Glu-CO-CO2-H2O]− (m/z = 85).
.2. Chromatography
All 23 steroids could be separated within 23 min using aater–acetonitrile gradient, as specified in Section 2.2. A chro-atogram of a 30 ng/mL standard mix is shown in Fig. 1. A
hromatogram of hydrolyzed urine of a female chimpanzee cane found in the supplement (Fig. S2).
All compounds are baseline separated when using their opti-ized MRM transitions. However, we observed two co-elutions,hich resulted in exclusion of these compounds from ourethod. Under the chromatographic conditions used, tetrahy-
rocortisol cannot be separated from allotetrahydrocortisol. Ase concluded from the ion ratio of both transitions in bonobo and
himpanzee urine, tetrahydrocortisol is the predominant isomern these two species. Therefore we calibrated only tetrahydro-ortisol. When quantifying it in human urine, a higher than 30%eviation of the ion ratio has to be accepted, since both isomersre present. If necessary, it is possible to separate both isomersith the HPLC phase used here by modifying the gradient pro-ram and starting at 25% B and keeping this constant for 6 minresults not shown).
The second co-elution was observed between andros-erone and 5�-androstane-17�-ol-3-one. As androsterones present in much higher concentrations in urine ofll three species, we excluded 5�-androstane-17�-ol-3-ne from our calibration mix. The separation of thewo isomeric pairs etiocholanolone/androsterone and epietio-holanolone/epiandrosterone is remarkable, as these only differn the in the 5�/5�-position of one H-atom.
.3. Method validation
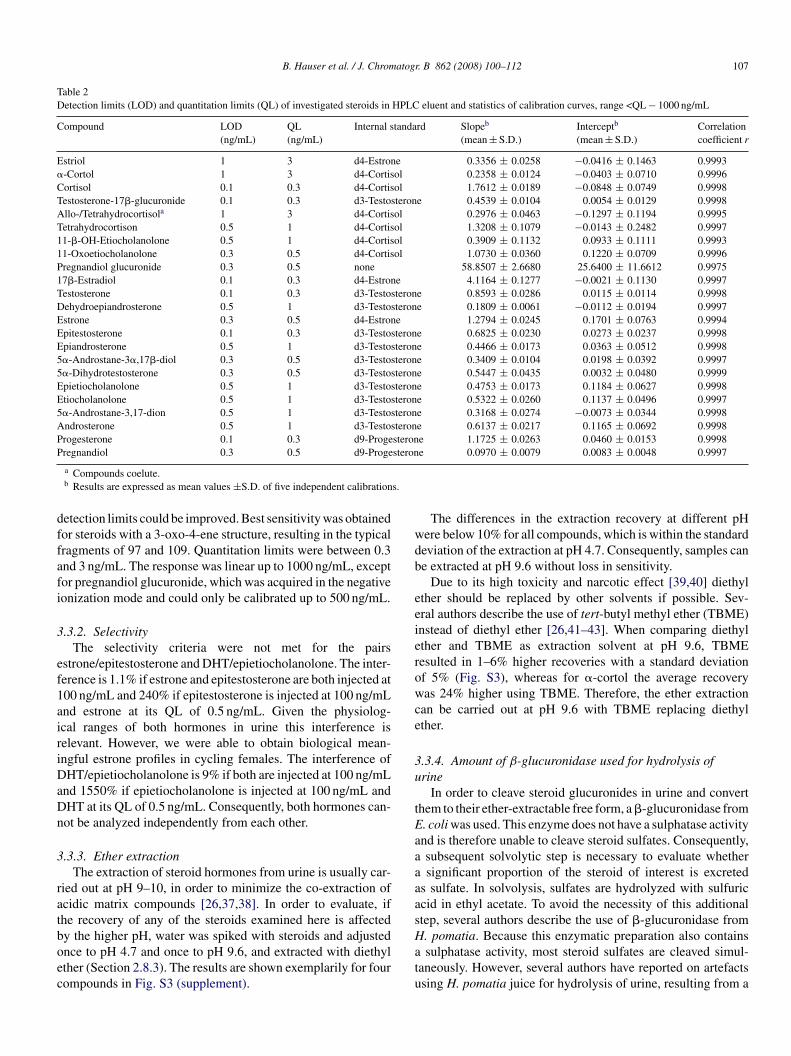
.3.1. Linearity, LOD and QLTable 2 summarizes the method validation parameters for the
alibration in HPLC eluent.The limit of detection varied between 0.1 and 1 ng/mL
epending on the compound. This corresponds to 2–20 pg onolumn (20 �L injected). By increasing the injection volume, the
B. Hauser et al. / J. Chromatogr. B 862 (2008) 100–112 107
Table 2Detection limits (LOD) and quantitation limits (QL) of investigated steroids in HPLC eluent and statistics of calibration curves, range <QL − 1000 ng/mL
Compound LOD(ng/mL)
QL(ng/mL)
Internal standard Slopeb
(mean ± S.D.)Interceptb
(mean ± S.D.)Correlationcoefficient r
Estriol 1 3 d4-Estrone 0.3356 ± 0.0258 −0.0416 ± 0.1463 0.9993�-Cortol 1 3 d4-Cortisol 0.2358 ± 0.0124 −0.0403 ± 0.0710 0.9996Cortisol 0.1 0.3 d4-Cortisol 1.7612 ± 0.0189 −0.0848 ± 0.0749 0.9998Testosterone-17�-glucuronide 0.1 0.3 d3-Testosterone 0.4539 ± 0.0104 0.0054 ± 0.0129 0.9998Allo-/Tetrahydrocortisola 1 3 d4-Cortisol 0.2976 ± 0.0463 −0.1297 ± 0.1194 0.9995Tetrahydrocortison 0.5 1 d4-Cortisol 1.3208 ± 0.1079 −0.0143 ± 0.2482 0.999711-�-OH-Etiocholanolone 0.5 1 d4-Cortisol 0.3909 ± 0.1132 0.0933 ± 0.1111 0.999311-Oxoetiocholanolone 0.3 0.5 d4-Cortisol 1.0730 ± 0.0360 0.1220 ± 0.0709 0.9996Pregnandiol glucuronide 0.3 0.5 none 58.8507 ± 2.6680 25.6400 ± 11.6612 0.997517�-Estradiol 0.1 0.3 d4-Estrone 4.1164 ± 0.1277 −0.0021 ± 0.1130 0.9997Testosterone 0.1 0.3 d3-Testosterone 0.8593 ± 0.0286 0.0115 ± 0.0114 0.9998Dehydroepiandrosterone 0.5 1 d3-Testosterone 0.1809 ± 0.0061 −0.0112 ± 0.0194 0.9997Estrone 0.3 0.5 d4-Estrone 1.2794 ± 0.0245 0.1701 ± 0.0763 0.9994Epitestosterone 0.1 0.3 d3-Testosterone 0.6825 ± 0.0230 0.0273 ± 0.0237 0.9998Epiandrosterone 0.5 1 d3-Testosterone 0.4466 ± 0.0173 0.0363 ± 0.0512 0.99985�-Androstane-3�,17�-diol 0.3 0.5 d3-Testosterone 0.3409 ± 0.0104 0.0198 ± 0.0392 0.99975�-Dihydrotestosterone 0.3 0.5 d3-Testosterone 0.5447 ± 0.0435 0.0032 ± 0.0480 0.9999Epietiocholanolone 0.5 1 d3-Testosterone 0.4753 ± 0.0173 0.1184 ± 0.0627 0.9998Etiocholanolone 0.5 1 d3-Testosterone 0.5322 ± 0.0260 0.1137 ± 0.0496 0.99975�-Androstane-3,17-dion 0.5 1 d3-Testosterone 0.3168 ± 0.0274 −0.0073 ± 0.0344 0.9998Androsterone 0.5 1 d3-Testosterone 0.6137 ± 0.0217 0.1165 ± 0.0692 0.9998Progesterone 0.1 0.3 d9-Progesterone 1.1725 ± 0.0263 0.0460 ± 0.0153 0.9998P steron
s.
dffafi
3
ef1airiDaDn
3
ratboec
wdb
eeierowce
3u
tEaaaaas
regnandiol 0.3 0.5 d9-Proge
a Compounds coelute.b Results are expressed as mean values ±S.D. of five independent calibration
etection limits could be improved. Best sensitivity was obtainedor steroids with a 3-oxo-4-ene structure, resulting in the typicalragments of 97 and 109. Quantitation limits were between 0.3nd 3 ng/mL. The response was linear up to 1000 ng/mL, exceptor pregnandiol glucuronide, which was acquired in the negativeonization mode and could only be calibrated up to 500 ng/mL.
.3.2. SelectivityThe selectivity criteria were not met for the pairs
strone/epitestosterone and DHT/epietiocholanolone. The inter-erence is 1.1% if estrone and epitestosterone are both injected at00 ng/mL and 240% if epitestosterone is injected at 100 ng/mLnd estrone at its QL of 0.5 ng/mL. Given the physiolog-cal ranges of both hormones in urine this interference iselevant. However, we were able to obtain biological mean-ngful estrone profiles in cycling females. The interference ofHT/epietiocholanolone is 9% if both are injected at 100 ng/mL
nd 1550% if epietiocholanolone is injected at 100 ng/mL andHT at its QL of 0.5 ng/mL. Consequently, both hormones can-ot be analyzed independently from each other.
.3.3. Ether extractionThe extraction of steroid hormones from urine is usually car-
ied out at pH 9–10, in order to minimize the co-extraction ofcidic matrix compounds [26,37,38]. In order to evaluate, ifhe recovery of any of the steroids examined here is affected
y the higher pH, water was spiked with steroids and adjustednce to pH 4.7 and once to pH 9.6, and extracted with diethylther (Section 2.8.3). The results are shown exemplarily for fourompounds in Fig. S3 (supplement).Hatu
e 0.0970 ± 0.0079 0.0083 ± 0.0048 0.9997
The differences in the extraction recovery at different pHere below 10% for all compounds, which is within the standardeviation of the extraction at pH 4.7. Consequently, samples cane extracted at pH 9.6 without loss in sensitivity.
Due to its high toxicity and narcotic effect [39,40] diethylther should be replaced by other solvents if possible. Sev-ral authors describe the use of tert-butyl methyl ether (TBME)nstead of diethyl ether [26,41–43]. When comparing diethylther and TBME as extraction solvent at pH 9.6, TBMEesulted in 1–6% higher recoveries with a standard deviationf 5% (Fig. S3), whereas for �-cortol the average recoveryas 24% higher using TBME. Therefore, the ether extraction
an be carried out at pH 9.6 with TBME replacing diethylther.
.3.4. Amount of β-glucuronidase used for hydrolysis ofrine
In order to cleave steroid glucuronides in urine and converthem to their ether-extractable free form, a �-glucuronidase from. coli was used. This enzyme does not have a sulphatase activitynd is therefore unable to cleave steroid sulfates. Consequently,subsequent solvolytic step is necessary to evaluate whethersignificant proportion of the steroid of interest is excreted
s sulfate. In solvolysis, sulfates are hydrolyzed with sulfuriccid in ethyl acetate. To avoid the necessity of this additionaltep, several authors describe the use of �-glucuronidase from
. pomatia. Because this enzymatic preparation also containssulphatase activity, most steroid sulfates are cleaved simul-aneously. However, several authors have reported on artefactssing H. pomatia juice for hydrolysis of urine, resulting from a
108B
.Hauser
etal./J.Chrom
atogr.B 862 (2008) 100–112
Table 3Validation results
Analyte Level 1 Level 2 Level 3
Mean(ng/mL)
Intra-dayCV (%)
Inter-dayCV (%)
Recovery(%)
Mean(ng/mL)
Intra-dayCV (%)
Inter-dayCV (%)
Recovery(%)
Mean(ng/mL)
Intra-dayCV (%)
Inter-dayCV (%)
Recovery(%)
Estriol 11.5 6.3 4.2 65.9 37.8 6.3 2.9 79.7 90.6 7.2 7.3 84.3�-Cortol 22.1 6.9 6.6 101.2 62.8 2.7 5.0 95.1 97.1 6.6 6.7 89.3Cortisol 58.4 5.4 13.0 87.3 94.7 4.6 8.8 88.7 185.7 4.1 10.0 81.9Allo-/THFa 135.1 6.5 10.8 81.4 218.6 5.9 11.2 65.2 364.3 4.2 11.2 58.9Tetrahydrocortisone 234.7 8.7 11.4 74.0 368.2 7.1 12.8 71.2 512.3 5.8 14.1 71.411-OH-Etiocholanolone 34.7 14.3 11.9 77.0 70.0 10.3 12.5 82.3 158.3 9.5 8.5 77.211-Oxoetiocholanolone 166.5 6.9 5.3 100.6 275.5 6.0 14.8 103.7 465.0 6.7 6.5 99.917�-Estradiol 10.1 7.4 9.0 69.3 34.2 6.5 8.0 76.8 99.3 5.4 10.8 95.0Testosteroneb 71.5 8.0 9.9 84.6 135.6 6.5 8.0 82.4 313.1 5.9 10.7 77.4Dehydroepiandrosteronec 134.3 7.5 7.7 60.4 253.4 7.4 7.6 60.0 390.3 5.9 8.5 62.7Estrone 11.2 7.8 12.3 77.2 36.9 6.7 9.5 83.1 104.4 6.7 11.5 99.9Epitestosterone 10.8 8.7 11.5 103.0 35.8 6.0 8.6 88.6 101.2 5.6 10.8 100.7Epiandrosterone 11.0 10.7 8.2 93.2 33.5 6.0 5.5 80.2 94.7 5.7 10.9 93.05�-Androstane-3�,17�-diol 12.0 9.9 4.3 89.4 34.3 4.9 7.8 78.9 92.8 6.7 9.7 89.75�-Dihydrotestosterone 11.6 10.5 8.7 92.4 33.7 6.2 8.4 79.2 93.9 5.7 10.3 91.5Epietiocholanolone 14.1 6.7 7.6 97.6 37.6 7.5 8.2 84.5 99.9 6.2 8.3 95.6Etiocholanolone 142.4 8.5 8.9 89.8 237.2 6.7 7.0 91.7 418.7 6.0 10.9 91.35�-Androstane-3,17-dione 11.1 5.9 6.6 93.7 32.8 6.8 6.7 78.5 92.4 6.6 9.6 90.8Androsterone 56.4 9.4 8.2 96.5 96.5 7.4 5.8 98.0 204.8 7.4 10.1 93.7Progesterone 9.2 10.0 9.8 92.2 31.3 8.1 5.5 78.2 90.9 6.8 10.9 90.9Pregnandiolb 40.6 11.0 9.0 77.4 66.0 9.3 8.1 71.5 142.2 7.4 12.9 67.0
a Compounds coelute; THF, tetrahydrocortisol.b Spiked as glucuronide.c Spiked as sulfate.
atog
3iats
sfttacSr2fdtot1heaafgee�
3
bsbsoehrmibccuta
3
co
≤u
TR
C
E�
CAT11TDEEE55EE5APP
PC
B. Hauser et al. / J. Chrom
�-hydroxy-steroid-dehydrogenase and a �5-4-isomerase activ-ty present in this preparation [32,33]. As this can result inltered hormone profiles for several androgens, especially testos-erone, the �-glucuronidase from E. coli was chosen for thistudy.
The amount of �-glucuronidase from E. coli used for hydroly-is of steroid glucuronides in human urine varies in the literaturerom 1.6 U/mL [34], to 4 U/mL [35], to 1000 U/mL [36]. Inhis study, two male human urines with relatively high crea-inine contents (0.85 mg/mL and 2.118 mg/mL), and thereforessumed high steroid concentrations, were hydrolyzed in dupli-ate with 20, 40 and 80 �L enzyme, prepared as described inection 2.4, corresponding to 500, 1000 and 2000 U/mL urine,espectively. Hydrolyzing urine with 40 �L enzyme, instead of0 �L, results in only minor differences in steroid concentrationsor the majority of steroids, ranging from −6 to 7% (averageeviation 1.9%). The same was true when further increasinghe amount of enzyme to 80 �L—the average deviation wasnly 0.6%, ranging from −5 to 7%. Only the glucuronides ofetrahydrocortisol, �-cortol and 5�-androstane-3�, 11�-diol-7-one (11�-hydroxyetiocholanolone) were hydrolyzed to aigher extent by a higher amount of enzyme. When using 40 �Lnzyme, instead of 20 �L, the concentrations of the latter rosebout 16, 26 and 49%, respectively. By adding 80 �L enzyme,n additional increase of only 4% for tetrahydrocortisol, 18%or �-cortol and 10% for 5�-andro was observed. As the �-
lucuronidase precipitates after adding potassium carbonate andther and can impede phase separation, we decided to use as littlenzyme as necessary and performed the hydrolysis with 40 �L-glucuronidase from E. coli.cFww
able 4eproducibility of sample preparation and analysis for two male human urine sample
ompound Concentration (ng/mL) CV Hydrolysis
Sample 1 Sample 2 Sample 1
striol 17 53 8.7-Cortol 135 531 4.8ortisol 154.2 237.8 1.9llo-/THFa 942 2853 2.0etrahydrocortison 4562 11012 1.91-OH-Etiocholanolone 481 875 3.47�-Estradiol <QL <QL <QLestosterone 132.2 144.5 1.5ehydroepiandrosterone 8585 15226 1.3strone 7.1 27.4 5.1pitestosterone 105.7 309.3 1.7piandrosterone 856 1049 2.3�-Androstane-3�,17�-diol 154.5 535.0 2.2�-Dihydrotestosterone 20.5 28.5 2.9pietiocholanolone 81 42 2.9tiocholanolone 3657 5776 1.4�-Androstane-3,17-dione NQ NQ NQndrosterone 6671 11484 1.4rogesterone <QL <QL <QLregnandiol 676.0 984.0 1.7
ercentage of steroid concentration found after solvolysis.V, coefficient of variation; <QL, below quantitation limit; NQ, not quantifiable duea Compounds coelute; THF, tetrahydrocortisol.
r. B 862 (2008) 100–112 109
.3.5. Matrix effect/ion suppressionThe possibility of matrix effects on ionization was explored
y comparing the response of the four deuterated internaltandards spiked into extracted and evaporated urine pools ofonobos and chimpanzees with the response of these standardspiked into HPLC eluent. There was no significant decreasef peak areas of reference solutions and standards spiked intoxtracted urine (Table S1, supplement). The ESI source usedas a Z-spray configuration, which results in a twofold redi-ection of the ion-beam and makes it relatively stable againstatrix effects. However, at the low level of 2 ng/mL a signif-
cant positive matrix effect was seen for d4-cortisol in bothonobo and chimpanzee urine pools. This effect is due to aoeluting compound having the same transition of 367 > 121 andan impede the use of d4-cortisol as internal standard in bonoborine. In these cases glucocorticoids are at present referred to d3-estosterone, but a replacement of d4-cortisol is planned whennalyzing bonobo urine.
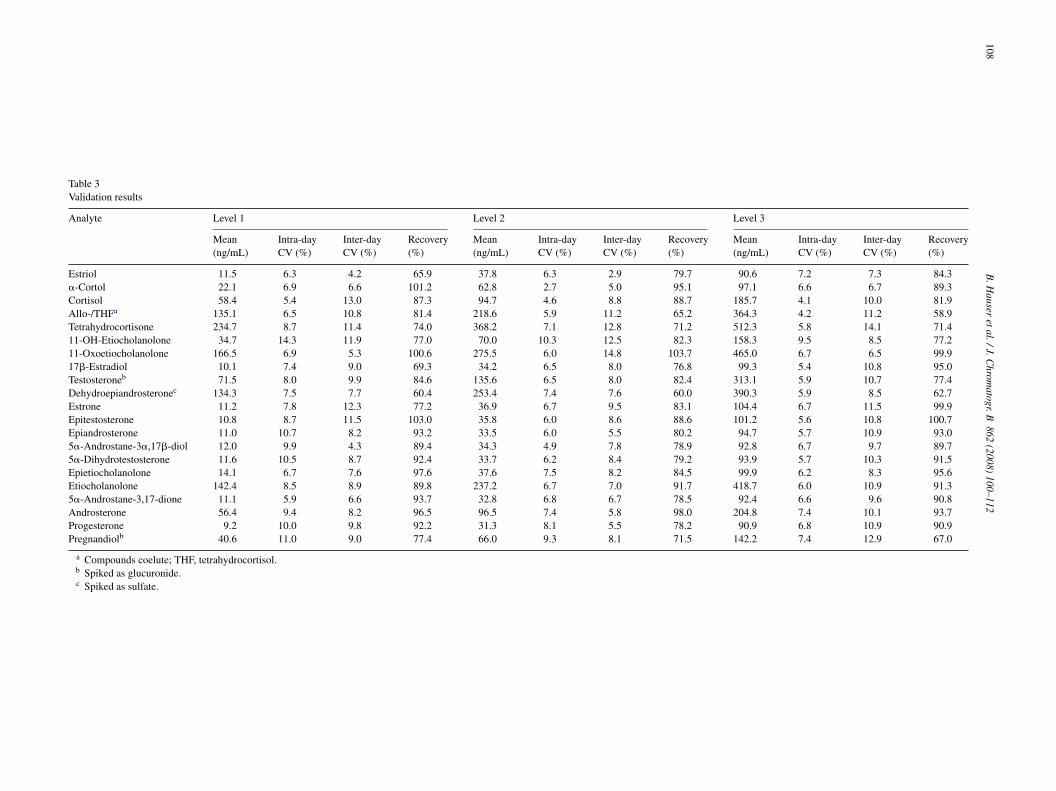
.3.6. Precision and recoveryPrecision and recovery were calculated at three different con-
entration levels of low, medium and high QC samples analyzedn 6 days. The results are presented in Table 3.
Both intra-day (N = 6) and inter-day (N = 5) precision was15% at all levels examined and ≤20% at basal level of the
nspiked bonobo urine pool. Therefore the precision acceptance
riterion is fulfilled. Recoveries were between 60 and 103%.or most analytes no concentration dependence of recoveryas seen. However, the recovery of tetrahydrocortisol decreasesith increasing concentration. This could be an ion suppressions (N = 8)
(%) CV Solvolysis (%) Solvolysis in (%) of total
Sample 2 Sample 1 Sample 2 Sample 1 Sample 2
4.2 <QL <QL – –4.8 <QL <QL – –3.6 6.2 16.5 26.7 13.14.6 13.5 18.1 4.9 7.74.2 15.5 24.5 1.3 2.71.2 4.1 4.2 8.5 6.0<QL <QL <QL – –2.6 2.2 3.9 19.3 11.63.2 1.9 2.9 98.3 98.24.6 <QL <QL - -2.6 1.9 2.4 37.4 19.01.5 1.6 2.6 93.5 86.22.3 3.1 5.5 12.8 11.93.8 3.7 5.8 36.9 10.95.9 2.5 7.2 70.7 56.33.3 2.3 14.3 10.8 3.9NQ NQ NQ – –3.3 0.8 2.1 35.1 22.8<QL <QL <QL – –2.3 14.5 20.3 1.5 1.7
to incorrect ion ratio; –, not determinable.
1 matogr. B 862 (2008) 100–112
eor
iei
Ftteth1ueorswF1
3
oivnfeLtsLr(sc0e
mO1vLi1i
3
vt
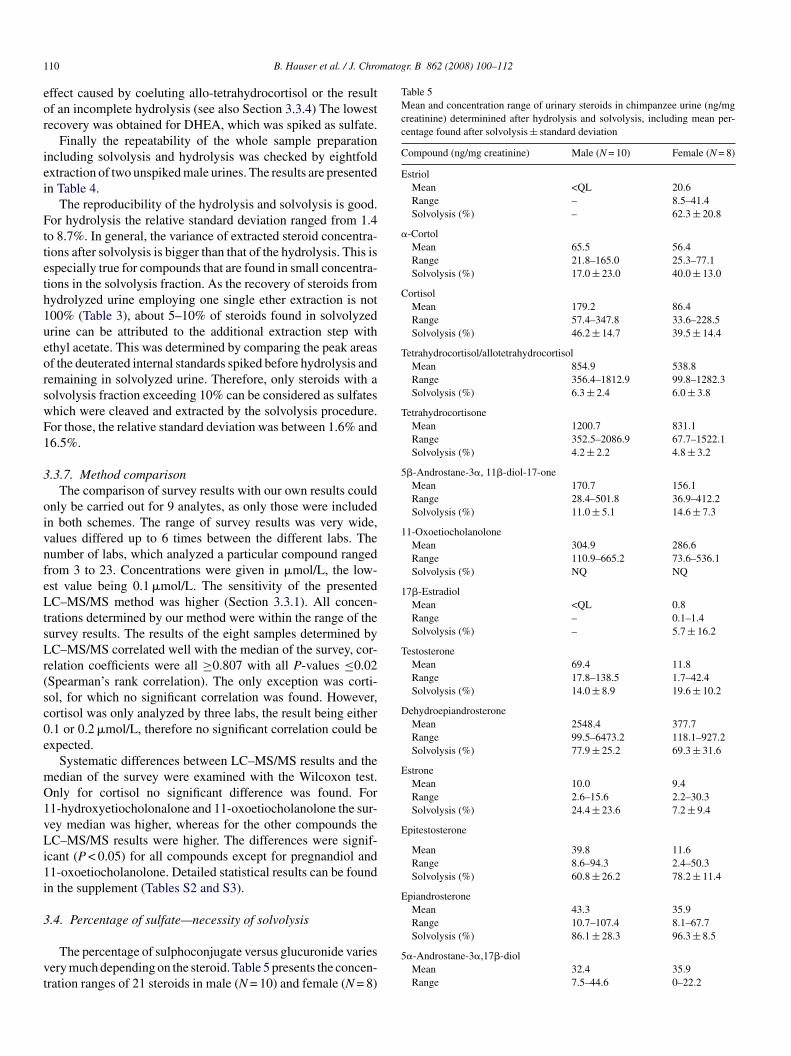
Table 5Mean and concentration range of urinary steroids in chimpanzee urine (ng/mgcreatinine) determinined after hydrolysis and solvolysis, including mean per-centage found after solvolysis ± standard deviation
Compound (ng/mg creatinine) Male (N = 10) Female (N = 8)
EstriolMean <QL 20.6Range – 8.5–41.4Solvolysis (%) – 62.3 ± 20.8
�-CortolMean 65.5 56.4Range 21.8–165.0 25.3–77.1Solvolysis (%) 17.0 ± 23.0 40.0 ± 13.0
CortisolMean 179.2 86.4Range 57.4–347.8 33.6–228.5Solvolysis (%) 46.2 ± 14.7 39.5 ± 14.4
Tetrahydrocortisol/allotetrahydrocortisolMean 854.9 538.8Range 356.4–1812.9 99.8–1282.3Solvolysis (%) 6.3 ± 2.4 6.0 ± 3.8
TetrahydrocortisoneMean 1200.7 831.1Range 352.5–2086.9 67.7–1522.1Solvolysis (%) 4.2 ± 2.2 4.8 ± 3.2
5�-Androstane-3�, 11�-diol-17-oneMean 170.7 156.1Range 28.4–501.8 36.9–412.2Solvolysis (%) 11.0 ± 5.1 14.6 ± 7.3
11-OxoetiocholanoloneMean 304.9 286.6Range 110.9–665.2 73.6–536.1Solvolysis (%) NQ NQ
17�-EstradiolMean <QL 0.8Range – 0.1–1.4Solvolysis (%) – 5.7 ± 16.2
TestosteroneMean 69.4 11.8Range 17.8–138.5 1.7–42.4Solvolysis (%) 14.0 ± 8.9 19.6 ± 10.2
DehydroepiandrosteroneMean 2548.4 377.7Range 99.5–6473.2 118.1–927.2Solvolysis (%) 77.9 ± 25.2 69.3 ± 31.6
EstroneMean 10.0 9.4Range 2.6–15.6 2.2–30.3Solvolysis (%) 24.4 ± 23.6 7.2 ± 9.4
Epitestosterone
Mean 39.8 11.6Range 8.6–94.3 2.4–50.3Solvolysis (%) 60.8 ± 26.2 78.2 ± 11.4
EpiandrosteroneMean 43.3 35.9Range 10.7–107.4 8.1–67.7
10 B. Hauser et al. / J. Chro
ffect caused by coeluting allo-tetrahydrocortisol or the resultf an incomplete hydrolysis (see also Section 3.3.4) The lowestecovery was obtained for DHEA, which was spiked as sulfate.
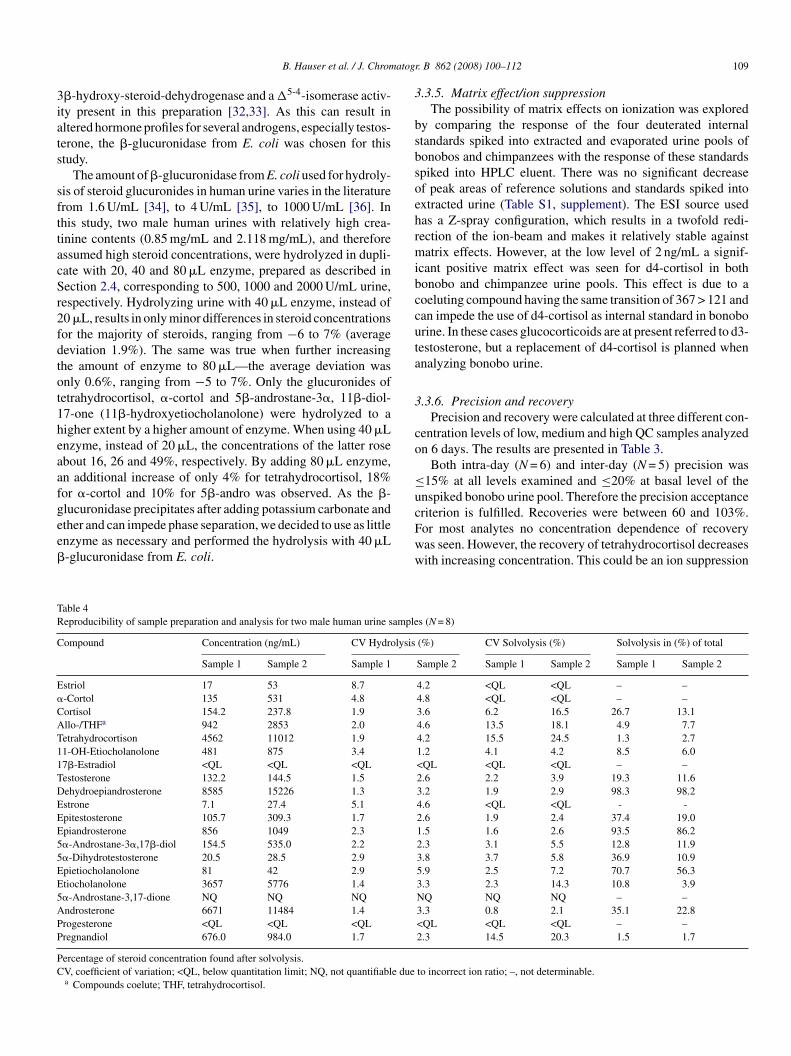
Finally the repeatability of the whole sample preparationncluding solvolysis and hydrolysis was checked by eightfoldxtraction of two unspiked male urines. The results are presentedn Table 4.
The reproducibility of the hydrolysis and solvolysis is good.or hydrolysis the relative standard deviation ranged from 1.4
o 8.7%. In general, the variance of extracted steroid concentra-ions after solvolysis is bigger than that of the hydrolysis. This isspecially true for compounds that are found in small concentra-ions in the solvolysis fraction. As the recovery of steroids fromydrolyzed urine employing one single ether extraction is not00% (Table 3), about 5–10% of steroids found in solvolyzedrine can be attributed to the additional extraction step withthyl acetate. This was determined by comparing the peak areasf the deuterated internal standards spiked before hydrolysis andemaining in solvolyzed urine. Therefore, only steroids with aolvolysis fraction exceeding 10% can be considered as sulfateshich were cleaved and extracted by the solvolysis procedure.or those, the relative standard deviation was between 1.6% and6.5%.
.3.7. Method comparisonThe comparison of survey results with our own results could
nly be carried out for 9 analytes, as only those were includedn both schemes. The range of survey results was very wide,alues differed up to 6 times between the different labs. Theumber of labs, which analyzed a particular compound rangedrom 3 to 23. Concentrations were given in �mol/L, the low-st value being 0.1 �mol/L. The sensitivity of the presentedC–MS/MS method was higher (Section 3.3.1). All concen-
rations determined by our method were within the range of theurvey results. The results of the eight samples determined byC–MS/MS correlated well with the median of the survey, cor-
elation coefficients were all ≥0.807 with all P-values ≤0.02Spearman’s rank correlation). The only exception was corti-ol, for which no significant correlation was found. However,ortisol was only analyzed by three labs, the result being either.1 or 0.2 �mol/L, therefore no significant correlation could bexpected.
Systematic differences between LC–MS/MS results and theedian of the survey were examined with the Wilcoxon test.nly for cortisol no significant difference was found. For1-hydroxyetiocholonalone and 11-oxoetiocholanolone the sur-ey median was higher, whereas for the other compounds theC–MS/MS results were higher. The differences were signif-
cant (P < 0.05) for all compounds except for pregnandiol and1-oxoetiocholanolone. Detailed statistical results can be foundn the supplement (Tables S2 and S3).
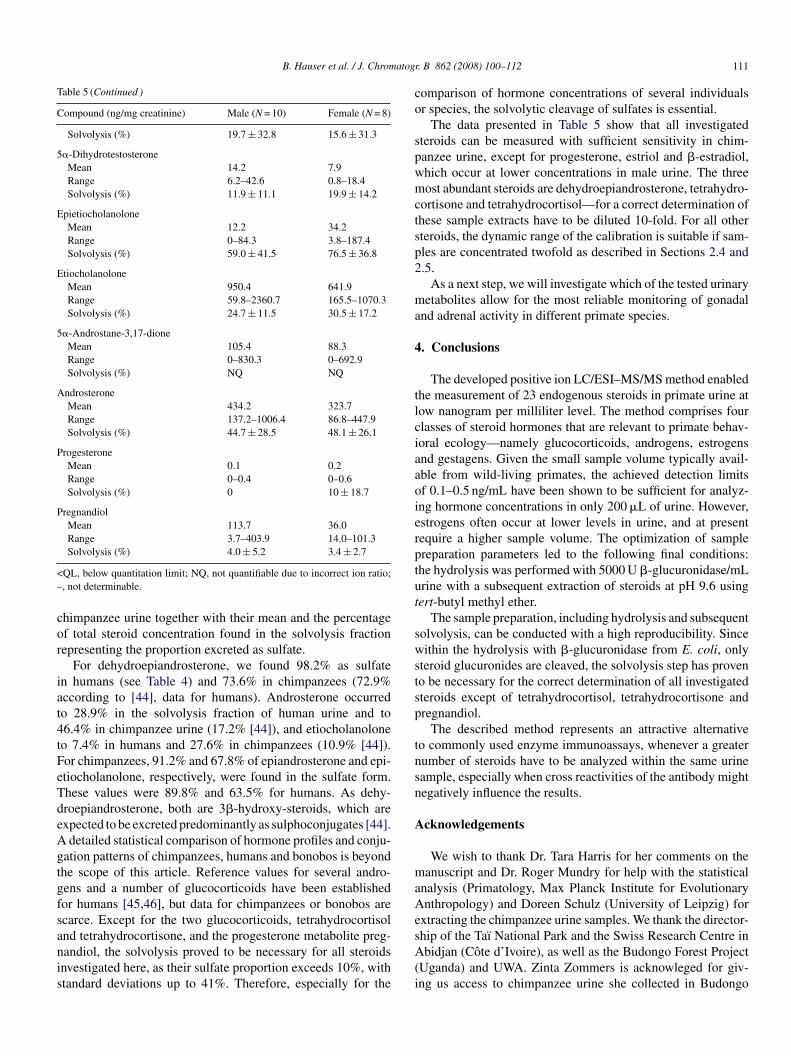
.4. Percentage of sulfate—necessity of solvolysis
The percentage of sulphoconjugate versus glucuronide variesery much depending on the steroid. Table 5 presents the concen-ration ranges of 21 steroids in male (N = 10) and female (N = 8)
Solvolysis (%) 86.1 ± 28.3 96.3 ± 8.5
5�-Androstane-3�,17�-diolMean 32.4 35.9Range 7.5–44.6 0–22.2
B. Hauser et al. / J. Chromatog
Table 5 (Continued )
Compound (ng/mg creatinine) Male (N = 10) Female (N = 8)
Solvolysis (%) 19.7 ± 32.8 15.6 ± 31.3
5�-DihydrotestosteroneMean 14.2 7.9Range 6.2–42.6 0.8–18.4Solvolysis (%) 11.9 ± 11.1 19.9 ± 14.2
EpietiocholanoloneMean 12.2 34.2Range 0–84.3 3.8–187.4Solvolysis (%) 59.0 ± 41.5 76.5 ± 36.8
EtiocholanoloneMean 950.4 641.9Range 59.8–2360.7 165.5–1070.3Solvolysis (%) 24.7 ± 11.5 30.5 ± 17.2
5�-Androstane-3,17-dioneMean 105.4 88.3Range 0–830.3 0–692.9Solvolysis (%) NQ NQ
AndrosteroneMean 434.2 323.7Range 137.2–1006.4 86.8–447.9Solvolysis (%) 44.7 ± 28.5 48.1 ± 26.1
ProgesteroneMean 0.1 0.2Range 0–0.4 0–0.6Solvolysis (%) 0 10 ± 18.7
PregnandiolMean 113.7 36.0Range 3.7–403.9 14.0–101.3
<–
cor
iat4tFeTdeAgtgfsanis
co
spwmctsp2
ma
4
tlciaaoierptut
swstsp
tnsn
A
maAe
Solvolysis (%) 4.0 ± 5.2 3.4 ± 2.7
QL, below quantitation limit; NQ, not quantifiable due to incorrect ion ratio;, not determinable.
himpanzee urine together with their mean and the percentagef total steroid concentration found in the solvolysis fractionepresenting the proportion excreted as sulfate.
For dehydroepiandrosterone, we found 98.2% as sulfaten humans (see Table 4) and 73.6% in chimpanzees (72.9%ccording to [44], data for humans). Androsterone occurredo 28.9% in the solvolysis fraction of human urine and to6.4% in chimpanzee urine (17.2% [44]), and etiocholanoloneo 7.4% in humans and 27.6% in chimpanzees (10.9% [44]).or chimpanzees, 91.2% and 67.8% of epiandrosterone and epi-tiocholanolone, respectively, were found in the sulfate form.hese values were 89.8% and 63.5% for humans. As dehy-roepiandrosterone, both are 3�-hydroxy-steroids, which arexpected to be excreted predominantly as sulphoconjugates [44].detailed statistical comparison of hormone profiles and conju-
ation patterns of chimpanzees, humans and bonobos is beyondhe scope of this article. Reference values for several andro-ens and a number of glucocorticoids have been establishedor humans [45,46], but data for chimpanzees or bonobos arecarce. Except for the two glucocorticoids, tetrahydrocortisol
nd tetrahydrocortisone, and the progesterone metabolite preg-andiol, the solvolysis proved to be necessary for all steroidsnvestigated here, as their sulfate proportion exceeds 10%, withtandard deviations up to 41%. Therefore, especially for thesA(i
r. B 862 (2008) 100–112 111
omparison of hormone concentrations of several individualsr species, the solvolytic cleavage of sulfates is essential.
The data presented in Table 5 show that all investigatedteroids can be measured with sufficient sensitivity in chim-anzee urine, except for progesterone, estriol and �-estradiol,hich occur at lower concentrations in male urine. The threeost abundant steroids are dehydroepiandrosterone, tetrahydro-
ortisone and tetrahydrocortisol—for a correct determination ofhese sample extracts have to be diluted 10-fold. For all otherteroids, the dynamic range of the calibration is suitable if sam-les are concentrated twofold as described in Sections 2.4 and.5.
As a next step, we will investigate which of the tested urinaryetabolites allow for the most reliable monitoring of gonadal
nd adrenal activity in different primate species.
. Conclusions
The developed positive ion LC/ESI–MS/MS method enabledhe measurement of 23 endogenous steroids in primate urine atow nanogram per milliliter level. The method comprises fourlasses of steroid hormones that are relevant to primate behav-oral ecology—namely glucocorticoids, androgens, estrogensnd gestagens. Given the small sample volume typically avail-ble from wild-living primates, the achieved detection limitsf 0.1–0.5 ng/mL have been shown to be sufficient for analyz-ng hormone concentrations in only 200 �L of urine. However,strogens often occur at lower levels in urine, and at presentequire a higher sample volume. The optimization of samplereparation parameters led to the following final conditions:he hydrolysis was performed with 5000 U �-glucuronidase/mLrine with a subsequent extraction of steroids at pH 9.6 usingert-butyl methyl ether.
The sample preparation, including hydrolysis and subsequentolvolysis, can be conducted with a high reproducibility. Sinceithin the hydrolysis with �-glucuronidase from E. coli, only
teroid glucuronides are cleaved, the solvolysis step has proveno be necessary for the correct determination of all investigatedteroids except of tetrahydrocortisol, tetrahydrocortisone andregnandiol.
The described method represents an attractive alternativeo commonly used enzyme immunoassays, whenever a greaterumber of steroids have to be analyzed within the same urineample, especially when cross reactivities of the antibody mightegatively influence the results.
cknowledgements
We wish to thank Dr. Tara Harris for her comments on theanuscript and Dr. Roger Mundry for help with the statistical
nalysis (Primatology, Max Planck Institute for Evolutionarynthropology) and Doreen Schulz (University of Leipzig) for
xtracting the chimpanzee urine samples. We thank the director-
hip of the Taı National Park and the Swiss Research Centre inbidjan (Cote d’Ivoire), as well as the Budongo Forest ProjectUganda) and UWA. Zinta Zommers is acknowleged for giv-ng us access to chimpanzee urine she collected in Budongo
1 matog
FaoPtMagtGtP
A
i
R
[
[[
[
[
[
[
[
[[
[
[[[
[
[
[
[
[
[[
[
[
[[
[
[
[
[
[
[
[
[
[
[44] P. Vestergaard, Acta Endocrinol. (Suppl. 217) (1978, 3) 96.[45] C.W. Weykamp, T.J. Penders, N.A. Schmidt, A.J. Borburgh, J.F. van de
12 B. Hauser et al. / J. Chro
orest Reserve. We thank the Zoological Gardens of Leipzignd Frankfurt am Main. We are grateful to several membersf the Department of Primatology for providing urine samples.rof Weykamp (MCA laboratory, Winterswijk, Netherlands) is
hanked for the possibility of analyzing the survey samples. Dr.anfred Rauh (Department of Pediatris, University of Erlangen)
nd Dr. Uta Ceglarek (ILM, University Hospital Leipzig) areratefully acknowledged for helpful discussions on the valida-ion part. We thank Dr. Mario Thevis (Institute of Biochemistry,erman Sport University, Cologne) for helpful discussion on
he sample preparation. This research was supported by the Maxlanck Society.
ppendix A. Supplementary data
Supplementary data associated with this article can be found,n the online version, at doi:10.1016/j.jchromb.2007.11.009.
eferences
[1] P.L. Whitten, D.K. Brockman, R.C. Stavisky, Yrbk. Phys. Anthropol. 41(1998) 1.
[2] D.H. Abbott, E.B. Keverne, F.B. Bercovitch, C.A. Shively, S.P. Mendoza,W. Saltzman, C.T. Snowdon, T.E. Ziegler, M. Banjevic, T. Garland, R.M.Sapolsky, Horm. Behav. 43 (2003) 67.
[3] R. Palme, S. Rettenbacher, C. Touma, S.M. El-Bahr, E. Mostl, Ann. N. Y.Acad. Sci. 1040 (2005) 162.
[4] S. Creel, Trends Ecol. Evol. 16 (2001) 491.[5] J. Taieb, B. Mathian, F. Millot, M.-C. Patricot, E. Mathieu, N. Queyrel, I.
Lacroix, C. Somma-Delpero, P. Boudou, Clin. Chem. 49 (2003) 1381.[6] A. Ganswindt, R. Palme, M. Heistermann, S. Borragan, J.K. Hodges, Gen.
Comp. Endocrinol. 134 (2003) 156.[7] M. Heistermann, R. Palme, A. Ganswindt, Am. J. Primatol. 68 (2006) 257.[8] P.L. Whitten, R. Stavisky, F. Aurelli, E. Russel, Am. J. Primatol. 44 (1998)
57.[9] N.I. Bahr, R. Palme, U. Mohle, J.K. Hodges, M. Heistermann, Gen. Comp.
Endocrinol. 117 (2000) 427.10] U. Mohle, M. Heistermann, R. Palme, J.K. Hodges, Gen. Comp.
Endocrinol. 129 (2002) 135.11] L.R. Hagey, N.M. Czekala, Gen. Comp. Endocrinol. 130 (2003) 64.12] M.H. Spyridaki, P. Kiousi, A. Valavani, V. Zonara, M. Zahariou, E. Sianos,
G. Tsoupras, C. Georgakopoulos, Anal. Chim. Acta 573/574 (2006) 242.13] A. Leinonen, T. Kuuranne, T. Kotiaho, R. Kostiainen, Steroids 69 (2004)
101.14] F. Buiarelli, F. Coccioli, M. Merolle, B. Neri, A. Terracciano, Anal. Chim.
Acta 526 (2004) 113.15] N.H. Yu, E.N.M. Ho, D.K.K. Leung, T.S.M. Wan, J. Pharm. Biomed. Anal.
37 (2005) 1031.16] A. Gotzmann, M. Thevis, U. Mareck, M. Bredehoft, S. Guddat, W.
Schanzer, in: W. Schanzer, H. Geyer, A. Gotzmann, U. Mareck (Eds.),
Recent Advances in Doping Analysis, vol. 12, Sport und Buch Strauß,Koln, 2004, p. 55.17] J.M. Lacey, C.Z. Minutti, M.J. Magera, A.L. Tauscher, B. Casetta, M.McCann, J. Lymp, S.H. Hahn, P. Rinaldo, D. Matern, Clin. Chem. 50 (2004)621.
[
r. B 862 (2008) 100–112
18] R.L. Taylor, D. Machacek, R.J. Singh, Clin. Chem. 48 (2002) 1511.19] T. Guo, R.L. Taylor, R.J. Singh, S.J. Soldin, Clin. Chim. Acta 372 (2006)
76.20] M.W.F. Nielen, P. Rutgers, E.O. van Bennekom, J.J.P. Lasaroms, J.A. van
Rhijn, J. Chromatogr. B 801 (2004) 273.21] E. Sangiorgi, V. Polignano, S. Gardini, Anal. Chim. Acta 529 (2005) 239.22] C.H.L. Shackleton, J. Chromatogr. 379 (1986) 91.23] E. Mostl, J.L. Maggs, G. Schrotter, U. Besenfelder, R. Palme, Vet. Res.
Commun. 26 (2002) 127.24] B.G. Steinmetz, C. Ducrot, C. Randolph, C.J. Mahoney, J. Med. Prim. 21
(1992) 239.25] T. Deschner, M. Heistermann, K. Hodges, C. Boesch, Anim. Behav. 66
(2003) 551.26] C. von Kuk, U. Flenker, W. Schanzer, in: W. Schanzer, H. Geyer, A. Gotz-
mann, U. Mareck (Eds.), Recent Advanvances in Doping Analysis, vol. 11,Sport und Buch Strauß, Koln, 2003, p. 169.
27] Y.-C. Chang, C.-M. Li, L.-A. Li, S.-B. Jong, P.-C. Liao, L.W. Chang,Analyst 128 (2003) 363.
28] M. Zhao, S.D. Baker, X. Yan, Y. Zhao, W.W. Wright, B.R. Zirkin, J.P.Jarow, Steroids 69 (2004) 721.
29] P. Labadie, E.M. Hill, J. Chromatogr. A 1141 (2007) 174.30] L. Salste, P. Leskinen, M. Virta, L. Kronberg, Sci. Total Environ. 378 (2007)
343.31] T.M. Williams, A.J. Kind, E. Houghton, D.W. Hill, J. Mass Spectrom. 34
(1999) 206.32] E. Vanluchene, W. Eechaute, D. Vandekerckove, J. Steroid Biochem. 16
(1982) 701.33] E. Venturelli, A. Cavalleri, G. Secreto, J. Chromatogr. B 671 (1995) 363.34] B. Le Bizec, F. Bryand, I. Gaudin, F. Monteau, F. Poulain, F. Andre, Steroids
67 (2002) 105.35] L. Mateus-Avois, P. Mangin, M. Saugy, J. Chromatogr. B 816 (2005)
193.36] M. Saugy, C. Cardis, N. Robinson, C. Schweizer, Bailliere’s Clin.
Endocrinol. Metab. 14 (2000) 111.37] M. Van de Wiele, K. De Wasch, J. Vercammen, D. Courtheyn, H. De
Brabander, S. Impens, J. Chromatogr. A 904 (2000) 203.38] R. Gonzalo-Lumbreras, R. Izquierdo-Hornillos, J. Chromatogr. B 742
(2000) 1.39] International Labour Office, Encyclopedia of Occupational Health and
Safety, vols. I and II, International Labour Office, Geneva, Switzerland,1983, p. 786.
40] G.D. Clayton, F.E. Clayton (Eds.), Patty’s Industrial Hygiene and Toxicol-ogy, vols. 2A, 2B, 2C, 2D, 2E and 2F. Toxicology, 4th ed., John Wiley &Sons Inc., New York, NY, 1993–1994, p. 455.
41] U. Mareck, M. Thevis, S. Guddat, A. Gotzmann, M. Bredehoft, H. Geyer,W. Schanzer, in: W. Schanzer, H. Geyer, A. Gotzmann, U. Mareck (Eds.),Recent Advances in Doping Analysis, vol. 12, Sport und Buch Strauß,Koln, 2004, p. 65.
42] M. Thevis, G. Opfermann, H. Schmickler, W. Schanzer, J. Mass Spectrom.36 (2001) 159.
43] M. Mazzarino, F. Rosii, L. Giacomelli, F. Botre, Anal. Chim. Acta 559(2006) 30.
Calseyde, B.J. Wolthers, Clin. Chem. 35 (1989) 2281.46] T. Remer, K.R. Boye, M.F. Hartmann, S.A. Wudy, J. Clin. Endocrinol.
Metab. 90 (2005) 2015.