Embed Size (px)
Citation preview

2018 State Salary Survey Executive Summary
Survey purpose The Office of Financial Management – State Human Resources (State HR) is
required by law (RCW 41.06.160 ) to conduct a salary survey to determine the prevailing pay rates for jobs that are comparable to state government jobs.
State leaders use tools such as the salary survey to help find the appropriate balance among containing the cost of government operations, compensating state employees fairly and competing in the job market for employees with the specialized skills and knowledge required to perform the work of state government.
The salary survey is one source of data and should be used in conjunction with other workforce factors when informing potential changes to employee pay, benefits or working conditions.
Overall summary The state offers health plans that are comparable to other public and private sector
offerings. The state offers dental and retirement plans that are competitive with other public
and private sector offerings. State salary ranges are more competitive at the bottom of the pay range (Step A to
Step M). 13 percent of surveyed state salary range midpoints1 are at or above the estimated
market value2; 48 percent are more than 25 percent below the EMV.
Survey process overview State HR contracted with a national survey firm, Arthur J. Gallagher & Co., to
conduct the survey. Gallagher has more than 32 years of experience. Invitations were sent to 58 public employers; salary and benefit data was collected
for 43 employers through a custom survey or data mined from the employer’s website. Of those, 63 percent are from the in-state public sector and 37 percent are other state governments. Other state governments provide data for jobs found only in state government or when salary information cannot be obtained from the Washington labor market. These states are Arizona, California, Colorado, Idaho, Illinois, Maryland, Massachusetts, Minnesota, Montana, Nevada, New Mexico, Oregon, Pennsylvania, Utah, Virginia and Wyoming.
In-state private sector salary and benefit data was collected through published purchased survey sources.
An additional custom survey was conducted to collect benefit data just from in-state private sector employers with more than 5,000 employees. However, no replies were received.
The survey participants represent union and nonunionized employers. In-state public sector participants represent employers from various geographic regions across the state of Washington.
Survey participation in 2018 increased in all markets:o In-state private sector participation: 2016 = 23; 2018 = 86o In-state public sector participation: 2016 = 23; 2018 = 27o Other state government participation: 2016 = 13; 2018 = 16
1 Salary range midpoint: salary range minimum plus salary range maximum, divided by 22 Estimated market value: the combined average of the median survey results for the in-state public sector, other state governments and the in-state private sector.
OFM/State HR Page 1 of 13 6/4/2018

2018 survey updates Prior to conducting the survey, State HR implemented recommendations from the
2016 survey contractor as well as stakeholder feedback to improve the salary survey process. Survey updates and methodology changes include:
o Revision/updates to benchmark descriptions and indexing as necessary.o Use of the median3 survey result rather than the mean4, as data is less
affected by outliers and produces a more stable result.o Use of published data sources to represent the in-state private sector due to
a steady decline in participation from 2010 through 2016. Survey sources are:
CompData Benchmark Pro 2016 Survey Library Economic Research Institute Gallagher 2017 National Benefits survey Milliman 2017 Northwest Benefits Survey Milliman 2017 Northwest Financial Industry Compensation Survey Milliman 2017 Northwest Healthcare Compensation Survey Milliman 2017 Puget Sound Regional Salary Survey Milliman 2016 Northwest Engineering/Scientific/Project Management
Survey Milliman 2016 Northwest Management and Professional Salary
Survey Milliman 2016 Northwest Utilities Salary & Wage Survey U.S. Medical Expenditure Panel Survey 2016 Willis Towers Watson 2016 Survey Library
o Inclusion of retirement benefit plan data and more comprehensive medical plan data.
o Other state government selection methodology expanded to include states within the continental western states region.
o The in-state public sector, other state government and in-state private sector median results were combined and averaged to calculate the EMV.
o The salary range midpoint for Washington data is derived from middle value of the bottom and top steps of the approved general service salary schedule, including longevity steps.
Key findings – salaries The survey compared salaries for 179 representative (benchmark) jobs. When
looking at benchmarked as well as indexed job classes, the results show:o 13 percent of state salary range midpoints are at or above the EMV.
Example: pharmacy technicians are paid 29 percent above the EMV; forensic scientists are paid 1 percent above the EMV.
o 6 percent of state salary range midpoints are 2.5–10 percent below the EMV. Example: social service specialists are 7 percent below the EMV.
o 33 percent of state salary range midpoints are 12.5-2 percent below the EMV. Example: maintenance mechanics are paid 15 percent below the EMV.
o 48 percent of state salary range midpoints are more than 25 percent below the EMV. Of those classes, 13 percent are more than 50 percent below the EMV. Example: drafting technicians are paid 36 percent below the EMV.
3 Median: the middle value in a set of ranked data points i.e. half the data points are below this level.4 Mean: the value obtained by adding a set of numbers and then dividing the sum by the number of items in the set.
OFM/State HR Page 2 of 13 6/4/20182018 State Salary Survey Executive Summary
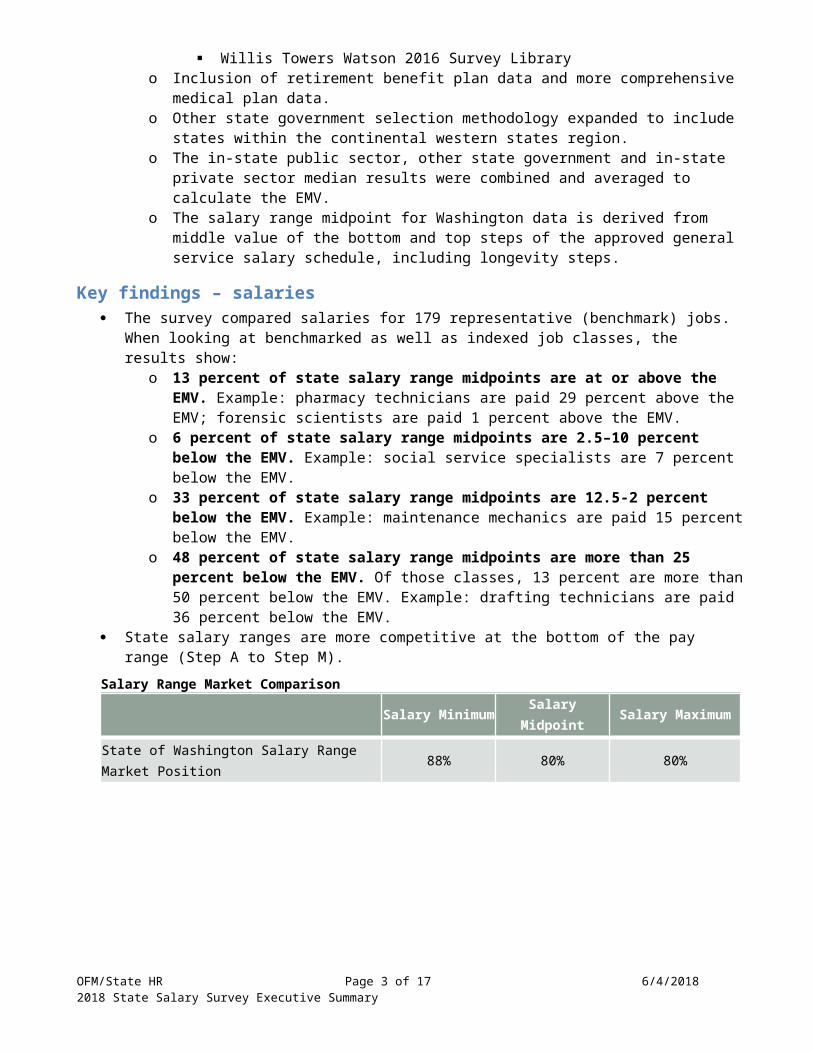
State salary ranges are more competitive at the bottom of the pay range (Step A to Step M).
Salary Range Market ComparisonSalary
MinimumSalary
Midpoint Salary Maximum
State of Washington Salary Range Market Position 88% 80% 80%
OFM/State HR Page 3 of 13 6/4/20182018 State Salary Survey Executive Summary

Key findings – vacation The majority (67 percent) of survey participants provide vacation and sick leave,
instead of paid time off. Vacation and sick leave offered by the state is competitive with the market.Annual Vacation and Paid Time Off Accrual Rates
State of Washington Market MarketYears of Service
Vacation Leave Sick Leave Vacation
Leave Sick Leave Paid Time Off
1 year 14 days 12 days 12 days 12 days 17 days
3 years 15 days 12 days 13 days 12 days 20 days
5 years 17 days 12 days 15 days 12 days 21 days
7 years 18 days 12 days 16 days 12 days 22 days
10 years 20 days 12 days 18 days 12 days 25 days
15 years 22 days 12 days 21 days 12 days 27 days
20 years 24 days 12 days 24 days 12 days 30 days
25 years 25 days 12 days 24 days 12 days 30 days
26+ years 25 days 12 days 25 days 12 days 30 days
OFM/State HR Page 4 of 13 6/4/20182018 State Salary Survey Executive Summary

Key findings – benefits In-state private sector data was derived from three published data sources for
employers in Washington (Gallagher 2017 National Benefits survey, Milliman 2017 Northwest Benefits Survey, U.S. Medical Expenditure Panel Survey 2016).
State employees pay a greater share of the monthly premium than employees in the surveyed market in every tier. However, employee monthly contributions are more comparable to the market as dependents are added to the plan.
Medical Plan, Monthly Employer / Employee Premiums
Market WA State Market WA State Market WA State Market WA StateTier 1
EE OnlyTier 2
EE+SpouseTier 3
EE+Child(ren)Tier 4Family
$0
$200
$400
$600
$800
$1,000
$1,200
$1,400
$1,600
$1,800
$677$525
$1,127 $1,040 $1,105$919
$1,390 $1,434$43
$94
$163$198 $120
$165
$220$269
MOST POPULAR MEDICAL PLANMarket (Median) Medical Premium Contribution Rates
Employer Contribution Employee Contribution
OFM/State HR Page 5 of 13 6/4/20182018 State Salary Survey Executive Summary

Tier 1 Medical Plan, Monthly Employee Premium Share
123456789
1011121314151617181920212223242526272829303132333435
0% 5% 10% 15% 20% 25% 30%25%
16%15%
12%12%
11%10%
10%10%10%
9%8%
7%7%
7%7%
7%7%
6%5%5%5%5%
5%4%
4%3%3%
0%0%0%0%0%0%0%
MOST POPULAR MEDICAL PLANTier 1 - Employee Only
Employee Premium Contribution (%) Toward Medical Plan(Each line represents a participant's employee contribution percentage)
7 employers do not require an
employee contribution
State of Wash
OFM/State HR Page 6 of 13 6/4/2018

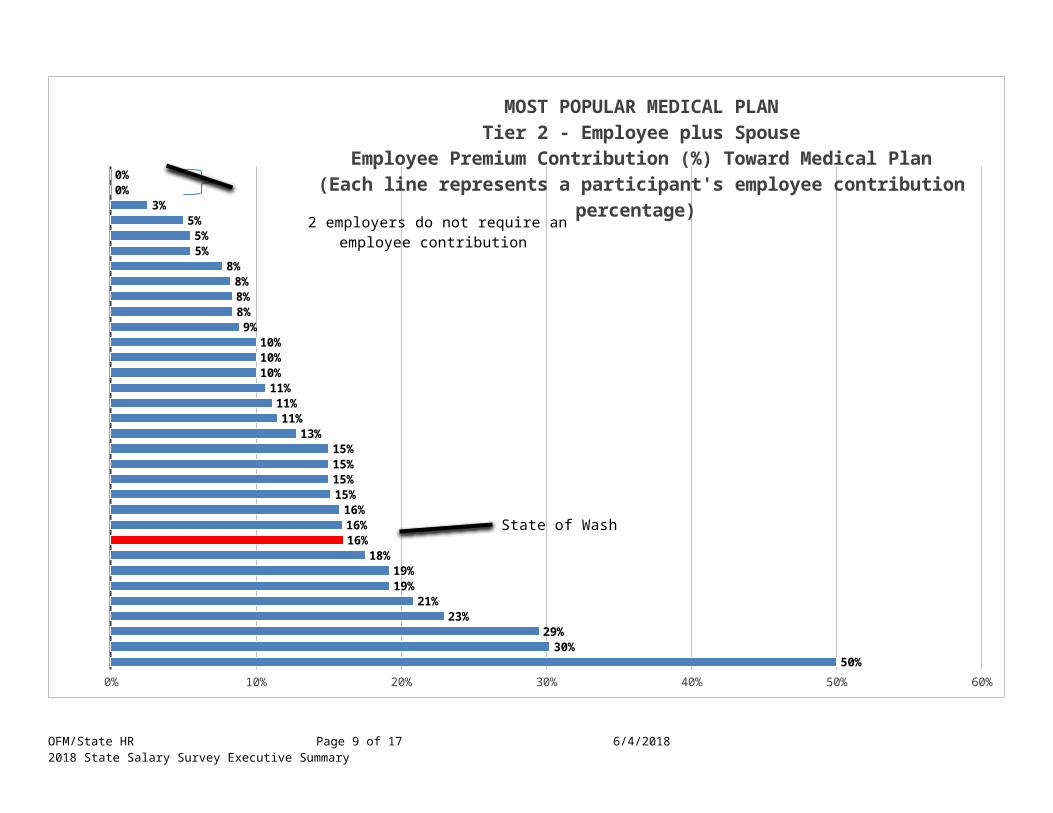
Tier 2 Medical Plan, Monthly Employee Premium Share
123456789
101112131415161718192021222324252627282930313233
0% 10% 20% 30% 40% 50% 60%50%
30%29%
23%21%
19%19%
18%16%16%16%
15%15%15%15%
13%11%
11%11%
10%10%10%
9%8%8%8%
8%5%5%
5%3%
0%0%
MOST POPULAR MEDICAL PLANTier 2 - Employee plus Spouse
Employee Premium Contribution (%) Toward Medical Plan(Each line represents a participant's employee contribution percentage)
2 employers do not require an employee contribution
State of Wash
OFM/State HR Page 7 of 13 6/4/20182018 State Salary Survey Executive Summary

Tier 3 Medical Plan, Monthly Employee Premium Share
OFM/State HR Page 8 of 13 6/4/20182018 State Salary Survey Executive Summary
123456789
10111213141516171819202122232425262728293031
0% 10% 20% 30% 40% 50% 60%51%
48%32%
26%17%
15%15%15%15%
14%12%
11%10%
10%10%10%10%
9%9%
8%8%
8%5%
5%5%
5%4%4%
1%0%0%
MOST POPULAR MEDICAL PLANTier 3 - Employee Child(ren)
Employee Premium Contribution (%) Toward Medical Plan(Each line represents a participant's employee contribution percentage)
2 employers do not require an em-ployee contribution
State of Wash
OFM/State HR Page 9 of 13 6/4/20182018 State Salary Survey Executive Summary

Tier 4 Medical Plan, Monthly Employee Premium Share
OFM/State HR Page 10 of 13 6/4/20182018 State Salary Survey Executive Summary

123456789
1011121314151617181920212223242526272829303132333435
0% 10% 20% 30% 40% 50% 60% 70%66%
51%36%
30%30%
29%27%
24%23%
22%18%
17%16%
16%15%15%
15%14%
12%12%
11%11%
10%10%10%10%
8%8%8%
7%5%
5%3%
0%0%
MOST POPULAR MEDICAL PLANTier 4 - Family
Employee Premium Contribution (%) Toward Medical Plan(Each line represents a participant's employee contribution percentage)
2 employers do not require an employee contribution
State of Wash
OFM/State HR Page 11 of 13 6/4/20182018 State Salary Survey Executive Summary

The state offers a competitive point-of-service cost share for all plan tiers.Health Care Plan, Monthly Employer / Employee Cost Shares5
5 The Actuarial Value/Metal Tier designation, as computed with the Federal AV Calculator, represents the estimated percentage of plan liability for essential health benefits within the in-network plan design, based on national assumptions of annual utilization and cost. The AV/Metal Tier percentage does not reflect local or plan specific costs, or benefits that are nonessential or out-of-network.
OFM/State HR Page 12 of 13 6/4/2018
13%
16%
71%
Tier 2 - Employee + Spouse Medical - WA
13%
15%
72%
Tier 1 - Employee Only Medical - WA
15%
7%
78%
Tier 1 - Employee only medical -
market
Employer percentage share Employee percentage share Point-of-service
15%
10%
75%
Tier 2 - Employee + spouse medical -
market
13%
16%
71%
Tier 4 - Family Medical - WA
13%
15%
72%
Tier 3 - Employee + Child(ren) Medical -
WA
15%
9%
76%
Tier 3 - Employee + child(ren) medical -
market
15%
10%
75%
Tier 4- Family medical -
market

The state leads the market for monthly employee premium contributions for dental plans.
Dental Plan, Employer/Employee Monthly Premiums:
Market WA State Market WA State Market WA State Market WA StateTier 1
EE OnlyTier 2
EE+SpouseTier 3
EE+Child(ren)Tier 4Family
$0
$20
$40
$60
$80
$100
$120
$140
$160
$56 $45
$82 $90 $93 $90$108
$135$0$0
$11$0 $11 $0
$20
$0
MOST POPULAR DENTAL PLANMarket (Median) Medical Premium Contribution Rates
Employer Contribution Employee Contribution
Private sector employers tend to use defined contribution retirement plans over a defined benefit plan.
Most state employees are covered under the Public Employees’ Retirement System 2 plan. Most other public sector employees in Washington who are included in the survey are covered by the same plan.
The state of Washington also offers a hybrid defined contribution/defined benefit plan in addition to the defined benefit PERS 2 plan. In this plan, the state contributes to the defined benefit and the employee contributes to the defined contribution.
Defined Benefit Retirement Plan, Monthly Employer/Employee Contribution Shares
Market Segment Plan Type Employer Contribution*
Employee Contribution
In-state private sector n/a no information 6.10%
In-state public sector PERS 2 Plan 12.7% 7.38%Other state
governments varies by state 11.11% 6.25%*The survey questionnaire did not direct respondents to exclude unfunded liability amounts from employer contribution percentage.
OFM/State HR Page 13 of 13 6/4/20182018 State Salary Survey Executive Summary


![STATE OF THE STATE SURVEY [MSU SOSS 63]](https://img.pdfslide.us/doc/110x75/6195771e3ccc2612ce572e75/state-of-the-state-survey-msu-soss-63.jpg)


![STATE OF THE STATE SURVEY [MSU SOSS-60]](https://img.pdfslide.us/doc/110x75/61957361ccccb928683c5d55/state-of-the-state-survey-msu-soss-60.jpg)