Embed Size (px)
Citation preview
Microsoft Office 2010 -Illustrated Fundamentals
Unit H: Using Complex Formulas,
Functions, and Tables
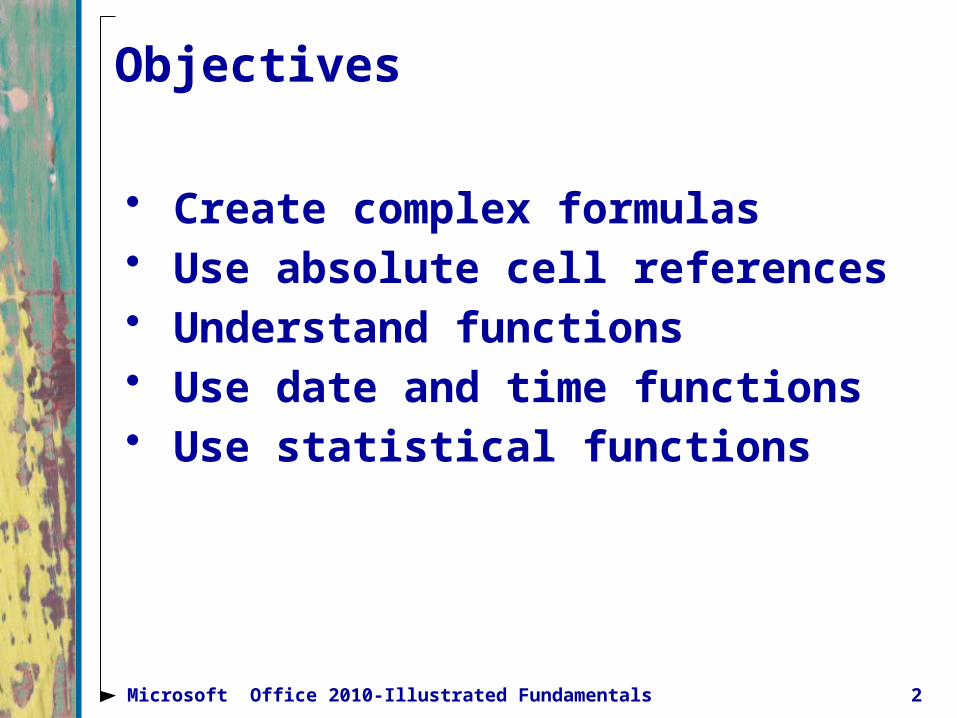
Objectives
• Create complex formulas• Use absolute cell references• Understand functions• Use date and time functions• Use statistical functions
2Microsoft Office 2010-Illustrated Fundamentals
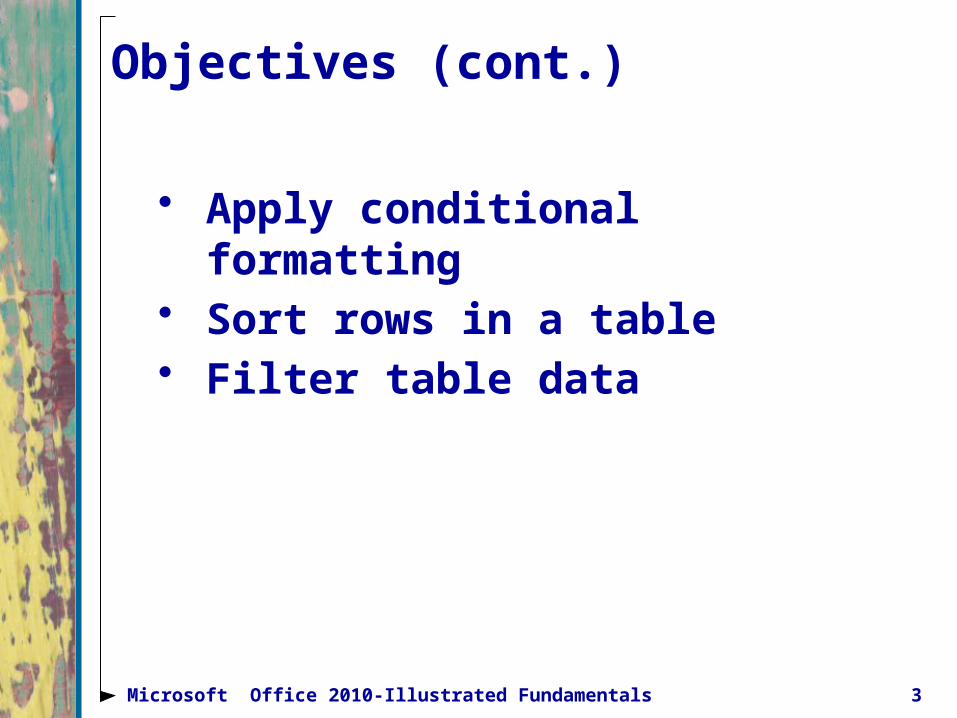
Objectives (cont.)
• Apply conditional formatting• Sort rows in a table• Filter table data
3Microsoft Office 2010-Illustrated Fundamentals
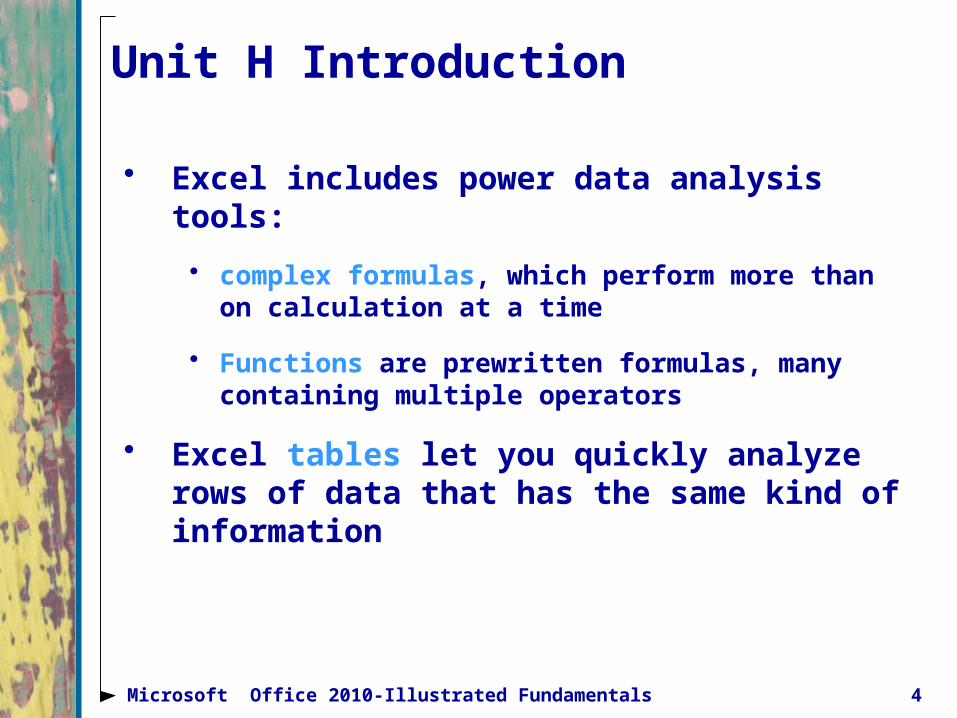
Unit H Introduction
• Excel includes power data analysis tools:
• complex formulas, which perform more than on calculation at a time
• Functions are prewritten formulas, many containing multiple operators
• Excel tables let you quickly analyze rows of data that has the same kind of information
4Microsoft Office 2010-Illustrated Fundamentals
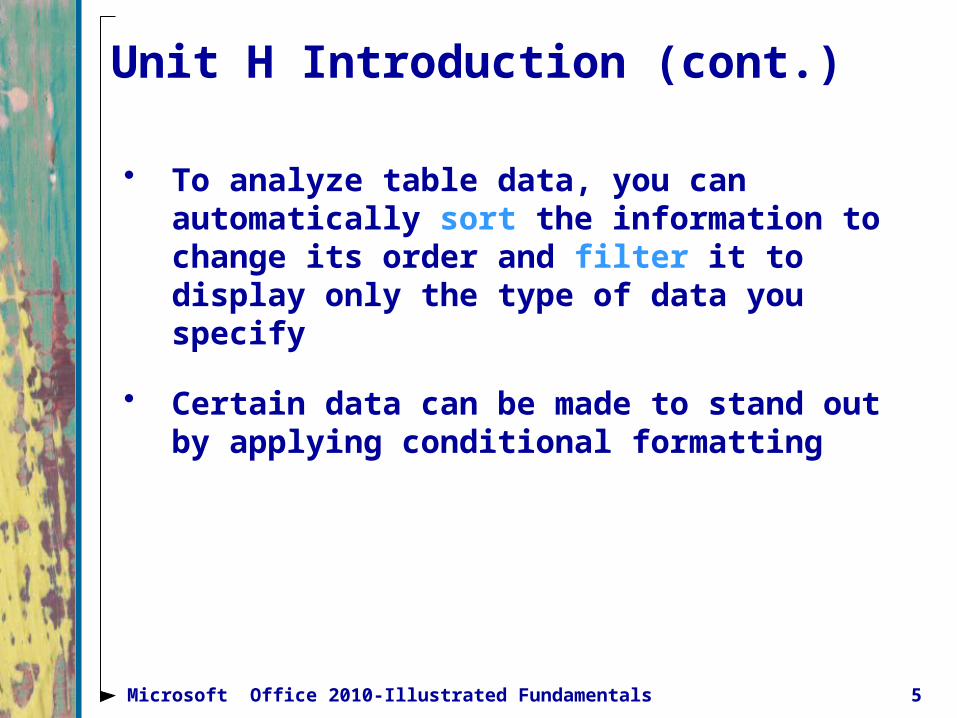
Unit H Introduction (cont.)
• To analyze table data, you can automatically sort the information to change its order and filter it to display only the type of data you specify
• Certain data can be made to stand out by applying conditional formatting
5Microsoft Office 2010-Illustrated Fundamentals
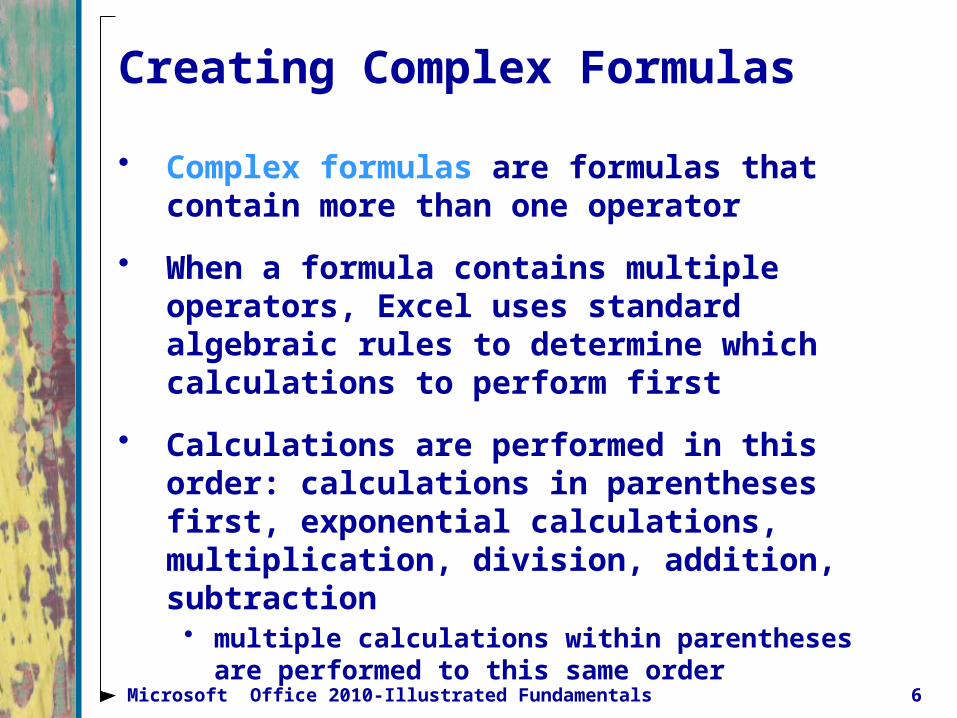
Creating Complex Formulas
• Complex formulas are formulas that contain more than one operator
• When a formula contains multiple operators, Excel uses standard algebraic rules to determine which calculations to perform first
• Calculations are performed in this order: calculations in parentheses first, exponential calculations, multiplication, division, addition, subtraction• multiple calculations within parentheses are performed
to this same order
6Microsoft Office 2010-Illustrated Fundamentals
Creating Complex Formulas(cont.)
7Microsoft Office 2010-Illustrated Fundamentals
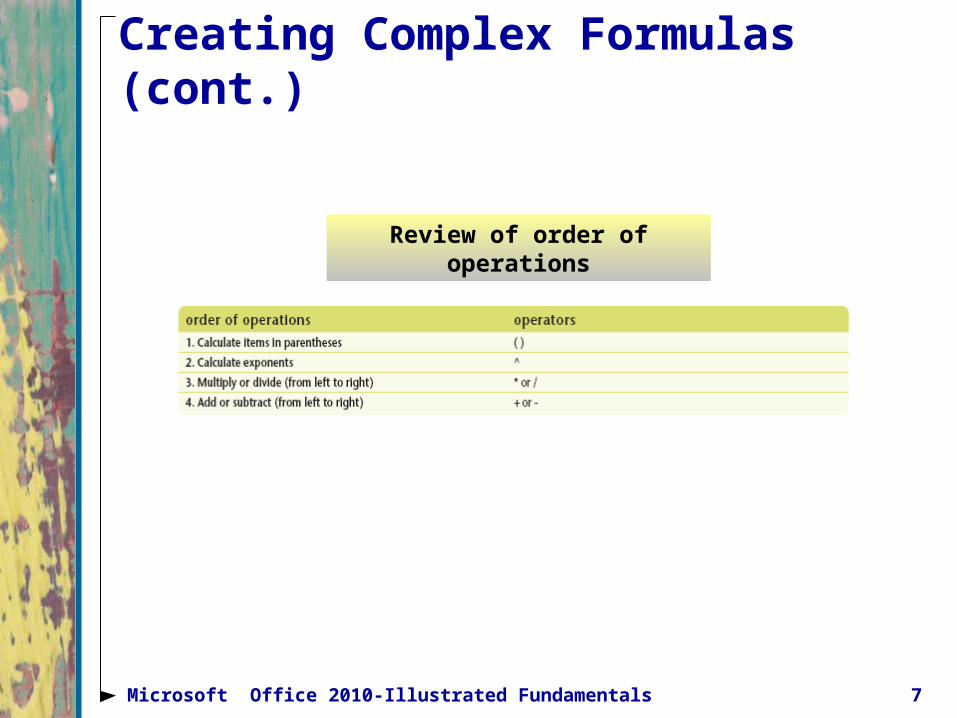
Review of order of operations
Creating Complex Formulas(cont.)
8Microsoft Office 2010-Illustrated Fundamentals
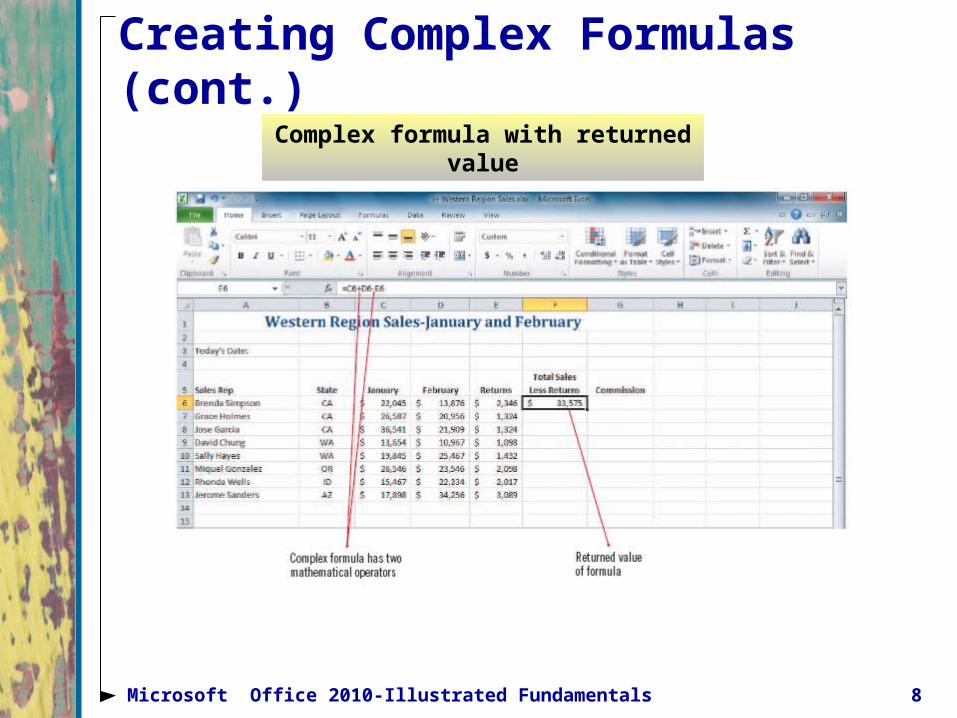
Complex formula with returned value
Using Absolute Cell References
• When you copy a formula from one cell to another, Excel automatically adjusts the cell references
• There may be times that you do not want the cell reference to change, in this case you use an absolute cell reference in the formula
• An absolute cell reference is a cell reference that always stays the same, even when copying• absolute cell references contain a $ symbol before the
column letter and row number (such as $A$1)• to insert an absolute reference, click the cell you want
to use and then press [F4]
9Microsoft Office 2010-Illustrated Fundamentals
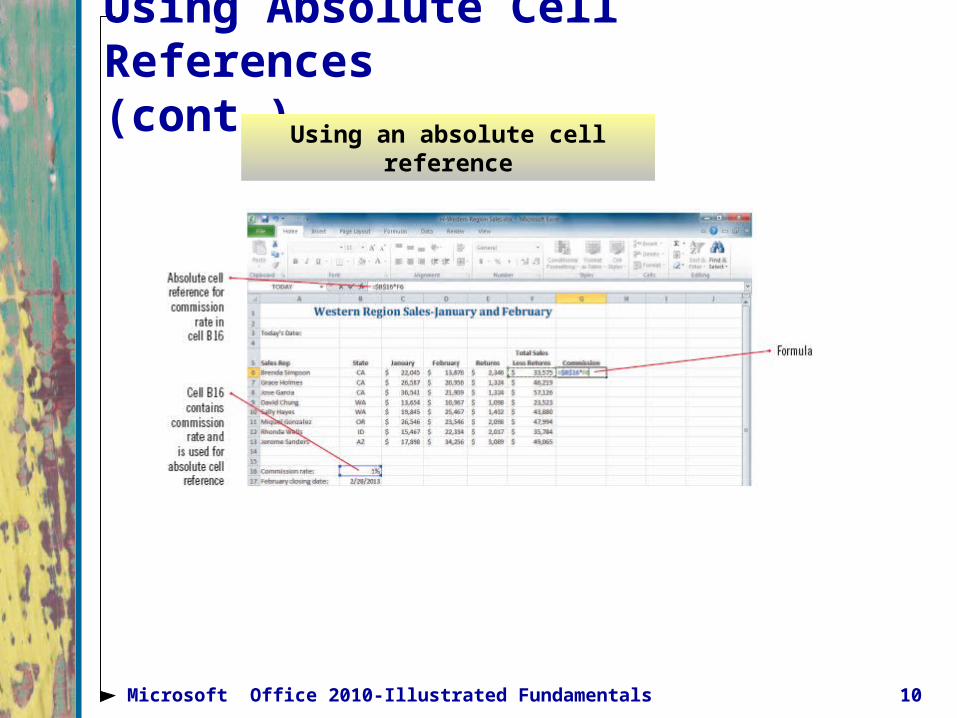
Using Absolute Cell References(cont.)
10Microsoft Office 2010-Illustrated Fundamentals
Using an absolute cell reference
Understanding Functions
• Functions are prewritten formulas provided by Excel
• You can use a function to compose the formula for you• save time• improve accuracy• can be simple or complex
• Each Excel function has a name, usually written in capital letters• the SUM function adds values, the AVERAGE function
calculates the average of a specified range
11Microsoft Office 2010-Illustrated Fundamentals
Understanding Functions (cont.)
• There are four parts to each function: • equal sign, • function name, • a set of parentheses, • and arguments separated by commas and enclosed
in parentheses
• Arguments are all the information a function needs to perform a task
12Microsoft Office 2010-Illustrated Fundamentals
Understanding Functions (cont.)
• Arguments can be values such as (100 or .02), cell references (such as B3), or range references (such as A9:G16)
• Anytime you type an equal sign followed by a letter, a list of valid functions and names beginning with that letter appear which is called Formula AutoComplete
13Microsoft Office 2010-Illustrated Fundamentals
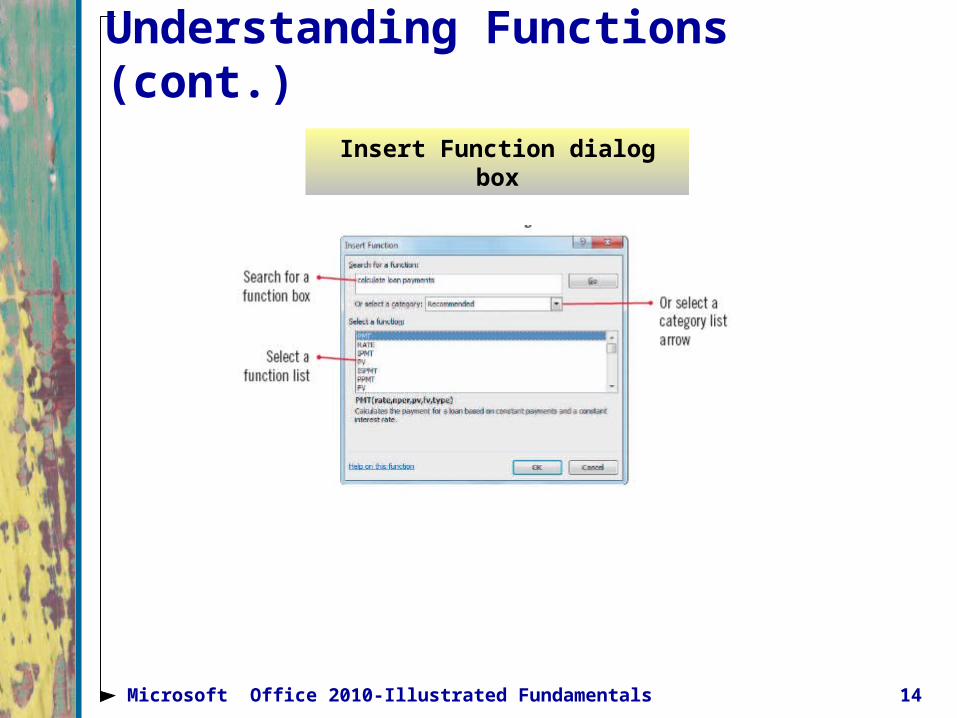
Understanding Functions (cont.)
14Microsoft Office 2010-Illustrated Fundamentals
Insert Function dialog box
Using Date and Time Functions
• The Excel date and time functions let you display the current date and/or time in the worksheet
• Help you calculate time between events
• Some date and time functions produce recognizable text values that can easily be displayed in a worksheet
• Other date and time functions produce values that require special formatting
15Microsoft Office 2010-Illustrated Fundamentals
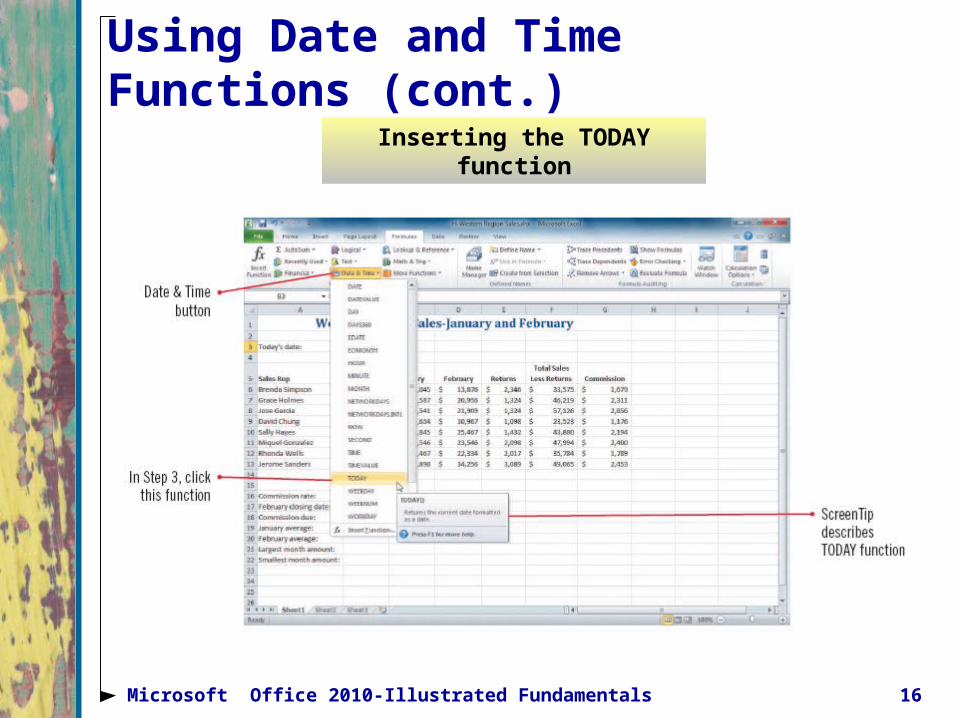
Using Date and Time Functions (cont.)
16Microsoft Office 2010-Illustrated Fundamentals
Inserting the TODAY function
Understanding how dates are calculated using serial values
• Dates are stored as serial values (sequentially numbered since Jan. 1, 1900)
• Dates are stored as serial values so that they can be used in calculations
• Excel displays the serial value that represents the date and you can format the cell to display the date as you desire
17Microsoft Office 2010-Illustrated Fundamentals
Using Statistical Functions
• Excel includes many statistical functions with the most popular being AVERAGE, MIN and MAX• Average - calculate the average of a range of cells• MIN/MAX – calculate the smallest or largest value in a
range of cells
• These functions are available either on the AutoSum list arrow or under Statistical in the More Functions category of the Functions Library or the Insert Functions dialog box
18Microsoft Office 2010-Illustrated Fundamentals
Using the status bar to view average and sum data
• The status bar provides information on average and sum on any selected range
• When a range of cells containing values is selected, the status bar displays data for the average of the selected cells and the sum of selected cells
• The status bar also displays a value for Count, which represents the number of cells selected
19Microsoft Office 2010-Illustrated Fundamentals

Using Statistical Functions (cont.)
20Microsoft Office 2010-Illustrated Fundamentals
Selecting a range using Function Arguments
Using MAX function Using MIN function
Applying Conditional Formatting
• Conditional formatting is used to highlight or emphasize certain information in a worksheet• you specify the conditions to be met for the data to be
emphasized such as highest and lowest product revenues
• Excel applies conditional formatting to cells when specified criteria are met• Color scales are shading patterns that use two or three
colors to show the relative values of a range of cells• Data bars make it easy to quickly identify the large and
small values in a range of cells
21Microsoft Office 2010-Illustrated Fundamentals
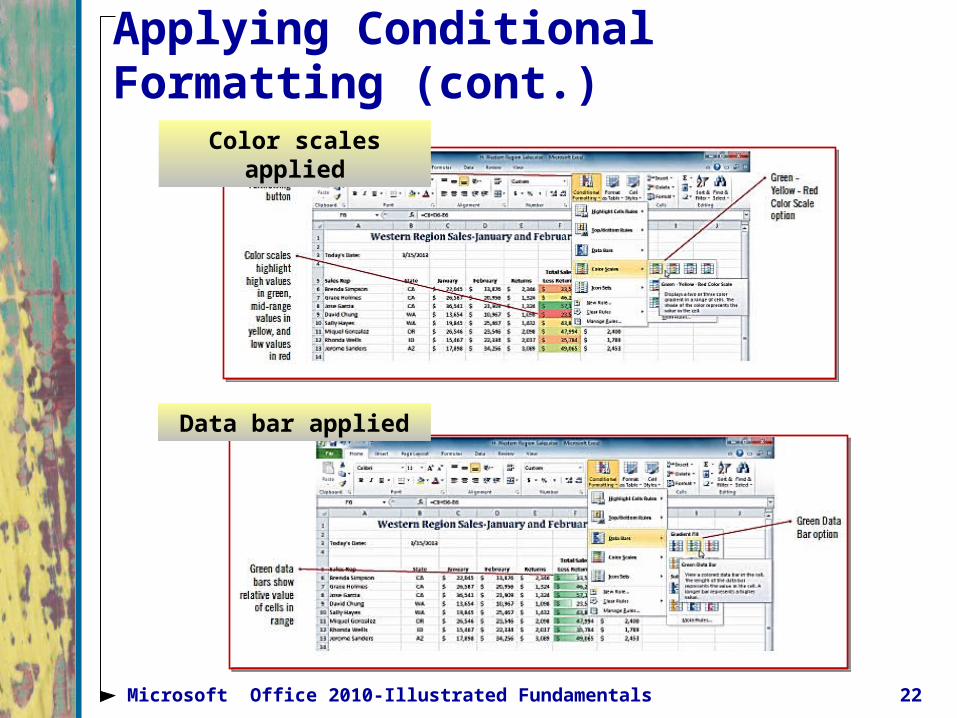
Applying Conditional Formatting (cont.)
22Microsoft Office 2010-Illustrated Fundamentals
Color scales applied
Data bar applied
Sorting Rows in a Table
• A table in Excel consists of rows and columns of data with a similar structure
• You can manage this data separately from the rest of the worksheet
• You can sort, or change the order of the table rows,
• You use the Format as Table button to specify the cell range for the table and the appropriate style
23Microsoft Office 2010-Illustrated Fundamentals
Sorting Rows in a Table (cont.)
• An Excel table is similar to a table in a database because you can sort data in much the same way
• Excel table columns are often called fields and rows of data are called records
• In a table, the header row is the row at the top that contains column headings
• A total row can be added at the bottom of a table when you want to add totals
24Microsoft Office 2010-Illustrated Fundamentals
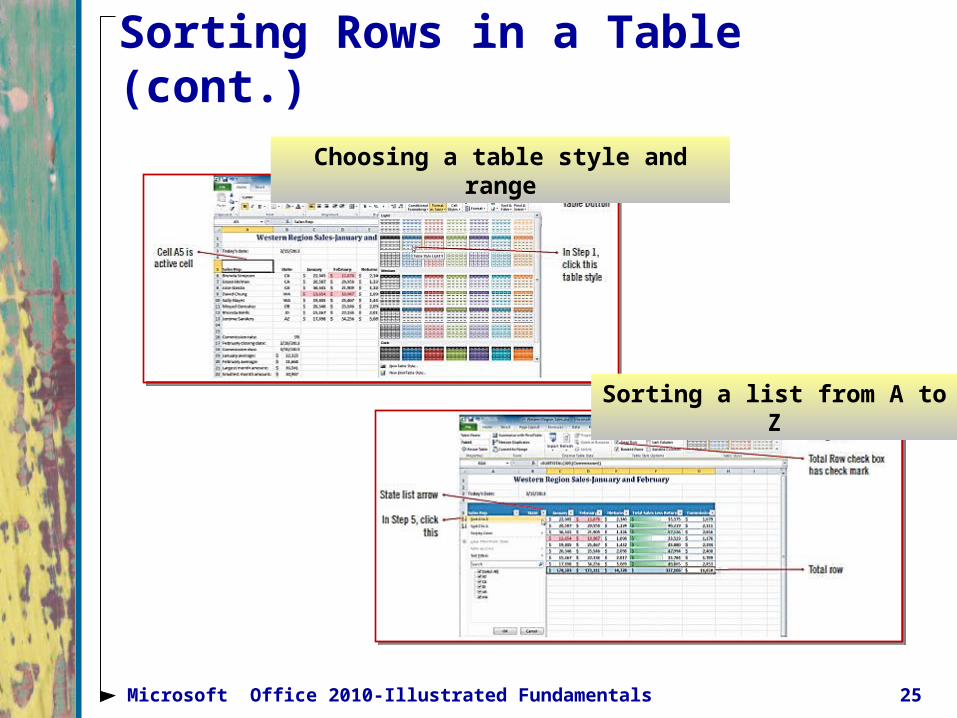
Sorting Rows in a Table (cont.)
25Microsoft Office 2010-Illustrated Fundamentals
Choosing a table style and range
Sorting a list from A to Z
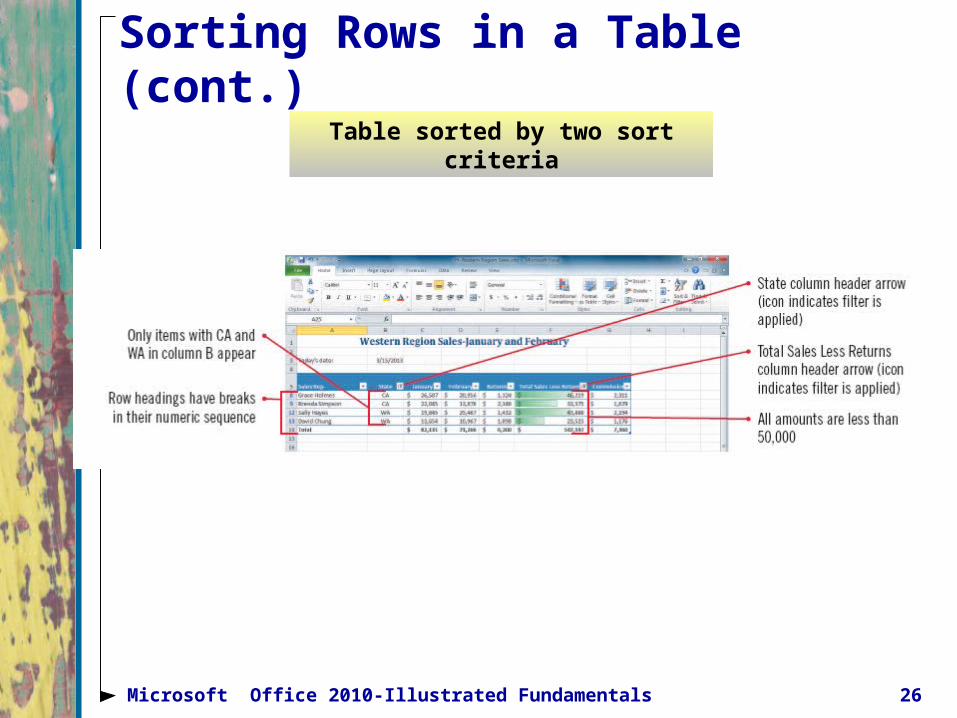
Sorting Rows in a Table (cont.)
26Microsoft Office 2010-Illustrated Fundamentals
Table sorted by two sort criteria
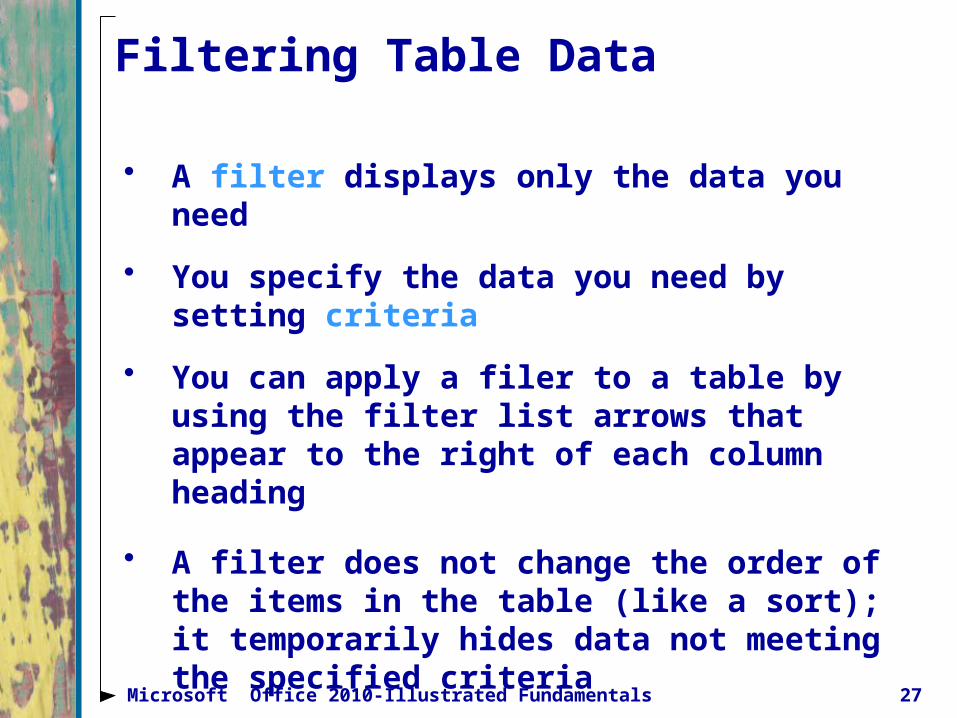
Filtering Table Data
• A filter displays only the data you need
• You specify the data you need by setting criteria
• You can apply a filer to a table by using the filter list arrows that appear to the right of each column heading
• A filter does not change the order of the items in the table (like a sort); it temporarily hides data not meeting the specified criteria
27Microsoft Office 2010-Illustrated Fundamentals
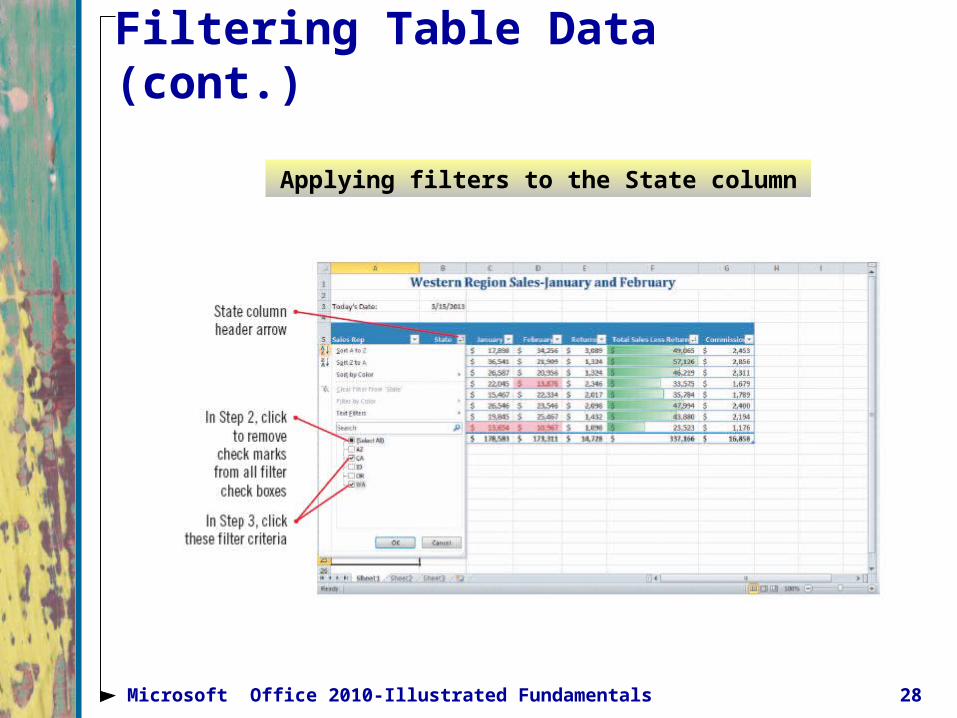
Filtering Table Data (cont.)
28Microsoft Office 2010-Illustrated Fundamentals
Applying filters to the State column
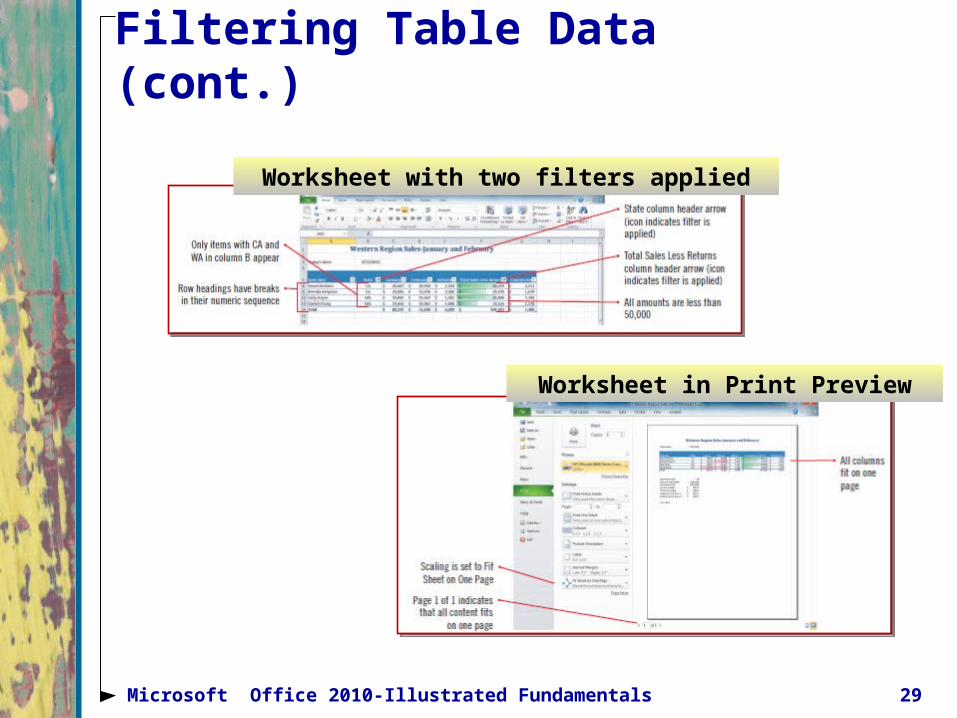
Filtering Table Data (cont.)
29Microsoft Office 2010-Illustrated Fundamentals
Worksheet with two filters applied
Worksheet in Print Preview
Summary
• Excel provides powerful data analysis tools including:• Complex formulas• Functions• Tables• Sorting• Filtering
30Microsoft Office 2010-Illustrated Fundamentals
Summary
• You can use built-in date/time and statistical functions
• Conditional formatting is useful for emphasizing certain data according to conditions you specify
31Microsoft Office 2010-Illustrated Fundamentals