Embed Size (px)
Citation preview

Microsoft Office 2003- Illustrated Introductory, Microsoft Office 2003- Illustrated Introductory, Premium EditionPremium Edition
A PresentationA PresentationEnhancingEnhancing

2Enhancing a Presentation
ObjectivesObjectives
Insert clip artInsert clip art Insert, crop, and scale a pictureInsert, crop, and scale a picture Embed a chartEmbed a chart Enter and edit data in the datasheetEnter and edit data in the datasheet Format a chartFormat a chart

3Enhancing a Presentation
ObjectivesObjectives
Create tables in PowerPointCreate tables in PowerPoint Use slide show commandsUse slide show commands Set slide show timings and Set slide show timings and
transitionstransitions Set slide animation effectsSet slide animation effects

4Enhancing a Presentation
Inserting Clip ArtInserting Clip Art
PowerPoint has professionally PowerPoint has professionally designed images, called designed images, called clip artclip art, that , that you can place in your presentationyou can place in your presentation– Clip art, photographs, movies, and Clip art, photographs, movies, and
sounds are stored in the Microsoft Clip sounds are stored in the Microsoft Clip OrganizerOrganizer
– The Clip Organizer sorts clips into The Clip Organizer sorts clips into groupsgroups
– The Clip Organizer can be customizedThe Clip Organizer can be customized

5Enhancing a Presentation
Inserting Clip Art (cont.)Inserting Clip Art (cont.)
Insert Clip Art task pane
Click to locates clips on the
Web

6Enhancing a Presentation
Inserting, Cropping, and Inserting, Cropping, and Scaling a PictureScaling a Picture A picture in PowerPoint is a scanned A picture in PowerPoint is a scanned
photograph, a piece of line art, clip photograph, a piece of line art, clip art, or other artwork that is created in art, or other artwork that is created in another programanother program– Parts of a picture can be hidden or Parts of a picture can be hidden or
croppedcropped from view from view– A picture’s size can change by dragging A picture’s size can change by dragging
a sizing handle or by a sizing handle or by scalingscaling it by a it by a specific percentagespecific percentage

7Enhancing a Presentation
Inserting, Cropping, and Inserting, Cropping, and Scaling a Picture (cont.)Scaling a Picture (cont.)
Picture sizing handle
Cropping pointer
Inserted picture

8Enhancing a Presentation
Inserting, Cropping, and Inserting, Cropping, and Scaling a Picture (cont.)Scaling a Picture (cont.) Ways to use graphics with PowerPointWays to use graphics with PowerPoint
– A variety of graphics with different file formats A variety of graphics with different file formats can be inserted into a presentationcan be inserted into a presentation
– Most PowerPoint clip art is in Windows Most PowerPoint clip art is in Windows metafile format (.wmf)metafile format (.wmf)
• Graphics with .wmf format can be recolored, Graphics with .wmf format can be recolored, ungrouped, and editedungrouped, and edited
• Graphics with other file formats can’t be edited or Graphics with other file formats can’t be edited or ungroupedungrouped
– PowerPoint slides can be saved as a graphic PowerPoint slides can be saved as a graphic filefile

9Enhancing a Presentation
Embedding a ChartEmbedding a Chart
PowerPoint has a program called PowerPoint has a program called Microsoft Graph that you use to create Microsoft Graph that you use to create charts for your slidescharts for your slides– A A chart chart is a graphical representation of is a graphical representation of
numerical datanumerical data– A A datasheet datasheet contains the numerical data contains the numerical data
displayed in the chartdisplayed in the chart– An inserted chart in PowerPoint is embedded An inserted chart in PowerPoint is embedded
into the presentationinto the presentation• An An embedded embedded object becomes a part of the object becomes a part of the
presentationpresentation

10Enhancing a Presentation
Embedding a Chart (cont.)Embedding a Chart (cont.)
Cell
Active cell
Data label
Row heading
Column heading
Chart
Data series marker
corresponds to data series

11Enhancing a Presentation
Entering and Editing Data Entering and Editing Data in the Datasheetin the Datasheet After a chart is embedded into a After a chart is embedded into a
presentation, you need to replace the presentation, you need to replace the data with your owndata with your own– Import data from another source or Import data from another source or
enter your ownenter your own– The chart automatically reflects the The chart automatically reflects the
changes you make in the datasheetchanges you make in the datasheet– Vertical axis is the Vertical axis is the Value axisValue axis– Horizontal axis is the Horizontal axis is the Category axisCategory axis

12Enhancing a Presentation
Entering and Editing Data Entering and Editing Data in the Datasheet (cont.)in the Datasheet (cont.)
Icons identify legend labels

13Enhancing a Presentation
Entering and Editing Data Entering and Editing Data in the Datasheet (cont.)in the Datasheet (cont.)
Series in Rows vs. Series in ColumnsSeries in Rows vs. Series in Columns– Series in Rows means that the Series in Rows means that the
information in the rows are on the Value information in the rows are on the Value axis and displayed in the legendaxis and displayed in the legend
– Series in Columns means that the Series in Columns means that the information in the columns are on the information in the columns are on the Value axis and displayed in the legendValue axis and displayed in the legend

14Enhancing a Presentation
Formatting a ChartFormatting a Chart
Change the appearance of a chart to Change the appearance of a chart to emphasize certain elementsemphasize certain elements– Change the chart type (pie, column, Change the chart type (pie, column,
bar, etc.)bar, etc.)– Create titles, format chart labels, move Create titles, format chart labels, move
the legend, add other elementsthe legend, add other elements– Change fill color, pattern, and line styleChange fill color, pattern, and line style

15Enhancing a Presentation
Formatting a Chart (cont.)Formatting a Chart (cont.)
Chart title
Rotated axis title
Moved legend

16Enhancing a Presentation
Formatting a Chart (cont.)Formatting a Chart (cont.)
Customizing chartsCustomizing charts– Customize the look of a data series by Customize the look of a data series by
changing its fill color, border, shape, or changing its fill color, border, shape, or data labeldata label
– Double-click any data series element to Double-click any data series element to open the Format Data Series dialog boxopen the Format Data Series dialog box
– Change the depth of 3-D chartsChange the depth of 3-D charts

17Enhancing a Presentation
Creating Tables in PowerPointCreating Tables in PowerPoint
Used to display information in a row Used to display information in a row and column formatand column format– Create using the Insert Table button on Create using the Insert Table button on
the Standard toolbarthe Standard toolbar– Format using the Formatting toolbar or Format using the Formatting toolbar or
the Tables and Borders toolbarthe Tables and Borders toolbar

18Enhancing a Presentation
Creating Tables in PowerPoint Creating Tables in PowerPoint (cont.)(cont.)
Table

19Enhancing a Presentation
Using Slide Show CommandsUsing Slide Show Commands
Show a presentation using Slide Show a presentation using Slide Show viewShow view– Use slide show options to customize Use slide show options to customize
the slide showthe slide show– Draw, or Draw, or annotateannotate, on the screen, on the screen– Jump to other slides in the presentationJump to other slides in the presentation

20Enhancing a Presentation
Using Slide Show Commands Using Slide Show Commands (cont.)(cont.)
Slide Show keyboard commands

21Enhancing a Presentation
Using Slide Show Commands Using Slide Show Commands (cont.)(cont.)
Highlight pen
Annotation
22Enhancing a Presentation
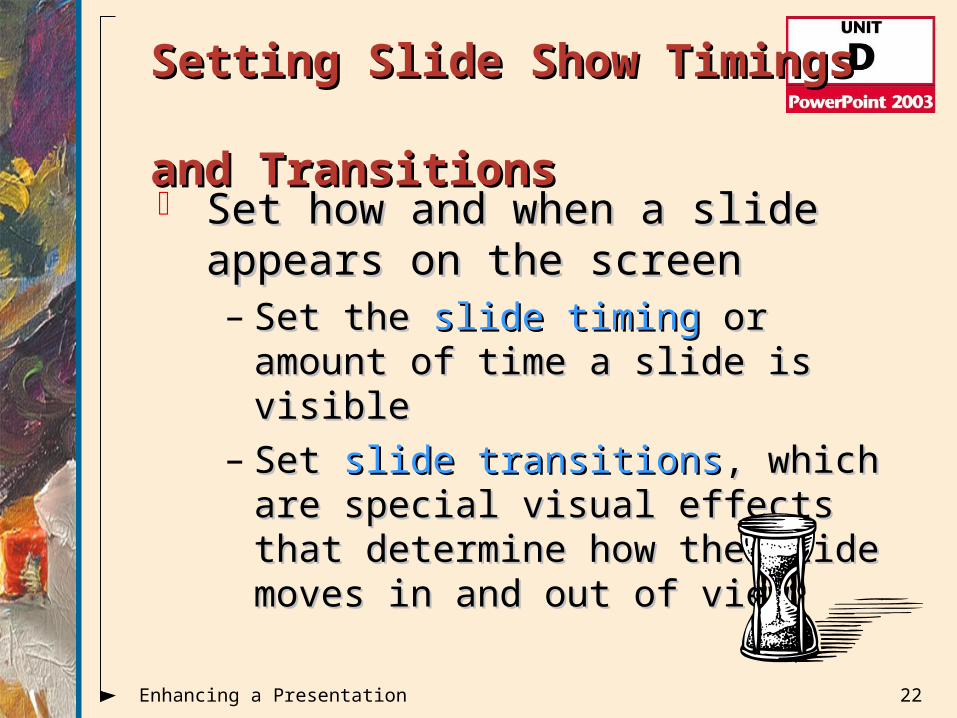
Setting Slide Show Timings Setting Slide Show Timings and Transitionsand Transitions Set how and when a slide appears Set how and when a slide appears
on the screenon the screen– Set the Set the slide timingslide timing or amount of time a or amount of time a
slide is visibleslide is visible– Set Set slide transitionsslide transitions, which are special , which are special
visual effects that determine how the visual effects that determine how the slide moves in and out of viewslide moves in and out of view

23Enhancing a Presentation
Setting Slide Show Timings Setting Slide Show Timings and Transitions (cont.)and Transitions (cont.)
Slide Transition task
pane
Slide timing
Transition icon

24Enhancing a Presentation
Setting Slide Show Timings Setting Slide Show Timings and Transitions (cont.)and Transitions (cont.) Rehearsing slide show timingsRehearsing slide show timings
– Use the Rehearse Timings button on Use the Rehearse Timings button on the Slide Sorter toolbar to set the Slide Sorter toolbar to set customized timings for each slidecustomized timings for each slide
– Useful when you have a self-running Useful when you have a self-running presentationpresentation
Rehearsal toolbar

25Enhancing a Presentation
Setting Slide Animation Setting Slide Animation EffectsEffects
Animation effects let you control how text Animation effects let you control how text and graphics appear on the screen during and graphics appear on the screen during a slide showa slide show– You can set custom animation effects or an You can set custom animation effects or an
animation schemeanimation scheme• An An animation schemeanimation scheme is a set of predefines visual is a set of predefines visual
effects for the slide transition, title text, and bullet effects for the slide transition, title text, and bullet points of the slidepoints of the slide
– Animation tagsAnimation tags identify what elements are identify what elements are animatedanimated

26Enhancing a Presentation
Setting Slide Animation Setting Slide Animation Effects (cont.)Effects (cont.)
Animation tag
Some effects show an
animation path
Custom Animation task
pane

27Enhancing a Presentation
Setting Slide Animation Setting Slide Animation Effects (cont.)Effects (cont.)
Presentation ChecklistPresentation Checklist– You should always rehearse your slide show, You should always rehearse your slide show,
if possible, in the room and with the equipment if possible, in the room and with the equipment you will useyou will use
– Use the following points to help you prepare to Use the following points to help you prepare to give a presentation:give a presentation:
• Make sure PowerPoint or the PowerPoint Viewer is Make sure PowerPoint or the PowerPoint Viewer is installed on the computerinstalled on the computer
• Make sure you have the presentation fileMake sure you have the presentation file• Check the projection deviceCheck the projection device• Know how to control the room lightingKnow how to control the room lighting• Make sure you have all materialsMake sure you have all materials