Embed Size (px)
Citation preview
MicroRNAtitration by
pseudo-targets
Introduction
An alternativehypothesis
Testing thehypothesis
miRNA quantification
mRNA quantification
Relative abundance ofmiRNAs and mRNAs
Conclusion
Supplementarydata
MicroRNA titration by pseudo-targets: analternative explanation to seed match
conservation
Herve Seitz
IGH (CNRS), Montpellier, France
February 2, 2014
MicroRNAtitration by
pseudo-targets
Introduction
An alternativehypothesis
Testing thehypothesis
miRNA quantification
mRNA quantification
Relative abundance ofmiRNAs and mRNAs
Conclusion
Supplementarydata
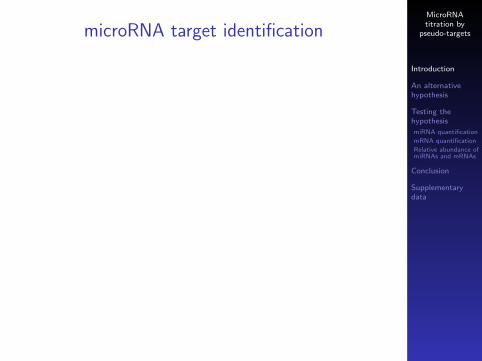
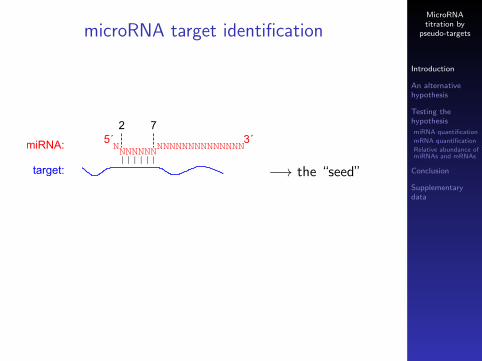
microRNA target identification
.
||||||NNNNNNN NNNNNNNNNNNNNN
5´ 3´miRNA:
target:
2 7
−→ the “seed”
MicroRNAtitration by
pseudo-targets
Introduction
An alternativehypothesis
Testing thehypothesis
miRNA quantification
mRNA quantification
Relative abundance ofmiRNAs and mRNAs
Conclusion
Supplementarydata
microRNA target identification
Computational programs for target prediction: look for seedmatches in 3´ UTRs, select the ones that were conserved inevolution.
Such short matches are very frequent (60 % of humancoding genes seem to be targeted: Friedman et al., 2009).
=⇒ miRNAs are implicated in every physiological process inanimals.
miRNA-mediated repression is very modest (usually< 2-fold): lower than well tolerated fluctuations in geneexpression (e.g., haplosufficiency). Why have these sitesbeen conserved if they are not functional?

MicroRNAtitration by
pseudo-targets
Introduction
An alternativehypothesis
Testing thehypothesis
miRNA quantification
mRNA quantification
Relative abundance ofmiRNAs and mRNAs
Conclusion
Supplementarydata
An alternative hypothesis
microRNA
mRNA
mRNA
.

MicroRNAtitration by
pseudo-targets
Introduction
An alternativehypothesis
Testing thehypothesis
miRNA quantification
mRNA quantification
Relative abundance ofmiRNAs and mRNAs
Conclusion
Supplementarydata
An alternative hypothesis
.
mRNA
mRNA
microRNA
MicroRNAtitration by
pseudo-targets
Introduction
An alternativehypothesis
Testing thehypothesis
miRNA quantification
mRNA quantification
Relative abundance ofmiRNAs and mRNAs
Conclusion
Supplementarydata
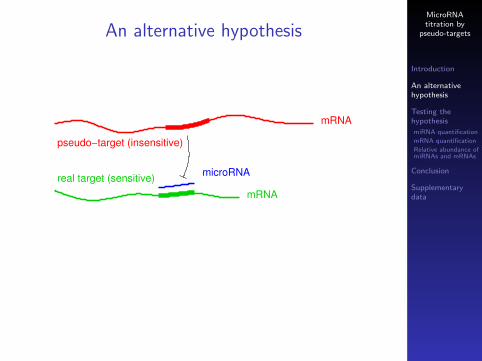
An alternative hypothesis
pseudo−target (insensitive)
real target (sensitive)
mRNA
mRNA
microRNA
.
MicroRNAtitration by
pseudo-targets
Introduction
An alternativehypothesis
Testing thehypothesis
miRNA quantification
mRNA quantification
Relative abundance ofmiRNAs and mRNAs
Conclusion
Supplementarydata
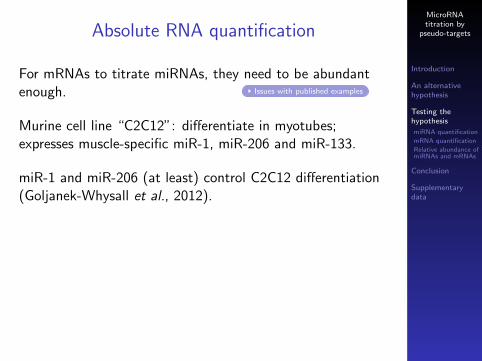
Absolute RNA quantification
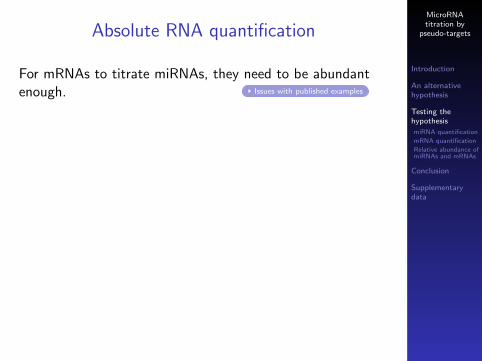
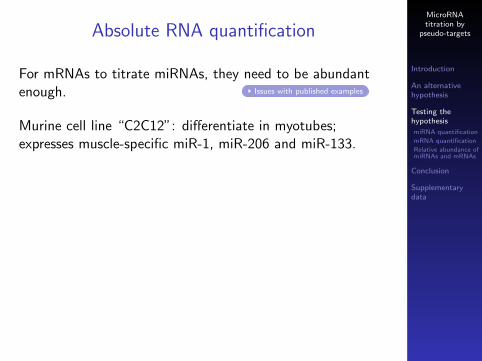
For mRNAs to titrate miRNAs, they need to be abundantenough. Issues with published examples
Murine cell line “C2C12”: differentiate in myotubes;expresses muscle-specific miR-1, miR-206 and miR-133.
miR-1 and miR-206 (at least) control C2C12 differentiation(Goljanek-Whysall et al., 2012).
=⇒ quantification of miR-1, miR-206, miR-133 and theirpredicted targets in differentiating C2C12.
I miRNAs: Northern blot (calibrated with RNA oligos);
I mRNAs: RNA-Seq (calibrated with in vitro transcripts).
MicroRNAtitration by
pseudo-targets
Introduction
An alternativehypothesis
Testing thehypothesis
miRNA quantification
mRNA quantification
Relative abundance ofmiRNAs and mRNAs
Conclusion
Supplementarydata
Absolute RNA quantification
For mRNAs to titrate miRNAs, they need to be abundantenough. Issues with published examples
Murine cell line “C2C12”: differentiate in myotubes;expresses muscle-specific miR-1, miR-206 and miR-133.
miR-1 and miR-206 (at least) control C2C12 differentiation(Goljanek-Whysall et al., 2012).
=⇒ quantification of miR-1, miR-206, miR-133 and theirpredicted targets in differentiating C2C12.
I miRNAs: Northern blot (calibrated with RNA oligos);
I mRNAs: RNA-Seq (calibrated with in vitro transcripts).

MicroRNAtitration by
pseudo-targets
Introduction
An alternativehypothesis
Testing thehypothesis
miRNA quantification
mRNA quantification
Relative abundance ofmiRNAs and mRNAs
Conclusion
Supplementarydata
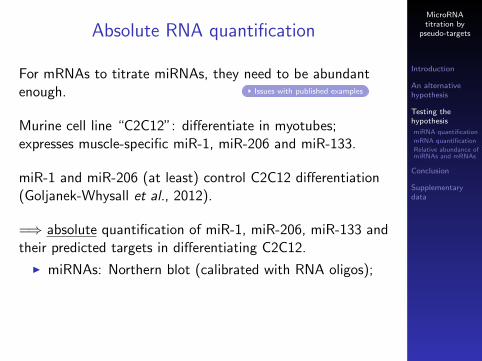
Absolute RNA quantification
For mRNAs to titrate miRNAs, they need to be abundantenough. Issues with published examples
Murine cell line “C2C12”: differentiate in myotubes;expresses muscle-specific miR-1, miR-206 and miR-133.
miR-1 and miR-206 (at least) control C2C12 differentiation(Goljanek-Whysall et al., 2012).
=⇒ absolute quantification of miR-1, miR-206, miR-133 andtheir predicted targets in differentiating C2C12.
I miRNAs: Northern blot (calibrated with RNA oligos);
I mRNAs: RNA-Seq (calibrated with in vitro transcripts).

MicroRNAtitration by
pseudo-targets
Introduction
An alternativehypothesis
Testing thehypothesis
miRNA quantification
mRNA quantification
Relative abundance ofmiRNAs and mRNAs
Conclusion
Supplementarydata
Absolute RNA quantification
For mRNAs to titrate miRNAs, they need to be abundantenough. Issues with published examples
Murine cell line “C2C12”: differentiate in myotubes;expresses muscle-specific miR-1, miR-206 and miR-133.
miR-1 and miR-206 (at least) control C2C12 differentiation(Goljanek-Whysall et al., 2012).
=⇒ absolute quantification of miR-1, miR-206, miR-133 andtheir predicted targets in differentiating C2C12.
I miRNAs: Northern blot (calibrated with RNA oligos);
I mRNAs: RNA-Seq (calibrated with in vitro transcripts).
MicroRNAtitration by
pseudo-targets
Introduction
An alternativehypothesis
Testing thehypothesis
miRNA quantification
mRNA quantification
Relative abundance ofmiRNAs and mRNAs
Conclusion
Supplementarydata
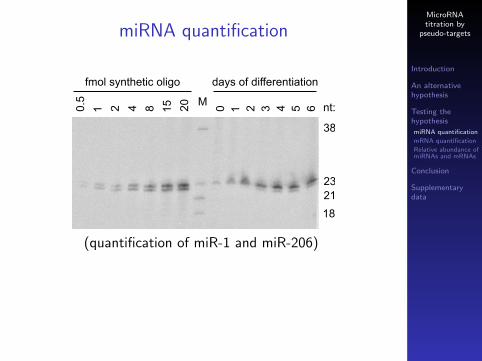
miRNA quantification
M10.
5
2 4 8 15 20 0 1 2 3 4 5 6
fmol synthetic oligo days of differentiation
18
2123
38
nt:
(quantification of miR-1 and miR-206)

MicroRNAtitration by
pseudo-targets
Introduction
An alternativehypothesis
Testing thehypothesis
miRNA quantification
mRNA quantification
Relative abundance ofmiRNAs and mRNAs
Conclusion
Supplementarydata
miRNA quantification
0 1 2 3 4 5 6
05000
10000
15000
20000
25000
miRNA abundance during C2C12 differentiation
Day of differentiation
miR
NA
mole
cule
s p
er
cell
miR−1 + miR−206
miR−133

MicroRNAtitration by
pseudo-targets
Introduction
An alternativehypothesis
Testing thehypothesis
miRNA quantification
mRNA quantification
Relative abundance ofmiRNAs and mRNAs
Conclusion
Supplementarydata
mRNA quantification
MicroRNAtitration by
pseudo-targets
Introduction
An alternativehypothesis
Testing thehypothesis
miRNA quantification
mRNA quantification
Relative abundance ofmiRNAs and mRNAs
Conclusion
Supplementarydata
mRNA quantification
Very deep sequencing: three time points (day 0, day 3, day6) in triplicate; each replicate: between 267 and 333 milliontranscriptome-matching reads. Statistics
27 synthetic spike-ins, for calibration.
MicroRNAtitration by
pseudo-targets
Introduction
An alternativehypothesis
Testing thehypothesis
miRNA quantification
mRNA quantification
Relative abundance ofmiRNAs and mRNAs
Conclusion
Supplementarydata
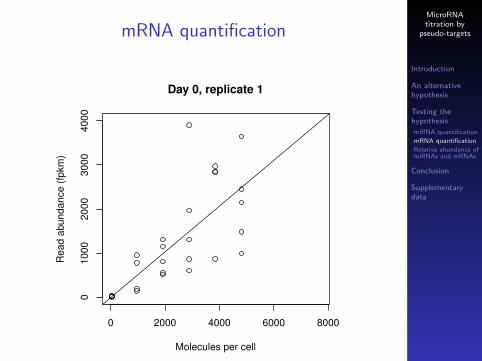
mRNA quantification
0 2000 4000 6000 8000
01000
2000
3000
4000
Day 0, replicate 1
Molecules per cell
Read a
bundance (
fpkm
)

MicroRNAtitration by
pseudo-targets
Introduction
An alternativehypothesis
Testing thehypothesis
miRNA quantification
mRNA quantification
Relative abundance ofmiRNAs and mRNAs
Conclusion
Supplementarydata
mRNA quantification
0 2000 4000 6000 8000
010
0020
0030
0040
00Day 0, replicate 1
Molecules per cell
Rea
dab
unda
nce
(fpkm
)
miR-1/miR-206 sitesmiR-133 sites

MicroRNAtitration by
pseudo-targets
Introduction
An alternativehypothesis
Testing thehypothesis
miRNA quantification
mRNA quantification
Relative abundance ofmiRNAs and mRNAs
Conclusion
Supplementarydata
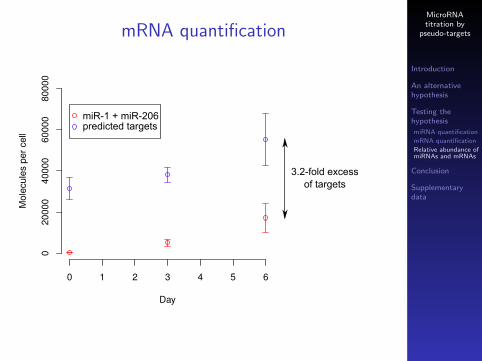
mRNA quantification
Day
Mol
ecul
espe
rcel
l
0 1 2 3 4 5 6
020
000
4000
060
000
8000
0
miR-1 + miR-206predicted targets
MicroRNAtitration by
pseudo-targets
Introduction
An alternativehypothesis
Testing thehypothesis
miRNA quantification
mRNA quantification
Relative abundance ofmiRNAs and mRNAs
Conclusion
Supplementarydata
mRNA quantification
Day
Mol
ecul
espe
rcel
l
0 1 2 3 4 5 6
020
000
4000
060
000
8000
0
3.2-fold excessof targets
miR-1 + miR-206predicted targets

MicroRNAtitration by
pseudo-targets
Introduction
An alternativehypothesis
Testing thehypothesis
miRNA quantification
mRNA quantification
Relative abundance ofmiRNAs and mRNAs
Conclusion
Supplementarydata
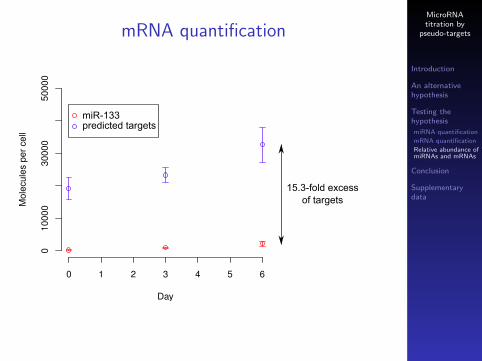
mRNA quantification
Day
Mol
ecul
espe
rcel
l
0 1 2 3 4 5 6
010
000
3000
050
000
miR-133predicted targets
MicroRNAtitration by
pseudo-targets
Introduction
An alternativehypothesis
Testing thehypothesis
miRNA quantification
mRNA quantification
Relative abundance ofmiRNAs and mRNAs
Conclusion
Supplementarydata
mRNA quantification
Day
Mol
ecul
espe
rcel
l
0 1 2 3 4 5 6
010
000
3000
050
000
15.3-fold excessof targets
miR-133predicted targets

MicroRNAtitration by
pseudo-targets
Introduction
An alternativehypothesis
Testing thehypothesis
miRNA quantification
mRNA quantification
Relative abundance ofmiRNAs and mRNAs
Conclusion
Supplementarydata
Concentration effects
MicroRNAtitration by
pseudo-targets
Introduction
An alternativehypothesis
Testing thehypothesis
miRNA quantification
mRNA quantification
Relative abundance ofmiRNAs and mRNAs
Conclusion
Supplementarydata
Concentration effects

MicroRNAtitration by
pseudo-targets
Introduction
An alternativehypothesis
Testing thehypothesis
miRNA quantification
mRNA quantification
Relative abundance ofmiRNAs and mRNAs
Conclusion
Supplementarydata
Concentration effects

MicroRNAtitration by
pseudo-targets
Introduction
An alternativehypothesis
Testing thehypothesis
miRNA quantification
mRNA quantification
Relative abundance ofmiRNAs and mRNAs
Conclusion
Supplementarydata
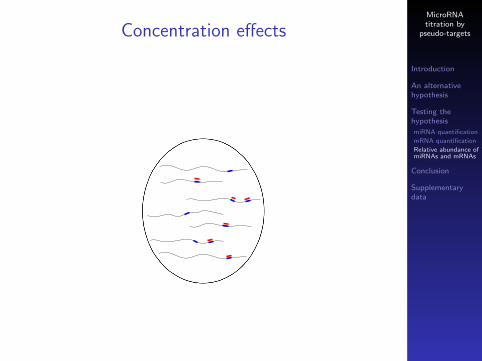
Concentration effects
Predicted targetsmiRNA family Total Above 10×Kd
miR-1 and miR-206 436 31 (7 %)
miR-133 384 22 (6 %)
(Kd value taken from Wee et al., 2012: 26 pM)

MicroRNAtitration by
pseudo-targets
Introduction
An alternativehypothesis
Testing thehypothesis
miRNA quantification
mRNA quantification
Relative abundance ofmiRNAs and mRNAs
Conclusion
Supplementarydata
Concentration effects
Titration effect of individual miRNA binding sites:
mRNA Sample Increase in free miR-1/miR-206if site is lost
Anxa2 Day 0 8 %Ptma Day 0 9 %
Tmsb4x Day 0 10 %
Actb Day 3 15 %Tmsb4x Day 3 9 %
Actb Day 6 13 %Tmsb4x Day 6 11 %

MicroRNAtitration by
pseudo-targets
Introduction
An alternativehypothesis
Testing thehypothesis
miRNA quantification
mRNA quantification
Relative abundance ofmiRNAs and mRNAs
Conclusion
Supplementarydata
Concentration effects
Titration effect of individual miRNA binding sites:
mRNA Sample Increase in free miR-133if site is lost
Tpm4 Day 0 5 %Ptma Day 0 16 %Eif4a1 Day 0 5 %Tagln2 Day 0 6 %
Ptma Day 3 7 %Eef1a1 Day 3 8 %
Ptma Day 6 6 %Eef1a1 Day 6 6 %
Titrator expression profiles

MicroRNAtitration by
pseudo-targets
Introduction
An alternativehypothesis
Testing thehypothesis
miRNA quantification
mRNA quantification
Relative abundance ofmiRNAs and mRNAs
Conclusion
Supplementarydata
Conclusion
miRNA titration by mRNAs does occur.

MicroRNAtitration by
pseudo-targets
Introduction
An alternativehypothesis
Testing thehypothesis
miRNA quantification
mRNA quantification
Relative abundance ofmiRNAs and mRNAs
Conclusion
Supplementarydata
Conclusion
miRNA titration by mRNAs does occur.
MicroRNAtitration by
pseudo-targets
Introduction
An alternativehypothesis
Testing thehypothesis
miRNA quantification
mRNA quantification
Relative abundance ofmiRNAs and mRNAs
Conclusion
Supplementarydata
Conclusion
miRNA titration by mRNAs does occur.
Every cell where miR-1, miR-206, miR-133 titration isbeneficial may express a different set of miRNA titrators.
=⇒ It cannot be assumed that every conserved binding sitemediates functional target repression.
The number of miRNA targets has probably beenoverestimated.

MicroRNAtitration by
pseudo-targets
Introduction
An alternativehypothesis
Testing thehypothesis
miRNA quantification
mRNA quantification
Relative abundance ofmiRNAs and mRNAs
Conclusion
Supplementarydata
Acknowledgements
Anna Laura Natalia BlaiseSergeeva Martinez Pinzon Restrepo Li

MicroRNAtitration by
pseudo-targets
Introduction
An alternativehypothesis
Testing thehypothesis
miRNA quantification
mRNA quantification
Relative abundance ofmiRNAs and mRNAs
Conclusion
Supplementarydata
Acknowledgements
Anna Laura Natalia BlaiseSergeeva Martinez Pinzon Restrepo Li

MicroRNAtitration by
pseudo-targets
Introduction
An alternativehypothesis
Testing thehypothesis
miRNA quantification
mRNA quantification
Relative abundance ofmiRNAs and mRNAs
Conclusion
Supplementarydata
Supplementary data
An alternative hypothesis:Robustness of biological pathways
Non-discriminative predictions (coordinated targeting)
Non-discriminative predictions (expression domains)
Non-discriminative predictions (house-keeping genes)
Testing the hypothesis:RNA-seq technical reproducibility RNA-seq biological reproducibility
Issues with published examples Experimental procedure
Amount of RNA per cell Differentiation controls
Cell volume Sequencing depth
Titrator expression profiles Abundance vs. conservation
Conclusion:Pseudo-targets for other regulators?
Propagation of gene expression perturbation
MicroRNAtitration by
pseudo-targets
Introduction
An alternativehypothesis
Testing thehypothesis
miRNA quantification
mRNA quantification
Relative abundance ofmiRNAs and mRNAs
Conclusion
Supplementarydata
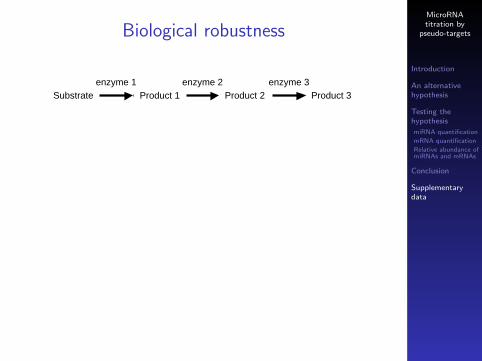
Biological robustness
Substrate Product 1 Product 2 Product 3enzyme 1 enzyme 2 enzyme 3

MicroRNAtitration by
pseudo-targets
Introduction
An alternativehypothesis
Testing thehypothesis
miRNA quantification
mRNA quantification
Relative abundance ofmiRNAs and mRNAs
Conclusion
Supplementarydata
Non-discriminative predictions
Targets for a given miRNA often belong to the samebiological pathways.
mRNA for gene 1
mRNA for gene 4
mRNA for gene 3
mRNA for gene 2
miRNA
MicroRNAtitration by
pseudo-targets
Introduction
An alternativehypothesis
Testing thehypothesis
miRNA quantification
mRNA quantification
Relative abundance ofmiRNAs and mRNAs
Conclusion
Supplementarydata
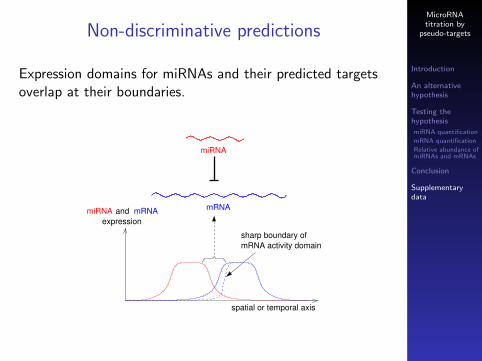
Non-discriminative predictions
Expression domains for miRNAs and their predicted targetsoverlap at their boundaries.
sharp boundary ofmRNA activity domain
miRNA
mRNAmiRNA
spatial or temporal axis
expressionand mRNA

MicroRNAtitration by
pseudo-targets
Introduction
An alternativehypothesis
Testing thehypothesis
miRNA quantification
mRNA quantification
Relative abundance ofmiRNAs and mRNAs
Conclusion
Supplementarydata
Non-discriminative predictions
Expression domains for miRNAs and their predicted targetsoverlap at their boundaries.
sharp boundary ofmiRNA activity domain
miRNA
mRNA
miRNA
spatial or temporal axis
expressionmRNAand
MicroRNAtitration by
pseudo-targets
Introduction
An alternativehypothesis
Testing thehypothesis
miRNA quantification
mRNA quantification
Relative abundance ofmiRNAs and mRNAs
Conclusion
Supplementarydata
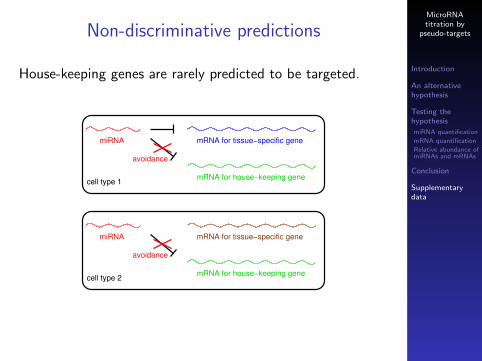
Non-discriminative predictions
House-keeping genes are rarely predicted to be targeted.
mRNA for house−keeping gene
mRNA for house−keeping gene
miRNA mRNA for tissue−specific gene
cell type 1
miRNA mRNA for tissue−specific gene
cell type 2
avoidance
avoidance

MicroRNAtitration by
pseudo-targets
Introduction
An alternativehypothesis
Testing thehypothesis
miRNA quantification
mRNA quantification
Relative abundance ofmiRNAs and mRNAs
Conclusion
Supplementarydata
Non-discriminative predictions
House-keeping genes are rarely predicted to be targeted.
mRNA for house−keeping gene
mRNA for house−keeping gene
miRNA
miRNA
mRNA for tissue−specific gene
cell type 2
mRNA for tissue−specific gene
cell type 1
avoidance
avoidance
MicroRNAtitration by
pseudo-targets
Introduction
An alternativehypothesis
Testing thehypothesis
miRNA quantification
mRNA quantification
Relative abundance ofmiRNAs and mRNAs
Conclusion
Supplementarydata
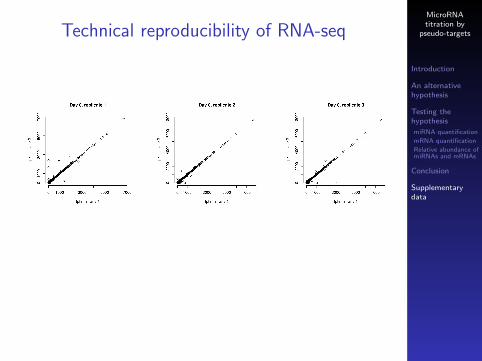
Technical reproducibility of RNA-seq

MicroRNAtitration by
pseudo-targets
Introduction
An alternativehypothesis
Testing thehypothesis
miRNA quantification
mRNA quantification
Relative abundance ofmiRNAs and mRNAs
Conclusion
Supplementarydata
Technical reproducibility of RNA-seq

MicroRNAtitration by
pseudo-targets
Introduction
An alternativehypothesis
Testing thehypothesis
miRNA quantification
mRNA quantification
Relative abundance ofmiRNAs and mRNAs
Conclusion
Supplementarydata
Technical reproducibility of RNA-seq
MicroRNAtitration by
pseudo-targets
Introduction
An alternativehypothesis
Testing thehypothesis
miRNA quantification
mRNA quantification
Relative abundance ofmiRNAs and mRNAs
Conclusion
Supplementarydata
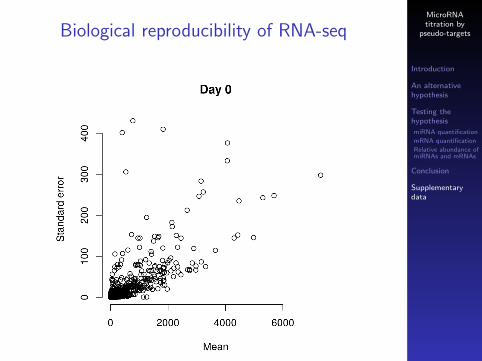
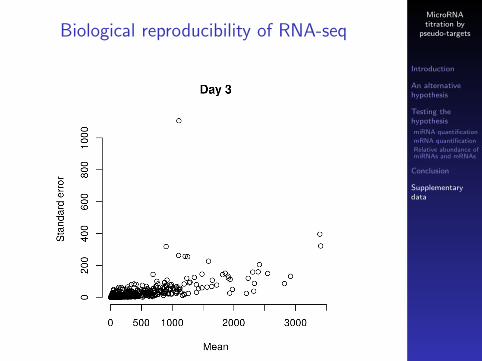
Biological reproducibility of RNA-seq
MicroRNAtitration by
pseudo-targets
Introduction
An alternativehypothesis
Testing thehypothesis
miRNA quantification
mRNA quantification
Relative abundance ofmiRNAs and mRNAs
Conclusion
Supplementarydata
Biological reproducibility of RNA-seq

MicroRNAtitration by
pseudo-targets
Introduction
An alternativehypothesis
Testing thehypothesis
miRNA quantification
mRNA quantification
Relative abundance ofmiRNAs and mRNAs
Conclusion
Supplementarydata
Biological reproducibility of RNA-seq

MicroRNAtitration by
pseudo-targets
Introduction
An alternativehypothesis
Testing thehypothesis
miRNA quantification
mRNA quantification
Relative abundance ofmiRNAs and mRNAs
Conclusion
Supplementarydata
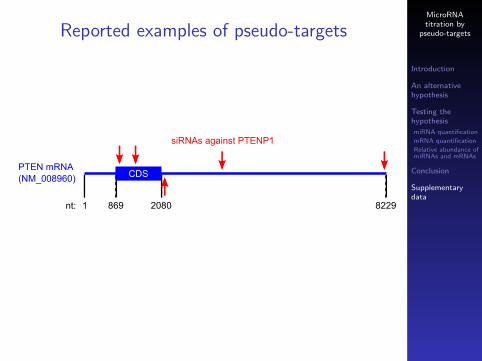
Reported examples of pseudo-targets
A proposed pseudo-target: PTENP1, that de-repressedPTEN (Poliseno et al., 2010).

MicroRNAtitration by
pseudo-targets
Introduction
An alternativehypothesis
Testing thehypothesis
miRNA quantification
mRNA quantification
Relative abundance ofmiRNAs and mRNAs
Conclusion
Supplementarydata
Reported examples of pseudo-targets
A proposed pseudo-target: PTENP1, that de-repressedPTEN (Poliseno et al., 2010).
But PTENP1 mRNA is ≈ 100 times less abundant than thePTEN mRNA (Ebert and Sharp, 2010).
MicroRNAtitration by
pseudo-targets
Introduction
An alternativehypothesis
Testing thehypothesis
miRNA quantification
mRNA quantification
Relative abundance ofmiRNAs and mRNAs
Conclusion
Supplementarydata
Reported examples of pseudo-targets
PTEN mRNA(NM_008960)
1 869 2080 8229nt:
CDS
siRNAs against PTENP1

MicroRNAtitration by
pseudo-targets
Introduction
An alternativehypothesis
Testing thehypothesis
miRNA quantification
mRNA quantification
Relative abundance ofmiRNAs and mRNAs
Conclusion
Supplementarydata
Reported examples of pseudo-targets
Proposed by Poliseno et al (2010):
PTENP1 mRNA
PTEN mRNA
siRNAs
miRNAs
More probably:
siRNAs
PTEN mRNA

MicroRNAtitration by
pseudo-targets
Introduction
An alternativehypothesis
Testing thehypothesis
miRNA quantification
mRNA quantification
Relative abundance ofmiRNAs and mRNAs
Conclusion
Supplementarydata
Reported examples of pseudo-targets
UAAUAAUCAUCAUUCUGGC |||||| ||| |||GUUAUUA----UAA-ACCU
5´ 3´
3´ 5´
siRNA #2 against PTENP1:
PTEN mRNA (nt 948-961):
UAAUAAUCAUCAUUCUGGC |||||| ||| :| |AUUAUUAUAUGUAUCGCGG
5´ 3´
3´ 5´PTEN mRNA (nt 1383-1401):
siRNA #2 against PTENP1:
UAAUAAUCAUCAUUCUGGC |||||| ||||AUUAUUACC-----GACCU
5´ 3´
3´ 5´PTEN mRNA (nt 3769-3782):
siRNA #2 against PTENP1:
UAAUAAUC-AUCAUUCUGGC |||||| |:| |::UUUAUUACUUGGAAAAAUUA
5´ 3´
3´ 5´PTEN mRNA (nt 8189-8208):
siRNA #2 against PTENP1:
UCCUAUA--UGAUCUCUGAUG |||||| || |||||::AGGAUAUUGACGUUAGACUGU
5´ 3´
3´ 5´PTEN mRNA (nt 2192-2212):
siRNA #3 against PTENP1:
MicroRNAtitration by
pseudo-targets
Introduction
An alternativehypothesis
Testing thehypothesis
miRNA quantification
mRNA quantification
Relative abundance ofmiRNAs and mRNAs
Conclusion
Supplementarydata
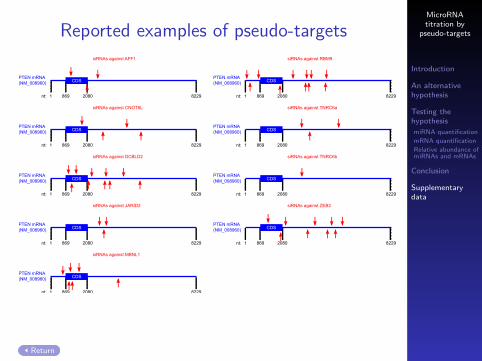
Reported examples of pseudo-targetssiRNAs against AFF1
PTEN mRNA(NM_008960)
1 869 2080 8229nt:
CDS
PTEN mRNA(NM_008960)
1 869 2080 8229nt:
CDS
siRNAs against CNOT6L
PTEN mRNA(NM_008960)
1 869 2080 8229nt:
CDS
siRNAs against DCBLD2
PTEN mRNA(NM_008960)
1 869 2080 8229nt:
CDS
siRNAs against JARID2
PTEN mRNA(NM_008960)
1 869 2080 8229nt:
CDS
siRNAs against MBNL1
PTEN mRNA(NM_008960)
1 869 2080 8229nt:
CDS
siRNAs against TNRC6b
siRNAs against RBM9
PTEN mRNA(NM_008960)
1 869 2080 8229nt:
CDS
PTEN mRNA(NM_008960)
1 869 2080 8229nt:
CDS
siRNAs against TNRC6a
PTEN mRNA(NM_008960)
1 869 2080 8229nt:
CDS
siRNAs against ZEB2
Return

MicroRNAtitration by
pseudo-targets
Introduction
An alternativehypothesis
Testing thehypothesis
miRNA quantification
mRNA quantification
Relative abundance ofmiRNAs and mRNAs
Conclusion
Supplementarydata
Absolute RNA quantification
C2C12 cells
0 to 6 days of differentiation
Amount of RNA per cell Return
Differentiation controls

MicroRNAtitration by
pseudo-targets
Introduction
An alternativehypothesis
Testing thehypothesis
miRNA quantification
mRNA quantification
Relative abundance ofmiRNAs and mRNAs
Conclusion
Supplementarydata
Absolute RNA quantification
C2C12 cells
0 to 6 days of differentiation
Flowcytometry
MicroscopyRNAextraction
Numberof cells
Cellvolume
miRNAand mRNA
quantification
Amount of RNA per cell Return
Differentiation controls

MicroRNAtitration by
pseudo-targets
Introduction
An alternativehypothesis
Testing thehypothesis
miRNA quantification
mRNA quantification
Relative abundance ofmiRNAs and mRNAs
Conclusion
Supplementarydata
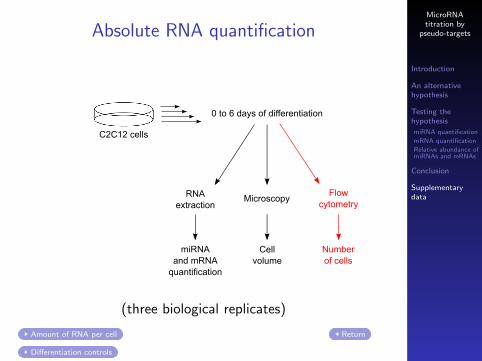
Absolute RNA quantification
C2C12 cells
0 to 6 days of differentiation
Flowcytometry
MicroscopyRNAextraction
Numberof cells
Cellvolume
miRNAand mRNA
quantification
Amount of RNA per cell Return
Differentiation controls
MicroRNAtitration by
pseudo-targets
Introduction
An alternativehypothesis
Testing thehypothesis
miRNA quantification
mRNA quantification
Relative abundance ofmiRNAs and mRNAs
Conclusion
Supplementarydata
Absolute RNA quantification
C2C12 cells
0 to 6 days of differentiation
Flowcytometry
MicroscopyRNAextraction
Numberof cells
Cellvolume
miRNAand mRNA
quantification
(three biological replicates)
Amount of RNA per cell Return
Differentiation controls

MicroRNAtitration by
pseudo-targets
Introduction
An alternativehypothesis
Testing thehypothesis
miRNA quantification
mRNA quantification
Relative abundance ofmiRNAs and mRNAs
Conclusion
Supplementarydata
Absolute RNA quantification
Number of cells
Qua
ntity
ofR
NA
(µg)
Day 0Day 1Day 2Day 3Day 4Day 5Day 6
050
100
150
200
250
300
0 0.5×10⁷ 1×10⁷ 1.5×10⁷ 2×10⁷
Return

MicroRNAtitration by
pseudo-targets
Introduction
An alternativehypothesis
Testing thehypothesis
miRNA quantification
mRNA quantification
Relative abundance ofmiRNAs and mRNAs
Conclusion
Supplementarydata
Differentiation controls
Myogenin
Days
Exp
ressio
n (
fpkm
)
0 1 2 3 4 5 6
05
01
00
15
02
00
25
03
00
Myosin heavy chain polypeptide 1
Days
Exp
ressio
n (
fpkm
)
0 1 2 3 4 5 60
10
20
30
40
50
Return
MicroRNAtitration by
pseudo-targets
Introduction
An alternativehypothesis
Testing thehypothesis
miRNA quantification
mRNA quantification
Relative abundance ofmiRNAs and mRNAs
Conclusion
Supplementarydata
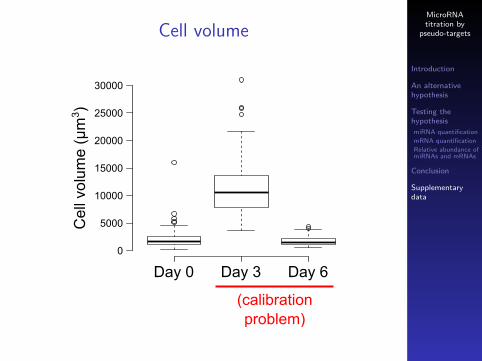
Cell volume
Cel
l vol
ume
(μm
3 )
Day 0 Day 3 Day 6
0
5000
10000
15000
20000
25000
30000
(calibrationproblem)
MicroRNAtitration by
pseudo-targets
Introduction
An alternativehypothesis
Testing thehypothesis
miRNA quantification
mRNA quantification
Relative abundance ofmiRNAs and mRNAs
Conclusion
Supplementarydata
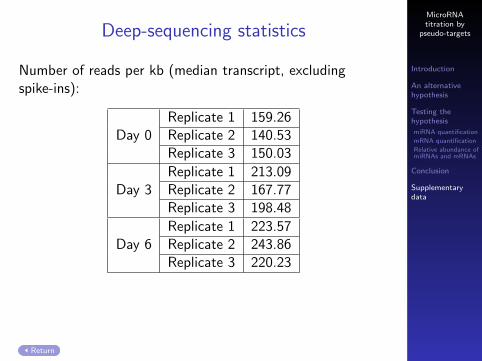
Deep-sequencing statistics
Number of reads per kb (median transcript, excludingspike-ins):
Replicate 1 159.26Day 0 Replicate 2 140.53
Replicate 3 150.03
Replicate 1 213.09Day 3 Replicate 2 167.77
Replicate 3 198.48
Replicate 1 223.57Day 6 Replicate 2 243.86
Replicate 3 220.23
Return

MicroRNAtitration by
pseudo-targets
Introduction
An alternativehypothesis
Testing thehypothesis
miRNA quantification
mRNA quantification
Relative abundance ofmiRNAs and mRNAs
Conclusion
Supplementarydata
Concentration effects
Day
Intra
cellu
larc
once
ntra
tion
(mol
/L)
0 1 2 3 4 5 6
0.0e
+00
1.0e
−08
2.0e
−08
Kd
miR-1 + miR-206Tmsb4x mRNA
Return

MicroRNAtitration by
pseudo-targets
Introduction
An alternativehypothesis
Testing thehypothesis
miRNA quantification
mRNA quantification
Relative abundance ofmiRNAs and mRNAs
Conclusion
Supplementarydata
Concentration effects
Day
Intra
cellu
larc
once
ntra
tion
(mol
/L)
0 1 2 3 4 5 6
0.0e
+00
1.0e
−09
2.0e
−09
3.0e
−09
Kd
miR-133Tpm4 mRNA
Return
MicroRNAtitration by
pseudo-targets
Introduction
An alternativehypothesis
Testing thehypothesis
miRNA quantification
mRNA quantification
Relative abundance ofmiRNAs and mRNAs
Conclusion
Supplementarydata
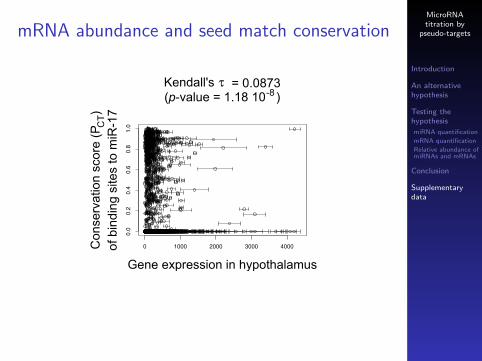
mRNA abundance and seed match conservation
0 1000 2000 3000 4000
0.0
0.2
0.4
0.6
0.8
1.0
Kendall's τ = 0.0873(p-value = 1.18 10 )-8
Gene expression in hypothalamus
CT
Con
serv
atio
n sc
ore
(P
)of
bin
ding
site
s to
miR
-17
MicroRNAtitration by
pseudo-targets
Introduction
An alternativehypothesis
Testing thehypothesis
miRNA quantification
mRNA quantification
Relative abundance ofmiRNAs and mRNAs
Conclusion
Supplementarydata
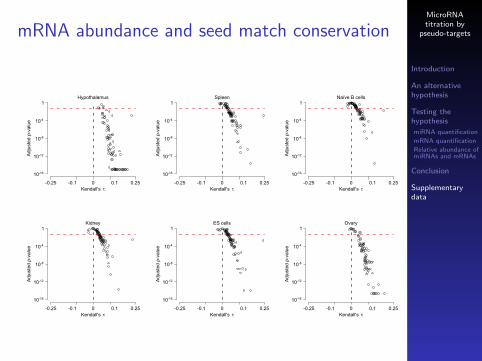
mRNA abundance and seed match conservationA
djus
ted p-
valu
e
Hypothalamus
Kendall's τ-0.25 -0.1 0 0.1 0.25
1
10-4
10-8
10-12
10-16
Adj
uste
d p-
valu
e
Spleen
Kendall's τ-0.25 -0.1 0 0.1 0.25
1
10-4
10-8
10-12
10-16
Adj
uste
d p-
valu
e
Naïve B cells
Kendall's τ-0.25 -0.1 0 0.1 0.25
1
10-4
10-8
10-12
10-16
Adj
uste
d p-
valu
e
Kidney
Kendall's τ-0.25 -0.1 0 0.1 0.25
1
10-4
10-8
10-12
10-16
Adj
uste
d p-
valu
e
ES cells
Kendall's τ-0.25 -0.1 0 0.1 0.25
1
10-4
10-8
10-12
10-16
Adj
uste
d p-
valu
e
Ovary
Kendall's τ-0.25 -0.1 0 0.1 0.25
1
10-4
10-8
10-12
10-16

MicroRNAtitration by
pseudo-targets
Introduction
An alternativehypothesis
Testing thehypothesis
miRNA quantification
mRNA quantification
Relative abundance ofmiRNAs and mRNAs
Conclusion
Supplementarydata
mRNA abundance and seed match conservation
LiverA
djus
ted p-
valu
e
Kendall's τ
1
10-4
10-8
10-12
10-16
-0.3 -0.1 0 0.1 0.3
miR-150miR-138
miR-181amiR-133a
miR-124
miR-9
miR-1a
miR-122

MicroRNAtitration by
pseudo-targets
Introduction
An alternativehypothesis
Testing thehypothesis
miRNA quantification
mRNA quantification
Relative abundance ofmiRNAs and mRNAs
Conclusion
Supplementarydata
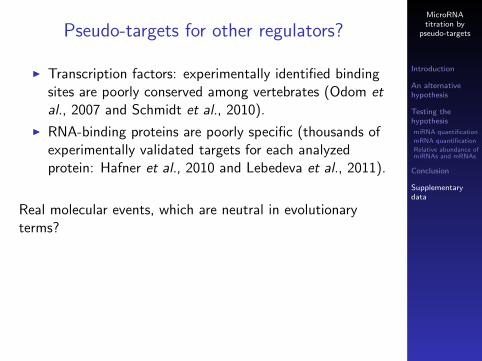
Pseudo-targets for other regulators?
I Transcription factors: experimentally identified bindingsites are poorly conserved among vertebrates (Odom etal., 2007 and Schmidt et al., 2010).
I RNA-binding proteins are poorly specific (thousands ofexperimentally validated targets for each analyzedprotein: Hafner et al., 2010 and Lebedeva et al., 2011).
Real molecular events, which are neutral in evolutionaryterms?

MicroRNAtitration by
pseudo-targets
Introduction
An alternativehypothesis
Testing thehypothesis
miRNA quantification
mRNA quantification
Relative abundance ofmiRNAs and mRNAs
Conclusion
Supplementarydata
Pseudo-targets for other regulators?
I Transcription factors: experimentally identified bindingsites are poorly conserved among vertebrates (Odom etal., 2007 and Schmidt et al., 2010).
I RNA-binding proteins are poorly specific (thousands ofexperimentally validated targets for each analyzedprotein: Hafner et al., 2010 and Lebedeva et al., 2011).
Real molecular events, which are neutral in evolutionaryterms?
MicroRNAtitration by
pseudo-targets
Introduction
An alternativehypothesis
Testing thehypothesis
miRNA quantification
mRNA quantification
Relative abundance ofmiRNAs and mRNAs
Conclusion
Supplementarydata
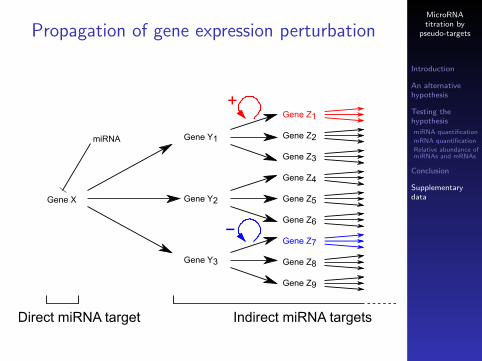
Propagation of gene expression perturbation
+
−
Gene X
Gene Y1
Gene Y3
Gene Y2
Direct miRNA target Indirect miRNA targets
Gene Z1
Gene Z3
Gene Z2
Gene Z4
Gene Z6
Gene Z5
Gene Z7
Gene Z9
Gene Z8
miRNA

MicroRNAtitration by
pseudo-targets
Introduction
An alternativehypothesis
Testing thehypothesis
miRNA quantification
mRNA quantification
Relative abundance ofmiRNAs and mRNAs
Conclusion
Supplementarydata
Propagation of gene expression perturbation
Direct targets13.5 dpp
Indirect targetsat 13.5 dpp
Indirect targetsat 15.5 dpp
|log
2(fo
ld-c
hang
e)|
(blu
e bo
xplo
t)
Num
ber
of a
ffect
ed g
enes
(red
line
)
0
2
4
6
8
10
0
500
1000
1500
Zfy overexpression
Pebp4
Tsarg2 MiwiSept12
(in collaboration with H. Royo and J. Turner, MRC, London)

![Multi-Index Optic Disc Quanti cation via MultiTask ... · Multi-Index Optic Disc Quanti cation via MultiTask Ensemble Learning Rongchang Zhao 1;2[0000 0002 5171 4121], Zailiang Chen](https://img.pdfslide.us/doc/110x75/5f6d8334cf8fc942f307e7ac/multi-index-optic-disc-quanti-cation-via-multitask-multi-index-optic-disc-quanti.jpg)

![Recurrence quanti cation analysis of global stock markets · 2010. 12. 7. · Recurrence quanti cation analysis of global stock markets ... [23], it is possible to reconstruct the](https://img.pdfslide.us/doc/110x75/5fe55e7feffb644f0c365004/recurrence-quanti-cation-analysis-of-global-stock-markets-2010-12-7-recurrence.jpg)