Embed Size (px)
Citation preview
MicroRNA regulation of a cancer network:Consequences of the feedback loops involvingmiR-17-92, E2F, and MycBaltazar D. Agudaa,b, Yangjin Kima, Melissa G. Piper-Hunterb, Avner Friedmana,1, and Clay B. Marshb
aMathematical Biosciences Institute, Ohio State University,1735 Neil Avenue, Columbus, OH 43210; and bDivision of Pulmonary, Allergy, Critical Care, SleepMedicine, College of Medicine, Ohio State University, Columbus, OH 43210
Contributed by Avner Friedman, November 4, 2008 (sent for review September 3, 2008)
The transcription factors E2F and Myc participate in the control of cellproliferation and apoptosis, and can act as oncogenes or tumorsuppressors depending on their levels of expression. Positive feed-back loops in the regulation of these factors are predicted—andrecently shown experimentally—to lead to bistability, which is aphenomenon characterized by the existence of low and high proteinlevels (‘‘off’’ and ‘‘on’’ levels, respectively), with sharp transitionsbetween levels being inducible by, for example, changes in growthfactor concentrations. E2F and Myc are inhibited at the posttranscrip-tional step by members of a cluster of microRNAs (miRs) calledmiR-17-92. In return, E2F and Myc induce the transcription of miR-17-92, thus forming a negative feedback loop in the interaction network.The consequences of the coupling between the E2F/Myc positivefeedback loops and the E2F/Myc/miR-17-92 negative feedback loopare analyzed using a mathematical model. The model predicts thatmiR-17-92 plays a critical role in regulating the position of the off–onswitch in E2F/Myc protein levels, and in determining the on levels ofthese proteins. The model also predicts large-amplitude proteinoscillations that coexist with the off steady state levels. Using theconcept and model prediction of a ‘‘cancer zone,’’ the oncogenic andtumor suppressor properties of miR-17-92 is demonstrated to parallelthe same properties of E2F and Myc.
M icroRNAs (miRs) are small noncoding RNAs, 18–24 nt inlength, that are predicted to regulate the expression of
approximately one-third of all human genes (1, 2). This regulationoccurs posttranscriptionally through miR binding to mRNA targetsleading to target degradation or inhibition of translation. Currenttarget-prediction computer programs (3, 4) often predict that a miRcould target tens to hundreds of genes, and that a gene can betargeted by many miRs—thus, the expectation that miRs playimportant roles in coordinating many cellular processes, particu-larly those involved in development and disease (5). Indeed, miRshave been implicated in various cancers, acting either as oncogenesor tumor suppressor genes (6). In this article, we investigate the roleof a set of miRs in the important ‘‘cancer network’’ shown in Fig.1. A cancer network is a molecular or gene interaction networkinvolving oncogenes or tumor suppressor genes. The networkshown is associated with the control of the G1-S transition in themammalian cell cycle (7, 8).
The extent to which miRs change the levels of their targetmRNAs is marginal compared with the effect of other regulatorssuch as transcription factors and posttranslational protein modifiers(10). Thus, it is thought that the primary role of miRs is to modulateor fine-tune the dynamics of regulatory networks (10–13). Thesignificance of this role is now increasingly recognized as there arenow many reported cases in which abnormal miR expressionscorrelate with cancer development (reviewed in ref. 6). Here, wefocus on miR-17-92, which behaves as an oncogene or a tumorsuppressor in different situations (2, 14).
The miR-17-92 cluster is a polycistronic gene located in humanchromosome 13 ORF 25 (C13orf25) located at 13q31-q32. Thecluster is composed of 7 mature miRs, namely, miR-17–5p, miR-17–3p, miR-18a, miR-19a, miR-20a, miR-19b, and miR-92–1 (Fig.
2A). The nucleotide sequences and organization of this cluster ishighly conserved in vertebrates (reviewed in ref. 2). He et al. (15)reported the first evidence of the oncogenic activity of miR-17-92.Gene expression data show over-expression of miR-17-92 in severaltumors, including cancers of the breast, lung, colon, stomach,pancreas, and prostate (16, 17). Although the tumor-suppressorproperty of miR-17-92 remains to be demonstrated directly in vivo,the following observations are quite suggestive: This cluster isdeleted in 16.5% of ovarian cancers, 21.9% of breast cancers, and20% of melanomas (14, 15).
Among the experimentally validated targets of some miR-17-92cluster members are the transcription factors Myc, E2F1, E2F2, andE2F3; interestingly, these same factors have been shown to inducethe transcription of miR-17-92 (reviewed in ref. 14). The negativefeedback loops thus formed are depicted in Fig. 2A. In the modelingthat follows, we will focus on E2F1, which possesses both oncogenicand tumor suppressor properties (18). Earlier, we analyzed a modelthat views E2F1 and Myc as members of a control node in a
Author contributions: B.D.A. designed research; B.D.A. and Y.K. performed research;B.D.A., M.G.P.-H., A.F., and C.B.M. analyzed data; and B.D.A. and C.B.M. wrote the paper.
The authors declare no conflict of interest.
Freely available online through the PNAS open access option.
1To whom correspondence should be addressed. E-mail: [email protected].
© 2008 by The National Academy of Sciences of the USA
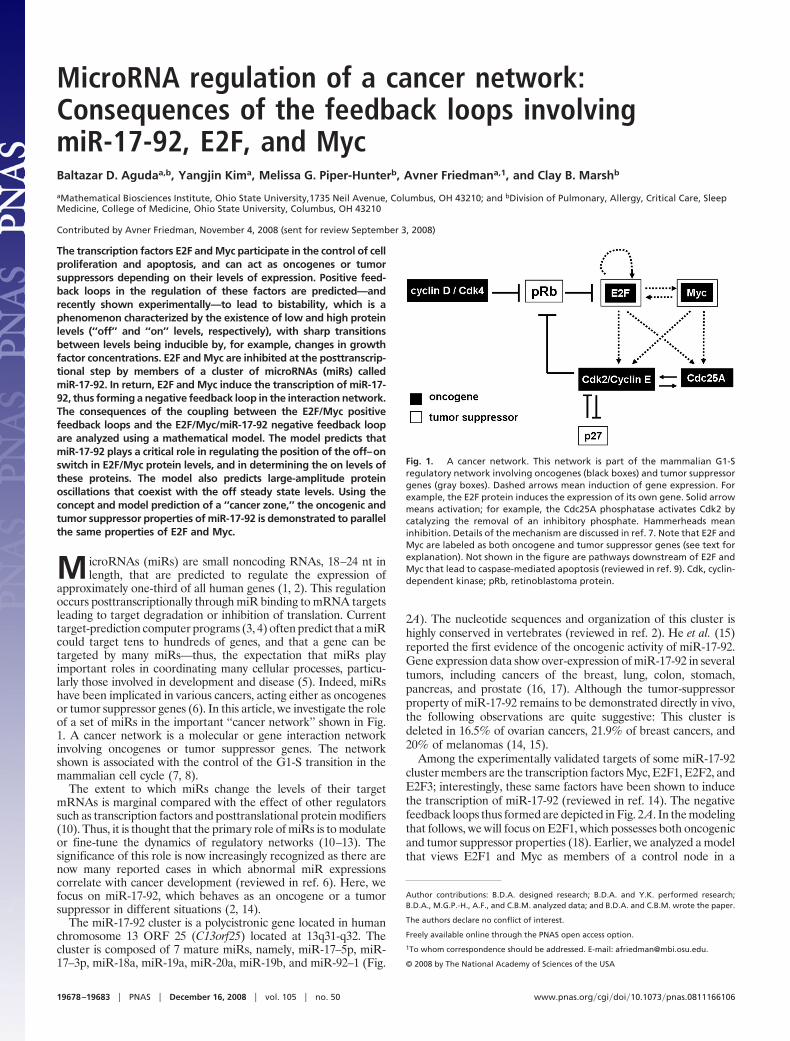
Fig. 1. A cancer network. This network is part of the mammalian G1-Sregulatory network involving oncogenes (black boxes) and tumor suppressorgenes (gray boxes). Dashed arrows mean induction of gene expression. Forexample, the E2F protein induces the expression of its own gene. Solid arrowmeans activation; for example, the Cdc25A phosphatase activates Cdk2 bycatalyzing the removal of an inhibitory phosphate. Hammerheads meaninhibition. Details of the mechanism are discussed in ref. 7. Note that E2F andMyc are labeled as both oncogene and tumor suppressor genes (see text forexplanation). Not shown in the figure are pathways downstream of E2F andMyc that lead to caspase-mediated apoptosis (reviewed in ref. 9). Cdk, cyclin-dependent kinase; pRb, retinoblastoma protein.
19678–19683 � PNAS � December 16, 2008 � vol. 105 � no. 50 www.pnas.org�cgi�doi�10.1073�pnas.0811166106
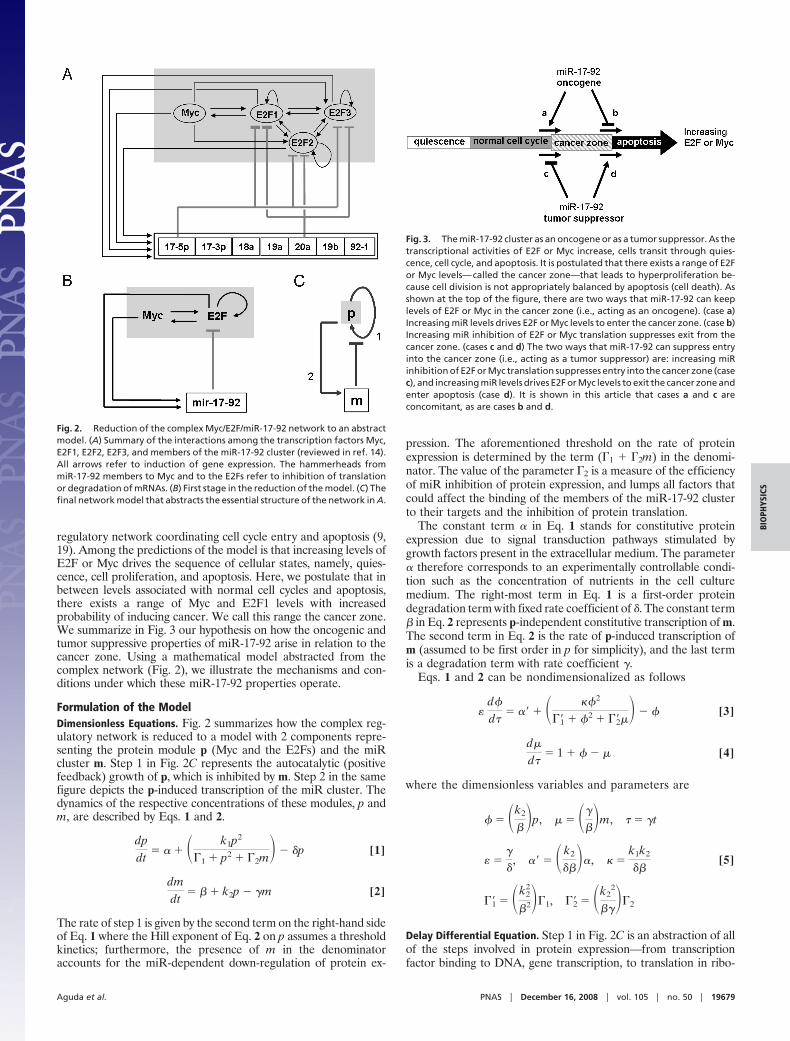
regulatory network coordinating cell cycle entry and apoptosis (9,19). Among the predictions of the model is that increasing levels ofE2F or Myc drives the sequence of cellular states, namely, quies-cence, cell proliferation, and apoptosis. Here, we postulate that inbetween levels associated with normal cell cycles and apoptosis,there exists a range of Myc and E2F1 levels with increasedprobability of inducing cancer. We call this range the cancer zone.We summarize in Fig. 3 our hypothesis on how the oncogenic andtumor suppressive properties of miR-17-92 arise in relation to thecancer zone. Using a mathematical model abstracted from thecomplex network (Fig. 2), we illustrate the mechanisms and con-ditions under which these miR-17-92 properties operate.
Formulation of the ModelDimensionless Equations. Fig. 2 summarizes how the complex reg-ulatory network is reduced to a model with 2 components repre-senting the protein module p (Myc and the E2Fs) and the miRcluster m. Step 1 in Fig. 2C represents the autocatalytic (positivefeedback) growth of p, which is inhibited by m. Step 2 in the samefigure depicts the p-induced transcription of the miR cluster. Thedynamics of the respective concentrations of these modules, p andm, are described by Eqs. 1 and 2.
dpdt
� � � � k1p2
�1 � p2 � �2m� � �p [1]
dmdt
� � � k2p � �m [2]
The rate of step 1 is given by the second term on the right-hand sideof Eq. 1 where the Hill exponent of Eq. 2 on p assumes a thresholdkinetics; furthermore, the presence of m in the denominatoraccounts for the miR-dependent down-regulation of protein ex-
pression. The aforementioned threshold on the rate of proteinexpression is determined by the term (�1 � �2m) in the denomi-nator. The value of the parameter �2 is a measure of the efficiencyof miR inhibition of protein expression, and lumps all factors thatcould affect the binding of the members of the miR-17-92 clusterto their targets and the inhibition of protein translation.
The constant term � in Eq. 1 stands for constitutive proteinexpression due to signal transduction pathways stimulated bygrowth factors present in the extracellular medium. The parameter� therefore corresponds to an experimentally controllable condi-tion such as the concentration of nutrients in the cell culturemedium. The right-most term in Eq. 1 is a first-order proteindegradation term with fixed rate coefficient of �. The constant term� in Eq. 2 represents p-independent constitutive transcription of m.The second term in Eq. 2 is the rate of p-induced transcription ofm (assumed to be first order in p for simplicity), and the last termis a degradation term with rate coefficient �.
Eqs. 1 and 2 can be nondimensionalized as follows
�d
d� �� � � �2
��1 � 2 � ��2�� � [3]
d�
d� 1 � � � [4]
where the dimensionless variables and parameters are
� �k2
��p, � � ��
��m, � �t
� ��
�, �� � � k2
����, � �
k1k2
��
��1 � �k22
�2��1, ��2 � �k22
����2
[5]
Delay Differential Equation. Step 1 in Fig. 2C is an abstraction of allof the steps involved in protein expression—from transcriptionfactor binding to DNA, gene transcription, to translation in ribo-
Fig. 2. Reduction of the complex Myc/E2F/miR-17-92 network to an abstractmodel. (A) Summary of the interactions among the transcription factors Myc,E2F1, E2F2, E2F3, and members of the miR-17-92 cluster (reviewed in ref. 14).All arrows refer to induction of gene expression. The hammerheads frommiR-17-92 members to Myc and to the E2Fs refer to inhibition of translationor degradation of mRNAs. (B) First stage in the reduction of the model. (C) Thefinal network model that abstracts the essential structure of the network in A.
Fig. 3. The miR-17-92 cluster as an oncogene or as a tumor suppressor. As thetranscriptional activities of E2F or Myc increase, cells transit through quies-cence, cell cycle, and apoptosis. It is postulated that there exists a range of E2For Myc levels—called the cancer zone—that leads to hyperproliferation be-cause cell division is not appropriately balanced by apoptosis (cell death). Asshown at the top of the figure, there are two ways that miR-17-92 can keeplevels of E2F or Myc in the cancer zone (i.e., acting as an oncogene). (case a)Increasing miR levels drives E2F or Myc levels to enter the cancer zone. (case b)Increasing miR inhibition of E2F or Myc translation suppresses exit from thecancer zone. (cases c and d) The two ways that miR-17-92 can suppress entryinto the cancer zone (i.e., acting as a tumor suppressor) are: increasing miRinhibition of E2F or Myc translation suppresses entry into the cancer zone (casec), and increasing miR levels drives E2F or Myc levels to exit the cancer zone andenter apoptosis (case d). It is shown in this article that cases a and c areconcomitant, as are cases b and d.
Aguda et al. PNAS � December 16, 2008 � vol. 105 � no. 50 � 19679
BIO
PHYS
ICS
somes. Thus, the rate of synthesis of the protein is not a function ofits instantaneous concentration (as assumed in Eq. 3), but ratherof its concentration at some time � in the past. In a second set ofcomputer simulations presented in the Results Section, this timedelay � is considered in the second term on the right-hand side ofEq. 3, which is rewritten explicitly in Eq. 6.
�d
d� �� �
��� � ���2
��1 � �� � ���2 � ��2�� � ��� �� [6]
Solving for the Steady States. The steady states of the system ofEqs. 3 and 4 are determined by equating the right-hand sides tozero. After eliminating � in the steady equations, we obtain thefollowing cubic polynomial whose non-negative roots give thesteady states of (symbolized by s):
s3 � c2s
2 � c1s � c0 � 0 [7]
where
c2 � ��2 � ��� � ��
c1 � ��1 � ��2�1 � ���
c0 � � �����1 � ��2�
The steady state of � (symbolized by �s) is given by
�s � 1 � s [8]
We are interested in threshold or switching behavior of the system,and, therefore, the conditions on the parameters for the existenceof multiple steady states are relevant. From ref. 20, the set T ofparameters that guarantee existence of 3 positive real roots of Eq.7 is:
T � �c2, c1, c0� � R3�c2 0, c1 � 0, c0 0, K3 0
[9]
where
K3 � 27c02 � 4c0c2
3 � 8c2c1c0 � c12c2
2 � 4c13 [10]
Thus, the necessary (but not sufficient) conditions for theexistence of 3 steady states of the model are:
���2 � �� �� �1 ���1��2�
Parameter Values and Numerical Solution of the Differential Equa-tions. The parameter � is expected to be less than unity becausemiRs are typically more stable than proteins; for example, � forE2F1 and Myc are �0.25 h�1 and �0.7 h�1, respectively (21), and� � 0.02 h�1 (22). The value of � 0.02 is used in our computersimulations (noting that � for Myc is of order unity, and makingallowances for the other E2Fs besides E2F1). An estimate of k1 forE2F1 is �0.4 �M h�1 and �1 �0.1 �M2 (21). We arbitrarily set(k2/�) �3 �M�1 so that ��1 �1 and � �5 (the parameter � isassumed to be manipulated experimentally via gene transfection,for example). The dimensionless parameters �� and ��2—whosevalues can be tuned experimentally—are allowed to vary in theranges 0–0.4 and 0–2.5, respectively, to explore the effect ofincreasing rate of growth factor-induced protein synthesis andinhibition efficiency of the miRs. The differential equations ofthe model are solved using the computer software described inMethods.
Results and DiscussionSteady States of the Model and Significance of the Parameter ��.According to Eq. 8, the steady states of m and p increase or decreasein the same direction. This model prediction agrees with observa-tions in various tumors that levels of Myc and miR-17-92 are bothincreased (23, 24). The model also clarifies the interpretation ofHayashita et al. (23) that members of the miR-17-92 clusterpromote proliferation—this is because increase in the miR levelcorrelates with increase in the levels of Myc or E2F, which are bothproliferative.
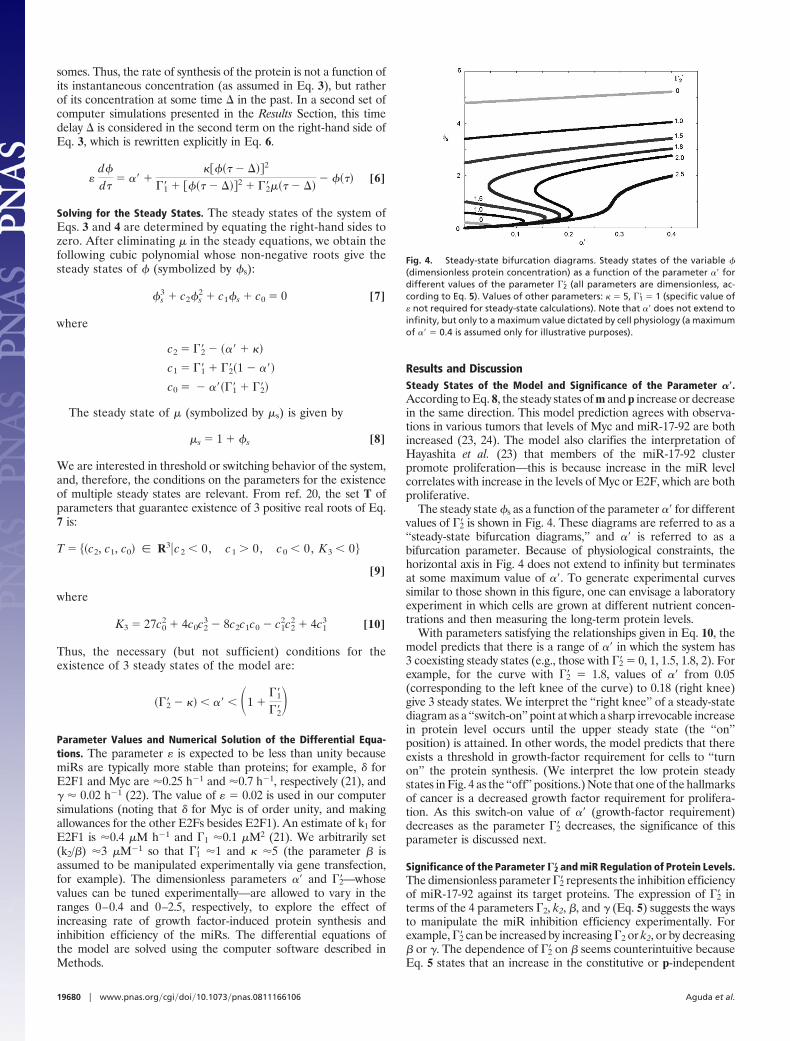
The steady state s as a function of the parameter �� for differentvalues of ��2 is shown in Fig. 4. These diagrams are referred to as a‘‘steady-state bifurcation diagrams,’’ and �� is referred to as abifurcation parameter. Because of physiological constraints, thehorizontal axis in Fig. 4 does not extend to infinity but terminatesat some maximum value of ��. To generate experimental curvessimilar to those shown in this figure, one can envisage a laboratoryexperiment in which cells are grown at different nutrient concen-trations and then measuring the long-term protein levels.
With parameters satisfying the relationships given in Eq. 10, themodel predicts that there is a range of �� in which the system has3 coexisting steady states (e.g., those with ��2 0, 1, 1.5, 1.8, 2). Forexample, for the curve with ��2 1.8, values of �� from 0.05(corresponding to the left knee of the curve) to 0.18 (right knee)give 3 steady states. We interpret the ‘‘right knee’’ of a steady-statediagram as a ‘‘switch-on’’ point at which a sharp irrevocable increasein protein level occurs until the upper steady state (the ‘‘on’’position) is attained. In other words, the model predicts that thereexists a threshold in growth-factor requirement for cells to ‘‘turnon’’ the protein synthesis. (We interpret the low protein steadystates in Fig. 4 as the ‘‘off’’ positions.) Note that one of the hallmarksof cancer is a decreased growth factor requirement for prolifera-tion. As this switch-on value of �� (growth-factor requirement)decreases as the parameter ��2 decreases, the significance of thisparameter is discussed next.
Significance of the Parameter ��2 and miR Regulation of Protein Levels.The dimensionless parameter ��2 represents the inhibition efficiencyof miR-17-92 against its target proteins. The expression of ��2 interms of the 4 parameters �2, k2, �, and � (Eq. 5) suggests the waysto manipulate the miR inhibition efficiency experimentally. Forexample, ��2 can be increased by increasing �2 or k2, or by decreasing� or �. The dependence of ��2 on � seems counterintuitive becauseEq. 5 states that an increase in the constitutive or p-independent
Fig. 4. Steady-state bifurcation diagrams. Steady states of the variable
(dimensionless protein concentration) as a function of the parameter �� fordifferent values of the parameter ��2 (all parameters are dimensionless, ac-cording to Eq. 5). Values of other parameters: � 5, ��1 1 (specific value of� not required for steady-state calculations). Note that �� does not extend toinfinity, but only to a maximum value dictated by cell physiology (a maximumof �� 0.4 is assumed only for illustrative purposes).
19680 � www.pnas.org�cgi�doi�10.1073�pnas.0811166106 Aguda et al.
expression of miR-17-92 leads to a decrease in the miR inhibitionefficiency.
The case of ��2 0 represents any of the following situations:deletion of the miR-17-92 cluster; members of the cluster do notbind the transcripts of the target proteins (p) perhaps due tomutations; p does not induce expression of miR-17-92 (case ofk2 0). Although p is no longer coupled to m, the 1-dimensionalmodel of the autocatalytic variable p is still capable of exhibiting 3steady states for �� between 0 and �0.05 (see Fig. 4). Standardlinear stability analysis shows that the system is bistable in this rangeof � values—that is, the bottom and upper branches of steady statesare stable, whereas the middle branch of steady states are unstable.Very interestingly, bistability involving E2F1 and Myc have recentlybeen demonstrated experimentally by Yao and colleagues (21). Inaddition to the E2F1 loop, these authors invoked another source ofpositive feedback loop—specifically, the E2F-Cdk2-pRb-E2F loopshown in Fig. 1—in their model of the system.
Two key observations can be made from Fig. 4 with regards tothe role of miR-17-92: (i) as ��2 is increased, the switch-on values of�� (corresponding to the right knees of the curves) increase; (ii) as��2 is increased, the upper branch of steady states (the on states) arelowered. The first observation suggests that the miRs counteract thecancer-associated decreased growth factor requirement for cellproliferation. The second observation agrees with the currentthinking about the role of miR-17-92 in preventing a runawayE2F/Myc positive feedback loop that may induce uncontrolled cellproliferation.
The model also predicts 3 qualitatively different types of steady-state bifurcation diagrams as illustrated in Fig. 4: (i) 2 disconnectedcurves with just the right knee (e.g., ��2 0, 1, 1.5), (ii) a continuouscurve with left and right knees (e.g., ��2 1.8 and 2), and (iii) acontinuous curve with no knees (e.g., ��2 2.5). Type (i) is anirreversible switch to the upper branch of steady states, whereastype (ii) allows a transition from the upper branch to the lowerbranch by decreasing �� below the value corresponding to the leftknee of the curve.
Non-Steady-State Behavior and Sensitivity of Protein Levels to miRs.The functional properties of the E2F/Myc/miR-17-92 network—inparticular, the role of the miR cluster—can be further understood
by studying its non-steady state kinetics. For example, the dynamicsof the system can be very sensitive to the initial levels of the miRcluster. Shown in Fig. 5 are computer simulations from variousinitial conditions of and �. In Fig. 5A, 5 initial conditions locatedat the lower left corner of the box are very close to each other, withidentical initial 0 but with 5 close values of �0. All of thetrajectories ultimately approach a stable steady state (shown asempty circle), but the initial conditions where �0 0.340, 0.343, and0.345 lead to trajectories with wide swings in protein levels that evensurpass the upper steady state (see Fig. 4, �� 0.1); in contrast, forthe initial conditions �0 0.350 and 0.355 the system goes to thesteady state directly. (The value of �0 that delineates these twodynamics is between 0.345 and 0.350, as exhibited in Fig. 5B.) Thus,the model predicts that the system could be prone to large burstsof protein synthesis if the level of mir-17–92 is below a certainthreshold.
At �� 0.1 (as in Fig. 5 a and b) the system has 3 coexisting steadystates, but only the lowest one is stable (shown as empty circle in Fig.5A). When �� is increased beyond the right knee of the curve in Fig.4 (for ��2 1.8), only one steady state is available for the system; thissteady state is asymptotically stable as shown by the phase planetrajectories plotted in Fig. 5C and the temporal course of inFig. 5D.
The non-steady state behavior of the system as shown in Fig. 5could explain an experimental observation that seemingly contra-dicts the prediction of the model at steady state. Several groups (14,25, 26) have shown that miR-20a and miR-17–5p (members of themiR-17-92 cluster) are antiapoptotic because the down-regulationof these miRs leads to increased cell death and their overexpressiondecreases cell death. These observations were explained (25, 27) interms of the down-regulation of E2F1 protein levels by miR-20aand miR-17–5p, and E2F1’s induction of apoptosis when overex-pressed. However, our model suggests that, at steady state, in-creased levels of miR-17-92 are associated with increased levels ofMyc and the E2Fs (Eq. 8 and Fig. 4) and therefore increasedapoptosis. One way to resolve this dilemma is to view the model’stransient dynamics instead of steady states, and to illustrate thepossibility that reported experimental observations were madeunder non-steady state conditions. In Fig. 5 A and C, the slow
Fig. 5. Model dynamics. (A) Phase plane trajectoriesfrom different initial conditions: (0) 0.13, � (0) 0.340, 0.343, 0.345, 0.350, 0.355. Parameter values: � 0.02, �� 0.1, � 5, ��1 1, ��2 1.8. The empty circlerepresents a steady state of the system. (B) Timecourses for 2 very close initial conditions (0) 0.13, �
(0) 0.345 (black curve) and (0) 0.13, � (0) 0.350(gray curve). (C) Same as A except �� 0.2 and � (0) 1, 2, 3. The empty circle represents a steady state of thesystem. (D) Temporal course of for parameters andinitial conditions identical to C.
Aguda et al. PNAS � December 16, 2008 � vol. 105 � no. 50 � 19681
BIO
PHYS
ICS
segments of the trajectories (from the maximum to the maximum�) correspond to increasing miR (�) and decreasing protein ().This decrease in the protein, which is associated with increasedmiR, could then lead to a decreased rate of apoptosis—thus, thereference to the miR as antiapoptotic.
miR-17-92 as an Oncogene and a Tumor Suppressor. Viewed in termsof miR steady state levels, the oncogenic and tumor suppressorproperties of miR-17-92—cases a and d in Fig. 3, respectively—parallel those of E2F1 or Myc because of Eq. 8. This idea isexplained more explicitly in Fig. 6. (Note that in this figure, therange of s that defines the cancer zone is chosen arbitrarily; onewould expect that the range of the cancer zone would depend on thespecific cellular system and on the perturbations of the system that
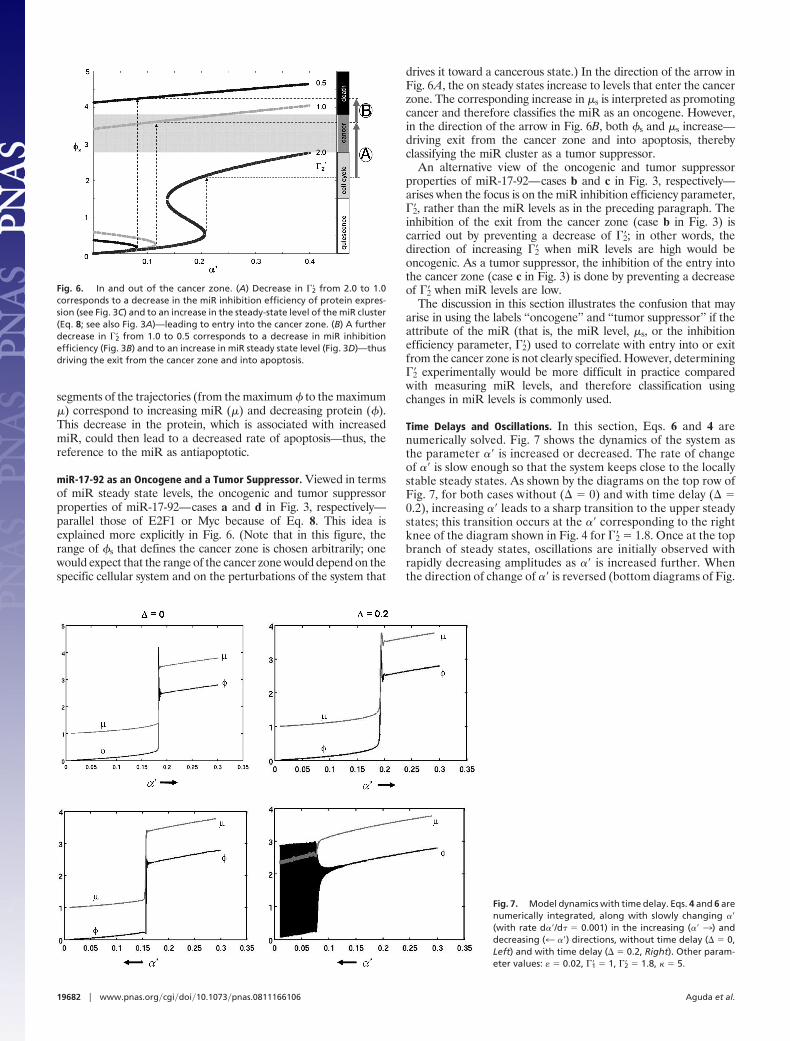
drives it toward a cancerous state.) In the direction of the arrow inFig. 6A, the on steady states increase to levels that enter the cancerzone. The corresponding increase in �s is interpreted as promotingcancer and therefore classifies the miR as an oncogene. However,in the direction of the arrow in Fig. 6B, both s and �s increase—driving exit from the cancer zone and into apoptosis, therebyclassifying the miR cluster as a tumor suppressor.
An alternative view of the oncogenic and tumor suppressorproperties of miR-17-92—cases b and c in Fig. 3, respectively—arises when the focus is on the miR inhibition efficiency parameter,��2, rather than the miR levels as in the preceding paragraph. Theinhibition of the exit from the cancer zone (case b in Fig. 3) iscarried out by preventing a decrease of ��2; in other words, thedirection of increasing ��2 when miR levels are high would beoncogenic. As a tumor suppressor, the inhibition of the entry intothe cancer zone (case c in Fig. 3) is done by preventing a decreaseof ��2 when miR levels are low.
The discussion in this section illustrates the confusion that mayarise in using the labels ‘‘oncogene’’ and ‘‘tumor suppressor’’ if theattribute of the miR (that is, the miR level, �s, or the inhibitionefficiency parameter, ��2) used to correlate with entry into or exitfrom the cancer zone is not clearly specified. However, determining��2 experimentally would be more difficult in practice comparedwith measuring miR levels, and therefore classification usingchanges in miR levels is commonly used.
Time Delays and Oscillations. In this section, Eqs. 6 and 4 arenumerically solved. Fig. 7 shows the dynamics of the system asthe parameter �� is increased or decreased. The rate of changeof �� is slow enough so that the system keeps close to the locallystable steady states. As shown by the diagrams on the top row ofFig. 7, for both cases without (� 0) and with time delay (� 0.2), increasing �� leads to a sharp transition to the upper steadystates; this transition occurs at the �� corresponding to the rightknee of the diagram shown in Fig. 4 for ��2 1.8. Once at the topbranch of steady states, oscillations are initially observed withrapidly decreasing amplitudes as �� is increased further. Whenthe direction of change of �� is reversed (bottom diagrams of Fig.
Fig. 7. Model dynamics with time delay. Eqs. 4 and 6 arenumerically integrated, along with slowly changing ��(with rate d��/d 0.001) in the increasing (�� 3) anddecreasing (4 ��) directions, without time delay (� 0,Left) and with time delay (� 0.2, Right). Other param-eter values: � 0.02, ��1 1, ��2 1.8, � 5.
Fig. 6. In and out of the cancer zone. (A) Decrease in ��2 from 2.0 to 1.0corresponds to a decrease in the miR inhibition efficiency of protein expres-sion (see Fig. 3C) and to an increase in the steady-state level of the miR cluster(Eq. 8; see also Fig. 3A)—leading to entry into the cancer zone. (B) A furtherdecrease in ��2 from 1.0 to 0.5 corresponds to a decrease in miR inhibitionefficiency (Fig. 3B) and to an increase in miR steady state level (Fig. 3D)—thusdriving the exit from the cancer zone and into apoptosis.
19682 � www.pnas.org�cgi�doi�10.1073�pnas.0811166106 Aguda et al.
7), new interesting dynamics appear. For the case without timedelay (� 0), the system initially traces the curve that was madein the direction of increasing ��, but then goes a little bit beyond(to the left) of the right knee before undergoing a sharp drop tothe lower branch of steady states. Note that the system does notswitch down at the left knee (see Fig. 4 for ��2 1.8); this isbecause of the emergence of large-amplitude oscillations (datanot shown) that exist in a narrow range of �� values just to theleft of the right knee; these large-amplitude oscillations suddenlydisappear and the system gets trapped by the lower branch ofstable steady states. In contrast, for the case with time delay of� 0.2, the system exhibits large-amplitude protein oscillationsfor wider ranges of ��s as indicated by the black region in thebottom right diagram (the accompanying small-amplitude oscil-lations in � are also shown in gray). In the same range of ��values where this oscillatory region is located, the system couldget trapped in the lower branch of steady states depending on theinitial conditions.
Thus, the model with time delay predicts the coexistence be-tween large-amplitude oscillations and low steady-state proteinlevels. To try to understand the physiological significance of theselarge-amplitude protein oscillations, we checked the stability of thelower branch of steady states (the off states) and found that thesestates are quite robust against perturbations—for example, at �� 0.1, it takes a perturbation of �370% above the value of s to switchthe system to the large-amplitude oscillations (simulations notshown); also, large amounts of perturbation above �s do not induceswitching, but, as shown in Fig. 5A (no delay), perturbations thatdecrease the miR level below a certain threshold induce large-amplitude swings in protein concentrations. The robustness of theoff states and of the switch-on values of �� is required for proteinsthat control important cellular processes (such as entry into S-phaseof the cell cycle, which E2F1 and Myc regulate). However, themodel predicts that large bursts in protein levels (the large-amplitude oscillatory states) are possible and can be used by thesystem to obtain apoptotic levels quickly to avert any danger thatmay be caused by large perturbations.
ConclusionsWe proposed and analyzed a simple model of the interactionsbetween miR-17-92 and the transcription factors E2F and Myc. Ourgoal is to explore the broad consequences of the structure of thenetwork on the levels, steady states and dynamics of the miR andthe group of proteins that the miR targets. The simplicity of the2-variable model precludes it from capturing the different proper-ties of Myc, E2F1, E2F2, and E2F3 with respect to their prolifer-ative or apoptotic effects or nature of repression by miR-17-92members. The model couples the positive feedback loops involvingE2F and Myc—generating bistability and the concomitant off-onswitching behavior of the system—and the negative feedback loopbetween these proteins and members of the miR-17-92 cluster. Themodel predicts that the steady states of these proteins and the miRschange in the same direction, although slow non-steady state ortransient dynamics are possible where the changes could be inopposite directions. We have illustrated how changes in the miRinhibition efficiency—the parameter ��2 in Eq. 3—controls thevalue of the off-on switch in growth-factor requirement and how itattenuates the on levels of the proteins. An important prediction ofthe model is that decreasing ��2 leads to decreasing growth-factorrequirement for switching the protein on, and that the on levelsincrease with decreasing ��2. Possible experimental means of ma-nipulating the value of ��2 are discussed. Due to the negativefeedback loop in the network, large-amplitude protein oscillationsare predicted to coexist with the off steady state levels, allowing thesystem to respond through apoptosis to dangerously large pertur-bations. Finally, using the postulate of a cancer zone, we have shownthat the oncogenic and tumor suppressor properties of miR-17-92parallel those of E2F and Myc.
MethodsFor the first set of computer simulations, the system composed of Eqs. 3 and4 is solved using the routine ode23 in MATLAB (The Mathworks). For thesecond set of simulations involving time delay, the system composed of Eqs. 6and 4 is solved using the routine dde23 in MATLAB.
ACKNOWLEDGMENTS. This work was supported by U.S. National ScienceFoundation Agreement 0112050 and National Institutes of Health GrantRO-1HL67176.
1. Gartel AL, Kandel ES (2008) miRNAs: Little known mediators of oncogenesis. SeminCancer Biol 18:103–110.
2. Mendell JT (2008) myRiad roles for the miR-17-92 cluster in development and disease.Cell 133:217–222.
3. Watanabe Y, Tomita M, Kanai A (2007) Computational methods for microRNA targetprediction. Methods Enzymol 427:65–86.
4. Maziere P, Enright AJ (2007) Prediction of microRNA targets. Drug Discov Today12:452–458.
5. Gusev Y (2008) Computational methods for analysis of cellular functions and pathwayscollectively targeted by differentially expressed microRNA. Methods 44:61–72.
6. Cho WC (2007) OncomiRs: The discovery and progress of microRNAs in cancers. MolCancer 6:60. doi:10.1186/1476–4598-6–60.
7. Aguda BD, Tang Y (1999) The kinetic origins of the restriction point in the mammaliancell cycle. Cell Proliferation 32:321–335.
8. Aguda BD, Goryachev AB (2007) From pathways databases to network models ofswitching behavior. PLoS Comput Biol 3:e152.
9. Aguda BD, Algar CK (2003) Structural analysis of the qualitative networks regulatingthe cell cycle and apoptosis. Cell Cycle 2:538–544.
10. Tsang J, Zhu J, van Oudenaarden A (2007) MicroRNA-mediated feedback and feed-forward loops are recurrent network motifs in mammals. Mol Cell 26:753–767.
11. Li Y, Wang F, Lee JA, Gao FB (2006) MicroRNA-9a ensures the precise specification ofsensory organ precursors in Drosophila. Genes Dev 20:2793–2805.
12. Cohen SM, Brennecke J, Stark A (2006) Denoising feedback loops by thresholding—anew role for microRNAs. Genes Dev 20:2769–2772.
13. Johnston RJ, Jr, Chang S, Etchberger JF, Ortiz CO, Hobert O (2005) MicroRNAs acting ina double-negative feedback loop to control a neuronal cell fate decision. Proc NatlAcad Sci USA 102:12449–12454.
14. Coller HA, Forman JJ, Legesse-Miller A (2007) Myc’ed Messages: Myc induces transcrip-tion of E2F1 while inhibiting its translation via a microRNA polycistron. PLoS Genet3:e146.
15. He L, et al. (2005) A microRNA polycistron as a potential human oncogene. Nature435:828–833.
16. Volinia S, et al. (2006) A microRNA expression signature of human solid tumors definescancer gene targets. Proc Natl Acad Sci USA 103:2257–2261.
17. Petrocca F, et al. (2008) E2F1-regulated microRNAs impair TGF�-dependent cell cyclearrest and apoptosis in gastric cancer. Cancer Cell 13:272–286.
18. Johnson DG (2000) The paradox of E2F1: Oncogene and tumor suppressor gene. MolCarcinog 27:151–157.
19. Craciun G, Aguda BD, Friedman A (2005) A detailed mathematical analysis of amodular network coordinating the cell cycle and apoptosis. Math Biosci Engineer-ing 2:473– 485.
20. Aguda BD, Clarke BL (1987) Bistability in chemical reaction networks: Theory andapplication to the peroxidase–oxidase reaction. J Chem Phys 87:3461–3470.
21. Yao G, Lee TJ, Mori S, Nevins JR, You L (2008) A bistable Rb-E2F switch underlies therestriction point. Nat Cell Biol 10:476–482.
22. Khanin R, Vinciotti V (2008) Computational modeling of post-transcriptional generegulation by microRNAs. J Comput Biol 15:305–316.
23. Hayashita Y, et al. (2005) A polycistronic microRNA cluster, miR-17-92, is overexpressedin human lung cancers and enhances cell proliferation. Cancer Res 65:9628–9632.
24. Rinaldi A, et al. (2007) Concomitant MYC and microRNA cluster miR-17-92 (C13orf25)amplification in human mantle cell lymphoma. Leuk Lymphoma 48:410–412.
25. Sylvestre Y, et al. (2007) An E2F/miR-20a autoregulatory feedback loop. J Biol Chem282:2135–2143.
26. Matsubara H, et al. (2007) Apoptosis induction by antisense oligonucleotides againstmiR-17–5p and miR-20a in lung cancers overexpressing miR-17-92. Oncogene 26:6099–6105.
27. Woods K, Thomson JM, Hammond SM (2006) Direct regulation of an oncogenicmicroRNA cluster by E2F transcription factors. J Biol Chem 282:2130–2134.
Aguda et al. PNAS � December 16, 2008 � vol. 105 � no. 50 � 19683
BIO
PHYS
ICS
![MicroRNA-940 promotes tumor cell invasion and metastasis ... · regulation, signaling transduction, transcription regulation, and epigenetic modification [4]. Cumulative evidence](https://img.pdfslide.us/doc/110x75/5f92b49af7c23d3db070c50b/microrna-940-promotes-tumor-cell-invasion-and-metastasis-regulation-signaling.jpg)