Embed Size (px)
Citation preview
Miguel Angelo da Rocha Peixoto
Microporous tin silicates – synthesis,crystal structure, ion exchange, isomorphicsubstitution and thermal properties
Migu
el An
gelo
da
Roch
a Pe
ixoto
novembro de 2013UMin
ho |
201
3M
icro
poro
us ti
n si
licat
es –
syn
thes
is, c
ryst
al s
truc
ture
, ion
exch
ange
, iso
mor
phic
sub
stitu
tion
and
ther
mal
pro
pert
ies
Universidade do MinhoEscola de Engenharia

novembro de 2013
Tese de MestradoCiclo de Estudos Integrados Conducentes aoGrau de Mestre em Engenharia de Materiais
Trabalho efetuado sob a orientação doProfessor Doutor Carlos TavareseStanislav Ferdov
Miguel Angelo da Rocha Peixoto
Microporous tin silicates – synthesis,crystal structure, ion exchange, isomorphicsubstitution and thermal properties
Universidade do MinhoEscola de Engenharia
Microporous tin silicates: synthesis, modification and thermal properties. 2013
Dissertation in Materials Engineering i
I Acknowledges
My acknowledgments go to my fellow colleges that have been a great source of support
and guidance in my learning process. Also to my teachers that have provided me with the tools
and means not only to complete this work but also to start a future career as a materials
engineer.
In particular I would like to thank Professor Carlos Tavares for its support and
promptitude that allowed me to enter this work. I would also like to thank Professor Mario Pereira
and Ana Claudia Mota for providing the tools needed for me to conclude this work.
To my family, for their love and sacrifice, I leave the most sincere gratitude, without them
I would never be where I am today. To Sara, for the days spend at my side, in every failure or
success, with outstanding patience and comprehension. I give the guaranty that I’ll be there
when you’ll need me.
Most importantly I would like to thank my tutor Professor Stanislav Ferdov. His never-
ending patience and care gave me the motivation to never quit and to always look for answers. In
all the days spend with him I have gain the love for science and investigation. As my mentor he
showed me a kind of materials that I had never seen and infused me with the knowledge to
understand them. As a friend he has given me the passion to complete this work and the
courage to face any future challenge. For everything, thank you very much professor Stanislav
Ferdov.

2013 Microporous tin silicates: synthesis, modification and thermal properties.
ii Dissertation in Materials Engineering
Microporous tin silicates: synthesis, modification and thermal properties. 2013
Dissertation in Materials Engineering iii
II Resume
The present work introduces the transparent precursor as a new media for synthesis of
tin silicates. Based on this approach a systematic work exploiting the potential for formation of
various tin silicates and process optimization of the existing ones has been carried out. The
conducted syntheses resulted in the creation of crystallization fields showing the dependence of
the run product on initial molar composition. Within various synthesis compositions the typical
structures of the sodium based silicate (AV-10) the potassium based tin silicate (AV-6) the sodium
and potassium based tin silicate (AV-7) has been achieved. Another novelty is the fine control of
the crystalline product by the time of agitation of the initial transparent precursor. This type of
phase control has never been studied in tin silicates.
The close structural and synthesis relation between the microporous phases AV-6 and
AV-7 has been studied. The studies on the time of precursor agitation revealed that the transition
between these two structures is time dependent and that AV-7 can be produced in absence of
sodium ions. In the course of creation of the crystallization fields a new potassium tin silicate with
layered structure was prepared. The structure was successfully indexed and the structural
determination is in progress. Ion exchange properties of AV-6 and AV-7 were also explored. AV-6
was exchanged to copper and zinc forms and for the first time it has been revealed the ion
exchange potential of AV-7. The phase was successfully converted into copper, zinc, chromium
and lead forms. It was also seen that upon ion exchanged with divalent ions and coordination
number 8, AV-7, changes differently depending on the captured ion. This behavior may serve to
identify and confirm exchanges in multi ions solutions.
Isomorphous substitutions produced no effects on the synthesized phases. However, the
presence of amorphous germanium in the initial batch of AV-7 resulted in decreased thermal
stability and lower temperature transformation of the AV-7 framework into the Sn-AV-11 phase.
In other thermal studies it was seen that amorphous stannosilicate compositions turn
into cassiterite upon high temperature exposure. The same transformation was seen in Cu-AV-6
that totally degrades after 700ºC and recrystallizes into cassiterite (SnO2) at 750ºC. The thermal
studies also showed the high temperatures transformations of the new layered potassium tin
silicate into Sn-AV-11 and Sn-wadeite. In the ion exchanged forms of AV-7 it was seen that the Zn-
AV-7 gained a thermal stability higher than any other exchanged form and possibly higher than
the unchanged AV-7.

2013 Microporous tin silicates: synthesis, modification and thermal properties.
iv Dissertation in Materials Engineering
Microporous tin silicates: synthesis, modification and thermal properties. 2013
Dissertation in Materials Engineering v
III Resumo
Silicatos de estanho microporosos: A Síntese, a estrutura cristalina, as suas trocas
iónicas e substituições isomórficas, e a sua estabilidade térmica.
Este trabalho introduz um método que utiliza soluções transparentes como nova fonte
para a síntese hidrotérmica de silicatos de estanho. Baseado nesta nova forma, este trabalho
explora o potencial deste novo método para a produção de várias fases cristalinas e para o
aperfeiçoamento das fases já conhecidas. As sínteses realizadas resultaram na criação de
campos de cristalização que indicam a dependência na composição molar inicial no produto
final. Com diferentes composições foi possível sintetizar estruturas de silicatos de estanho
baseadas em sódio (AV-10), em potássio (AV-6 e baseadas em sódio e potássio (AV-7). Outra
novidade foi o controlo do produto final pela manipulação do tempo de agitação do precursor.
Este parâmetro nunca tinha sido estudado para silicatos de estanho.
Também foram estudadas as semelhanças na síntese e na estrutura entre os materiais
AV-6 e AV-7. O estudo da variação do tempo de agitação do percursor mostrou que é possível
fazer a transição entre estas duas estruturas. Graças a este estudo, a estrutura AV-7 foi
produzida pela primeira vez sem iões de sódio. Enquanto foram criados os campos de
cristalização foi produzida uma forma lamelar de silicatos de estanho. Esta fase foi identificada e
reproduzida com sucesso e o processo de caracterização estrutural ainda é alvo de estudo.
Algumas trocas iónicas também foram exploradas nas estruturas AV-6 e AV-7. Para AV-6 foi
possível produzir uma forma com iões de cobre e uma forma com iões de zinco. Foi também
possível, e pela primeira vez, produzir diferentes formas AV-7. Através de troca iónica foi possível
introduzir nesta estrutura iões de cobre, zinco, crómio e chumbo. Para além disso foi encontrado
um comportamento característico na estrutura quando é trocada com iões de carga 2+ e
coordenação 8. Cada ião capturado produz uma alteração característica, isto pode facilitar na
identificação do ião de captura em soluções multi-iões. As substituições isomórficas não
produziram nenhum tipo de alteração às estruturas sintetizadas. No entanto, a presença de
óxido de germânio amorfo no material AV-7 fez com que a sua estabilidade térmica baixasse e a
transformação para Sn-AV-11 acontecesse mais cedo. Outros estudos térmicos revelaram que os
silicatos de estanho amorfos quando expostos a alta temperatura se transformam em cassiterite.
Essa mesma transformação foi vista para Cu-AV-6 que depois de degradação térmica recristaliza
em cassiterite de tamanho nano. Os estudos térmicos também revelaram que a estrutura
lamelar (UM-1) aqui produzida transforma-se em Sn-AV-11, e após contínua exposição ao calor
começa-se a transformar em Sn-Wadeite.

2013 Microporous tin silicates: synthesis, modification and thermal properties.
vi Dissertation in Materials Engineering
Microporous tin silicates: synthesis, modification and thermal properties. 2013
Dissertation in Materials Engineering vii
Table of contents
I Acknowledges ................................................................................................................................. I
II Resume ....................................................................................................................................... III
III Resumo ....................................................................................................................................... V
IV Abbreviations ............................................................................................................................... IX
Image Index .................................................................................................................................... XI
Table Index .................................................................................................................................... XV
V Introduction ................................................................................................................................... 1
5.1 Microporous Silicates .............................................................................................................. 1
5.2 Previous studies ..................................................................................................................... 2
5.3 Motivation and Objectives ........................................................................................................ 5
VI Experimental ................................................................................................................................ 9
6.1 Synthesis ............................................................................................................................... 9
6.2 Ion Exchange ....................................................................................................................... 16
6.3 Isomorphous substitution ...................................................................................................... 18
6.4 Thermal properties ............................................................................................................... 20
6.5 Structural characterization ..................................................................................................... 23
6.6 Morphology and chemical composition determination .............................................................. 26
6.7 Phase identification ............................................................................................................... 29
VII. Results and discussion .............................................................................................................. 33
7.1 Synthesis ............................................................................................................................. 33
7.2 Characterization of the synthesized materials .......................................................................... 39
7.2.1 Sodium-based tin silicates .............................................................................................. 39
7.2.2 Sodium- and potassium- based tin silicates ...................................................................... 45
7.2.3 Potassium-based tin silicates .......................................................................................... 51
7.3 Crystallization fields .............................................................................................................. 62
7.3.1 Sodium-based Stannosilicates ......................................................................................... 62
7.3.2 Sodium- and Potassium- based Stannosilicates ................................................................ 63
7.3.3 Potassium based stannosilicates ..................................................................................... 65
7.4 Ion exchange properties ........................................................................................................ 67
7.4.1 Exchanges on AV-6 ........................................................................................................ 67
7.4.2 Ion Exchanges on AV-7 ................................................................................................... 73
7.5 Isomorphous substitutions ..................................................................................................... 88
2013 Microporous tin silicates: synthesis, modification and thermal properties.
viii Dissertation in Materials Engineering
7.5.1 Substitutions by zirconium .............................................................................................. 88
7.5.2 Substitution by titanium .................................................................................................. 89
7.5.3 Influence of the precursor agitation and synthesis time on the substitutions of tin by zirconium
and titanium........................................................................................................................... 91
7.5.4 Substitutions by germanium and bismuth ........................................................................ 94
7.6 Stannosilicates-thermal properties .......................................................................................... 97
7.6.1 Heating at 750ºC for 4 hours .......................................................................................... 97
7.6.2 Detailed analysis of AV-6 and AV-6-Cu thermal stability .................................................... 100
7.6.3 Heating at 800ºC for 4 hours ........................................................................................ 102
7.6.4 Heating at 1000ºC for 5 hours ...................................................................................... 107
VIII Conclusions ............................................................................................................................ 113
8.1 Synthesis using a transparent precursor ............................................................................... 113
8.1.1 Sodium stannosilicates ................................................................................................. 113
8.1.2 Potassium stannosilicates............................................................................................. 114
8.1.3 Sodium and potassium based tin silicates ...................................................................... 115
8.2 Ion exchange forms ............................................................................................................ 115
8.3 Isomorphous substitutions ................................................................................................... 116
8.4 Thermal Properties ............................................................................................................. 118
8.5 Final considerations ............................................................................................................ 119
IX References ............................................................................................................................... 121
Microporous tin silicates: synthesis, modification and thermal properties. 2013
Dissertation in Materials Engineering ix
IV Abbreviations
Å: angstrom
AM-2: Aveiro Manchester – 2, titanium silicate with umbite structure
AV-6: Aveiro – 6, tin silicate with umbite structure
AV-7: Aveiro – 7, tin silicate with sodium and potassium
AV-10: Aveiro – 10, tin silicate with sodium.
AV-15: Aveiro – 15, zirconium silicate
Cu-AV-6: Aveiro – 6 exchanged with copper
cm: centimeters
EDS: Energy dispersive X-ray spectroscopy
ICDD: International Center for Diffraction Data
ITV: Isotropic thermal values
nm: nanometers
PDF: powder diffraction files
SEM: Scanning electron microscopy
Sn-AV-11: Aveiro – 11, tin silicate analogue to AV-11structure
Sn-AV-14: Aveiro – 14, tin silicate analogue to AV-14 structure
Sn-wadeite: tin silicate with the structure of the mineral wadeite
TGA: Thermo gravimetrical analysis
UM-1: University of Minho – 1
UM-2: University of Minho – 2
XRD: X-ray diffraction
Zn-AM-2: Aveiro Manchester – 2 exchanged with zinc ions
Zn-AV-6: Aveiro – 6 exchanged with zinc
Zn-ETS-4: Engelhard titanium silicate – 4 exchanged with zinc ions

2013 Microporous tin silicates: synthesis, modification and thermal properties.
x Dissertation in Materials Engineering
Microporous tin silicates: synthesis, modification and thermal properties. 2013
Dissertation in Materials Engineering xi
Image Index Figure 1. Crystal structure of AV-6, image along a-axis obtained by software Diamond 3.0 .............................................................................. 2
Figure 2. X-Ray diffraction powder patterns of AV-6 and Cu-AV-6. .................................................................................................................. 4
Figure 3. Crystalline structure of Cu-AV-6, cif obtained by Rietveld refinement and image by Diamond 3.0. ....................................................... 4
Figure 4. Precursor preparation method, stages 1 to 7 performed at 90ºC with 240 rpm agitation and stage 8 performed at 145ºC with 240 rpm
during 15 minutes. .................................................................................................................................................................................. 9
Figure 5. Composition field of the sodium-based stannosilicates (trial C), composition xNa2O-ySnO2-5SiO2∙500H2O. ........................................ 10
Figure 6. Compositions of trial E. Samples E1 to E6 produced with 500 moles of H2O. ................................................................................. 10
Figure 7. Composition field of potassium- and sodium- based tin silicates. Trial D with a composition of 10(xNa2O-yK2O)-5SiO2-zSnO2∙500H2O. . 12
Figure 8. Composition field of trial P. (a) 2.5 moles of SiO2 (b) 5 moles of SiO2. All compositions were performed with 500 moles of H2O. ......... 13
Figure 9. Autoclave used for stannosilicate hydrothermal synthesis; (a) autoclave components (photo) (b) assembly. ....................................... 15
Figure 10. Unit cell representation [35] ................................................................................................................................................... 23
Figure 11. Schematic of X-rays interactions with atomic arrangements. ....................................................................................................... 24
Figure 12. Variation of a primary beam profile caused by multiple scattering. (a) Unaffected diffraction peak. (b) Moderate multiple diffraction. (c)
Strong multiple diffraction [37]. .............................................................................................................................................................. 25
Figure 13. X-ray diffractometer (Bruker D8 Discover) [38]. ......................................................................................................................... 26
Figure 14. Schematics of SEM set-up. ..................................................................................................................................................... 27
Figure 15. Interaction of electrons and production of X-rays; (a) area of analysis (b) sample. ......................................................................... 28
Figure 16. Photos of EDS and SEM equipment, FEI Nova (FEG/SEM); EDAX - Pegasus X4M (EDS/EBSD) [38] ............................................... 28
Figure 17. Schematics of the zone of heterogeneous nucleation. ................................................................................................................ 38
Figure 18. Experimental XRD powder patterns from all the synthesized sodium-based tin silicates (Trial C). Range from 6º to 40º 2theta. ......... 40
Figure 19. Le Bail refinement of trial C13, experimental and simulated curves. Impurities as asterisk. ............................................................. 41
Figure 20. Attempt for Le Bail fit of C20 using Pmc21 space-group. Experimental calculated and difference curves well described but with high
number of extra diffraction planes. .......................................................................................................................................................... 42
Figure 21. Experimental XRD powder patterns of trial TC2 to TC4. Synthesis at 200ºC for 2 days. agitations from 5 to 30 minutes.(5 minutes:
unindexed phase, 15 minutes: unknown sodium phase (UM-1) and 30 minutes: AV-10) ............................................................................... 43
Figure 22. Experimental powder XRD patterns of trials TC5 to TC8- 7 days synthesis and precursor agitation going from 5 to 30 minutes (5 minutes:
unindexed phase, 15 minutes: unindexed phase and 30 minutes: analyzed bellow). .................................................................................... 44
Figure 23. EVA search match for TC8, confirmation of soluble crystalline materials (red: Na2SiO3 blue: Na2(Sn(OH)6)). ..................................... 44
Figure 24. Experimental XRD powder patterns of trial E, 2 days synthesis and 15 minutes of agitation. .......................................................... 45
Figure 25. Experimental XRD powder patterns of trial D, 2 days synthesis and 15 minutes of precursor agitation. ........................................... 47
Figure 26. Experimental and simulated curves of trials D1 (a) and D7 (b) extracted by Le Bail refinement. ....................................................... 48
Figure 27. SEM images of AV-7 (a) and AV-6 (b). AV-6 sample with some copper chloride contaminations (confirmed by EDS).......................... 49
Figure 28. Experimental powder patterns from trials: TD1-TD4 for 2 days of synthesis (a); trials TD5-TD8 with 4 days synthesis (b). ....................... 49
Figure 29. Phase percentage evolution: trial TD1 to TD4 (a); trial TD5 to TD8 (b). Data calculated by Rietveld refinement. ..................................... 50
Figure 30. Experimental powder XRD patterns of trial P, 2 days synthesis and 15 minutes of precursor agitation. ........................................... 52
Figure 31. Experimental and simulated XRD patterns produced by Le Bail method of TOPAS 3.0. ................................................................. 53
Figure 32. EDS spectrum of trial P10. ...................................................................................................................................................... 54
Figure 33. Representation of the developed structure for trial P10 (UM-2). Visualization in direction a (a) and direction b (b). ............................. 55
Figure 34. Experimental and simulated curve produced from Rietveld refinement procedure to trial P10. ......................................................... 56
Figure 35. SEM images of the tin silicate layered phase (UM-2) (a) and (b) are different zones from the material and (c) a detailed image of the
cylinders like particles............................................................................................................................................................................ 57
Figure 36. Experimental XRD powder patterns from trial TP, 2 days of synthesis (a) and 4 days of synthesis (b). ............................................. 58
Figure 37. Phase percentage evolution for trial TP1 to TP4 (a) and trial TP5 to TP8 (b) (Values calculated by Rietveld refinement). ......................... 59
Figure 38. SEM image of Trial TP3. .......................................................................................................................................................... 60
Figure 39. Experimental powder XRD pattern of trial TL. Synthesized with P10 composition at various conditions. ............................................. 61
Figure 40. Crystallization field of the sodium-based stannosilicates. Produced for 2 days of synthesis and 15 minutes of precursor agitation, based
on trial C. ............................................................................................................................................................................................. 62
2013 Microporous tin silicates: synthesis, modification and thermal properties.
xii Dissertation in Materials Engineering
Figure 41. Crystallization field of the mixed sodium- and potassium- based stannosilicates. Performed for 2 days of synthesis and 15 minutes of
precursor agitation, based on trial D. ....................................................................................................................................................... 64
Figure 42. Crystallization field for the potassium- based stannosilicates. The synthesis was performed for 2 days and 15 minutes of precursor
agitation, based on trial P....................................................................................................................................................................... 65
Figure 43. Experimental powder XRD patterns from the ion exchanges of AV-6. Performed at 80ºC during 48 hours. ....................................... 67
Figure 44. Experimental and simulated powder XRD patterns form the Le Bail refinement on the ion exchanged Sn-umbite. Exchange with copper
for 24, 48 and 72 hours. ....................................................................................................................................................................... 69
Figure 45. Experimental and simulated curves from the exchange with zinc. Simulation done using TOPAS 3.0. ............................................. 70
Figure 46. Experimental powder XRD patterns of the AV-6 ion exchanges with Pb2+ and Al3+. performed for 18 hours at 50ºC. ......................... 71
Figure 47. Experimental and simulated curves from the TOPAS 3.0 Rietveld refinement. AV-6 ion exchange with aluminum for 18 hours at 50ºC.
........................................................................................................................................................................................................... 72
Figure 48. SEM image of Av-6 produced by a clear precursor. Attempt of ion exchange with aluminum. ......................................................... 73
Figure 49 Experimental powder patterns of the ion exchanges of AV-7. Performed at 80ºC during 48 hours. ................................................... 74
Figure 50. Experimental and simulated powder patterns from Le bail refinement on AV-7 ion exchanged with chromium. Exchanges during 24, 48
and 72 hours at 80ºC. ........................................................................................................................................................................... 75
Figure 51. SEM image of AV-7 ion exchanged with Chromium. AV-7 produced on trial D12. .......................................................................... 76
Figure 52 Experimental and simulated powder patterns of AV-7 Chromium exchange obtained by Rietveld refinement. .................................... 77
Figure 53. Simulated structures from AV-7 and Cr-AV-7. Direction a-axis of AV-7. (a) Direction c-axis of AV-7 (b). Direction a-axis of AV-7 Cr form (c).
Direction c-axis of AV-7 Cr form (d). ......................................................................................................................................................... 78
Figure 54. Experimental and simulated curves of AV-7 ion exchange with copper. ........................................................................................ 79
Figure 55. SEM image of AV-7 ion exchanged with copper. Exchange during 48 hours at 80ºC. ..................................................................... 81
Figure 56. Experimental and calculated curves from the Le Bail refinement of AV-7 ion exchanged with zinc. .................................................. 82
Figure 57. SEM image of AV-7 ion exchanged with zinc for 24 hours at 80ºC............................................................................................... 83
Figure 58. Experimental powder XRD patterns of AV-7 ion exchanged with lead and aluminum. ..................................................................... 84
Figure 59. Experimental and simulated curves of the Le Bail refinement of AV-7 ion exchanged with Pb and Al. .............................................. 85
Figure 60. AV-7 simulated structure with plane (020). ............................................................................................................................... 85
Figure 61. Peak intensity difference between planes (002) and (020) in several AV-7 forms. ......................................................................... 86
Figure 62. Experimental powder XRD patterns of the zirconium isomorphous substitutions on stannosilicates, performed at 200ºC for 2 days. .. 89
Figure 63. Titanium-tin precursors, 60% titanium 40% tin compositions. ...................................................................................................... 90
Figure 64. Experimental powder XRD patterns of the titanium isomorphous substitutions performed at 200ºC for 2 days. ................................ 91
Figure 65. Experimental powder XRD patterns from trial ISS. Synthesis at 200ºC for 5 days. .......................................................................... 92
Figure 66. Experimental and simulated powder XRD patterns of the isomorphous substitutions for 5 days and 30 minutes precursor agitation... 94
Figure 67. Experimental powder XRD patterns from isomorphous substitutions by germanium and bismuth. Sodium compositions synthesized for
2 days and potassium compositions for 2 days, all at 200ºC. .................................................................................................................... 96
Figure 68. SEM image of potassium AV-7, isomorphous substation with germanium, AV-7 particles (blue) AV-6 particles (red) AV-7 nanorods
(green). ................................................................................................................................................................................................ 97
Figure 69. Experimental powder XRD patterns of the samples exposed to 750ºC for 4 hours. ....................................................................... 98
Figure 70. Experimental and simulated curves after Le Bail refinement of the cassiterite formed by thermal exposure of samples E6 and Cu-AV-6.
........................................................................................................................................................................................................... 99
Figure 71. Experimental (Black) and calculated (red) PXRD patterns of AV-6 (a) and AV-6-Cu (b) performed at different temperatures. Unit cell axes
(c) and lattice volume (d) of AV-6 and AV-6-Cu at different temperatures.................................................................................................... 101
Figure 72. Experimental (black) and calculated (red) PXRD patterns of AV-6 (a) and AV-6-Cu (b) performed at ambient temperature after heating at
different temperatures. Unit cell axes (c) and lattice volume (d) of AV-6 and AV-6-Cu at ambient condition. ................................................... 102
Figure 73. Experimental powder XRD patterns of the thermally exposed samples. Exposure at 800ºC for 4 hours. ........................................ 103
Figure 74. Experimental and simulated powder XRD patterns obtained by Le Bail refinement. Collected on sample F7, mixture of Sn-AV-11 and AV-
6. ...................................................................................................................................................................................................... 104
Figure 75. Le Bail refinement of the high resolution powder XRD pattern of trial F4. Experimental (black) calculated (red). .............................. 105
Figure 76. Experimental and calculated patterns of AV-7-Zn after 800ºC for 4 hours. .................................................................................. 107

Microporous tin silicates: synthesis, modification and thermal properties. 2013
Dissertation in Materials Engineering xiii
Figure 77. Solid block (Sample H7). ...................................................................................................................................................... 107
Figure 78. Experimental powder XRD patterns of the thermally exposed samples. Exposure at 1000ºC for 5 hours. ...................................... 108
Figure 79. Experimental, calculated and plane occupation patterns of the Le Bail refinement for trial H3. ..................................................... 109
Figure 80. Experimental and simulated plots of the Sn-AV-11 heated at 1000ºC for 5 hours. ....................................................................... 110
Figure 81. Experimental and calculated curves of samples H1 and H7. Le Bail refinement of cassiterite. ....................................................... 111

2013 Microporous tin silicates: synthesis, modification and thermal properties.
xiv Dissertation in Materials Engineering
Microporous tin silicates: synthesis, modification and thermal properties. 2013
Dissertation in Materials Engineering xv
Table Index Table 1. Experimental parameters of trial TC. Precursor agitation time in minutes and synthesis duration in days. ........................................... 11
Table 2 Experimental parameters of trial TD. Precursor agitation time in minutes and synthesis duration in days. ............................................ 12
Table 3. Experimental parameters of trial TP. Precursor agitation time in minutes and synthesis duration in days. ........................................... 14
Table 4. Experimental parameters of trial TL. Precursor agitation time in minutes and synthesis duration in days............................................. 14
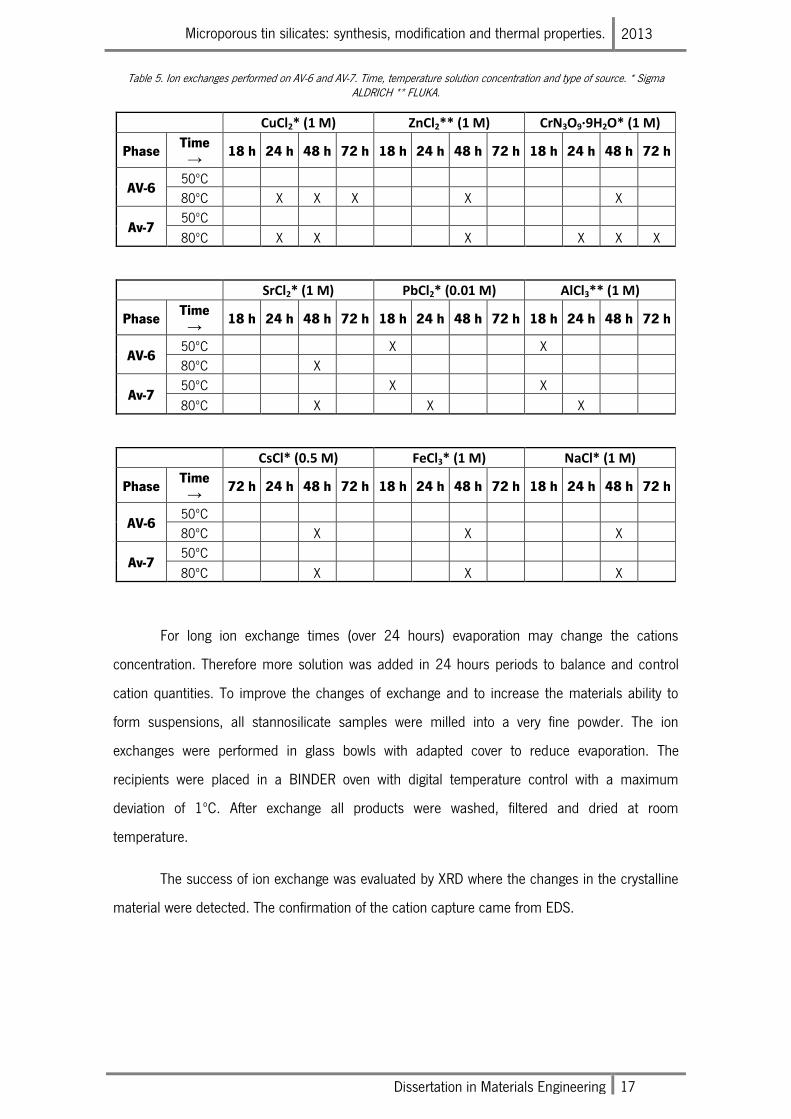
Table 5. Ion exchanges performed on AV-6 and AV-7. Time, temperature solution concentration and type of source. * Sigma ALDRICH ** FLUKA.
........................................................................................................................................................................................................... 17
Table 6. Compositions and preparation parameters for the isomorphous substitutions by Zr and Ti. .............................................................. 19
Table 7. Composition and synthesis parameters for the isomorphous substitution by Zr and Ti at extended synthesis times. ............................ 20
Table 8. Compositions and synthesis parameters of the isomorphous substitutions by Ge and Bi. ................................................................. 20
Table 9. Information on the stannosilicates exposed to 750ºC for 4 hours. .................................................................................................. 21
Table 10. Information on the materials exposed to 800ºC for 4 hours. ........................................................................................................ 22
Table 11. Information on the materials exposed to 1000ºC for 5 hours. ...................................................................................................... 23
Table 12. Synthesis results for the sodium-based tin silicates for 2 days synthesis and 15 min. of precursor agitation (Trial C). ........................ 33
Table 13. Synthesis results for trial TC, each composition agitated for 0, 5, 15 and 30 minutes. .................................................................... 34
Table 14. Synthesis results from trial E. 2 days synthesis and 15 minutes of precursor agitation. .................................................................. 35
Table 15. Synthesis results for the sodium and potassium based stannosilicates (Trial D). Two days of synthesis and 15 minutes of precursor
agitation. .............................................................................................................................................................................................. 35
Table 16. Synthesis results for Trial TD. Composition from 1-4 and 5-8 are equal (see in appendix 1). Precursor agitation time for 0, 5, 15 and 30
minutes. .............................................................................................................................................................................................. 36
Table 17. Synthesis results for potassium based stannosilicates (Trial P). Syntheses for 2 days at 200ºC and precursor agitation of 15 minutes. 37
Table 18. Synthesis results for trial TP, trials 1-4 composition equal to P1 trials 5-8 composition equal to P10. Precursor agitation times for 0, 5, 15
and 30 minutes. ................................................................................................................................................................................... 37
Table 19. Synthesis results of Trial TL. All trials performed at the same composition (trial P10). ...................................................................... 38
Table 20. Crystallographic data of trial C13, performed by Le Bail using hkl data from AV-10. ........................................................................ 41
Table 21. Refinement results of trial D1 and D7. Obtained by Le Bail with hkl data from AV-7 and AV-6. ......................................................... 48
Table 22. Crystallographic data from the Le Bail refinement performed to trial P10. ...................................................................................... 53
Table 23. Chemical composition of trial P10, obtained by EDS. ................................................................................................................... 54
Table 24. Chemical composition of trial TP3 obtained by EDS. .................................................................................................................... 59
Table 25. Crystallographic data from AV-6 ion exchanges with copper. Exchanged for 24, 48 and 72 hours. ................................................... 68
Table 26. Crystallographic data from Rietveld refinement of the exchanged form of AV-6, exchange with zinc at 80ºC during 48 hours. ............. 70
Table 27. Crystallographic data from the Rietveld refinement. AV-6 ion exchange with aluminum. .................................................................. 71
Table 28. EDS results of AV-6 exchanged with aluminum........................................................................................................................... 72
Table 29. Crystallographic data of the AV-7 ion exchanges with chromium. Exchanges performed during 24, 48 and 72 hours at 80ºC. ............ 75
Table 30. Chemical composition of AV-7 ion exchange with chromium. ....................................................................................................... 76
Table 31 Crystallographic data from the Rietveld refinement to the AV-7 chromium exchanged material. Exchange at 80ºC during 72 hours. ..... 77
Table 32. Atomic coordinates for AV-7 Cr-form. ........................................................................................................................................ 78
Table 33. Crystallographic data for AV-7-ion exchange with copper. Refinement by Le Bail method. ............................................................... 79
Table 34. Chemical composition of the AV-7 ion exchange with copper for 48 hours. ................................................................................... 80
Table 35. Crystallographic data from the Le Bail refinement to the AV-7 ion exchanges with zinc. .................................................................. 81
Table 36. Chemical composition of AV-7 ion exchanged with zinc for 24 hours. ........................................................................................... 82
Table 37. Crystallographic data from Le Bail refinement of AV-7 ion exchanged with Pb and Al. ..................................................................... 84
Table 38. Synthesis results from the isomorphous substitutions with 20% (IS1 to IS4) and 40% (IS5 to IS6) of zirconium. ....................................... 88
Table 39. Type of precursor and synthesis result of all isomorphous substitutions with titanium. Performed at 200ºC for 2 days. ..................... 90
Table 40. Crystallographic data from the isomorphous substitutions performed for 5 days synthesis at 30 minutes of precursor agitation time.
Substitutions by zirconium and titanium. ................................................................................................................................................. 93
Table 41. Precursor type and synthesis result from the isomorphous substitutions by germanium and bismuth. ............................................. 95
Table 42. Chemical composition of the germanium exchanged AV-7 (trial Ge2D2). ........................................................................................ 96
2013 Microporous tin silicates: synthesis, modification and thermal properties.
xvi Dissertation in Materials Engineering
Table 43. Crystallographic data of thermally exposed samples E6 and Cu-AV-6. Exposure for 4 hours at 750ºC. ............................................. 99
Table 44. Crystallographic data from sample F7. Le bail refinement using AV-6 and Sn-AV-11 data. ............................................................. 104
Table 45. Crystallographic data of Le Bail refinement of sample F4. .......................................................................................................... 105
Table 46. Crystallographic data for Zn-AV-7 after 800ºC for 4 hours. ......................................................................................................... 106
Table 47. Crystallographic data from the Le Bail refinement of trial H3. Obtained using a high resolution powder XRD pattern. ....................... 109
Table 48. Crystallographic data from the materials transformed into Sn-AV-11. .......................................................................................... 110
Table 49. Crystallographic data for cassiterite. Le Bail refinement of samples H1 and H7. ........................................................................... 111
Microporous tin silicates: synthesis, modification and thermal properties. 2013
Dissertation in Materials Engineering 1
V Introduction
5.1 Microporous Silicates
The history of the microporous materials starts with the discovery of the zeolite minerals.
This species were discovered in 1756 by Swedish mineralogist Axel Cronstedt, who gave their
common name after upon rapidly heating the material release a steam from absorbed water.
Thus, he called the materials zeolites, from the Greek (zéo), meaning “to boil” and (lithos),
meaning “stone” [1].
Science advanced and now they are known as hydrated aluminosilicates containing pores
of molecular size. The structures of these materials are composed of interconnected SiO4 and
AlO4 that form a microporous framework. These types of frameworks form negative charged
zones in the pores which are compensated by positively charged cations. Along with those
cations, the pores also contain structural water molecules. In nature there are large deposits of
zeolites but the synthetic ones are more important due to their vast industrial applications. Zeolite
A was one of the first widely used commercial zeolites. The success of this material was the
trigger point to start the study of new forms and to incorporate these materials in the market [2].
Zeolites are now of vital importance in the fuel industry performing as catalyst to produce
gasoline [3] and as molecular sieves used for gas and liquids separations [4]. To date, there are
more than 200 framework types of zeolites and the number of hypothetical is still pending a
discovery [5].
Recently, the family of the zeolites has been expanded to other silicate molecular sieves
obtained by the substitution of AlO4 tetrahedra by various metals in octahedral coordination. This
resulted in new materials (chemically and structurally) with classical zeolitic and new applications
in areas such as optoelectronics, nonlinear optics, batteries, magnetic materials and sensors [6].
Within the family of the tetrahedral-octahedral molecular sieves, some of the most
important members are the transition metal as titanosilicates, vanadosilicates and
zirconosilicates [6]. In the common case, microporous silicates are produced in Teflon-line
autoclaves under mild hydrothermal conditions at temperatures from 150 to 230ºC during 1 to
10 days [6].
Across the last years many attempts have been made to synthesize new microporous
silicates and zeolites with different structures and new potential applications. There is also a
2013 Microporous tin silicates: synthesis, modification and thermal properties.
2 Dissertation in Materials Engineering
great effort to modify the existing microporous structures in order to infuse them with new
properties and improve the known ones. This work focuses on a recent and perspective class of
materials as the microporous tin silicates. These solids offer a number of less explored structures
and properties that can be an alternative to ones of the zeolites and other tetrahedral-octahedral
molecular sieves.
5.2 Previous studies
In number of microporous materials it is common to see the same structures in different
chemical forms. These materials are often structural analogues of existing minerals in the nature.
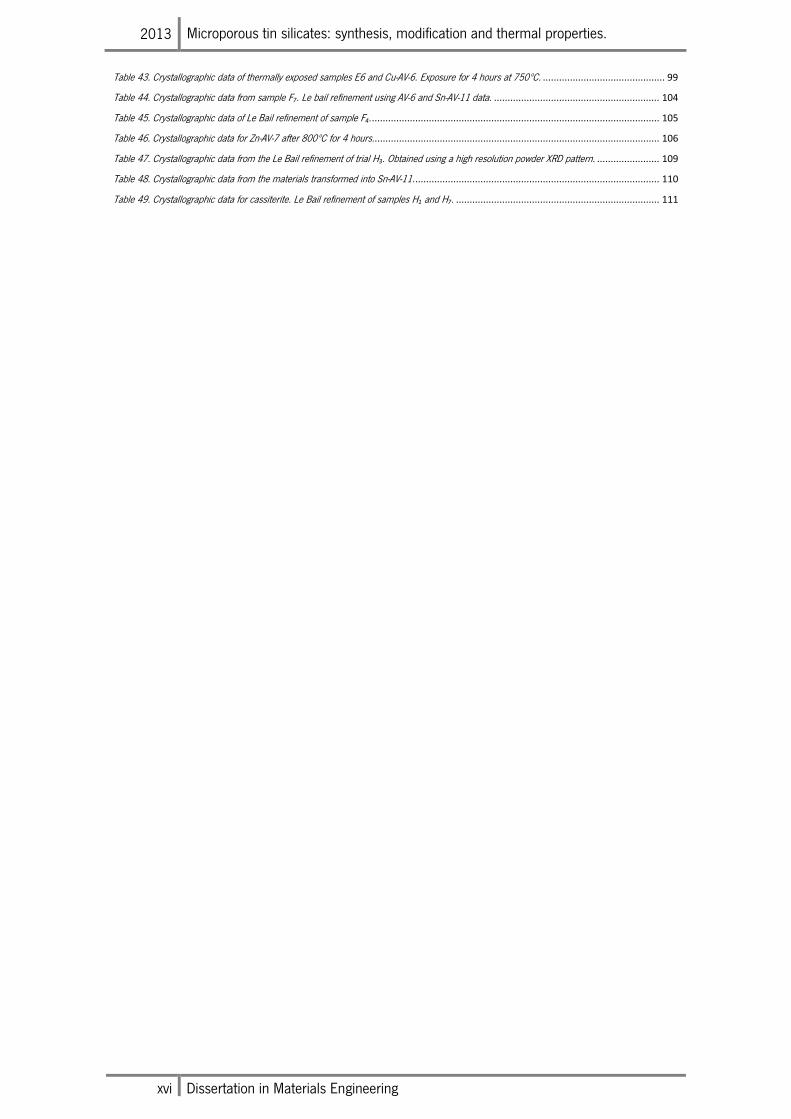
Among them one of the most studied is the analogue of the zirconosilicate mineral, umbite,
whose tin [6], titanium [7-9] and zirconium [10-12] forms have been prepared in laboratory
conditions. Its porous structure is formed by an interconnection of corner sharing SiO4 tetrahedra
and MO6 octahedra of various elements. In the space of the pores resides a water molecule and
K+ ions that compensate the negative charge of the framework. A model of this molecular sieve
can be seen in figure 1. The structure has orthorhombic crystal system with P212121 space-group
and the unit cell dimensions depending on its chemical composition of the octahedral site. These
isostructural phases are often called after the institutions where they have been synthesized for
the first time. For example the
titanium form is called AM-2
(Aveiro Manchester – 2) and the
tin form AV-6 (Aveiro – 6).
The applied properties of
different chemical forms of the
synthetic umbite have been widely
studied. Ion exchange experiments
of titanium form showed possibility
to uptake Na+, Cs+, Mn2+, Sr2+,
Ca2+ and Rb2+. In these studies the
change of the charge
compensation cations of AM-2 revealed structural changes and reduction of thermal stability [13-
14, 15]. Some ion exchanged forms demonstrated a potential for advanced applications. For
example, zirconium umbite exchanged with Zn2+ resulted in an antibacterial microporous
material [16]. A similar property was discovered on Zn-AM-2 and Zn-ETS-4 (Engelhard titanium
Figure 1. Crystal structure of AV-6, image along a-axis obtained by software Diamond 3.0
Microporous tin silicates: synthesis, modification and thermal properties. 2013
Dissertation in Materials Engineering 3
silicate-4). These molecular sieves prove to be effective in the selective elimination of cancer cells
[17].
Apart from the ion exchange properties, umbite type structure in its titanium (AM-2) and
tin (AV-6) forms shows excellent potential for preparation of membrane for separation of H2 and
N2. AM-2 shows higher potential and higher thermal stability than AV-6 but the tin microporous
framework shows promising potential for the use in CO2 separation [18]. In terms of structure
manipulation, the change of the octahedral site allows finely adjustable lattice dimensions and
pore sizes. In this respect, there are reports on synthesis of Ti-V [19], Ti-Zr [20], and Sn-Zr [20]
forms of umbite.
Another important microporous ion exchanger tin silicate is EMS-2. Along with AV-6,
these materials are the only forms of tin molecular sieves to be studied in terms of ion exchange.
Experiments with Mg2+, Ca2+, Sr2+ and Ba2+ resulted in partly or fully ion exchanged forms. The
thermal studies of these ion exchanged forms revealed that all modified frameworks lose stability
due to the external ion capture [21].
Thermal properties investigation revealed how structurally different materials AV-6 and
AV-7 are transformed into Sn-AV-11 [22]. AV-7(Aveiro – 7) is a microporous tin silicate which is
structural analogue of the mineral kostylevite [23]. In spite of different symmetry, AV-7
(monoclinic) and AV-6 (orthorhombic) have the same structural motif. The pore system of both
phases is composed of 6-ring and 8-ring channels. With equal occupation on the 6-ring pore, AV-
6 and AV-7 differ in the occupation of the 8-ring channel. AV-7 has sodium and potassium ions as
charge stabilizers. Despite the resemblances between these two frameworks the ion exchange
properties are very different. While AV-6 is easily exchanged to various cation forms, for AV-7 no
ion exchange forms have been ever reported.
To date there are no more than 10 known microporous tin silicate structures, AV-6[6],
AV-7 [23] and EMS-2 [24] produced by conventional hydrothermal synthesis. Sn-AV-14 [25] and
AV-10 [26], two sodium based stannosilicates produced by a two stage synthesis were the
synthesis can take more than 10 days. Sn-AV-11 [22] and Sn-wadeite [22] produced by high
temperature transformation. All these synthesis of stannosilicates are performed from gels with
tin chloride (IV) and sodium metasilicate. As a result they are always synthesized from white gels
containing sodium ions. Similar to these frameworks there are chemically different forms of
stannosilicates produced by high temperature and high pressure synthesis [27].
2013 Microporous tin silicates: synthesis, modification and thermal properties.
4 Dissertation in Materials Engineering
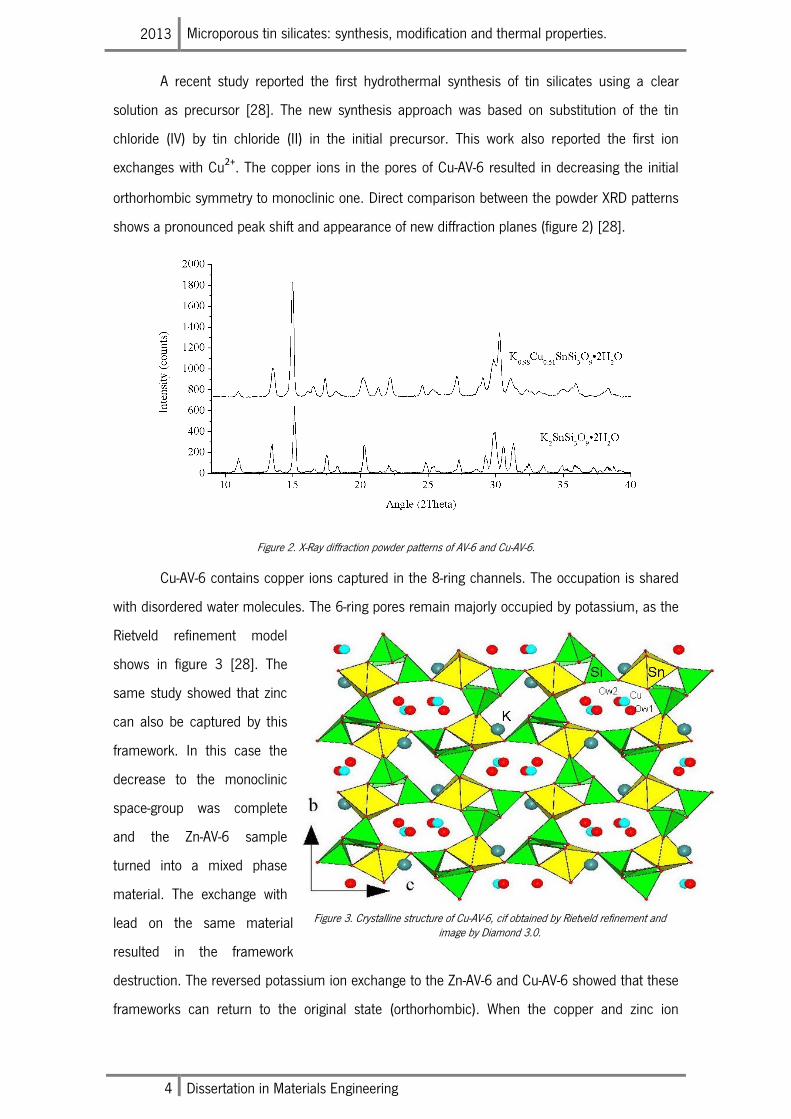
A recent study reported the first hydrothermal synthesis of tin silicates using a clear
solution as precursor [28]. The new synthesis approach was based on substitution of the tin
chloride (IV) by tin chloride (II) in the initial precursor. This work also reported the first ion
exchanges with Cu2+. The copper ions in the pores of Cu-AV-6 resulted in decreasing the initial
orthorhombic symmetry to monoclinic one. Direct comparison between the powder XRD patterns
shows a pronounced peak shift and appearance of new diffraction planes (figure 2) [28].
Figure 2. X-Ray diffraction powder patterns of AV-6 and Cu-AV-6.
Cu-AV-6 contains copper ions captured in the 8-ring channels. The occupation is shared
with disordered water molecules. The 6-ring pores remain majorly occupied by potassium, as the
Rietveld refinement model
shows in figure 3 [28]. The
same study showed that zinc
can also be captured by this
framework. In this case the
decrease to the monoclinic
space-group was complete
and the Zn-AV-6 sample
turned into a mixed phase
material. The exchange with
lead on the same material
resulted in the framework
destruction. The reversed potassium ion exchange to the Zn-AV-6 and Cu-AV-6 showed that these
frameworks can return to the original state (orthorhombic). When the copper and zinc ion
Figure 3. Crystalline structure of Cu-AV-6, cif obtained by Rietveld refinement and image by Diamond 3.0.
Microporous tin silicates: synthesis, modification and thermal properties. 2013
Dissertation in Materials Engineering 5
exchanged forms of AV-6 are exposed to high concentrated (1Mole) solutions of potassium (KCl)
the AV-6 original chemical composition is restored [28].
5.3 Motivation and Objectives
The motivation for this work is driven by the potentially novel and improvement of the
known applications of the microporous tin silicates. This motivation is based on the gained
experience during the previous work with stannosilicates [28]. The obtained results showed that
the stannosilicate system is promising not only for the preparation of new materials but also for
the discovery of new ion exchange properties of known molecular sieves. The work performed so
far showed the great potential of the synthesis using a transparent precursor. It also showed that
there are many possible elements that can be captured in the tin silicate porous framework
types. As a result, the obtained materials revealed different properties than the initially
synthesized phase. In this respect, the current work is a natural continuation of the previous
experience and the objectives include:
a) Development of a new method for the synthesis of tin silicates from a clear solution;
b) Systematic study of the influence of the initial physicochemical conditions on the run
product;
c) Optimization of the synthesis conditions;
d) Synthesis and characterization of new stannosilicates;
e) Probing isomorphous substitutions and ion exchange properties with various elements;
f) Study the thermal properties of the obtained materials.
The purpose of this thesis is to extend a previous work in the field of tin silicates. This
work intends to establish the optimal physicochemical conditions for synthesis of stannosilicates
and to create fields of crystallization where the intended structures can be easily fabricated.
The new synthesis method by clear precursor has unknown outcome in terms of
microporous tin silicates formation. In order to understand the full potential of this method this
work focus on the behavior of the sodium and potassium as framework stabilizers, their role in
the solution and the limitation and advantages of each element in this new method. This work
searches for chemical compositions that allow the formation of cheaper materials by the
reduction of synthesis time and temperature. The final point of interest in the synthesis
procedure is the study of the early physicochemical compositions of the solution and its role in
the final product. Precursor pH has been already proven as an important factor on silicate
production [29]. However there are many other unstudied factors that can induce structure
2013 Microporous tin silicates: synthesis, modification and thermal properties.
6 Dissertation in Materials Engineering
formation. This work studies the effects of solution temperature and agitation level and its
importance in the production of stannosilicates.
New ion exchanges in tin silicates frameworks were also attempted. As seen before [19]
the capture of an external ion can transfer the properties of that element to the silicates material.
With that in mind it is possible to think in the doping of stannosilicates to improve its normal
capacities. This work attempts the incorporation of antibacterial, magnetic and optical properties
by the exchange of the normal alkaline elements present in stannosilicates for Zn2+, Cu2+ and
Cr3+, respectively. Since the storing of the captured element is very good, a common ion
exchange tested is the ability to capture potential radioactive elements. Like in most silicates this
work studies the capacity of stannosilicates to capture hazardous but interesting elements like
Cs+ and Sr2+. These two exchanges serve as direct comparison between these molecular sieves
and all other silicates, and a positive result could indicate the eminent application of
stannosilicates in nuclear waste disposal.
In this respect there is another great application for these microporous materials, due to
the ability of capturing loose ions in a solution this material can work in water purification. The
capture of elements like Pb2+, Fe2+, Al3+ and some of the previously referred (like Cu2+) can be
used for water treatment or recycling of polluted liquids. The use of microporous materials in the
recycling and energy harnessing of used fried oil is a common procedure [29], the search for
these properties on stannosilicates can result in a new application for this recent material. to
understand if the tin silicate frameworks can capture these and other ions this work searches for
changes in the materials atomic distribution. These changes must be visible both at a structural
level (detected by XRD) and at a chemical composition level (detected by EDS).
To improve and modify the properties of tin silicates isomorphous substitutions were also
attempted. These incorporations of new octahedral elements can alter the pores sizes or
drastically change the structure shape and properties. The goal was to find and analyze new
mixed metal stannosilicates using Zr, Ti, Ge and Bi as substitution elements. Zirconium silicates
have great thermal stability however the synthesis of theses microporous materials require higher
temperatures or longer time comparing to tin silicates. The incorporation of Zr to tin silicate
compositions can result in mixed stannosilicates with higher thermal stability and harder grains.
It can also result in zirconosilicates with lower synthesis temperatures and with new transparent
precursor synthesis method. Titanium has similar size to tin. When 6 coordinated titanium ion
has radii of 0.605 Å [30] and tin one is 0.69 Å [31]. The size difference between the ions is
Microporous tin silicates: synthesis, modification and thermal properties. 2013
Dissertation in Materials Engineering 7
enough to provoke slightly change in the pore size when one of the ions is substituted by the
other. The microporous framework of the mineral umbite can be produced with both ions as
octahedral element. The incorporation of both ions in a umbite composition can easily form a
mixed octahedral Ti-Sn-umbite material.
The isomorphous substitutions by germanium presents great promise since this element
has the ability to form tetrahedra, octahedra and pentahedra; therefore it can substitute both tin
and silicon in the framework, creating mixed stannosilicates, mixed germanosilicates or tin
germinates. The incorporation of this element can perform several changes and severally distort
the stannosilicate structures. The only downsize to its use is the cost of the source; germanium is
a very expensive element so only a few tests were performed. The isomorphous substitution by
bismuth is interesting due to its valence of 3+ which differ that of Sn and Si. Successful
incorporation of bismuth can seriously affect the whole spectrum of properties. The problem of
bismuth is its fast precipitation of its source (BiCl3) in aqueous solutions which requires
experiments with different sources.
Finally, thermal study of all the synthesized and modified structures was performed.
These tests served to reveal the thermal stability and possible thermal transformations of the
obtained phases.
All synthesized and structurally modified phases were characterized by powder X-ray
diffraction (XRD).

2013 Microporous tin silicates: synthesis, modification and thermal properties.
8 Dissertation in Materials Engineering
Microporous tin silicates: synthesis, modification and thermal properties. 2013
Dissertation in Materials Engineering 9
VI Experimental
6.1 Synthesis
In order to evaluate the potential of this synthesis method the precursor preparation
must be fully understood and all possible variables must be eliminated. To understand the effects
of composition all syntheses were performed by the same preparation steps. The silica
dissolution was performed at 90ºC at 240 rpm of magnetic agitation. Silica was dissolved in the
alkaline water solution which was always formed from an element in the hydroxide form. The
solid alkaline was dissolved in distilled water by the same conditions 90ºC and 240 rpm.
Separately the tin chloride solution was prepared dissolving the SnCl2∙2H2O in 50% of all the
compositional water. The total water in the stannosilicates precursors was fixed at 500 moles
and due to maximum capacity of the autoclave all compositions were calculated for 40 grams of
water. The mixing of the tin chloride solution and alkaline solutions was performed at 154ºC at
agitation speed of 240 rpm. The final precursor was then agitated for 15 minutes.
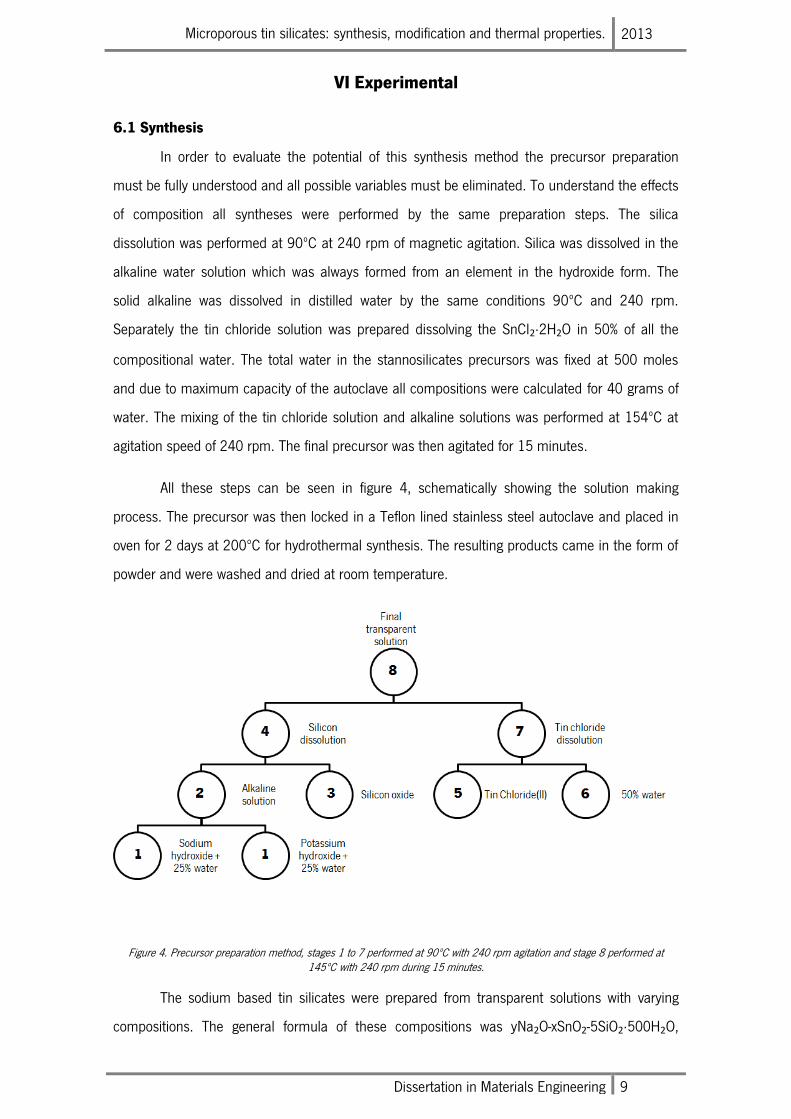
All these steps can be seen in figure 4, schematically showing the solution making
process. The precursor was then locked in a Teflon lined stainless steel autoclave and placed in
oven for 2 days at 200ºC for hydrothermal synthesis. The resulting products came in the form of
powder and were washed and dried at room temperature.
Figure 4. Precursor preparation method, stages 1 to 7 performed at 90ºC with 240 rpm agitation and stage 8 performed at 145ºC with 240 rpm during 15 minutes.
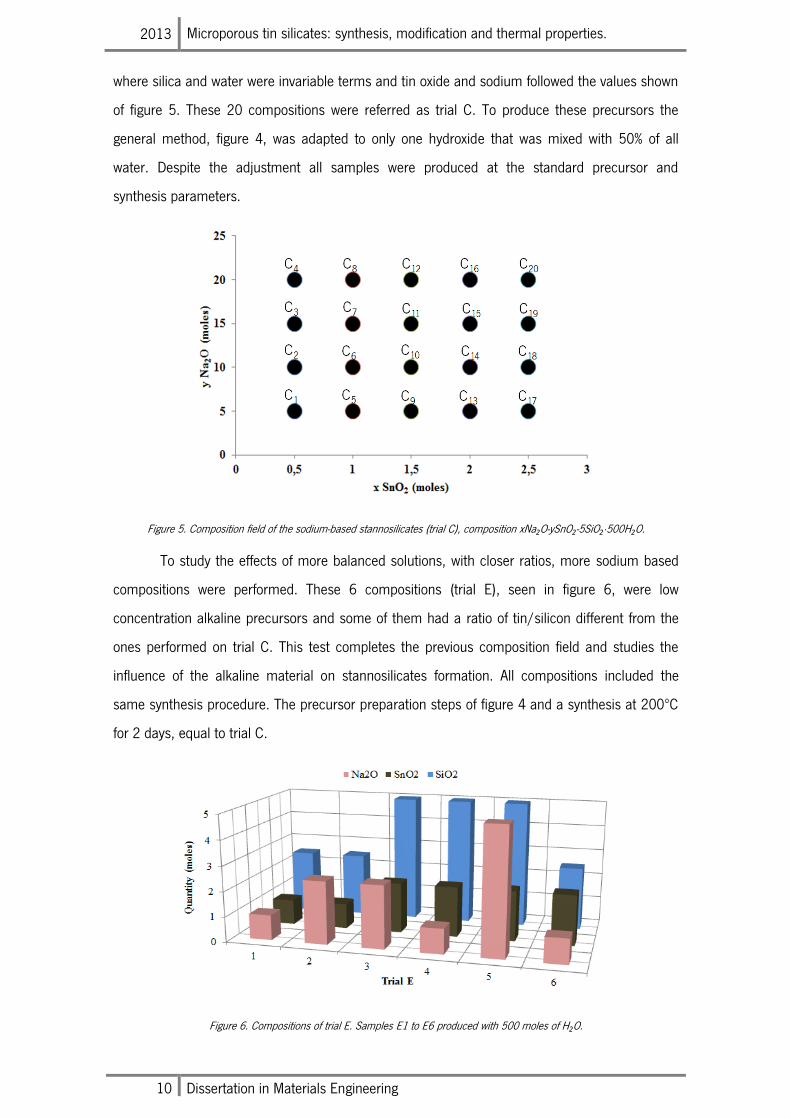
The sodium based tin silicates were prepared from transparent solutions with varying
compositions. The general formula of these compositions was yNa2O-xSnO2-5SiO2∙500H2O,
2013 Microporous tin silicates: synthesis, modification and thermal properties.
10 Dissertation in Materials Engineering
where silica and water were invariable terms and tin oxide and sodium followed the values shown
of figure 5. These 20 compositions were referred as trial C. To produce these precursors the
general method, figure 4, was adapted to only one hydroxide that was mixed with 50% of all
water. Despite the adjustment all samples were produced at the standard precursor and
synthesis parameters.
Figure 5. Composition field of the sodium-based stannosilicates (trial C), composition xNa2O-ySnO2-5SiO2∙500H2O.
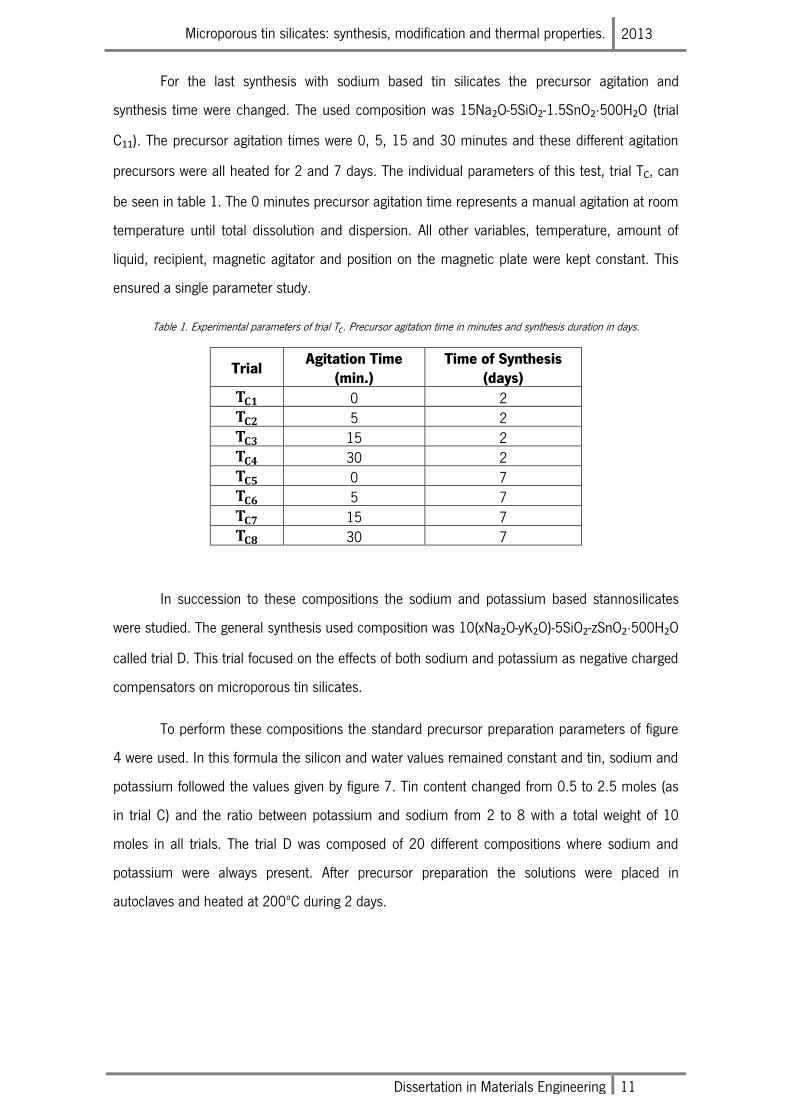
To study the effects of more balanced solutions, with closer ratios, more sodium based
compositions were performed. These 6 compositions (trial E), seen in figure 6, were low
concentration alkaline precursors and some of them had a ratio of tin/silicon different from the
ones performed on trial C. This test completes the previous composition field and studies the
influence of the alkaline material on stannosilicates formation. All compositions included the
same synthesis procedure. The precursor preparation steps of figure 4 and a synthesis at 200ºC
for 2 days, equal to trial C.
Figure 6. Compositions of trial E. Samples E1 to E6 produced with 500 moles of H2O.
Microporous tin silicates: synthesis, modification and thermal properties. 2013
Dissertation in Materials Engineering 11
For the last synthesis with sodium based tin silicates the precursor agitation and
synthesis time were changed. The used composition was 15Na2O-5SiO2-1.5SnO2∙500H2O (trial
C11). The precursor agitation times were 0, 5, 15 and 30 minutes and these different agitation
precursors were all heated for 2 and 7 days. The individual parameters of this test, trial TC, can
be seen in table 1. The 0 minutes precursor agitation time represents a manual agitation at room
temperature until total dissolution and dispersion. All other variables, temperature, amount of
liquid, recipient, magnetic agitator and position on the magnetic plate were kept constant. This
ensured a single parameter study.
Table 1. Experimental parameters of trial TC. Precursor agitation time in minutes and synthesis duration in days.
Trial Agitation Time
(min.) Time of Synthesis
(days) 0 2 5 2 15 2 30 2 0 7 5 7 15 7 30 7
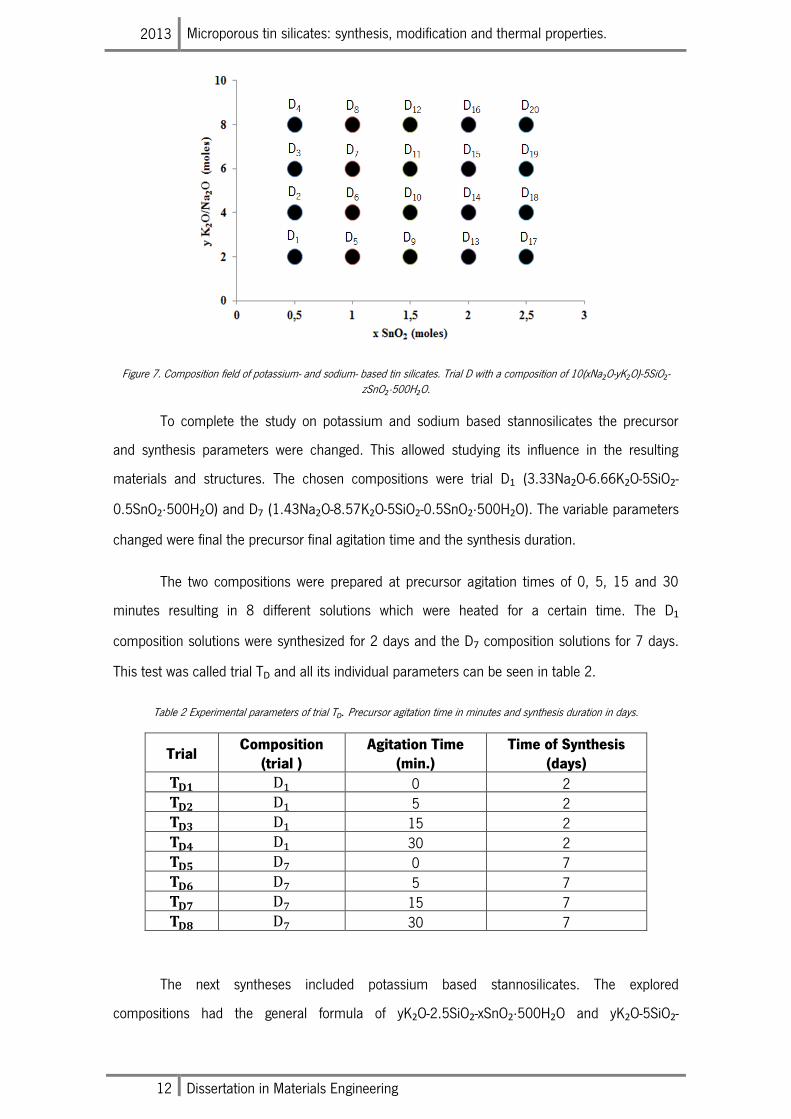
In succession to these compositions the sodium and potassium based stannosilicates
were studied. The general synthesis used composition was 10(xNa2O-yK2O)-5SiO2-zSnO2∙500H2O
called trial D. This trial focused on the effects of both sodium and potassium as negative charged
compensators on microporous tin silicates.
To perform these compositions the standard precursor preparation parameters of figure
4 were used. In this formula the silicon and water values remained constant and tin, sodium and
potassium followed the values given by figure 7. Tin content changed from 0.5 to 2.5 moles (as
in trial C) and the ratio between potassium and sodium from 2 to 8 with a total weight of 10
moles in all trials. The trial D was composed of 20 different compositions where sodium and
potassium were always present. After precursor preparation the solutions were placed in
autoclaves and heated at 200ºC during 2 days.
2013 Microporous tin silicates: synthesis, modification and thermal properties.
12 Dissertation in Materials Engineering
Figure 7. Composition field of potassium- and sodium- based tin silicates. Trial D with a composition of 10(xNa2O-yK2O)-5SiO2-zSnO2∙500H2O.
To complete the study on potassium and sodium based stannosilicates the precursor
and synthesis parameters were changed. This allowed studying its influence in the resulting
materials and structures. The chosen compositions were trial D1 (3.33Na2O-6.66K2O-5SiO2-
0.5SnO2∙500H2O) and D7 (1.43Na2O-8.57K2O-5SiO2-0.5SnO2∙500H2O). The variable parameters
changed were final the precursor final agitation time and the synthesis duration.
The two compositions were prepared at precursor agitation times of 0, 5, 15 and 30
minutes resulting in 8 different solutions which were heated for a certain time. The D1
composition solutions were synthesized for 2 days and the D7 composition solutions for 7 days.
This test was called trial TD and all its individual parameters can be seen in table 2.
Table 2 Experimental parameters of trial TD. Precursor agitation time in minutes and synthesis duration in days.
Trial Composition
(trial ) Agitation Time
(min.) Time of Synthesis
(days) 0 2 5 2 15 2 30 2 0 7 5 7 15 7 30 7
The next syntheses included potassium based stannosilicates. The explored
compositions had the general formula of yK2O-2.5SiO2-xSnO2∙500H2O and yK2O-5SiO2-
Microporous tin silicates: synthesis, modification and thermal properties. 2013
Dissertation in Materials Engineering 13
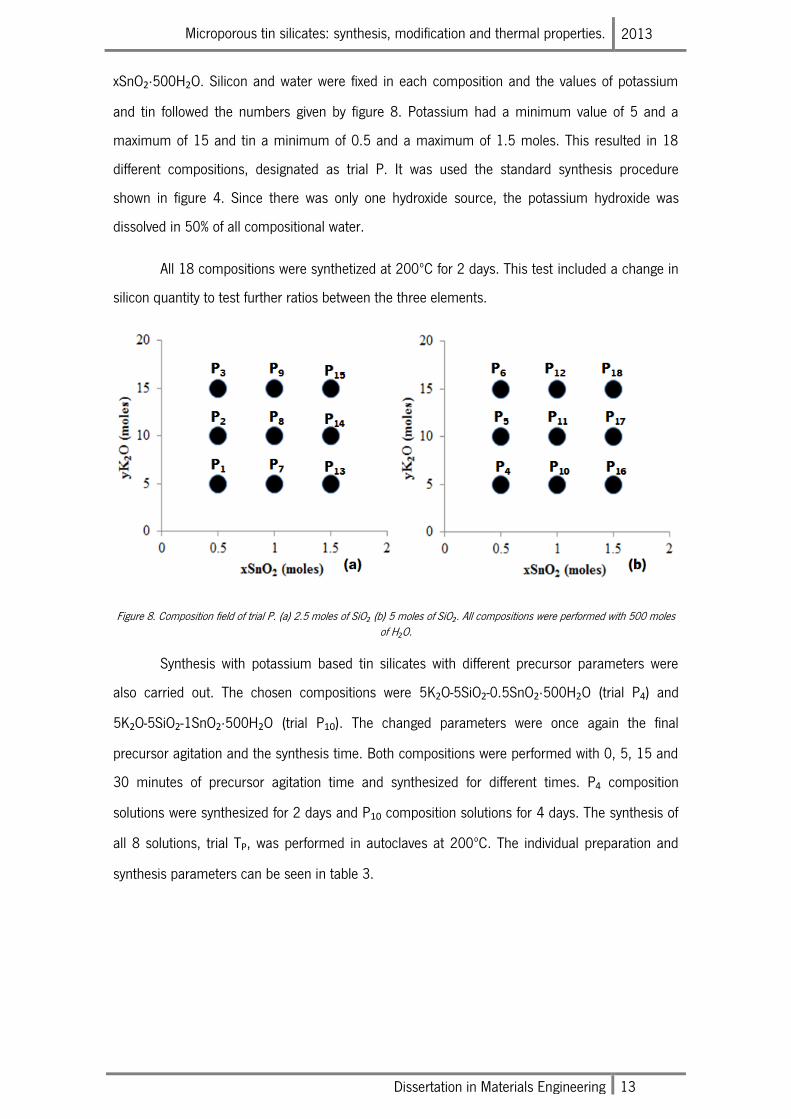
xSnO2∙500H2O. Silicon and water were fixed in each composition and the values of potassium
and tin followed the numbers given by figure 8. Potassium had a minimum value of 5 and a
maximum of 15 and tin a minimum of 0.5 and a maximum of 1.5 moles. This resulted in 18
different compositions, designated as trial P. It was used the standard synthesis procedure
shown in figure 4. Since there was only one hydroxide source, the potassium hydroxide was
dissolved in 50% of all compositional water.
All 18 compositions were synthetized at 200ºC for 2 days. This test included a change in
silicon quantity to test further ratios between the three elements.
Figure 8. Composition field of trial P. (a) 2.5 moles of SiO2 (b) 5 moles of SiO2. All compositions were performed with 500 moles of H2O.
Synthesis with potassium based tin silicates with different precursor parameters were
also carried out. The chosen compositions were 5K2O-5SiO2-0.5SnO2∙500H2O (trial P4) and
5K2O-5SiO2-1SnO2∙500H2O (trial P10). The changed parameters were once again the final
precursor agitation and the synthesis time. Both compositions were performed with 0, 5, 15 and
30 minutes of precursor agitation time and synthesized for different times. P4 composition
solutions were synthesized for 2 days and P10 composition solutions for 4 days. The synthesis of
all 8 solutions, trial TP, was performed in autoclaves at 200ºC. The individual preparation and
synthesis parameters can be seen in table 3.
2013 Microporous tin silicates: synthesis, modification and thermal properties.
14 Dissertation in Materials Engineering
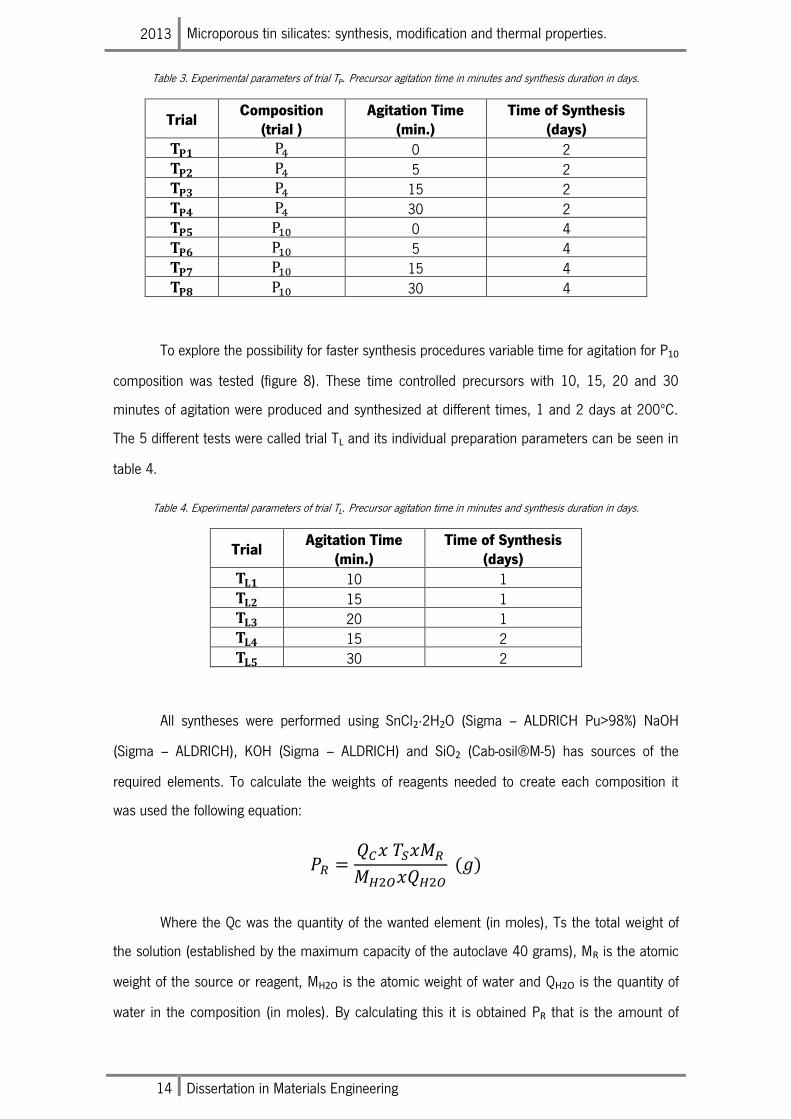
Table 3. Experimental parameters of trial TP. Precursor agitation time in minutes and synthesis duration in days.
Trial Composition
(trial ) Agitation Time
(min.) Time of Synthesis
(days) 0 2 5 2 15 2 30 2 0 4 5 4 15 4 30 4
To explore the possibility for faster synthesis procedures variable time for agitation for P10
composition was tested (figure 8). These time controlled precursors with 10, 15, 20 and 30
minutes of agitation were produced and synthesized at different times, 1 and 2 days at 200ºC.
The 5 different tests were called trial TL and its individual preparation parameters can be seen in
table 4.
Table 4. Experimental parameters of trial TL. Precursor agitation time in minutes and synthesis duration in days.
Trial Agitation Time
(min.) Time of Synthesis
(days) 10 1 15 1 20 1 15 2 30 2
All syntheses were performed using SnCl2∙2H2O (Sigma – ALDRICH Pu>98%) NaOH
(Sigma – ALDRICH), KOH (Sigma – ALDRICH) and SiO2 (Cab-osil®M-5) has sources of the
required elements. To calculate the weights of reagents needed to create each composition it
was used the following equation:
Where the Qc was the quantity of the wanted element (in moles), Ts the total weight of
the solution (established by the maximum capacity of the autoclave 40 grams), MR is the atomic
weight of the source or reagent, MH2O is the atomic weight of water and QH2O is the quantity of
water in the composition (in moles). By calculating this it is obtained PR that is the amount of
Microporous tin silicates: synthesis, modification and thermal properties. 2013
Dissertation in Materials Engineering 15
source needed to execute each composition. For future consult all calculated compositions can
be seen in APENDIX 1.
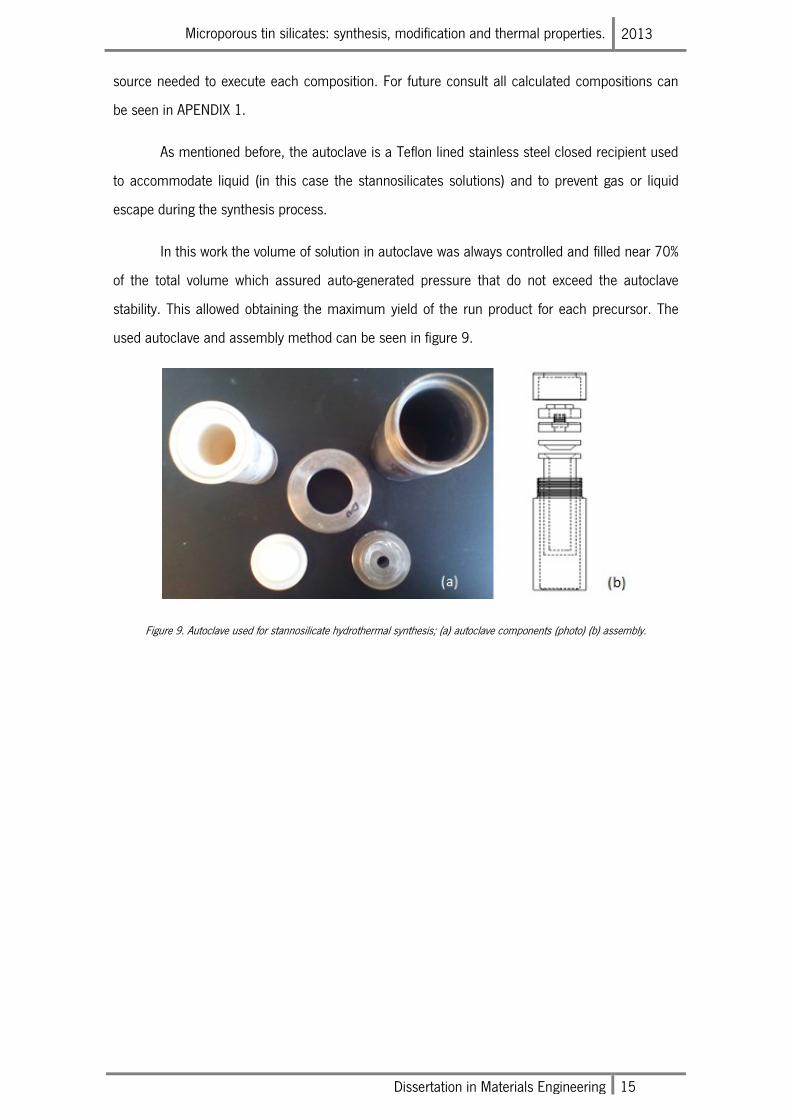
As mentioned before, the autoclave is a Teflon lined stainless steel closed recipient used
to accommodate liquid (in this case the stannosilicates solutions) and to prevent gas or liquid
escape during the synthesis process.
In this work the volume of solution in autoclave was always controlled and filled near 70%
of the total volume which assured auto-generated pressure that do not exceed the autoclave
stability. This allowed obtaining the maximum yield of the run product for each precursor. The
used autoclave and assembly method can be seen in figure 9.
Figure 9. Autoclave used for stannosilicate hydrothermal synthesis; (a) autoclave components (photo) (b) assembly.
2013 Microporous tin silicates: synthesis, modification and thermal properties.
16 Dissertation in Materials Engineering
6.2 Ion Exchange
The framework of microporous materials is the rigid part of crystal structure that
accommodates water molecules and charge compensating cations. These positive charged ions
have high mobility and can be replaced by similar ions if the size and coordination allow it [32].
Cation charge can also influence the success of exchange. According to recent studies, if two
similar cations have different charge the higher charged cation has higher affinity to the
microporous structure [33]. Like any other diffusion process, ion exchange also is improved by
the increase of time and temperature. The increase in temperature allows the pores to expand
and its occupant and outside cations to vibrate more intensely. This increases the penetration of
the external ions and the possibilities of exchange. The time of exchange increases the amount of
collisions between cations increasing therefore number of exchanges even in low success rate
environments. Time and temperature increase have associated problems. Time of exposure in
liquid solutions increases the effects of material dissolution due to aggressive pH. Temperature
increase can cause thermal degradation. For all that it is indispensable to fully understand the
porous structure and its initial occupancy to be able to manipulate and modify its pore contents
by ion exchange.
Because of the required about its structures and the necessity of a continuous perfect
production the only to stannosilicates ready for ion exchange were AV-6 and AV-7. These two
frameworks have pores occupied by potassium, on AV-6, and by sodium and potassium, on AV-7,
and the goal was to fully or partly exchange it for equal and different charge cations. For that the
microporous material was placed in liquid solutions containing the exchange cations. These
solutions had concentrations with the standard value of 1 Mole. However, due to the low
solubility of some cations sources this value was sometimes changed. The amount of
stannosilicate used in each exchange was fixed at 0.1 grams. The individual parameters of all the
exchanges performed are listed in table 5, where the temperature, time, solution concentration
and source of cation can be seen.
Microporous tin silicates: synthesis, modification and thermal properties. 2013
Dissertation in Materials Engineering 17
Table 5. Ion exchanges performed on AV-6 and AV-7. Time, temperature solution concentration and type of source. * Sigma ALDRICH ** FLUKA.
CuCl2* (1 M) ZnCl2** (1 M) CrN3O9∙9H2O* (1 M)
Phase Time →
18 h 24 h 48 h 72 h 18 h 24 h 48 h 72 h 18 h 24 h 48 h 72 h
AV-6 50ºC
80ºC
X X X
X
X
Av-7 50ºC 80ºC
X X
X
X X X
SrCl2* (1 M) PbCl2* (0.01 M) AlCl3** (1 M)
Phase Time →
18 h 24 h 48 h 72 h 18 h 24 h 48 h 72 h 18 h 24 h 48 h 72 h
AV-6 50ºC
X
X
80ºC
X
Av-7 50ºC
X
X
80ºC
X
X
X
CsCl* (0.5 M) FeCl3* (1 M) NaCl* (1 M)
Phase Time →
72 h 24 h 48 h 72 h 18 h 24 h 48 h 72 h 18 h 24 h 48 h 72 h
AV-6 50ºC
80ºC X X X
Av-7 50ºC
80ºC X X X
For long ion exchange times (over 24 hours) evaporation may change the cations
concentration. Therefore more solution was added in 24 hours periods to balance and control
cation quantities. To improve the changes of exchange and to increase the materials ability to
form suspensions, all stannosilicate samples were milled into a very fine powder. The ion
exchanges were performed in glass bowls with adapted cover to reduce evaporation. The
recipients were placed in a BINDER oven with digital temperature control with a maximum
deviation of 1ºC. After exchange all products were washed, filtered and dried at room
temperature.
The success of ion exchange was evaluated by XRD where the changes in the crystalline
material were detected. The confirmation of the cation capture came from EDS.
2013 Microporous tin silicates: synthesis, modification and thermal properties.
18 Dissertation in Materials Engineering
6.3 Isomorphous substitution
The doping and partial substitution of structural elements is a common procedure in
ceramic materials. This doping needs to be in very small amounts in order to preserve the
structure of the original material. In silicates there is another process of doping that does not
suffer from that problem. Silicates frameworks can fully substitute the octahedral or tetrahedral
element without significant structural changes. This is proven by the amounts of mineral
analogues produced in laboratory. The substitution is theoretically possible to all elements that
possess the same oxide formations [34]. In stannosilicates the substitution can occur in the
octahedral tin and in the tetrahedral silicon atom, each of the elements can be replaced by other
metals with the same coordination and similar size. On the contrary to ion exchange the
isomorphous substitution is realized during the process of crystallization. When an isomorphous
substitution is tried the goal is to use a precursor composition of a determinate structure and
infuse it with different elements. This changes the materials properties and pores dimensions
without changing the crystal system or the framework type. However, each element has its own
chemical and physical behavior and its introduction to the precursor, even in small amounts, can
create new reactions that lead to new types of frameworks. The more similar the elements are,
chemically, in size, coordination and valance the higher are chances of creating a single phase
mixed material.
To perform the isomorphous substitution, this work used the precursor preparation
parameters referred in figure 4 with a single modification. The incorporation of tin chloride was
done in parallel with the incorporation of the substitution element. The compositions had a
gradual increase in the amount of tin substitute. The synthesis parameters were equal to the
ones used in the synthesis chapter, 200ºC for 2 days. This also served to compare the influence
of a new element in the synthesis success and quality. Maintaining the synthesis parameters
equal allowed a direct comparison and a better prediction of the resulting structures. The
structures obtained during the synthesis trials were again synthesized with substitution elements.
The compositions used here were the ones perfected in the synthesis trials. The isomorphous
substitutions performed can be seen in table 6 where it is shown the element of substitution, its
percentage in relation with tin, the modified composition, its original trial and the precursor
preparation and synthesis parameters. The first substitutions were performed with zirconium and
titanium. The percentage substituted was 20% and 40% of Zr and 20%, 40% and 60% of Ti. The
60% isomorphous substitutions dictated that more titanium than tin was available for framework
construction.
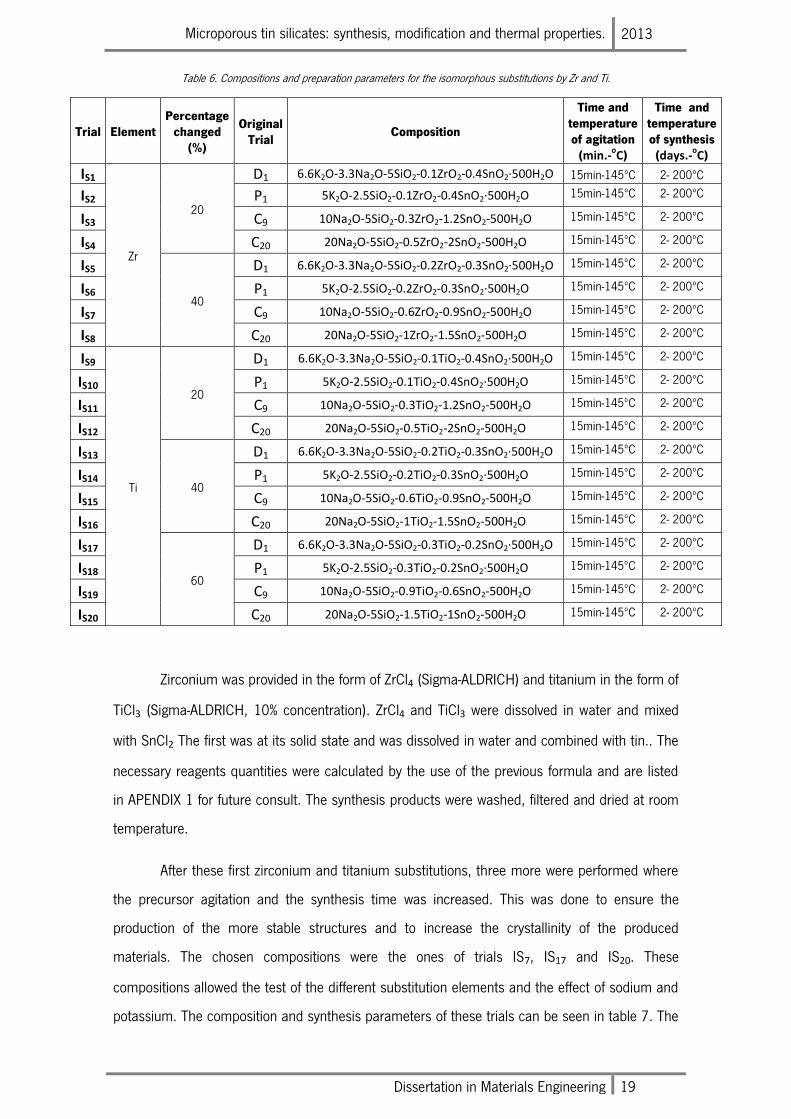
Microporous tin silicates: synthesis, modification and thermal properties. 2013
Dissertation in Materials Engineering 19
Table 6. Compositions and preparation parameters for the isomorphous substitutions by Zr and Ti.
Trial Element Percentage
changed (%)
Original Trial
Composition
Time and temperature of agitation
(min.-oC)
Time and temperature of synthesis (days.-
oC)
IS1
Zr
20
D1 6.6K2O-3.3Na2O-5SiO2-0.1ZrO2-0.4SnO2∙500H2O 15min-145ºC 2- 200ºC
IS2 P1 5K2O-2.5SiO2-0.1ZrO2-0.4SnO2∙500H2O 15min-145ºC 2- 200ºC
IS3 C9 10Na2O-5SiO2-0.3ZrO2-1.2SnO2-500H2O 15min-145ºC 2- 200ºC
IS4 C20 20Na2O-5SiO2-0.5ZrO2-2SnO2-500H2O 15min-145ºC 2- 200ºC
IS5
40
D1 6.6K2O-3.3Na2O-5SiO2-0.2ZrO2-0.3SnO2∙500H2O 15min-145ºC 2- 200ºC
IS6 P1 5K2O-2.5SiO2-0.2ZrO2-0.3SnO2∙500H2O 15min-145ºC 2- 200ºC
IS7 C9 10Na2O-5SiO2-0.6ZrO2-0.9SnO2-500H2O 15min-145ºC 2- 200ºC
IS8 C20 20Na2O-5SiO2-1ZrO2-1.5SnO2-500H2O 15min-145ºC 2- 200ºC
IS9
Ti
20
D1 6.6K2O-3.3Na2O-5SiO2-0.1TiO2-0.4SnO2∙500H2O 15min-145ºC 2- 200ºC
IS10 P1 5K2O-2.5SiO2-0.1TiO2-0.4SnO2∙500H2O 15min-145ºC 2- 200ºC
IS11 C9 10Na2O-5SiO2-0.3TiO2-1.2SnO2-500H2O 15min-145ºC 2- 200ºC
IS12 C20 20Na2O-5SiO2-0.5TiO2-2SnO2-500H2O 15min-145ºC 2- 200ºC
IS13
40
D1 6.6K2O-3.3Na2O-5SiO2-0.2TiO2-0.3SnO2∙500H2O 15min-145ºC 2- 200ºC
IS14 P1 5K2O-2.5SiO2-0.2TiO2-0.3SnO2∙500H2O 15min-145ºC 2- 200ºC
IS15 C9 10Na2O-5SiO2-0.6TiO2-0.9SnO2-500H2O 15min-145ºC 2- 200ºC
IS16 C20 20Na2O-5SiO2-1TiO2-1.5SnO2-500H2O 15min-145ºC 2- 200ºC
IS17
60
D1 6.6K2O-3.3Na2O-5SiO2-0.3TiO2-0.2SnO2∙500H2O 15min-145ºC 2- 200ºC
IS18 P1 5K2O-2.5SiO2-0.3TiO2-0.2SnO2∙500H2O 15min-145ºC 2- 200ºC
IS19 C9 10Na2O-5SiO2-0.9TiO2-0.6SnO2-500H2O 15min-145ºC 2- 200ºC
IS20 C20 20Na2O-5SiO2-1.5TiO2-1SnO2-500H2O 15min-145ºC 2- 200ºC
Zirconium was provided in the form of ZrCl4 (Sigma-ALDRICH) and titanium in the form of
TiCl3 (Sigma-ALDRICH, 10% concentration). ZrCl4 and TiCl3 were dissolved in water and mixed
with SnCl2 The first was at its solid state and was dissolved in water and combined with tin.. The
necessary reagents quantities were calculated by the use of the previous formula and are listed
in APENDIX 1 for future consult. The synthesis products were washed, filtered and dried at room
temperature.
After these first zirconium and titanium substitutions, three more were performed where
the precursor agitation and the synthesis time was increased. This was done to ensure the
production of the more stable structures and to increase the crystallinity of the produced
materials. The chosen compositions were the ones of trials IS7, IS17 and IS20. These
compositions allowed the test of the different substitution elements and the effect of sodium and
potassium. The composition and synthesis parameters of these trials can be seen in table 7. The
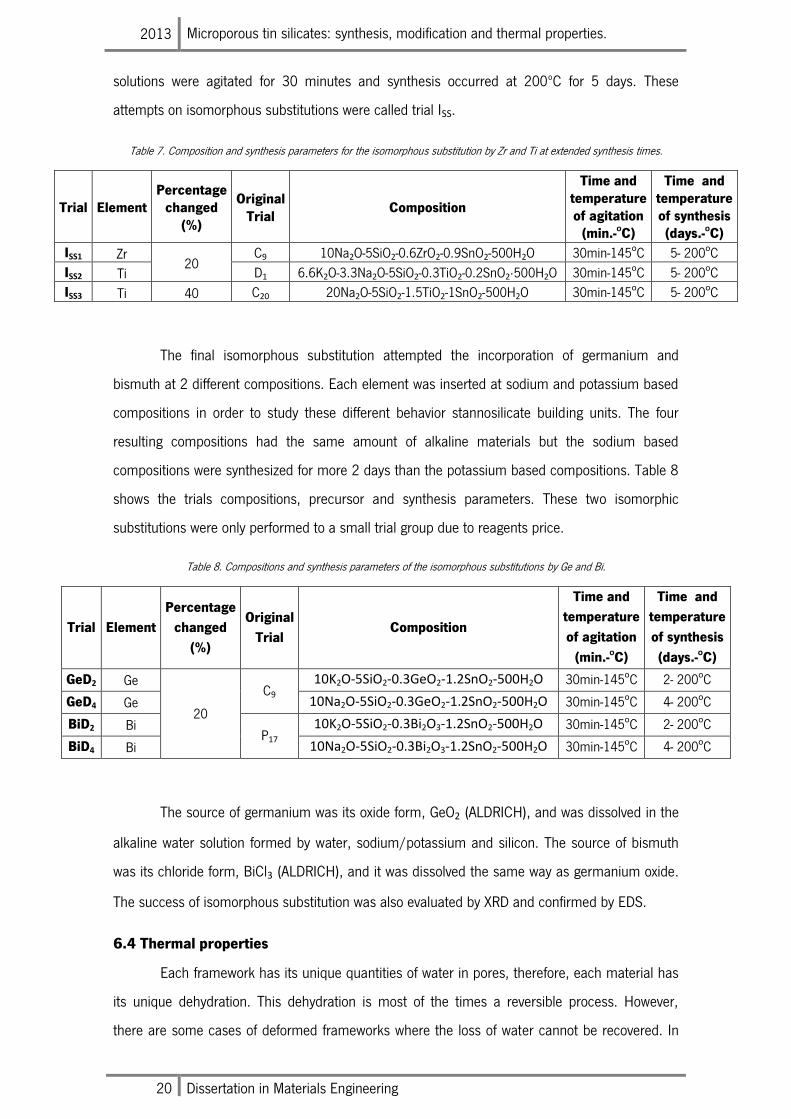
2013 Microporous tin silicates: synthesis, modification and thermal properties.
20 Dissertation in Materials Engineering
solutions were agitated for 30 minutes and synthesis occurred at 200ºC for 5 days. These
attempts on isomorphous substitutions were called trial ISS.
Table 7. Composition and synthesis parameters for the isomorphous substitution by Zr and Ti at extended synthesis times.
Trial Element Percentage
changed (%)
Original Trial
Composition
Time and temperature of agitation
(min.-oC)
Time and temperature of synthesis (days.-oC)
ISS1 Zr 20
C9 10Na2O-5SiO2-0.6ZrO2-0.9SnO2-500H2O 30min-145oC 5- 200oC
ISS2 Ti D1 6.6K2O-3.3Na2O-5SiO2-0.3TiO2-0.2SnO2∙500H2O 30min-145oC 5- 200oC
ISS3 Ti 40 C20 20Na2O-5SiO2-1.5TiO2-1SnO2-500H2O 30min-145oC 5- 200oC
The final isomorphous substitution attempted the incorporation of germanium and
bismuth at 2 different compositions. Each element was inserted at sodium and potassium based
compositions in order to study these different behavior stannosilicate building units. The four
resulting compositions had the same amount of alkaline materials but the sodium based
compositions were synthesized for more 2 days than the potassium based compositions. Table 8
shows the trials compositions, precursor and synthesis parameters. These two isomorphic
substitutions were only performed to a small trial group due to reagents price.
Table 8. Compositions and synthesis parameters of the isomorphous substitutions by Ge and Bi.
Trial Element
Percentage
changed
(%)
Original
Trial Composition
Time and
temperature
of agitation
(min.-oC)
Time and
temperature
of synthesis
(days.-oC)
GeD2 Ge
20
C9 10K2O-5SiO2-0.3GeO2-1.2SnO2-500H2O 30min-145oC 2- 200oC
GeD4 Ge 10Na2O-5SiO2-0.3GeO2-1.2SnO2-500H2O 30min-145oC 4- 200oC
BiD2 Bi P17
10K2O-5SiO2-0.3Bi2O3-1.2SnO2-500H2O 30min-145oC 2- 200oC
BiD4 Bi 10Na2O-5SiO2-0.3Bi2O3-1.2SnO2-500H2O 30min-145oC 4- 200oC
The source of germanium was its oxide form, GeO2 (ALDRICH), and was dissolved in the
alkaline water solution formed by water, sodium/potassium and silicon. The source of bismuth
was its chloride form, BiCl3 (ALDRICH), and it was dissolved the same way as germanium oxide.
The success of isomorphous substitution was also evaluated by XRD and confirmed by EDS.
6.4 Thermal properties
Each framework has its unique quantities of water in pores, therefore, each material has
its unique dehydration. This dehydration is most of the times a reversible process. However,
there are some cases of deformed frameworks where the loss of water cannot be recovered. In
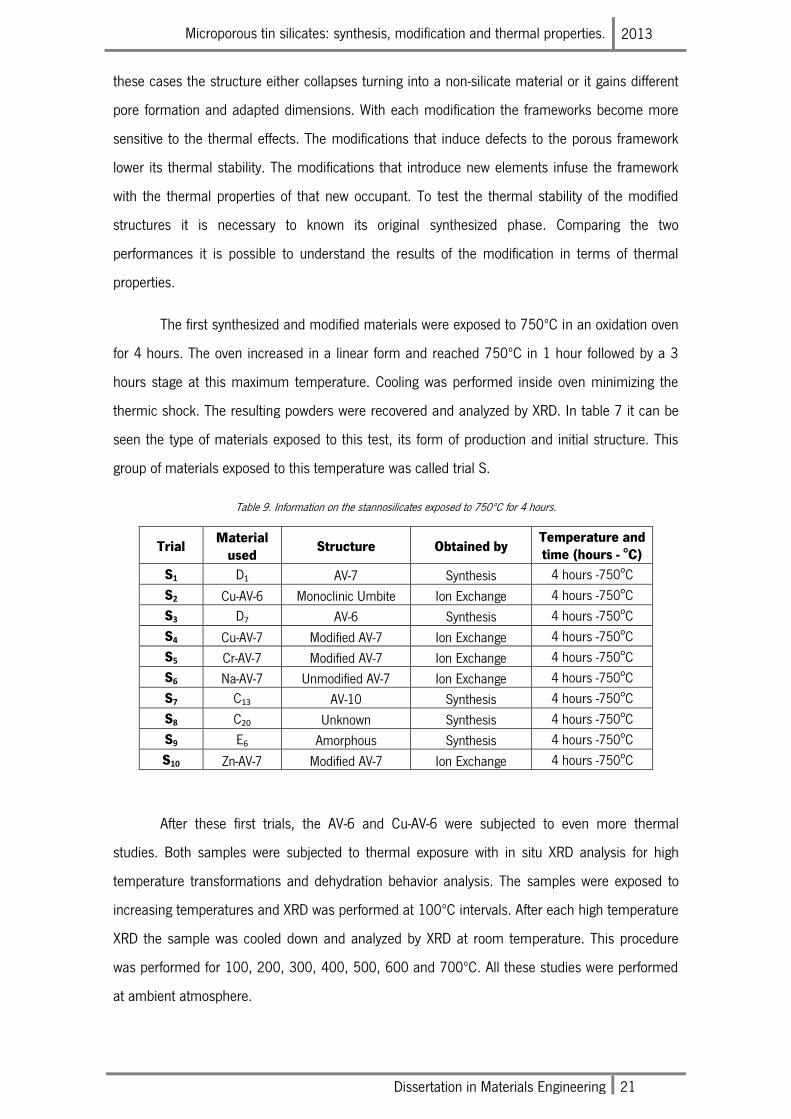
Microporous tin silicates: synthesis, modification and thermal properties. 2013
Dissertation in Materials Engineering 21
these cases the structure either collapses turning into a non-silicate material or it gains different
pore formation and adapted dimensions. With each modification the frameworks become more
sensitive to the thermal effects. The modifications that induce defects to the porous framework
lower its thermal stability. The modifications that introduce new elements infuse the framework
with the thermal properties of that new occupant. To test the thermal stability of the modified
structures it is necessary to known its original synthesized phase. Comparing the two
performances it is possible to understand the results of the modification in terms of thermal
properties.
The first synthesized and modified materials were exposed to 750ºC in an oxidation oven
for 4 hours. The oven increased in a linear form and reached 750ºC in 1 hour followed by a 3
hours stage at this maximum temperature. Cooling was performed inside oven minimizing the
thermic shock. The resulting powders were recovered and analyzed by XRD. In table 7 it can be
seen the type of materials exposed to this test, its form of production and initial structure. This
group of materials exposed to this temperature was called trial S.
Table 9. Information on the stannosilicates exposed to 750ºC for 4 hours.
Trial Material
used Structure Obtained by
Temperature and time (hours - oC)
S1 D1 AV-7 Synthesis 4 hours -750oC
S2 Cu-AV-6 Monoclinic Umbite Ion Exchange 4 hours -750oC
S3 D7 AV-6 Synthesis 4 hours -750oC
S4 Cu-AV-7 Modified AV-7 Ion Exchange 4 hours -750oC
S5 Cr-AV-7 Modified AV-7 Ion Exchange 4 hours -750oC
S6 Na-AV-7 Unmodified AV-7 Ion Exchange 4 hours -750oC
S7 C13 AV-10 Synthesis 4 hours -750oC
S8 C20 Unknown Synthesis 4 hours -750oC
S9 E6 Amorphous Synthesis 4 hours -750oC
S10 Zn-AV-7 Modified AV-7 Ion Exchange 4 hours -750oC
After these first trials, the AV-6 and Cu-AV-6 were subjected to even more thermal
studies. Both samples were subjected to thermal exposure with in situ XRD analysis for high
temperature transformations and dehydration behavior analysis. The samples were exposed to
increasing temperatures and XRD was performed at 100ºC intervals. After each high temperature
XRD the sample was cooled down and analyzed by XRD at room temperature. This procedure
was performed for 100, 200, 300, 400, 500, 600 and 700ºC. All these studies were performed
at ambient atmosphere.
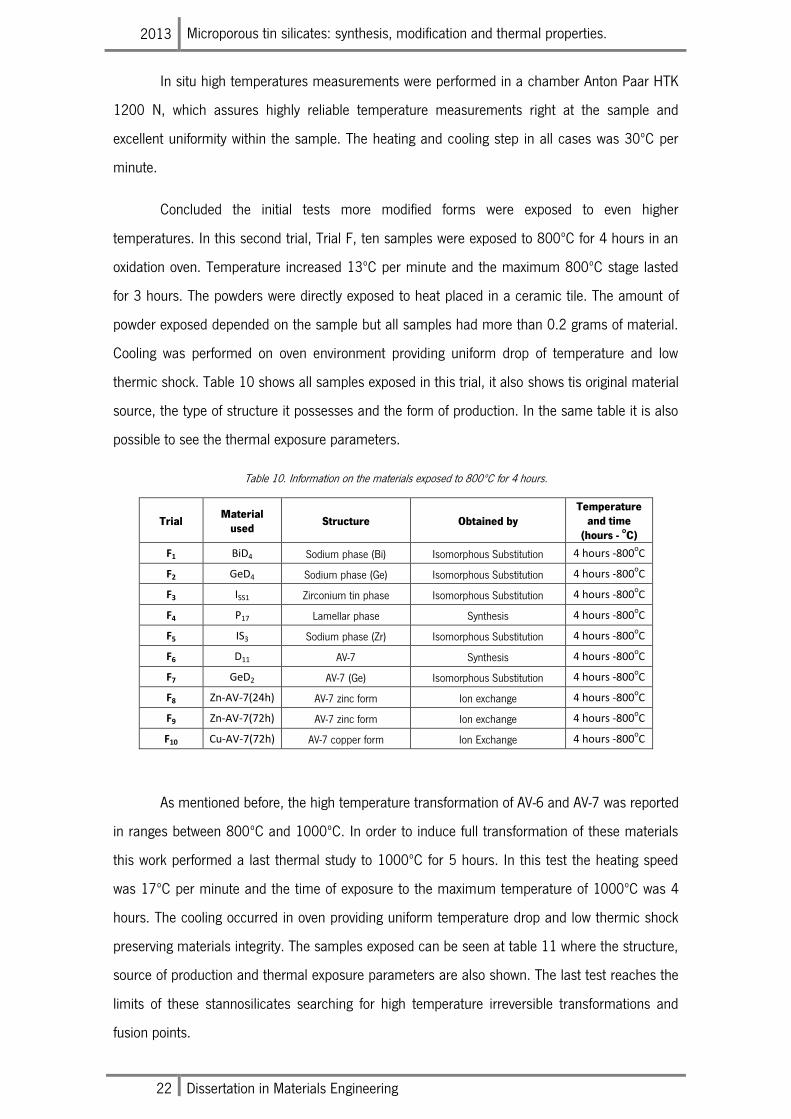
2013 Microporous tin silicates: synthesis, modification and thermal properties.
22 Dissertation in Materials Engineering
In situ high temperatures measurements were performed in a chamber Anton Paar HTK
1200 N, which assures highly reliable temperature measurements right at the sample and
excellent uniformity within the sample. The heating and cooling step in all cases was 30ºC per
minute.
Concluded the initial tests more modified forms were exposed to even higher
temperatures. In this second trial, Trial F, ten samples were exposed to 800ºC for 4 hours in an
oxidation oven. Temperature increased 13ºC per minute and the maximum 800ºC stage lasted
for 3 hours. The powders were directly exposed to heat placed in a ceramic tile. The amount of
powder exposed depended on the sample but all samples had more than 0.2 grams of material.
Cooling was performed on oven environment providing uniform drop of temperature and low
thermic shock. Table 10 shows all samples exposed in this trial, it also shows tis original material
source, the type of structure it possesses and the form of production. In the same table it is also
possible to see the thermal exposure parameters.
Table 10. Information on the materials exposed to 800ºC for 4 hours.
Trial Material
used Structure Obtained by
Temperature and time
(hours - oC)
F1 BiD4 Sodium phase (Bi) Isomorphous Substitution 4 hours -800oC
F2 GeD4 Sodium phase (Ge) Isomorphous Substitution 4 hours -800oC
F3 ISS1 Zirconium tin phase Isomorphous Substitution 4 hours -800oC
F4 P17 Lamellar phase Synthesis 4 hours -800oC
F5 IS3 Sodium phase (Zr) Isomorphous Substitution 4 hours -800oC
F6 D11 AV-7 Synthesis 4 hours -800oC
F7 GeD2 AV-7 (Ge) Isomorphous Substitution 4 hours -800oC
F8 Zn-AV-7(24h) AV-7 zinc form Ion exchange 4 hours -800oC
F9 Zn-AV-7(72h) AV-7 zinc form Ion exchange 4 hours -800oC
F10 Cu-AV-7(72h) AV-7 copper form Ion Exchange 4 hours -800oC
As mentioned before, the high temperature transformation of AV-6 and AV-7 was reported
in ranges between 800ºC and 1000ºC. In order to induce full transformation of these materials
this work performed a last thermal study to 1000ºC for 5 hours. In this test the heating speed
was 17ºC per minute and the time of exposure to the maximum temperature of 1000ºC was 4
hours. The cooling occurred in oven providing uniform temperature drop and low thermic shock
preserving materials integrity. The samples exposed can be seen at table 11 where the structure,
source of production and thermal exposure parameters are also shown. The last test reaches the
limits of these stannosilicates searching for high temperature irreversible transformations and
fusion points.
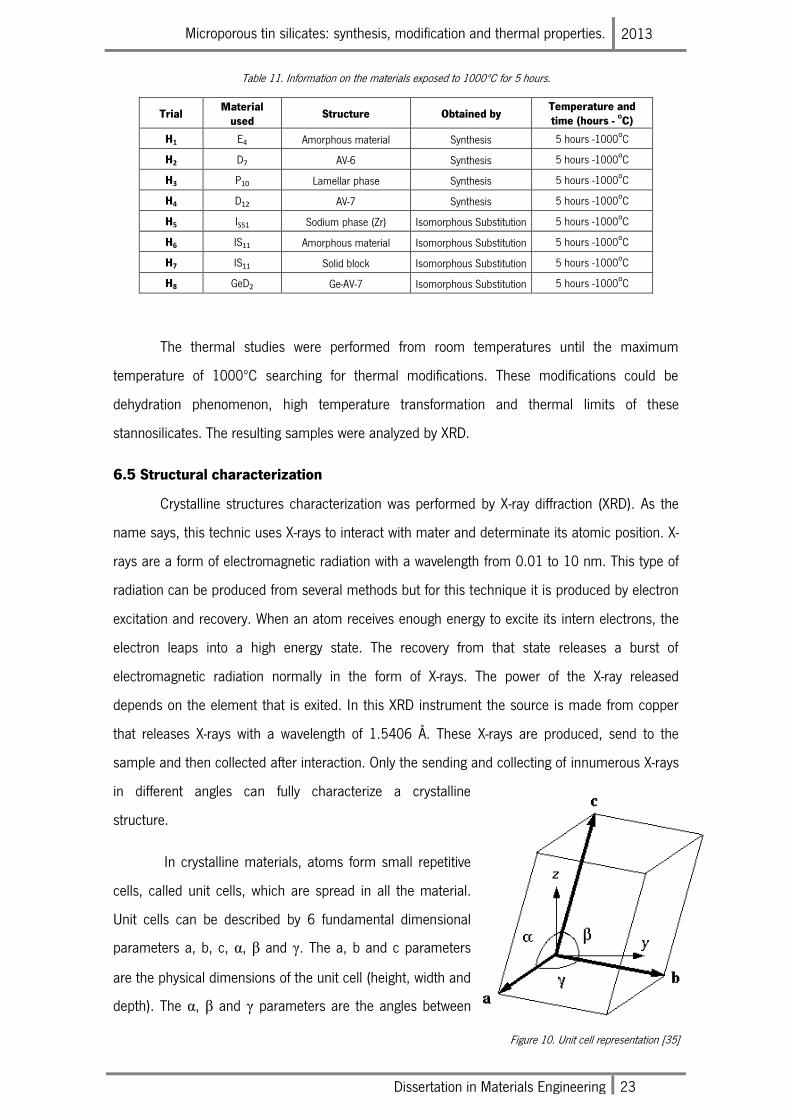
Microporous tin silicates: synthesis, modification and thermal properties. 2013
Dissertation in Materials Engineering 23
Table 11. Information on the materials exposed to 1000ºC for 5 hours.
Trial Material
used Structure Obtained by
Temperature and time (hours -
oC)
H1 E4 Amorphous material Synthesis 5 hours -1000oC
H2 D7 AV-6 Synthesis 5 hours -1000oC
H3 P10 Lamellar phase Synthesis 5 hours -1000oC
H4 D12 AV-7 Synthesis 5 hours -1000oC
H5 ISS1 Sodium phase (Zr) Isomorphous Substitution 5 hours -1000oC
H6 IS11 Amorphous material Isomorphous Substitution 5 hours -1000oC
H7 IS11 Solid block Isomorphous Substitution 5 hours -1000oC
H8 GeD2 Ge-AV-7 Isomorphous Substitution 5 hours -1000oC
The thermal studies were performed from room temperatures until the maximum
temperature of 1000ºC searching for thermal modifications. These modifications could be
dehydration phenomenon, high temperature transformation and thermal limits of these
stannosilicates. The resulting samples were analyzed by XRD.
6.5 Structural characterization
Crystalline structures characterization was performed by X-ray diffraction (XRD). As the
name says, this technic uses X-rays to interact with mater and determinate its atomic position. X-
rays are a form of electromagnetic radiation with a wavelength from 0.01 to 10 nm. This type of
radiation can be produced from several methods but for this technique it is produced by electron
excitation and recovery. When an atom receives enough energy to excite its intern electrons, the
electron leaps into a high energy state. The recovery from that state releases a burst of
electromagnetic radiation normally in the form of X-rays. The power of the X-ray released
depends on the element that is exited. In this XRD instrument the source is made from copper
that releases X-rays with a wavelength of 1.5406 Å. These X-rays are produced, send to the
sample and then collected after interaction. Only the sending and collecting of innumerous X-rays
in different angles can fully characterize a crystalline
structure.
In crystalline materials, atoms form small repetitive
cells, called unit cells, which are spread in all the material.
Unit cells can be described by 6 fundamental dimensional
parameters a, b, c, α, β and γ. The a, b and c parameters
are the physical dimensions of the unit cell (height, width and
depth). The α, β and γ parameters are the angles between
Figure 10. Unit cell representation [35]
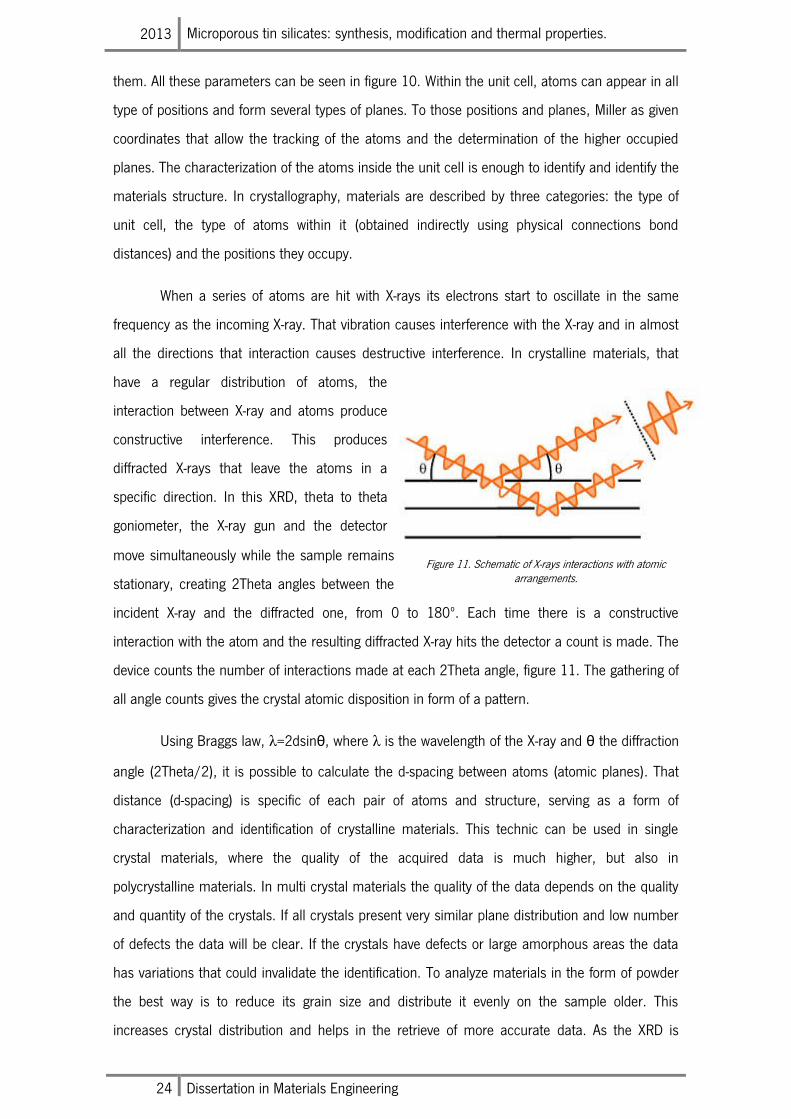
2013 Microporous tin silicates: synthesis, modification and thermal properties.
24 Dissertation in Materials Engineering
them. All these parameters can be seen in figure 10. Within the unit cell, atoms can appear in all
type of positions and form several types of planes. To those positions and planes, Miller as given
coordinates that allow the tracking of the atoms and the determination of the higher occupied
planes. The characterization of the atoms inside the unit cell is enough to identify and identify the
materials structure. In crystallography, materials are described by three categories: the type of
unit cell, the type of atoms within it (obtained indirectly using physical connections bond
distances) and the positions they occupy.
When a series of atoms are hit with X-rays its electrons start to oscillate in the same
frequency as the incoming X-ray. That vibration causes interference with the X-ray and in almost
all the directions that interaction causes destructive interference. In crystalline materials, that
have a regular distribution of atoms, the
interaction between X-ray and atoms produce
constructive interference. This produces
diffracted X-rays that leave the atoms in a
specific direction. In this XRD, theta to theta
goniometer, the X-ray gun and the detector
move simultaneously while the sample remains
stationary, creating 2Theta angles between the
incident X-ray and the diffracted one, from 0 to 180º. Each time there is a constructive
interaction with the atom and the resulting diffracted X-ray hits the detector a count is made. The
device counts the number of interactions made at each 2Theta angle, figure 11. The gathering of
all angle counts gives the crystal atomic disposition in form of a pattern.
Using Braggs law, λ=2dsinθ, where λ is the wavelength of the X-ray and θ the diffraction
angle (2Theta/2), it is possible to calculate the d-spacing between atoms (atomic planes). That
distance (d-spacing) is specific of each pair of atoms and structure, serving as a form of
characterization and identification of crystalline materials. This technic can be used in single
crystal materials, where the quality of the acquired data is much higher, but also in
polycrystalline materials. In multi crystal materials the quality of the data depends on the quality
and quantity of the crystals. If all crystals present very similar plane distribution and low number
of defects the data will be clear. If the crystals have defects or large amorphous areas the data
has variations that could invalidate the identification. To analyze materials in the form of powder
the best way is to reduce its grain size and distribute it evenly on the sample older. This
increases crystal distribution and helps in the retrieve of more accurate data. As the XRD is
Figure 11. Schematic of X-rays interactions with atomic arrangements.
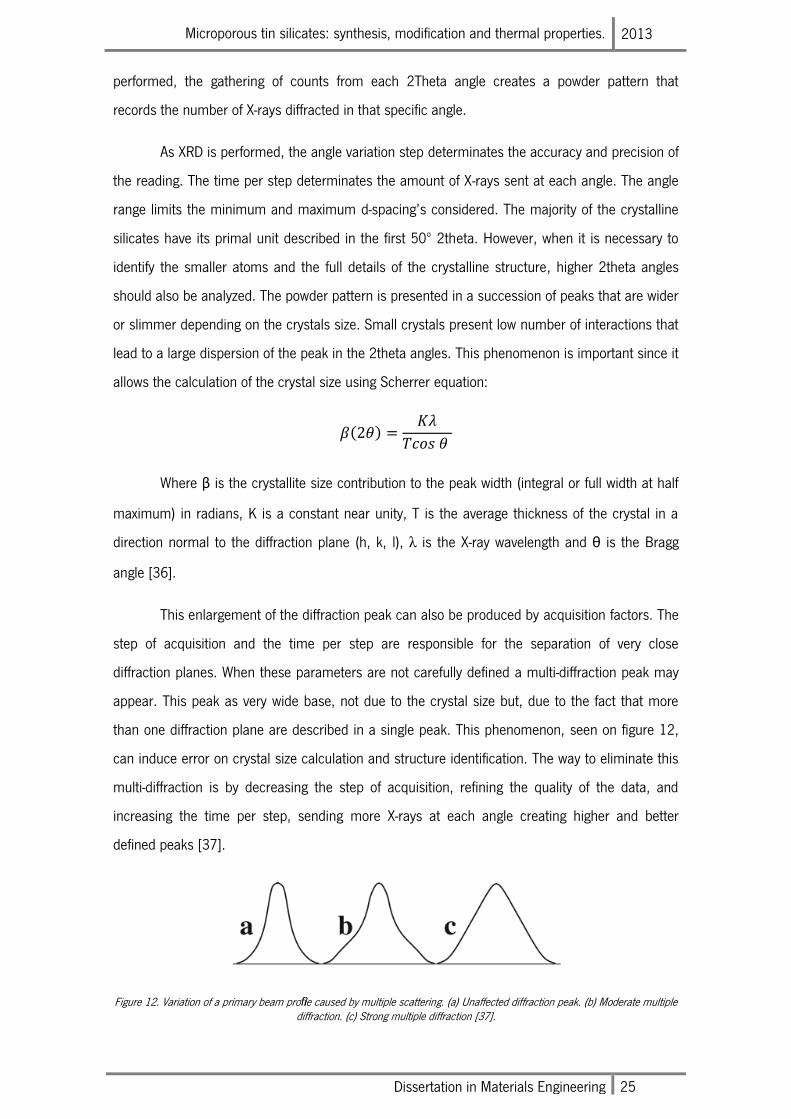
Microporous tin silicates: synthesis, modification and thermal properties. 2013
Dissertation in Materials Engineering 25
performed, the gathering of counts from each 2Theta angle creates a powder pattern that
records the number of X-rays diffracted in that specific angle.
As XRD is performed, the angle variation step determinates the accuracy and precision of
the reading. The time per step determinates the amount of X-rays sent at each angle. The angle
range limits the minimum and maximum d-spacing’s considered. The majority of the crystalline
silicates have its primal unit described in the first 50º 2theta. However, when it is necessary to
identify the smaller atoms and the full details of the crystalline structure, higher 2theta angles
should also be analyzed. The powder pattern is presented in a succession of peaks that are wider
or slimmer depending on the crystals size. Small crystals present low number of interactions that
lead to a large dispersion of the peak in the 2theta angles. This phenomenon is important since it
allows the calculation of the crystal size using Scherrer equation:
Where β is the crystallite size contribution to the peak width (integral or full width at half
maximum) in radians, K is a constant near unity, T is the average thickness of the crystal in a
direction normal to the diffraction plane (h, k, l), λ is the X-ray wavelength and θ is the Bragg
angle [36].
This enlargement of the diffraction peak can also be produced by acquisition factors. The
step of acquisition and the time per step are responsible for the separation of very close
diffraction planes. When these parameters are not carefully defined a multi-diffraction peak may
appear. This peak as very wide base, not due to the crystal size but, due to the fact that more
than one diffraction plane are described in a single peak. This phenomenon, seen on figure 12,
can induce error on crystal size calculation and structure identification. The way to eliminate this
multi-diffraction is by decreasing the step of acquisition, refining the quality of the data, and
increasing the time per step, sending more X-rays at each angle creating higher and better
defined peaks [37].
Figure 12. Variation of a primary beam profile caused by multiple scattering. (a) Unaffected diffraction peak. (b) Moderate multiple diffraction. (c) Strong multiple diffraction [37].
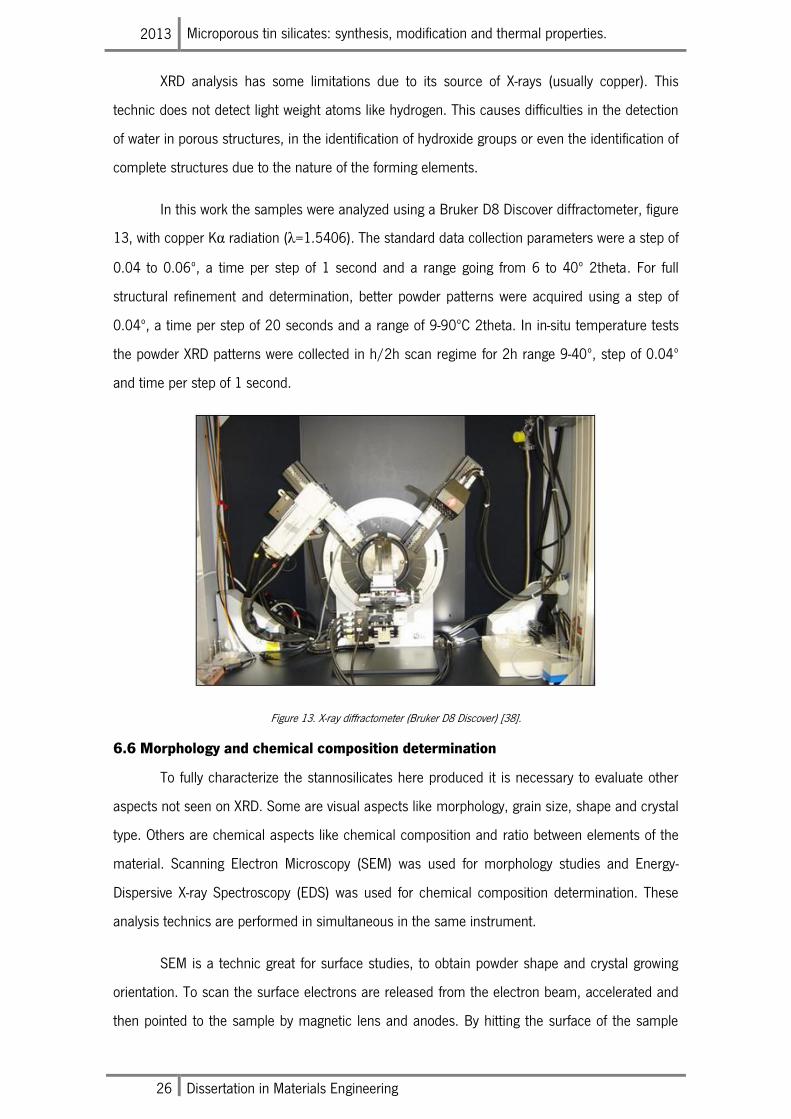
2013 Microporous tin silicates: synthesis, modification and thermal properties.
26 Dissertation in Materials Engineering
XRD analysis has some limitations due to its source of X-rays (usually copper). This
technic does not detect light weight atoms like hydrogen. This causes difficulties in the detection
of water in porous structures, in the identification of hydroxide groups or even the identification of
complete structures due to the nature of the forming elements.
In this work the samples were analyzed using a Bruker D8 Discover diffractometer, figure
13, with copper Kα radiation (λ=1.5406). The standard data collection parameters were a step of
0.04 to 0.06º, a time per step of 1 second and a range going from 6 to 40º 2theta. For full
structural refinement and determination, better powder patterns were acquired using a step of
0.04º, a time per step of 20 seconds and a range of 9-90ºC 2theta. In in-situ temperature tests
the powder XRD patterns were collected in h/2h scan regime for 2h range 9-40º, step of 0.04º
and time per step of 1 second.
Figure 13. X-ray diffractometer (Bruker D8 Discover) [38].
6.6 Morphology and chemical composition determination
To fully characterize the stannosilicates here produced it is necessary to evaluate other
aspects not seen on XRD. Some are visual aspects like morphology, grain size, shape and crystal
type. Others are chemical aspects like chemical composition and ratio between elements of the
material. Scanning Electron Microscopy (SEM) was used for morphology studies and Energy-
Dispersive X-ray Spectroscopy (EDS) was used for chemical composition determination. These
analysis technics are performed in simultaneous in the same instrument.
SEM is a technic great for surface studies, to obtain powder shape and crystal growing
orientation. To scan the surface electrons are released from the electron beam, accelerated and
then pointed to the sample by magnetic lens and anodes. By hitting the surface of the sample
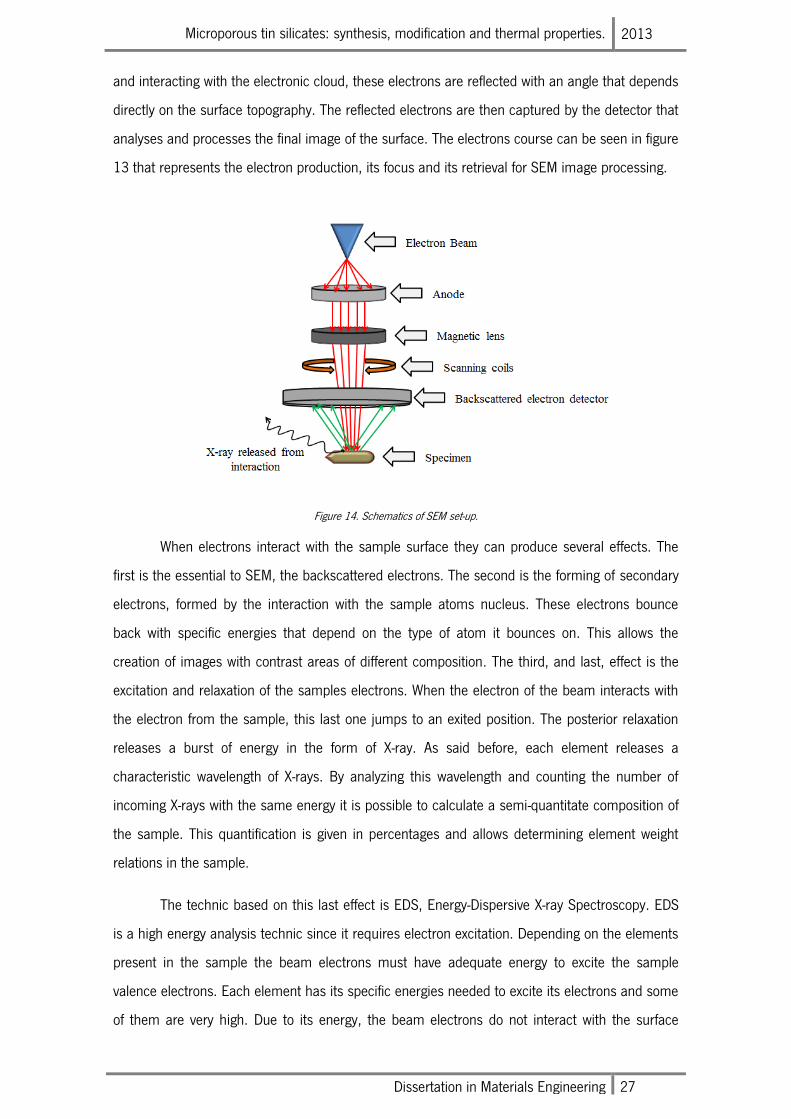
Microporous tin silicates: synthesis, modification and thermal properties. 2013
Dissertation in Materials Engineering 27
and interacting with the electronic cloud, these electrons are reflected with an angle that depends
directly on the surface topography. The reflected electrons are then captured by the detector that
analyses and processes the final image of the surface. The electrons course can be seen in figure
13 that represents the electron production, its focus and its retrieval for SEM image processing.
Figure 14. Schematics of SEM set-up.
When electrons interact with the sample surface they can produce several effects. The
first is the essential to SEM, the backscattered electrons. The second is the forming of secondary
electrons, formed by the interaction with the sample atoms nucleus. These electrons bounce
back with specific energies that depend on the type of atom it bounces on. This allows the
creation of images with contrast areas of different composition. The third, and last, effect is the
excitation and relaxation of the samples electrons. When the electron of the beam interacts with
the electron from the sample, this last one jumps to an exited position. The posterior relaxation
releases a burst of energy in the form of X-ray. As said before, each element releases a
characteristic wavelength of X-rays. By analyzing this wavelength and counting the number of
incoming X-rays with the same energy it is possible to calculate a semi-quantitate composition of
the sample. This quantification is given in percentages and allows determining element weight
relations in the sample.
The technic based on this last effect is EDS, Energy-Dispersive X-ray Spectroscopy. EDS
is a high energy analysis technic since it requires electron excitation. Depending on the elements
present in the sample the beam electrons must have adequate energy to excite the sample
valence electrons. Each element has its specific energies needed to excite its electrons and some
of them are very high. Due to its energy, the beam electrons do not interact with the surface
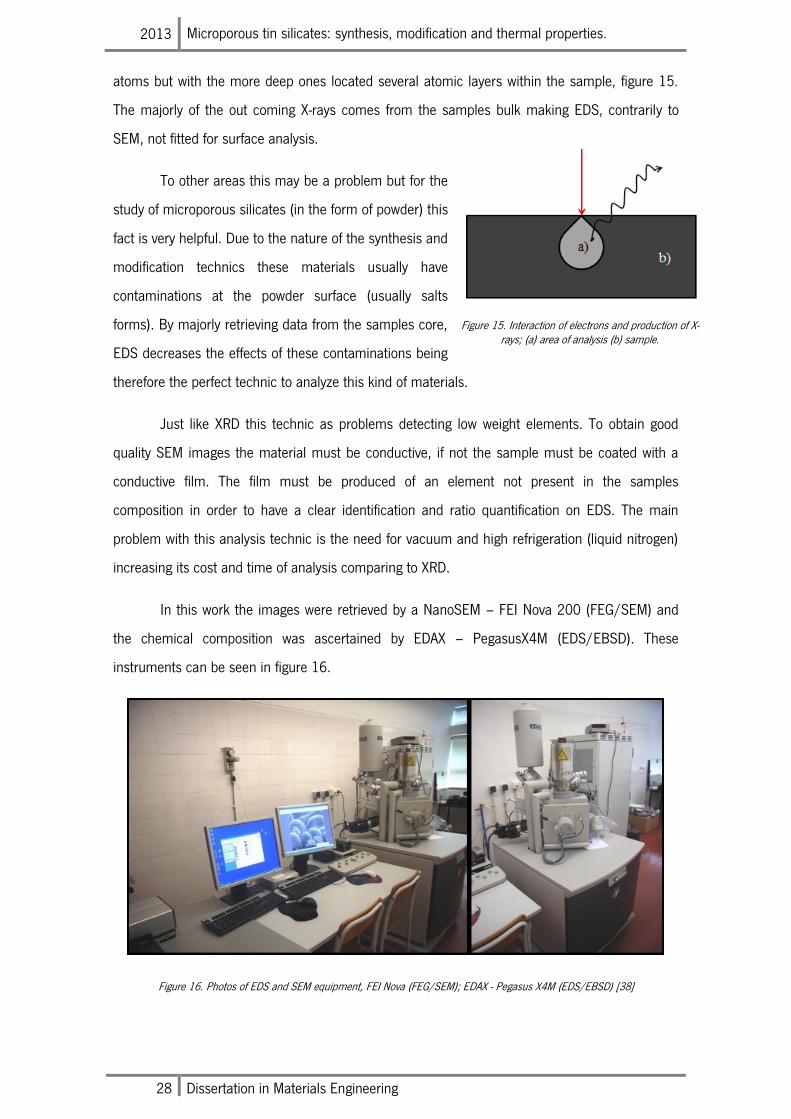
2013 Microporous tin silicates: synthesis, modification and thermal properties.
28 Dissertation in Materials Engineering
atoms but with the more deep ones located several atomic layers within the sample, figure 15.
The majorly of the out coming X-rays comes from the samples bulk making EDS, contrarily to
SEM, not fitted for surface analysis.
To other areas this may be a problem but for the
study of microporous silicates (in the form of powder) this
fact is very helpful. Due to the nature of the synthesis and
modification technics these materials usually have
contaminations at the powder surface (usually salts
forms). By majorly retrieving data from the samples core,
EDS decreases the effects of these contaminations being
therefore the perfect technic to analyze this kind of materials.
Just like XRD this technic as problems detecting low weight elements. To obtain good
quality SEM images the material must be conductive, if not the sample must be coated with a
conductive film. The film must be produced of an element not present in the samples
composition in order to have a clear identification and ratio quantification on EDS. The main
problem with this analysis technic is the need for vacuum and high refrigeration (liquid nitrogen)
increasing its cost and time of analysis comparing to XRD.
In this work the images were retrieved by a NanoSEM – FEI Nova 200 (FEG/SEM) and
the chemical composition was ascertained by EDAX – PegasusX4M (EDS/EBSD). These
instruments can be seen in figure 16.
Figure 16. Photos of EDS and SEM equipment, FEI Nova (FEG/SEM); EDAX - Pegasus X4M (EDS/EBSD) [38]
Figure 15. Interaction of electrons and production of X-rays; (a) area of analysis (b) sample.
Microporous tin silicates: synthesis, modification and thermal properties. 2013
Dissertation in Materials Engineering 29
6.7 Phase identification
All experimental powder patterns, produced by XRD, were compared with existing powder
diffraction files (PDF) for identification. These PDF were scanned on EVA, crystallography analysis
software with PDF database provided by ICDD (International Center for Diffraction Data) [39]. On
EVA software it was possible to perform powder pattern match by raw file analysis. To reduce the
amount of possible matches, the database allows for a probable present atoms search.
Therefore, to search for stannosilicates only H, O, Si, Sn, Na and K were normally selected. When
this produced no results more forms of silicates were selected in order to search for possible
analogue structures. There are many octahedral and tetrahedral elements possible but due to the
large amount of known structures the elements added were Zr, Ti and V. If none of the database
PDF of these forms of silicates matched the experimental powder pattern, all the elements of the
periodic table were considered form search. In this case if a match is found, the elements that
compose the matching structure should be of possible substitution (charge and coordination) for
the ones really present in the material. This match procedure served to identify all the
stannosilicate structures that were already reported to other forms of hydrothermal synthesis.
Also to find analogue structures to the unknown stannosilicate frameworks. After a visual
confirmed match the PDF file was retrieved. On the PDF files are described the material chemical
composition, space group, dimensions, powder pattern information (diffraction planes occupied)
and the article of discovery. This information helped in the next step of analysis, the dimensions
refinement.
The dimensions refinement was a necessary task to understand if the produced
materials had the same exact structures of the reported materials or if there were new
dimensional differences. These differences result from compositional changes or atom
displacement. These differences may be undetectable and unquantifiable on EVA visual match
since it only serves as a comparison method. TOPAS 3.0 software package [40] was used to
perform Le Bail calculated fits, to refine the unit cell parameters, to determine the crystal
dimensions and to produce calculated diffraction planes of the refined powder pattern. Using FPA
(Fundamental Parameters Approach) [41], which allows faster and simpler equation solving, the
Le Bail allows the fine adjustment of all crystallographic data of the powder pattern. This method
was used to confirm if the experimental powder patterns represented pure structures, to
calculate the changes produced by ion exchange and isomorphous substitutions. It also served to
confirm if a determinate space-group can describe a powder pattern by more than visual
analysis. The Le Bail refinement was of vital importance to this work since it was the first
2013 Microporous tin silicates: synthesis, modification and thermal properties.
30 Dissertation in Materials Engineering
confirmation and analysis toll of all crystalline materials produced by synthesis, modification or
thermal degradation.
In addition to this refinement method TOPAS 3.0 also provides Rietveld refinement,
which allows structural simulation and phase percentage determination. By introducing the
structures Crystallographic Information Framework (CIF) file [42] the Rietveld method allows
dimensions refinement and phase percentage calculation. It does this by creating calculated plots
in information from the CIF files and adapting it to the experimental powder patterns. The CIF
files contain all structural crystallographic information like structure name, composition, space
group, dimensions, atoms positions, position occupations, reproduction of the unit cell in space
and more. This information is encrypted and can be used in visualization softwares (like Diamond
3.2) and refinement softwares (like TOPAS 3.0 or Fullprof).
The Rietveld refinement TOPAS 3.0 was used to build modified CIF files. When a
modification to a known stannosilicate structure was achieved, Rietveld allowed the refinement of
the unmodified CIF to the new atomic positions and occupations described in the experimental
powder pattern. The refinement produces a new CIF file that is calculated from the start-up CIF
and the experimental powder patterns. To reach the modified CIF this work obeyed the standard
refinement parameters [43], where the atoms of higher weight were refined first and its
connecting oxygen’s were refined to the acceptable physical distances. In stannosilicates the
heavier atoms are the framework atoms, Sn and Si, so all skeleton was correct first. The Si-O
bonds were correct to a medium length of 1.6 Å, with maximum deviation of 0.1 Å, and Sn-O
bonds were correct to 2.0 Å, with a maximum deviation of 0.2 Å.
The pore atoms are the last ones to refine in position and occupation. Water molecules
inside the channels is represented by a solo oxygen atom (XRD does not detect hydrogen) and its
refined occupation must reflect the values of structural water that leaves the structure upon
dehydration. To calculate this is commonly used thermo gravimetrical analysis (TGA). The pores
stabilizing ions are then refined to optimal position (respecting the angle and bonds) and its
occupation and its occupation values must match the values obtained on EDS. After total
positional and occupational values refinement the isotropic thermal values (ITV) are obtained and
refined to positive levels. The occupation and isotropic thermal factors are good indicators of
correct atom placement. When performing atom refinement and occupation shows values
superior to 1 it is indicative that the atom in question is not the correct one for that position and a
heavier one should be considered. This refinement technic (occupation value) was used to
Microporous tin silicates: synthesis, modification and thermal properties. 2013
Dissertation in Materials Engineering 31
produce the simulated structures of the ion exchanged forms. In this modified forms the increase
of occupation of the pores atoms indicated the presence of the capture element. The ITV are also
important to understand if the refinement procedure was correct. Its values must always be
positive, low values for the more trapped framework atoms and higher to the looser pore atoms.
The framework atoms like Si and Sn should present values from 0.5 to 5, the stabilizing ions (K,
Na and others) present higher ITV and the water molecules that are the more loose members of
the structure should present the highest ITV.
TOPAS Rietveld refinement can also be used to confirm if CIF’s produced by other
softwares fully represent the experimental powder pattern. Since it has a very accurate method of
producing simulated plots and is well accepted in the scientific community this software allows
the confirmation of new CIF by comparing it to the experimental values and producing an error
value (Rwp) that the scientific community acknowledges. This Rwp must be as low as possible,
for low resolution patterns values near 30 are accepted. For a scientific approved Rietveld
refinement, in a high resolution pattern, the Rwp should be inferior to 13.
The required CIF files for any refinement are present in innumerous databases, to this
work the CIF’s were obtained from the software and database “Find it”.
When the ICDD data base does not provide a PDF match to the experimental powder
pattern no CIF file is available and the space group is determined by mathematical iteration of
the powder pattern data. The software used for this procedure was FullProf Suite, which allowed
powder pattern read and individual and automatic peak indexation. By establishing a background
function and creating an analyzable peak distribution, FullProf, allowed the search of space-
groups and unit cell dimensions by the DICVOL06 or the TREOR mathematical approaches. A
solution is then calculated from all possible space-group/dimensions combinations and
compared with the experimental powder pattern. The software performs innumerous iterations
but the rate of success is normally good. Since FullProf provides more than one solution other
software was used to search throw-out the resulting data. Checkcell, the used software, imports
the results from FullProf and allows visualization of the found solutions. It also allows comparison
in several related space-groups and crystal types. The peaks from the experimental powder
pattern are compared with the peaks formed by the solutions. This procedure can be performed
manually or automatically. This software performs matching procedures to find the best solution
among the ones already provided by FullProf. The combination of these two softwares allowed
the phase determination of the unknown powder patterns in this work.
2013 Microporous tin silicates: synthesis, modification and thermal properties.
32 Dissertation in Materials Engineering
Crystallographic characterization of new or modified structures ends with the creation of
the CIF file. The modification of CIF files is and well dominated procedure form of creating new
simulated structures. This procedure (done in TOPAS or other Rietveld bases softwares) works
well on ion exchange or isomorphic substitution forms. However, when a new form of structure
appears and it does not possess any kind of analogue among silicates or any other materials the
Rietveld process is no longer an option. This refinement process needs an initial framework to
start the refinement, an initial CIF file that must closely resemble the experimental powder
pattern. So in cases of unknown phase or new crystalline materials the approach to obtain the
final CIF file was performed differently. First unit cell and space-group were determined by
FullProf and Checkcell after that EXPO 2009 was used for atom to atom framework build. EXPO
2009 allows structure simulation from powder patterns, unit cell parameters and chemical
composition alone.
This software performs atomic position simulation by automatic methods or by
constructive methods using Fourier mapping. The construction of correct structures from EXPO
2009 is a very experimental and difficult process since there are no fundamental parameters or
standard approaches. It is an atom to atom buildup that requires frequent Rietveld refinement for
position confirmation. EXPO 2009 allows atom manipulation within the unit cell making the
construction of the unit cell full very dynamic and dependent on the user knowledge of the type of
materials in question. After CIF build up, EXPO 2009, internal Rietveld error factor (Rwp) is not
very reliable so it is necessary to export the CIF and perform TOPAS Rietveld confirmation. The
buildup of CIF files is not current in scientific reports, most of the times structures are obtained
by Rietveld of analogue or similar frameworks. Nevertheless, this works used this method to the
construction of unknown frameworks and the CIF’s produced in EXPO 2009 were then submitted
to TOPAS Rietveld for final distances correction and production of the calculated plot and
associated Rwp.
During the development of this work, new EXPO software was released, the EXPO2013
had upgraded functions that allowed the restrain of angles and distance of bond more correctly.
This new version was used to perfect the angles on all simulated structures, both EXPO2009 and
TOPAS 3.0 CIF files.
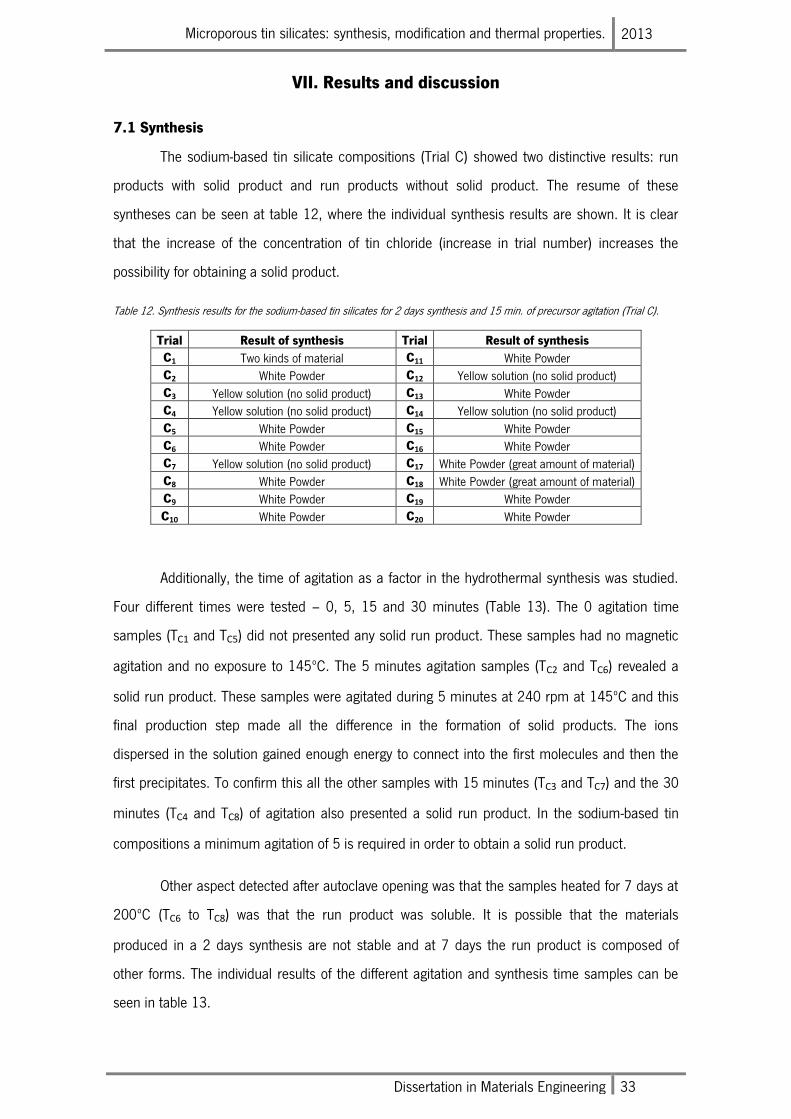
Microporous tin silicates: synthesis, modification and thermal properties. 2013
Dissertation in Materials Engineering 33
VII. Results and discussion
7.1 Synthesis
The sodium-based tin silicate compositions (Trial C) showed two distinctive results: run
products with solid product and run products without solid product. The resume of these
syntheses can be seen at table 12, where the individual synthesis results are shown. It is clear
that the increase of the concentration of tin chloride (increase in trial number) increases the
possibility for obtaining a solid product.
Table 12. Synthesis results for the sodium-based tin silicates for 2 days synthesis and 15 min. of precursor agitation (Trial C).
Trial Result of synthesis Trial Result of synthesis
C1 Two kinds of material C11 White Powder
C2 White Powder C12 Yellow solution (no solid product)
C3 Yellow solution (no solid product) C13 White Powder
C4 Yellow solution (no solid product) C14 Yellow solution (no solid product)
C5 White Powder C15 White Powder
C6 White Powder C16 White Powder
C7 Yellow solution (no solid product) C17 White Powder (great amount of material)
C8 White Powder C18 White Powder (great amount of material)
C9 White Powder C19 White Powder
C10 White Powder C20 White Powder
Additionally, the time of agitation as a factor in the hydrothermal synthesis was studied.
Four different times were tested – 0, 5, 15 and 30 minutes (Table 13). The 0 agitation time
samples (TC1 and TC5) did not presented any solid run product. These samples had no magnetic
agitation and no exposure to 145ºC. The 5 minutes agitation samples (TC2 and TC6) revealed a
solid run product. These samples were agitated during 5 minutes at 240 rpm at 145ºC and this
final production step made all the difference in the formation of solid products. The ions
dispersed in the solution gained enough energy to connect into the first molecules and then the
first precipitates. To confirm this all the other samples with 15 minutes (TC3 and TC7) and the 30
minutes (TC4 and TC8) of agitation also presented a solid run product. In the sodium-based tin
compositions a minimum agitation of 5 is required in order to obtain a solid run product.
Other aspect detected after autoclave opening was that the samples heated for 7 days at
200ºC (TC6 to TC8) was that the run product was soluble. It is possible that the materials
produced in a 2 days synthesis are not stable and at 7 days the run product is composed of
other forms. The individual results of the different agitation and synthesis time samples can be
seen in table 13.
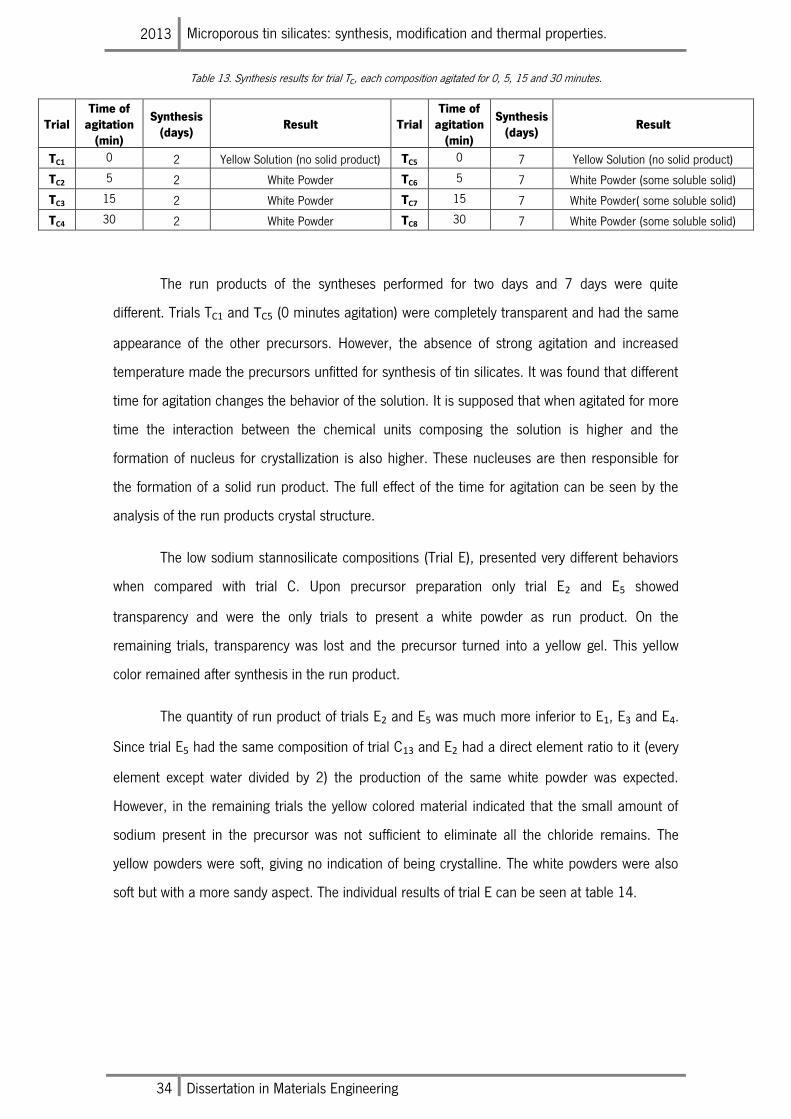
2013 Microporous tin silicates: synthesis, modification and thermal properties.
34 Dissertation in Materials Engineering
Table 13. Synthesis results for trial TC, each composition agitated for 0, 5, 15 and 30 minutes.
Trial Time of
agitation (min)
Synthesis (days)
Result Trial Time of
agitation (min)
Synthesis (days)
Result
TC1 0 2 Yellow Solution (no solid product) TC5 0 7 Yellow Solution (no solid product)
TC2 5 2 White Powder TC6 5 7 White Powder (some soluble solid)
TC3 15 2 White Powder TC7 15 7 White Powder( some soluble solid)
TC4 30 2 White Powder TC8 30 7 White Powder (some soluble solid)
The run products of the syntheses performed for two days and 7 days were quite
different. Trials TC1 and TC5 (0 minutes agitation) were completely transparent and had the same
appearance of the other precursors. However, the absence of strong agitation and increased
temperature made the precursors unfitted for synthesis of tin silicates. It was found that different
time for agitation changes the behavior of the solution. It is supposed that when agitated for more
time the interaction between the chemical units composing the solution is higher and the
formation of nucleus for crystallization is also higher. These nucleuses are then responsible for
the formation of a solid run product. The full effect of the time for agitation can be seen by the
analysis of the run products crystal structure.
The low sodium stannosilicate compositions (Trial E), presented very different behaviors
when compared with trial C. Upon precursor preparation only trial E2 and E5 showed
transparency and were the only trials to present a white powder as run product. On the
remaining trials, transparency was lost and the precursor turned into a yellow gel. This yellow
color remained after synthesis in the run product.
The quantity of run product of trials E2 and E5 was much more inferior to E1, E3 and E4.
Since trial E5 had the same composition of trial C13 and E2 had a direct element ratio to it (every
element except water divided by 2) the production of the same white powder was expected.
However, in the remaining trials the yellow colored material indicated that the small amount of
sodium present in the precursor was not sufficient to eliminate all the chloride remains. The
yellow powders were soft, giving no indication of being crystalline. The white powders were also
soft but with a more sandy aspect. The individual results of trial E can be seen at table 14.
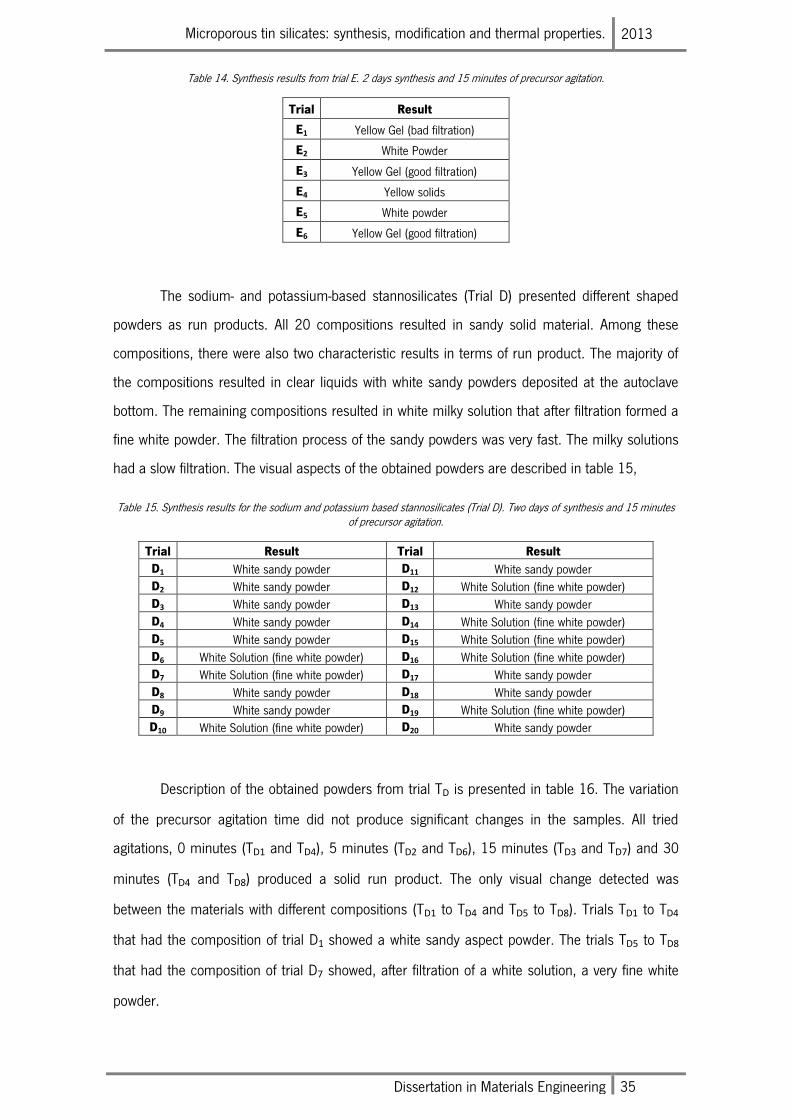
Microporous tin silicates: synthesis, modification and thermal properties. 2013
Dissertation in Materials Engineering 35
Table 14. Synthesis results from trial E. 2 days synthesis and 15 minutes of precursor agitation.
Trial Result
E1 Yellow Gel (bad filtration)
E2 White Powder
E3 Yellow Gel (good filtration)
E4 Yellow solids
E5 White powder
E6 Yellow Gel (good filtration)
The sodium- and potassium-based stannosilicates (Trial D) presented different shaped
powders as run products. All 20 compositions resulted in sandy solid material. Among these
compositions, there were also two characteristic results in terms of run product. The majority of
the compositions resulted in clear liquids with white sandy powders deposited at the autoclave
bottom. The remaining compositions resulted in white milky solution that after filtration formed a
fine white powder. The filtration process of the sandy powders was very fast. The milky solutions
had a slow filtration. The visual aspects of the obtained powders are described in table 15,
Table 15. Synthesis results for the sodium and potassium based stannosilicates (Trial D). Two days of synthesis and 15 minutes of precursor agitation.
Trial Result Trial Result
D1 White sandy powder D11 White sandy powder
D2 White sandy powder D12 White Solution (fine white powder)
D3 White sandy powder D13 White sandy powder
D4 White sandy powder D14 White Solution (fine white powder)
D5 White sandy powder D15 White Solution (fine white powder)
D6 White Solution (fine white powder) D16 White Solution (fine white powder)
D7 White Solution (fine white powder) D17 White sandy powder
D8 White sandy powder D18 White sandy powder
D9 White sandy powder D19 White Solution (fine white powder)
D10 White Solution (fine white powder) D20 White sandy powder
Description of the obtained powders from trial TD is presented in table 16. The variation
of the precursor agitation time did not produce significant changes in the samples. All tried
agitations, 0 minutes (TD1 and TD4), 5 minutes (TD2 and TD6), 15 minutes (TD3 and TD7) and 30
minutes (TD4 and TD8) produced a solid run product. The only visual change detected was
between the materials with different compositions (TD1 to TD4 and TD5 to TD8). Trials TD1 to TD4
that had the composition of trial D1 showed a white sandy aspect powder. The trials TD5 to TD8
that had the composition of trial D7 showed, after filtration of a white solution, a very fine white
powder.
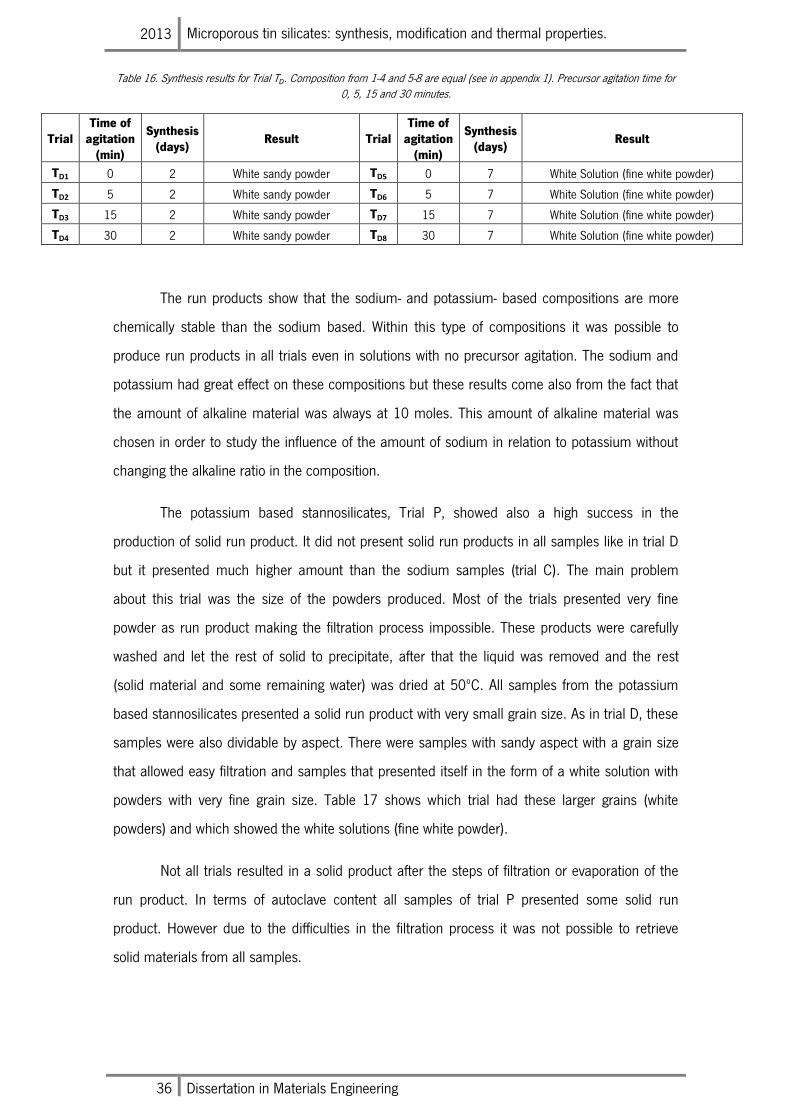
2013 Microporous tin silicates: synthesis, modification and thermal properties.
36 Dissertation in Materials Engineering
Table 16. Synthesis results for Trial TD. Composition from 1-4 and 5-8 are equal (see in appendix 1). Precursor agitation time for 0, 5, 15 and 30 minutes.
Trial Time of
agitation (min)
Synthesis (days)
Result Trial Time of
agitation (min)
Synthesis (days)
Result
TD1 0 2 White sandy powder TD5 0 7 White Solution (fine white powder)
TD2 5 2 White sandy powder TD6 5 7 White Solution (fine white powder)
TD3 15 2 White sandy powder TD7 15 7 White Solution (fine white powder)
TD4 30 2 White sandy powder TD8 30 7 White Solution (fine white powder)
The run products show that the sodium- and potassium- based compositions are more
chemically stable than the sodium based. Within this type of compositions it was possible to
produce run products in all trials even in solutions with no precursor agitation. The sodium and
potassium had great effect on these compositions but these results come also from the fact that
the amount of alkaline material was always at 10 moles. This amount of alkaline material was
chosen in order to study the influence of the amount of sodium in relation to potassium without
changing the alkaline ratio in the composition.
The potassium based stannosilicates, Trial P, showed also a high success in the
production of solid run product. It did not present solid run products in all samples like in trial D
but it presented much higher amount than the sodium samples (trial C). The main problem
about this trial was the size of the powders produced. Most of the trials presented very fine
powder as run product making the filtration process impossible. These products were carefully
washed and let the rest of solid to precipitate, after that the liquid was removed and the rest
(solid material and some remaining water) was dried at 50ºC. All samples from the potassium
based stannosilicates presented a solid run product with very small grain size. As in trial D, these
samples were also dividable by aspect. There were samples with sandy aspect with a grain size
that allowed easy filtration and samples that presented itself in the form of a white solution with
powders with very fine grain size. Table 17 shows which trial had these larger grains (white
powders) and which showed the white solutions (fine white powder).
Not all trials resulted in a solid product after the steps of filtration or evaporation of the
run product. In terms of autoclave content all samples of trial P presented some solid run
product. However due to the difficulties in the filtration process it was not possible to retrieve
solid materials from all samples.
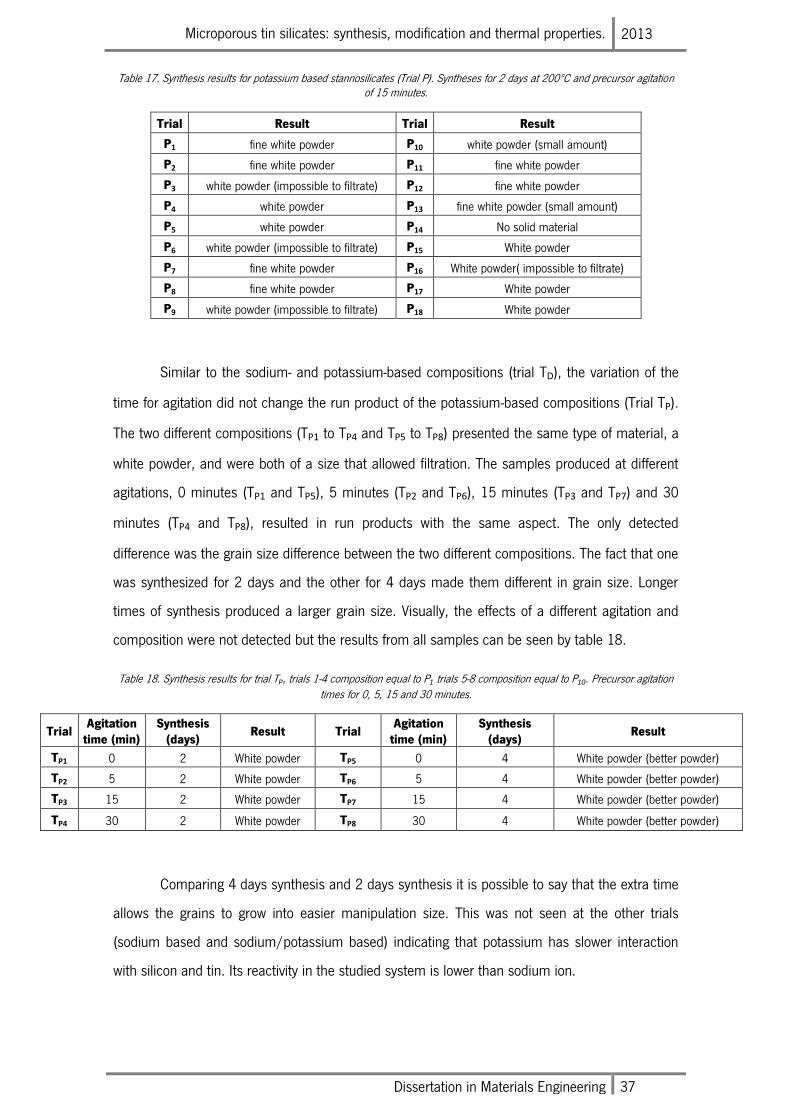
Microporous tin silicates: synthesis, modification and thermal properties. 2013
Dissertation in Materials Engineering 37
Table 17. Synthesis results for potassium based stannosilicates (Trial P). Syntheses for 2 days at 200ºC and precursor agitation of 15 minutes.
Trial Result Trial Result
P1 fine white powder P10 white powder (small amount)
P2 fine white powder P11 fine white powder
P3 white powder (impossible to filtrate) P12 fine white powder
P4 white powder P13 fine white powder (small amount)
P5 white powder P14 No solid material
P6 white powder (impossible to filtrate) P15 White powder
P7 fine white powder P16 White powder( impossible to filtrate)
P8 fine white powder P17 White powder
P9 white powder (impossible to filtrate) P18 White powder
Similar to the sodium- and potassium-based compositions (trial TD), the variation of the
time for agitation did not change the run product of the potassium-based compositions (Trial TP).
The two different compositions (TP1 to TP4 and TP5 to TP8) presented the same type of material, a
white powder, and were both of a size that allowed filtration. The samples produced at different
agitations, 0 minutes (TP1 and TP5), 5 minutes (TP2 and TP6), 15 minutes (TP3 and TP7) and 30
minutes (TP4 and TP8), resulted in run products with the same aspect. The only detected
difference was the grain size difference between the two different compositions. The fact that one
was synthesized for 2 days and the other for 4 days made them different in grain size. Longer
times of synthesis produced a larger grain size. Visually, the effects of a different agitation and
composition were not detected but the results from all samples can be seen by table 18.
Table 18. Synthesis results for trial TP, trials 1-4 composition equal to P1 trials 5-8 composition equal to P10. Precursor agitation times for 0, 5, 15 and 30 minutes.
Trial Agitation
time (min) Synthesis
(days) Result Trial
Agitation time (min)
Synthesis (days)
Result
TP1 0 2 White powder TP5 0 4 White powder (better powder)
TP2 5 2 White powder TP6 5 4 White powder (better powder)
TP3 15 2 White powder TP7 15 4 White powder (better powder)
TP4 30 2 White powder TP8 30 4 White powder (better powder)
Comparing 4 days synthesis and 2 days synthesis it is possible to say that the extra time
allows the grains to grow into easier manipulation size. This was not seen at the other trials
(sodium based and sodium/potassium based) indicating that potassium has slower interaction
with silicon and tin. Its reactivity in the studied system is lower than sodium ion.
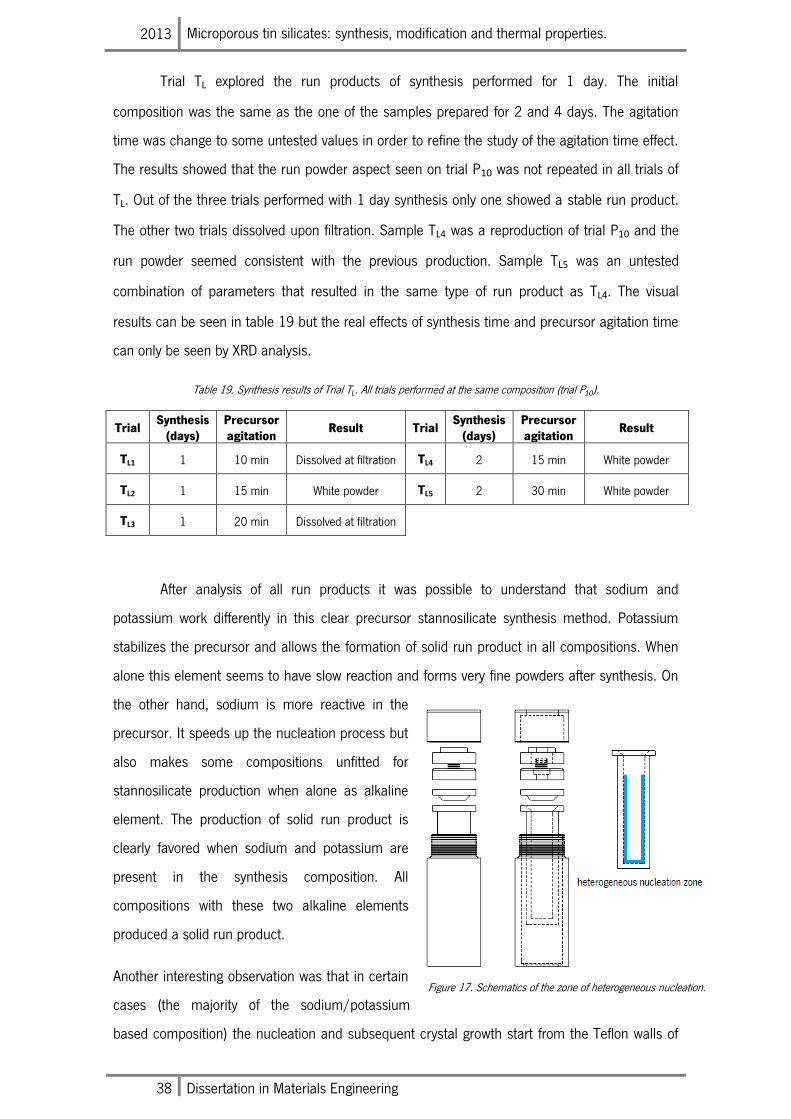
2013 Microporous tin silicates: synthesis, modification and thermal properties.
38 Dissertation in Materials Engineering
Trial TL explored the run products of synthesis performed for 1 day. The initial
composition was the same as the one of the samples prepared for 2 and 4 days. The agitation
time was change to some untested values in order to refine the study of the agitation time effect.
The results showed that the run powder aspect seen on trial P10 was not repeated in all trials of
TL. Out of the three trials performed with 1 day synthesis only one showed a stable run product.
The other two trials dissolved upon filtration. Sample TL4 was a reproduction of trial P10 and the
run powder seemed consistent with the previous production. Sample TL5 was an untested
combination of parameters that resulted in the same type of run product as TL4. The visual
results can be seen in table 19 but the real effects of synthesis time and precursor agitation time
can only be seen by XRD analysis.
Table 19. Synthesis results of Trial TL. All trials performed at the same composition (trial P10).
Trial Synthesis
(days) Precursor agitation
Result Trial Synthesis
(days) Precursor agitation
Result
TL1 1 10 min Dissolved at filtration TL4 2 15 min White powder
TL2 1 15 min White powder TL5 2 30 min White powder
TL3 1 20 min Dissolved at filtration
After analysis of all run products it was possible to understand that sodium and
potassium work differently in this clear precursor stannosilicate synthesis method. Potassium
stabilizes the precursor and allows the formation of solid run product in all compositions. When
alone this element seems to have slow reaction and forms very fine powders after synthesis. On
the other hand, sodium is more reactive in the
precursor. It speeds up the nucleation process but
also makes some compositions unfitted for
stannosilicate production when alone as alkaline
element. The production of solid run product is
clearly favored when sodium and potassium are
present in the synthesis composition. All
compositions with these two alkaline elements
produced a solid run product.
Another interesting observation was that in certain
cases (the majority of the sodium/potassium
based composition) the nucleation and subsequent crystal growth start from the Teflon walls of
Figure 17. Schematics of the zone of heterogeneous nucleation.
Microporous tin silicates: synthesis, modification and thermal properties. 2013
Dissertation in Materials Engineering 39
the autoclave (figure 17). Probably the Teflon walls contributed for faster heterogeneous
nucleation which led to a shorter synthesis time.
7.2 Characterization of the synthesized materials
After synthesis and drying the materials were stored according to their initial batch
composition, time for agitation and crystallization. Additionally, the large grain size samples were
milled for better XRD characterization. The obtained powder XRD patterns were analyzed by
specialized software (ICDD, EVA and TOPAS) and the samples of particular interest were further
characterized by SEM and EDS.
7.2.1 Sodium-based tin silicates
Trial C samples formed materials with sodium as the alkaline stabilizer of the
composition. Within these materials the crystalline ones presented powder patterns showing two
different phases across the entire composition field. Figure 18 shows the obtained powder
patterns. Crystallinity was low in almost every trial but there were clear indications, after EVA
analysis, that some trials resulted in a material known as AV-10. The remaining crystalline trials
resulted in unknown type of structures characterized by a very high intensity peak at very low
2theta angles, near 7º 2theta. In figure 18 the AV-10 materials are distinguished by the absence
of any diffraction peak at 7º 2theta and for the presence of three high intensity peaks between 12
and 17º 2theta. The materials powder patterns had some detectable impurities or defects
indicating that the materials formed were not a pure form of AV-10.
The majority of the synthesized materials resulted in materials with the unknown
structure. This was an indication that the composition field build favored the formation of this
unknown phase. This phase was designated as UM-1 (University of Minho – 1). The formation of
AV-10 appeared only in low sodium trials, probably because the sodium available in the
compositions was not enough to form the dominant phase of this trial. UM-1 showed broad
peaks in all trials indicating either very small crystal size or very low crystallinity. C9 and C13 were
the samples that resulted in a powder pattern consistent with AV-10. C9 presented low
crystallinity but C13 showed enough diffraction information to try an indexation. From all the
samples that resulted in patterns with the distinctive 7º 2theta high intensity peak, C11 and C20
were the ones with the higher amount of diffraction information and with the lower background
contamination. Sample C1 was identified as a non stannosilicate structure. Within the analyzed
materials it was also seen that some samples resulted in amorphous materials (C10, C17, C18 and
C19).
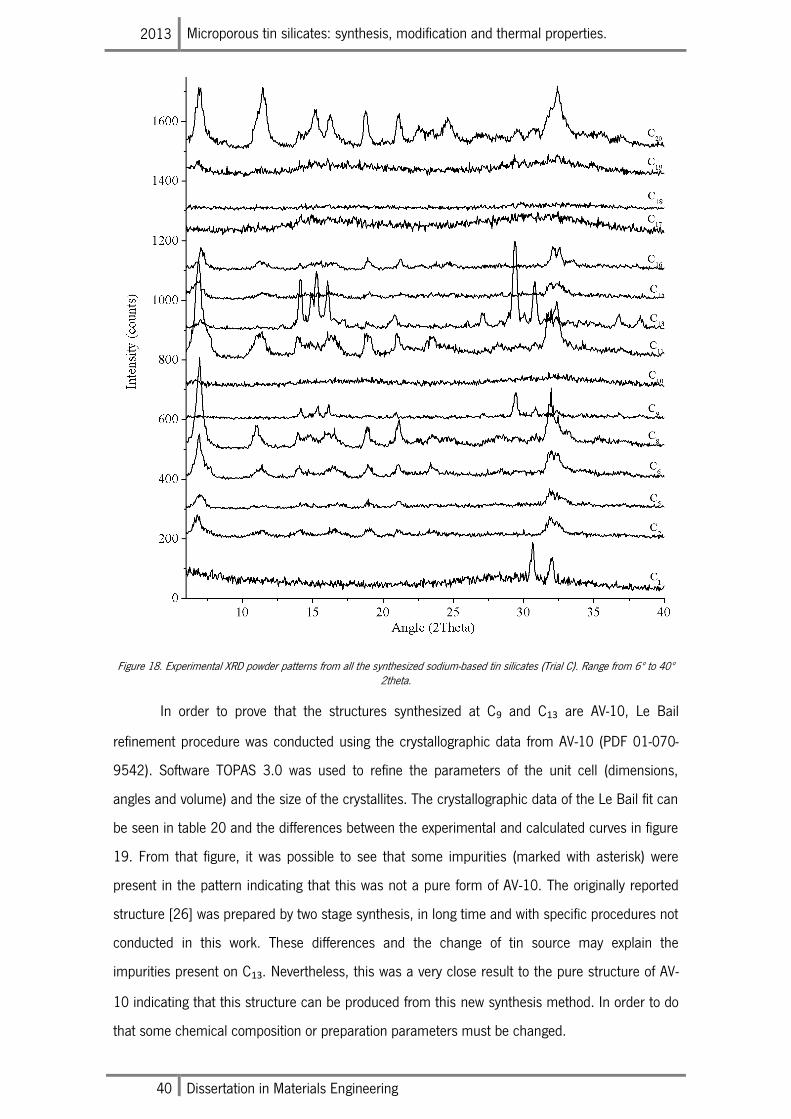
2013 Microporous tin silicates: synthesis, modification and thermal properties.
40 Dissertation in Materials Engineering
Figure 18. Experimental XRD powder patterns from all the synthesized sodium-based tin silicates (Trial C). Range from 6º to 40º 2theta.
In order to prove that the structures synthesized at C9 and C13 are AV-10, Le Bail
refinement procedure was conducted using the crystallographic data from AV-10 (PDF 01-070-
9542). Software TOPAS 3.0 was used to refine the parameters of the unit cell (dimensions,
angles and volume) and the size of the crystallites. The crystallographic data of the Le Bail fit can
be seen in table 20 and the differences between the experimental and calculated curves in figure
19. From that figure, it was possible to see that some impurities (marked with asterisk) were
present in the pattern indicating that this was not a pure form of AV-10. The originally reported
structure [26] was prepared by two stage synthesis, in long time and with specific procedures not
conducted in this work. These differences and the change of tin source may explain the
impurities present on C13. Nevertheless, this was a very close result to the pure structure of AV-
10 indicating that this structure can be produced from this new synthesis method. In order to do
that some chemical composition or preparation parameters must be changed.
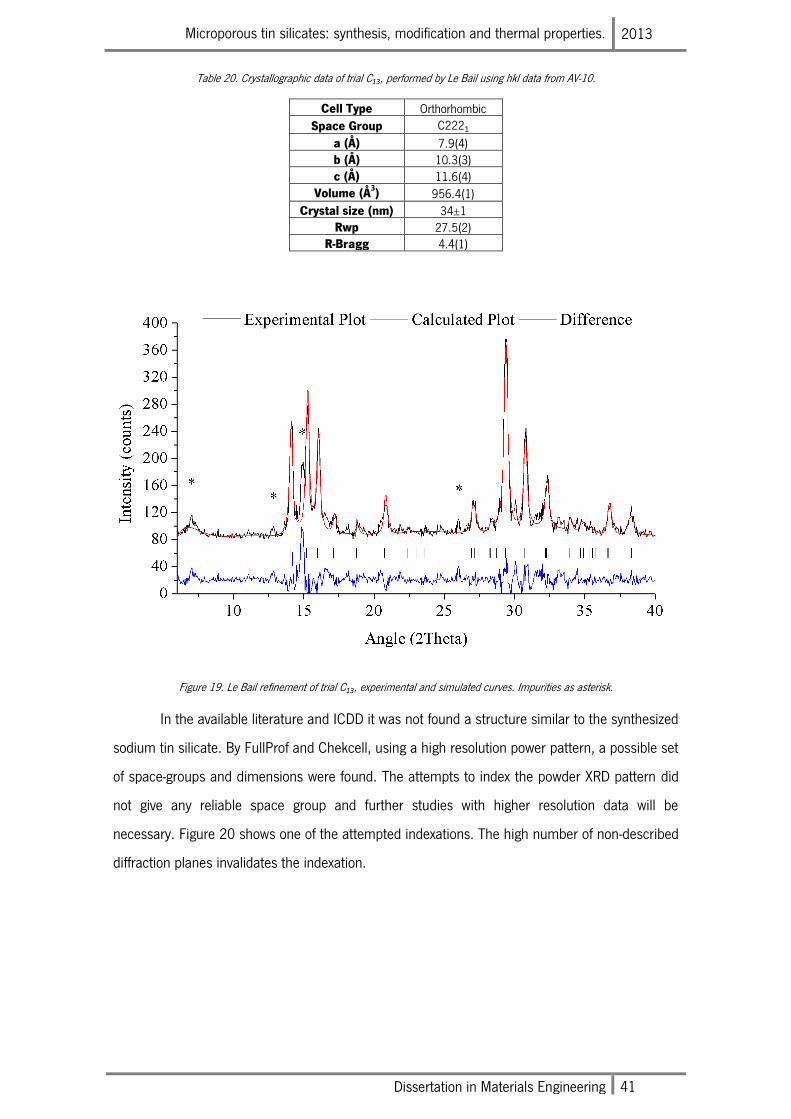
Microporous tin silicates: synthesis, modification and thermal properties. 2013
Dissertation in Materials Engineering 41
Table 20. Crystallographic data of trial C13, performed by Le Bail using hkl data from AV-10.
Cell Type Orthorhombic
Space Group C2221
a (Å) 7.9(4) b (Å) 10.3(3) c (Å) 11.6(4)
Volume (Å3) 956.4(1)
Crystal size (nm) 34±1 Rwp 27.5(2)
R-Bragg 4.4(1)
Figure 19. Le Bail refinement of trial C13, experimental and simulated curves. Impurities as asterisk.
In the available literature and ICDD it was not found a structure similar to the synthesized
sodium tin silicate. By FullProf and Chekcell, using a high resolution power pattern, a possible set
of space-groups and dimensions were found. The attempts to index the powder XRD pattern did
not give any reliable space group and further studies with higher resolution data will be
necessary. Figure 20 shows one of the attempted indexations. The high number of non-described
diffraction planes invalidates the indexation.
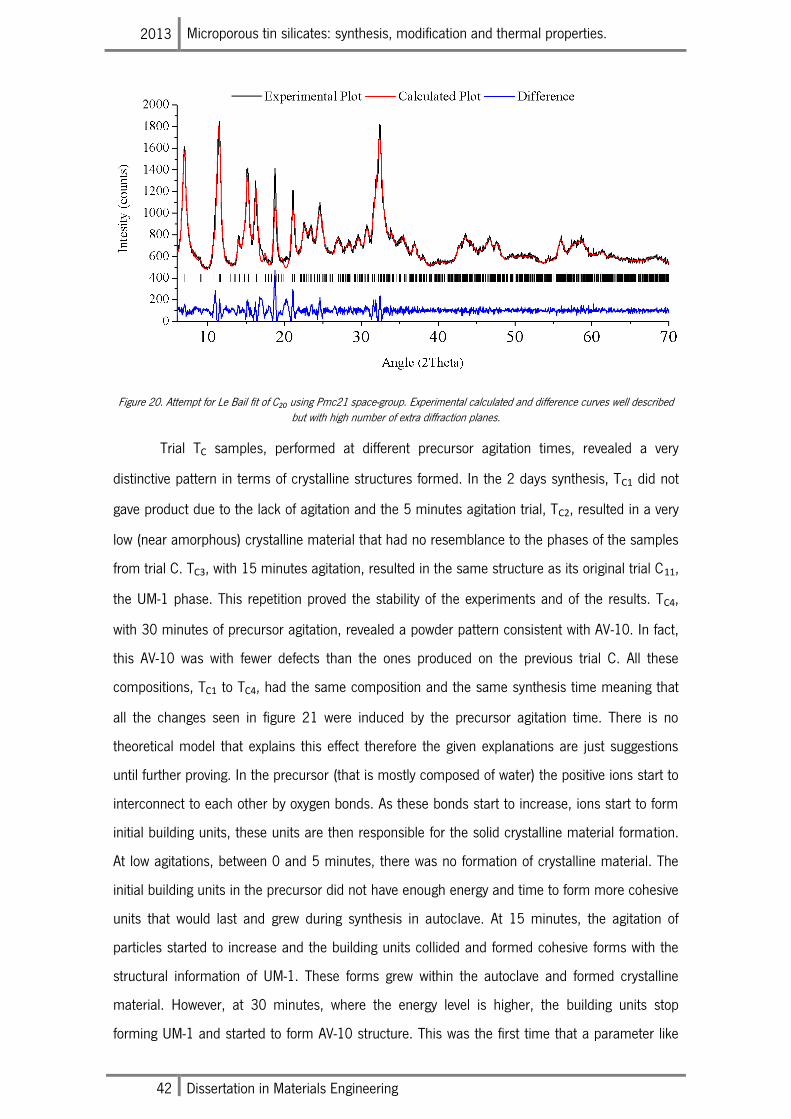
2013 Microporous tin silicates: synthesis, modification and thermal properties.
42 Dissertation in Materials Engineering
Figure 20. Attempt for Le Bail fit of C20 using Pmc21 space-group. Experimental calculated and difference curves well described but with high number of extra diffraction planes.
Trial TC samples, performed at different precursor agitation times, revealed a very
distinctive pattern in terms of crystalline structures formed. In the 2 days synthesis, TC1 did not
gave product due to the lack of agitation and the 5 minutes agitation trial, TC2, resulted in a very
low (near amorphous) crystalline material that had no resemblance to the phases of the samples
from trial C. TC3, with 15 minutes agitation, resulted in the same structure as its original trial C11,
the UM-1 phase. This repetition proved the stability of the experiments and of the results. TC4,
with 30 minutes of precursor agitation, revealed a powder pattern consistent with AV-10. In fact,
this AV-10 was with fewer defects than the ones produced on the previous trial C. All these
compositions, TC1 to TC4, had the same composition and the same synthesis time meaning that
all the changes seen in figure 21 were induced by the precursor agitation time. There is no
theoretical model that explains this effect therefore the given explanations are just suggestions
until further proving. In the precursor (that is mostly composed of water) the positive ions start to
interconnect to each other by oxygen bonds. As these bonds start to increase, ions start to form
initial building units, these units are then responsible for the solid crystalline material formation.
At low agitations, between 0 and 5 minutes, there was no formation of crystalline material. The
initial building units in the precursor did not have enough energy and time to form more cohesive
units that would last and grew during synthesis in autoclave. At 15 minutes, the agitation of
particles started to increase and the building units collided and formed cohesive forms with the
structural information of UM-1. These forms grew within the autoclave and formed crystalline
material. However, at 30 minutes, where the energy level is higher, the building units stop
forming UM-1 and started to form AV-10 structure. This was the first time that a parameter like
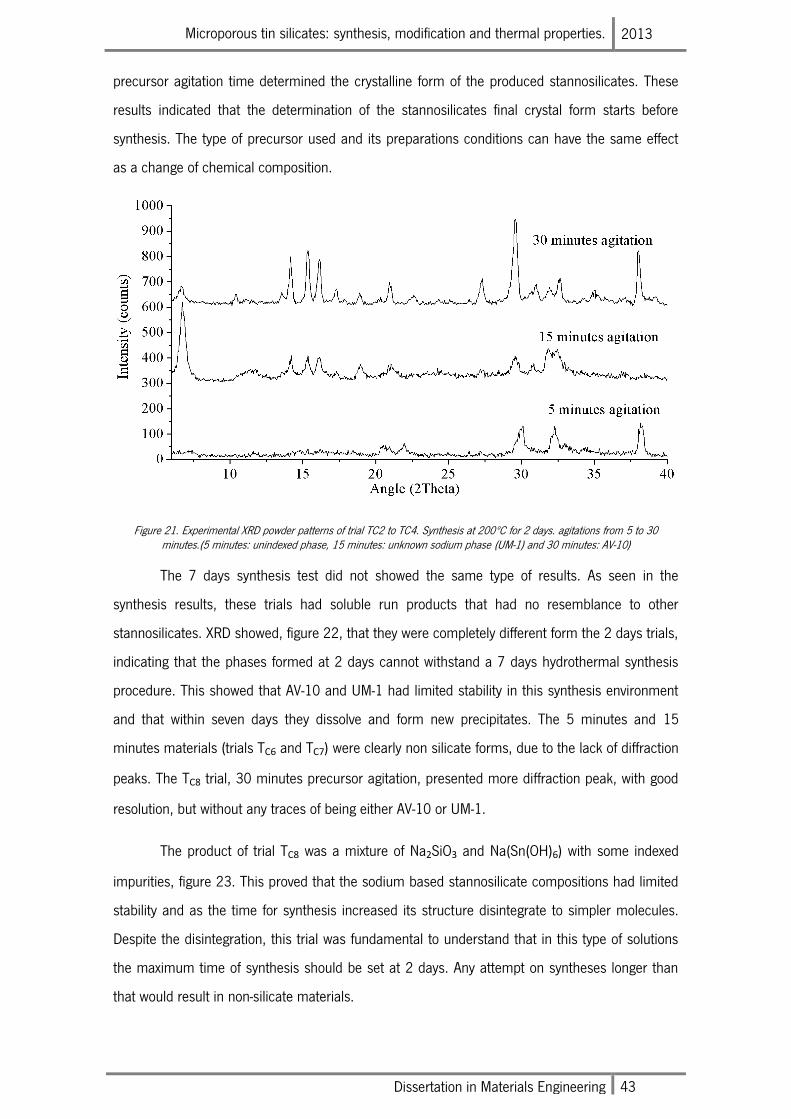
Microporous tin silicates: synthesis, modification and thermal properties. 2013
Dissertation in Materials Engineering 43
precursor agitation time determined the crystalline form of the produced stannosilicates. These
results indicated that the determination of the stannosilicates final crystal form starts before
synthesis. The type of precursor used and its preparations conditions can have the same effect
as a change of chemical composition.
Figure 21. Experimental XRD powder patterns of trial TC2 to TC4. Synthesis at 200ºC for 2 days. agitations from 5 to 30 minutes.(5 minutes: unindexed phase, 15 minutes: unknown sodium phase (UM-1) and 30 minutes: AV-10)
The 7 days synthesis test did not showed the same type of results. As seen in the
synthesis results, these trials had soluble run products that had no resemblance to other
stannosilicates. XRD showed, figure 22, that they were completely different form the 2 days trials,
indicating that the phases formed at 2 days cannot withstand a 7 days hydrothermal synthesis
procedure. This showed that AV-10 and UM-1 had limited stability in this synthesis environment
and that within seven days they dissolve and form new precipitates. The 5 minutes and 15
minutes materials (trials TC6 and TC7) were clearly non silicate forms, due to the lack of diffraction
peaks. The TC8 trial, 30 minutes precursor agitation, presented more diffraction peak, with good
resolution, but without any traces of being either AV-10 or UM-1.
The product of trial TC8 was a mixture of Na2SiO3 and Na(Sn(OH)6) with some indexed
impurities, figure 23. This proved that the sodium based stannosilicate compositions had limited
stability and as the time for synthesis increased its structure disintegrate to simpler molecules.
Despite the disintegration, this trial was fundamental to understand that in this type of solutions
the maximum time of synthesis should be set at 2 days. Any attempt on syntheses longer than
that would result in non-silicate materials.
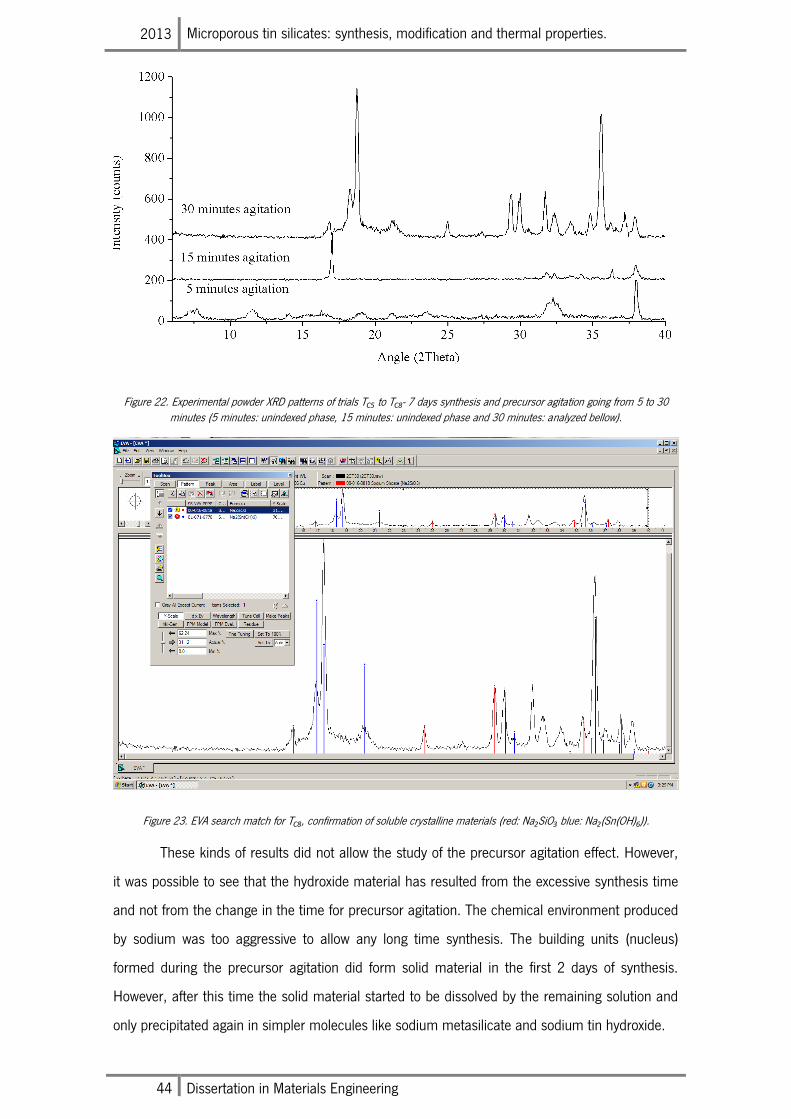
2013 Microporous tin silicates: synthesis, modification and thermal properties.
44 Dissertation in Materials Engineering
Figure 22. Experimental powder XRD patterns of trials TC5 to TC8- 7 days synthesis and precursor agitation going from 5 to 30 minutes (5 minutes: unindexed phase, 15 minutes: unindexed phase and 30 minutes: analyzed bellow).
Figure 23. EVA search match for TC8, confirmation of soluble crystalline materials (red: Na2SiO3 blue: Na2(Sn(OH)6)).
These kinds of results did not allow the study of the precursor agitation effect. However,
it was possible to see that the hydroxide material has resulted from the excessive synthesis time
and not from the change in the time for precursor agitation. The chemical environment produced
by sodium was too aggressive to allow any long time synthesis. The building units (nucleus)
formed during the precursor agitation did form solid material in the first 2 days of synthesis.
However, after this time the solid material started to be dissolved by the remaining solution and
only precipitated again in simpler molecules like sodium metasilicate and sodium tin hydroxide.
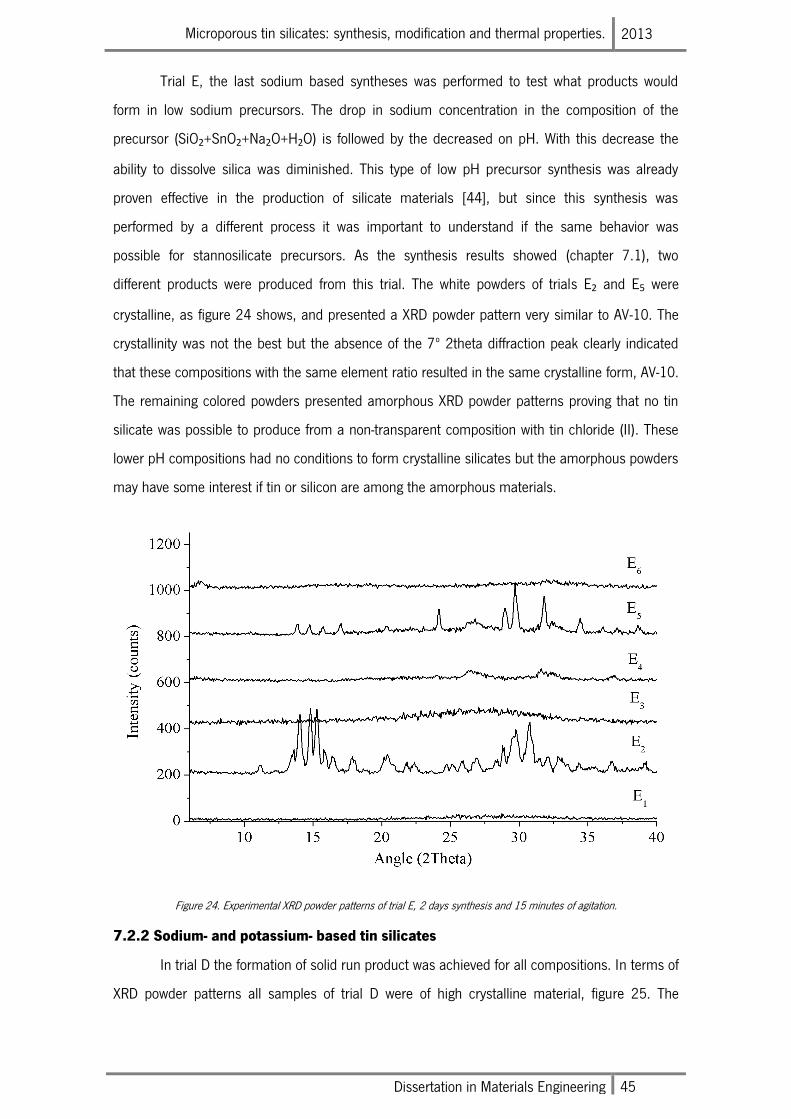
Microporous tin silicates: synthesis, modification and thermal properties. 2013
Dissertation in Materials Engineering 45
Trial E, the last sodium based syntheses was performed to test what products would
form in low sodium precursors. The drop in sodium concentration in the composition of the
precursor (SiO2+SnO2+Na2O+H2O) is followed by the decreased on pH. With this decrease the
ability to dissolve silica was diminished. This type of low pH precursor synthesis was already
proven effective in the production of silicate materials [44], but since this synthesis was
performed by a different process it was important to understand if the same behavior was
possible for stannosilicate precursors. As the synthesis results showed (chapter 7.1), two
different products were produced from this trial. The white powders of trials E2 and E5 were
crystalline, as figure 24 shows, and presented a XRD powder pattern very similar to AV-10. The
crystallinity was not the best but the absence of the 7º 2theta diffraction peak clearly indicated
that these compositions with the same element ratio resulted in the same crystalline form, AV-10.
The remaining colored powders presented amorphous XRD powder patterns proving that no tin
silicate was possible to produce from a non-transparent composition with tin chloride (II). These
lower pH compositions had no conditions to form crystalline silicates but the amorphous powders
may have some interest if tin or silicon are among the amorphous materials.
Figure 24. Experimental XRD powder patterns of trial E, 2 days synthesis and 15 minutes of agitation.
7.2.2 Sodium- and potassium- based tin silicates
In trial D the formation of solid run product was achieved for all compositions. In terms of
XRD powder patterns all samples of trial D were of high crystalline material, figure 25. The
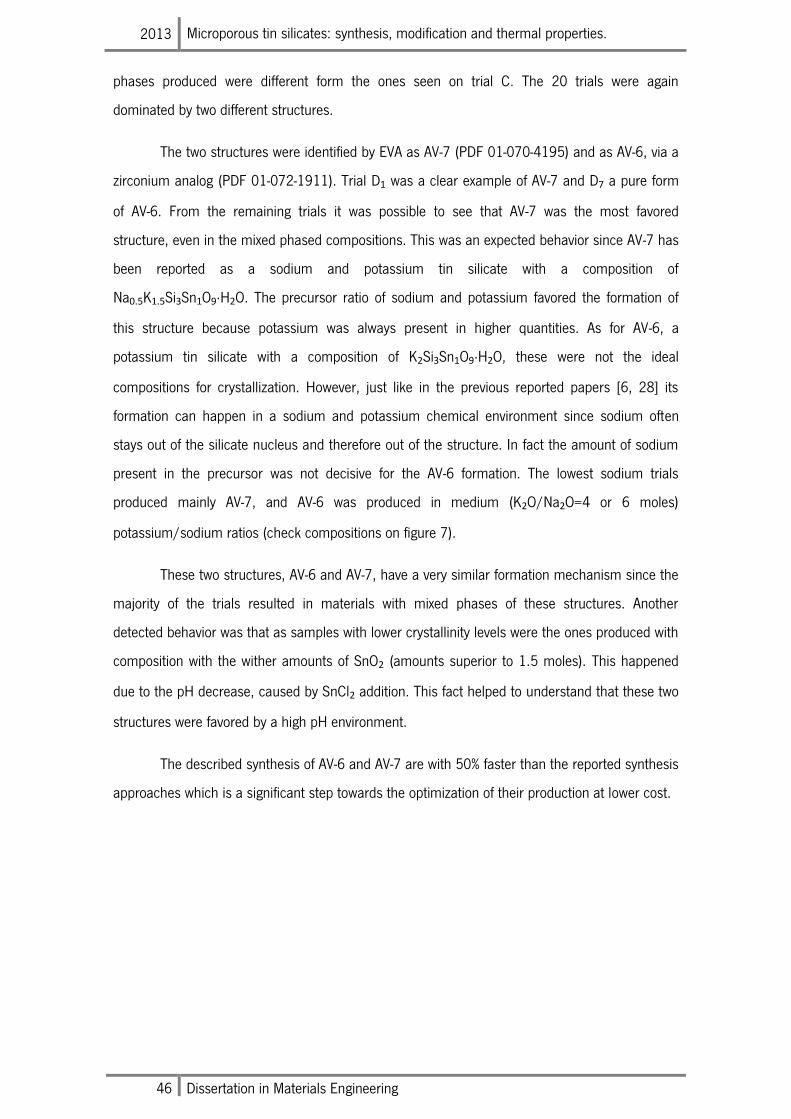
2013 Microporous tin silicates: synthesis, modification and thermal properties.
46 Dissertation in Materials Engineering
phases produced were different form the ones seen on trial C. The 20 trials were again
dominated by two different structures.
The two structures were identified by EVA as AV-7 (PDF 01-070-4195) and as AV-6, via a
zirconium analog (PDF 01-072-1911). Trial D1 was a clear example of AV-7 and D7 a pure form
of AV-6. From the remaining trials it was possible to see that AV-7 was the most favored
structure, even in the mixed phased compositions. This was an expected behavior since AV-7 has
been reported as a sodium and potassium tin silicate with a composition of
Na0.5K1.5Si3Sn1O9∙H2O. The precursor ratio of sodium and potassium favored the formation of
this structure because potassium was always present in higher quantities. As for AV-6, a
potassium tin silicate with a composition of K2Si3Sn1O9∙H2O, these were not the ideal
compositions for crystallization. However, just like in the previous reported papers [6, 28] its
formation can happen in a sodium and potassium chemical environment since sodium often
stays out of the silicate nucleus and therefore out of the structure. In fact the amount of sodium
present in the precursor was not decisive for the AV-6 formation. The lowest sodium trials
produced mainly AV-7, and AV-6 was produced in medium (K2O/Na2O=4 or 6 moles)
potassium/sodium ratios (check compositions on figure 7).
These two structures, AV-6 and AV-7, have a very similar formation mechanism since the
majority of the trials resulted in materials with mixed phases of these structures. Another
detected behavior was that as samples with lower crystallinity levels were the ones produced with
composition with the wither amounts of SnO2 (amounts superior to 1.5 moles). This happened
due to the pH decrease, caused by SnCl2 addition. This fact helped to understand that these two
structures were favored by a high pH environment.
The described synthesis of AV-6 and AV-7 are with 50% faster than the reported synthesis
approaches which is a significant step towards the optimization of their production at lower cost.
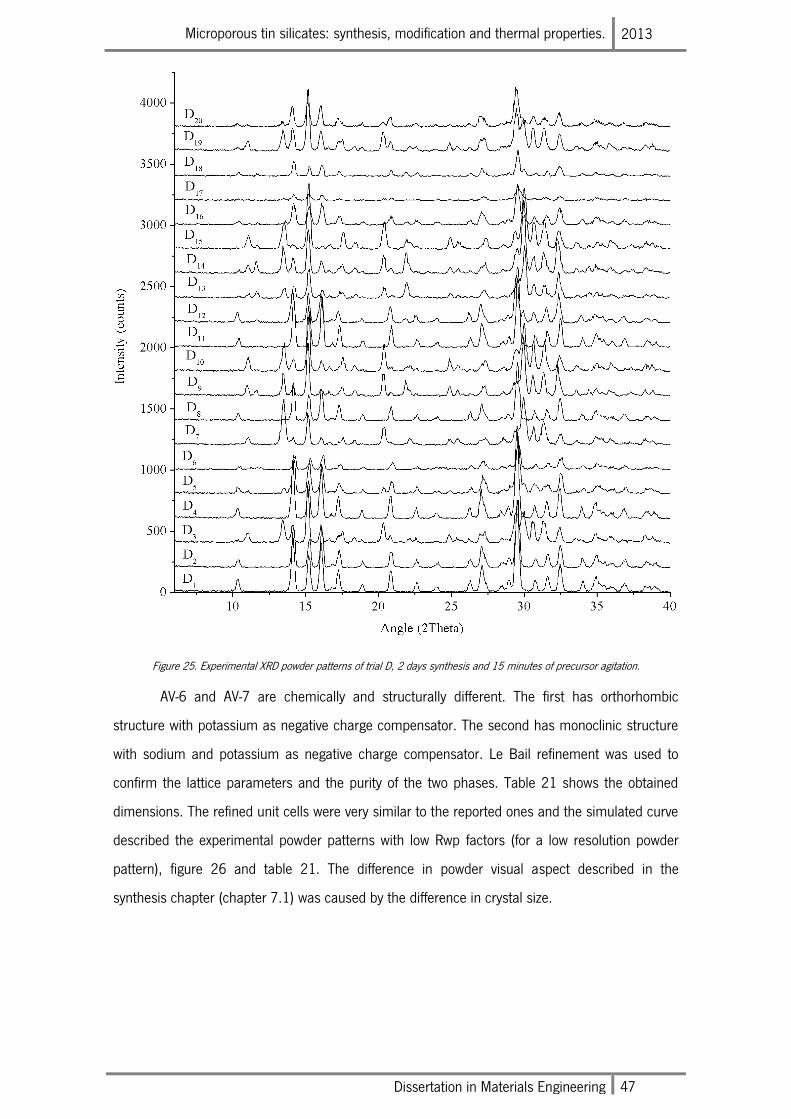
Microporous tin silicates: synthesis, modification and thermal properties. 2013
Dissertation in Materials Engineering 47
Figure 25. Experimental XRD powder patterns of trial D, 2 days synthesis and 15 minutes of precursor agitation.
AV-6 and AV-7 are chemically and structurally different. The first has orthorhombic
structure with potassium as negative charge compensator. The second has monoclinic structure
with sodium and potassium as negative charge compensator. Le Bail refinement was used to
confirm the lattice parameters and the purity of the two phases. Table 21 shows the obtained
dimensions. The refined unit cells were very similar to the reported ones and the simulated curve
described the experimental powder patterns with low Rwp factors (for a low resolution powder
pattern), figure 26 and table 21. The difference in powder visual aspect described in the
synthesis chapter (chapter 7.1) was caused by the difference in crystal size.
2013 Microporous tin silicates: synthesis, modification and thermal properties.
48 Dissertation in Materials Engineering
Table 21. Refinement results of trial D1 and D7. Obtained by Le Bail with hkl data from AV-7 and AV-6.
Trial D1 represents AV-7 Trial D7 represents AV-6
Cell Type Monoclinic Cell Type Orthorhombic
Space Group P21/c Space Group P212121
a (Å) 6.45(2) a (Å) 10.14(9)
b (Å) 11.60(3) b (Å) 13.14 (9)
c (Å) 12.93(9) c (Å) 7.15(2)
β(O) 105.00(3) β(O) 90
Volume (Å3) 935.79(1) Volume (Å
3) 954.60(8)
Crystal size (nm) 60±1 Crystal size (nm) 37±1
Rwp 19.4(3) Rwp 26.2(9)
R-Bragg 3.6(6) R-Bragg 5.21(5)
Figure 26. Experimental and simulated curves of trials D1 (a) and D7 (b) extracted by Le Bail refinement.
SEM images of both crystalline materials, figure 27, showed the crystal morphology of
AV-6 and AV-7. In this case, AV-7 as composed of large crystal that grew in different directions
forming crosses cross-like and prismatic crystals and AV-6 grew as needle shaped crystals
stacked in every direction forming large agglomerates.
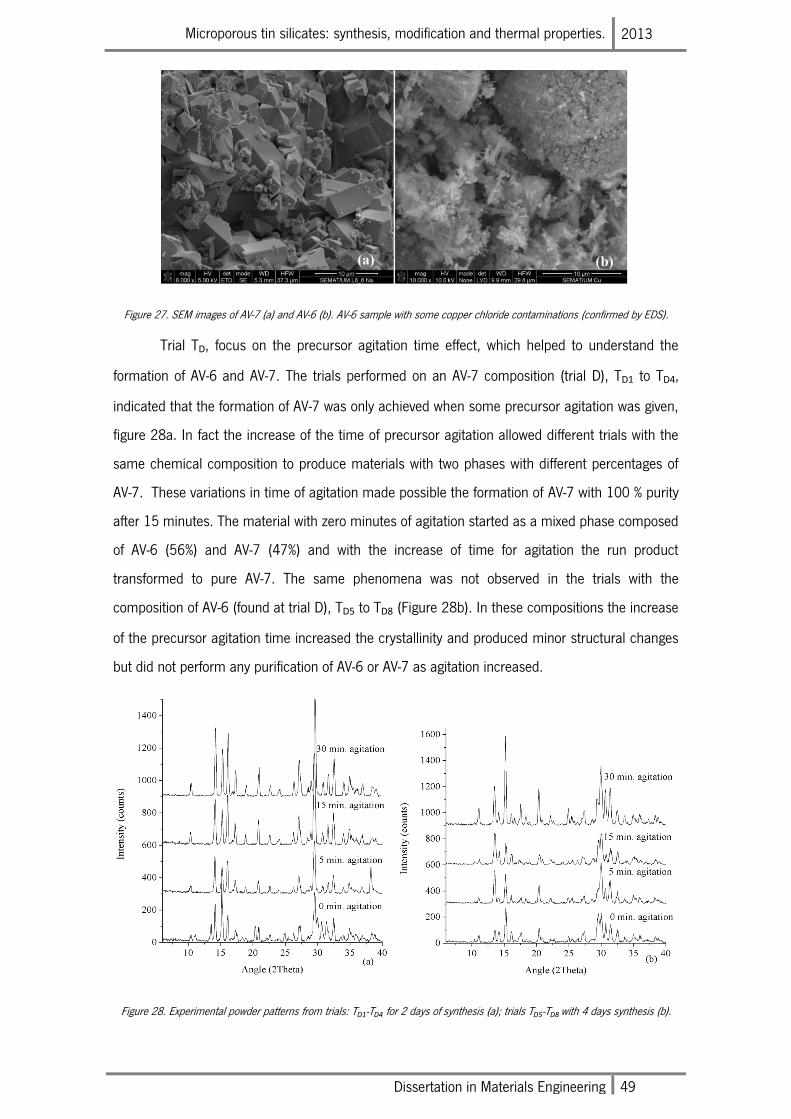
Microporous tin silicates: synthesis, modification and thermal properties. 2013
Dissertation in Materials Engineering 49
Figure 27. SEM images of AV-7 (a) and AV-6 (b). AV-6 sample with some copper chloride contaminations (confirmed by EDS).
Trial TD, focus on the precursor agitation time effect, which helped to understand the
formation of AV-6 and AV-7. The trials performed on an AV-7 composition (trial D), TD1 to TD4,
indicated that the formation of AV-7 was only achieved when some precursor agitation was given,
figure 28a. In fact the increase of the time of precursor agitation allowed different trials with the
same chemical composition to produce materials with two phases with different percentages of
AV-7. These variations in time of agitation made possible the formation of AV-7 with 100 % purity
after 15 minutes. The material with zero minutes of agitation started as a mixed phase composed
of AV-6 (56%) and AV-7 (47%) and with the increase of time for agitation the run product
transformed to pure AV-7. The same phenomena was not observed in the trials with the
composition of AV-6 (found at trial D), TD5 to TD8 (Figure 28b). In these compositions the increase
of the precursor agitation time increased the crystallinity and produced minor structural changes
but did not perform any purification of AV-6 or AV-7 as agitation increased.
Figure 28. Experimental powder patterns from trials: TD1-TD4 for 2 days of synthesis (a); trials TD5-TD8 with 4 days synthesis (b).
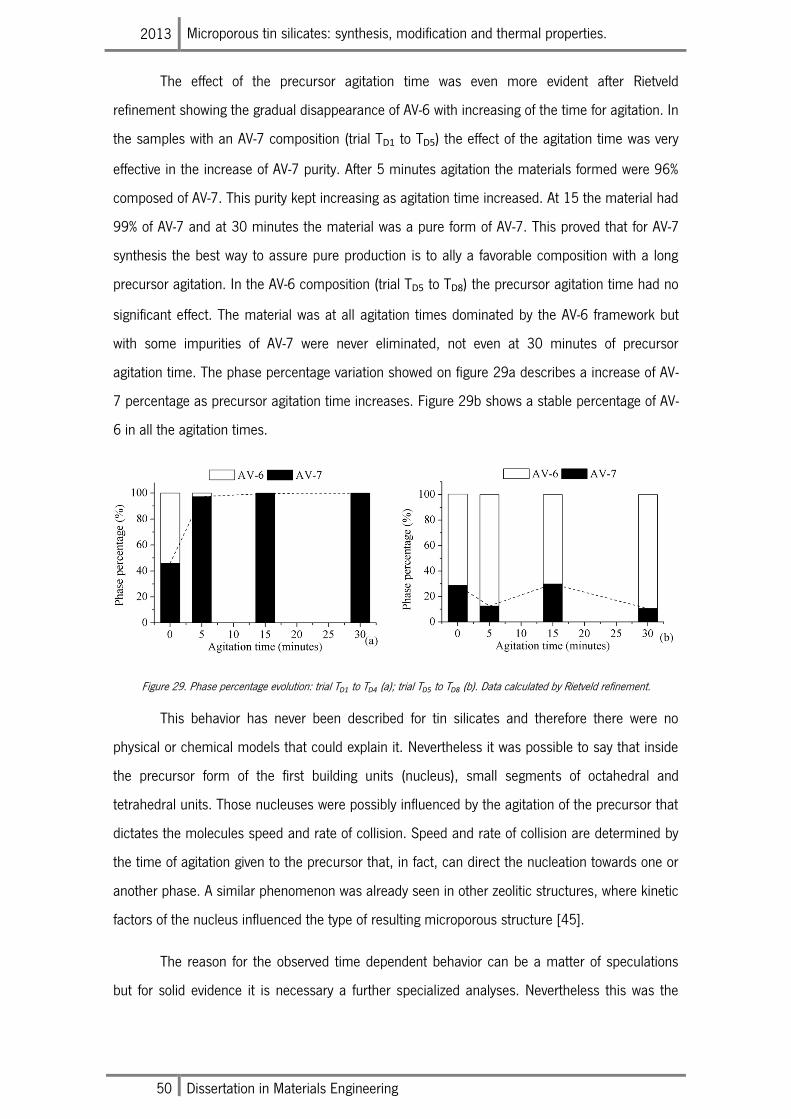
2013 Microporous tin silicates: synthesis, modification and thermal properties.
50 Dissertation in Materials Engineering
The effect of the precursor agitation time was even more evident after Rietveld
refinement showing the gradual disappearance of AV-6 with increasing of the time for agitation. In
the samples with an AV-7 composition (trial TD1 to TD5) the effect of the agitation time was very
effective in the increase of AV-7 purity. After 5 minutes agitation the materials formed were 96%
composed of AV-7. This purity kept increasing as agitation time increased. At 15 the material had
99% of AV-7 and at 30 minutes the material was a pure form of AV-7. This proved that for AV-7
synthesis the best way to assure pure production is to ally a favorable composition with a long
precursor agitation. In the AV-6 composition (trial TD5 to TD8) the precursor agitation time had no
significant effect. The material was at all agitation times dominated by the AV-6 framework but
with some impurities of AV-7 were never eliminated, not even at 30 minutes of precursor
agitation time. The phase percentage variation showed on figure 29a describes a increase of AV-
7 percentage as precursor agitation time increases. Figure 29b shows a stable percentage of AV-
6 in all the agitation times.
Figure 29. Phase percentage evolution: trial TD1 to TD4 (a); trial TD5 to TD8 (b). Data calculated by Rietveld refinement.
This behavior has never been described for tin silicates and therefore there were no
physical or chemical models that could explain it. Nevertheless it was possible to say that inside
the precursor form of the first building units (nucleus), small segments of octahedral and
tetrahedral units. Those nucleuses were possibly influenced by the agitation of the precursor that
dictates the molecules speed and rate of collision. Speed and rate of collision are determined by
the time of agitation given to the precursor that, in fact, can direct the nucleation towards one or
another phase. A similar phenomenon was already seen in other zeolitic structures, where kinetic
factors of the nucleus influenced the type of resulting microporous structure [45].
The reason for the observed time dependent behavior can be a matter of speculations
but for solid evidence it is necessary a further specialized analyses. Nevertheless this was the
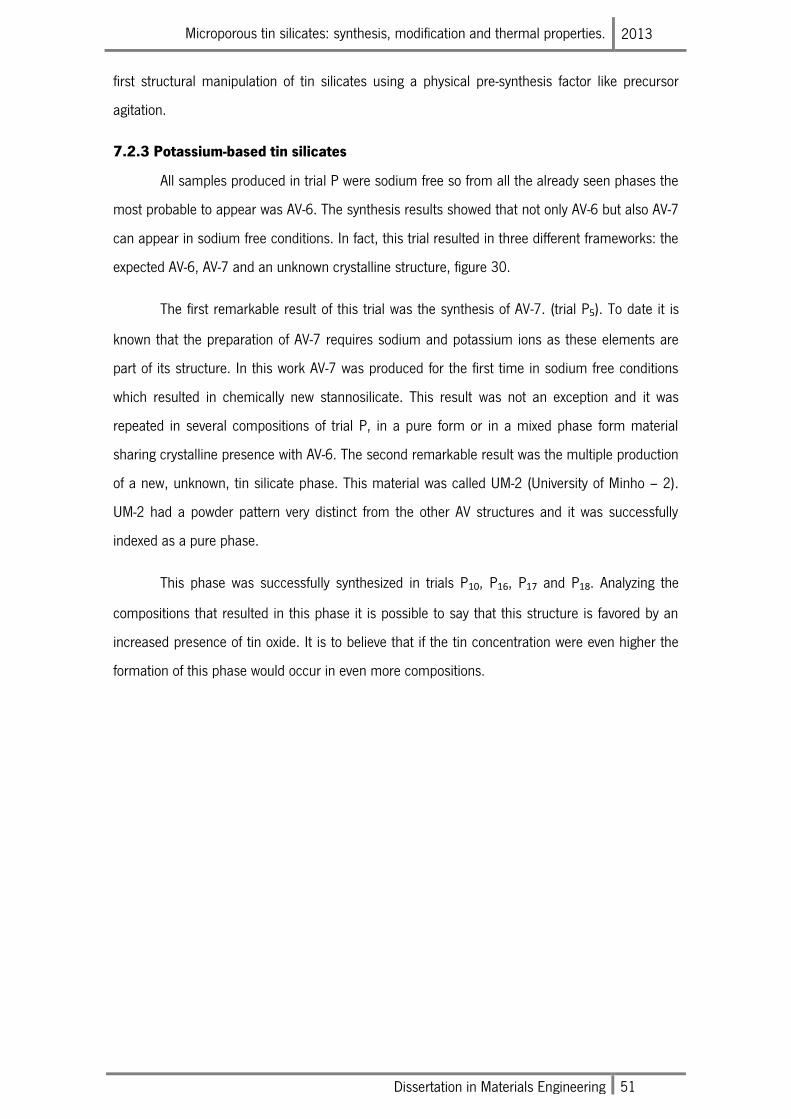
Microporous tin silicates: synthesis, modification and thermal properties. 2013
Dissertation in Materials Engineering 51
first structural manipulation of tin silicates using a physical pre-synthesis factor like precursor
agitation.
7.2.3 Potassium-based tin silicates
All samples produced in trial P were sodium free so from all the already seen phases the
most probable to appear was AV-6. The synthesis results showed that not only AV-6 but also AV-7
can appear in sodium free conditions. In fact, this trial resulted in three different frameworks: the
expected AV-6, AV-7 and an unknown crystalline structure, figure 30.
The first remarkable result of this trial was the synthesis of AV-7. (trial P5). To date it is
known that the preparation of AV-7 requires sodium and potassium ions as these elements are
part of its structure. In this work AV-7 was produced for the first time in sodium free conditions
which resulted in chemically new stannosilicate. This result was not an exception and it was
repeated in several compositions of trial P, in a pure form or in a mixed phase form material
sharing crystalline presence with AV-6. The second remarkable result was the multiple production
of a new, unknown, tin silicate phase. This material was called UM-2 (University of Minho – 2).
UM-2 had a powder pattern very distinct from the other AV structures and it was successfully
indexed as a pure phase.
This phase was successfully synthesized in trials P10, P16, P17 and P18. Analyzing the
compositions that resulted in this phase it is possible to say that this structure is favored by an
increased presence of tin oxide. It is to believe that if the tin concentration were even higher the
formation of this phase would occur in even more compositions.
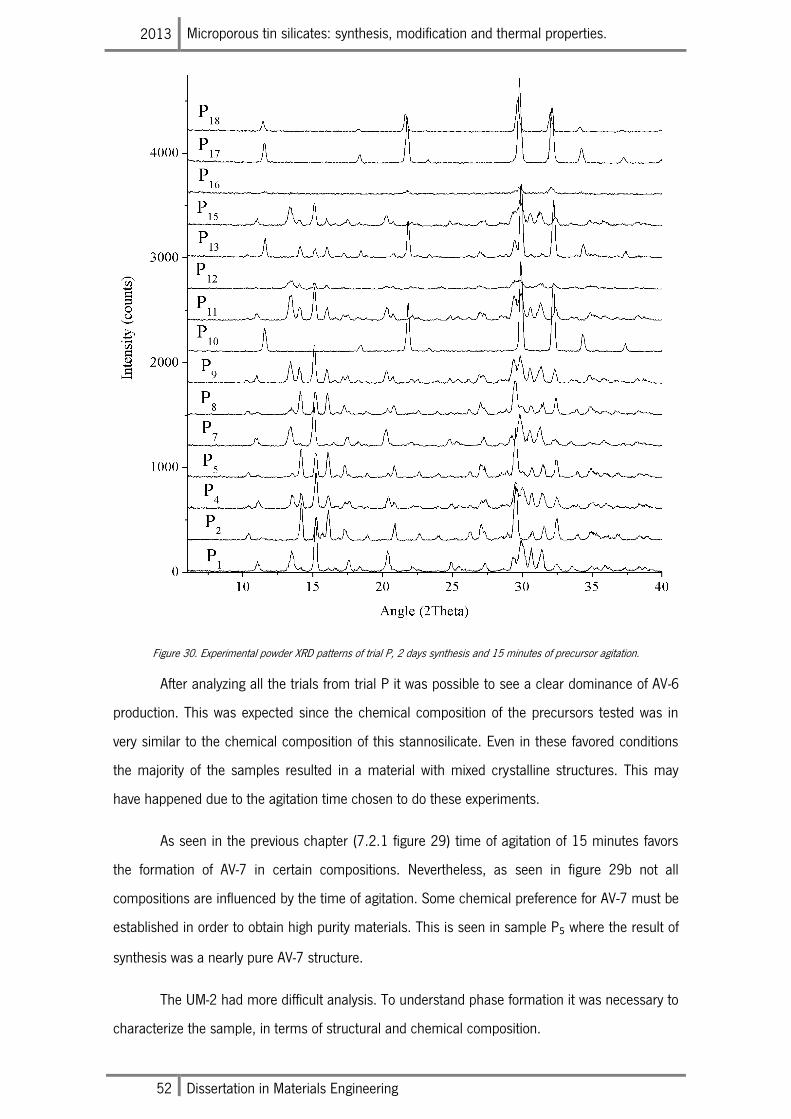
2013 Microporous tin silicates: synthesis, modification and thermal properties.
52 Dissertation in Materials Engineering
Figure 30. Experimental powder XRD patterns of trial P, 2 days synthesis and 15 minutes of precursor agitation.
After analyzing all the trials from trial P it was possible to see a clear dominance of AV-6
production. This was expected since the chemical composition of the precursors tested was in
very similar to the chemical composition of this stannosilicate. Even in these favored conditions
the majority of the samples resulted in a material with mixed crystalline structures. This may
have happened due to the agitation time chosen to do these experiments.
As seen in the previous chapter (7.2.1 figure 29) time of agitation of 15 minutes favors
the formation of AV-7 in certain compositions. Nevertheless, as seen in figure 29b not all
compositions are influenced by the time of agitation. Some chemical preference for AV-7 must be
established in order to obtain high purity materials. This is seen in sample P5 where the result of
synthesis was a nearly pure AV-7 structure.
The UM-2 had more difficult analysis. To understand phase formation it was necessary to
characterize the sample, in terms of structural and chemical composition.
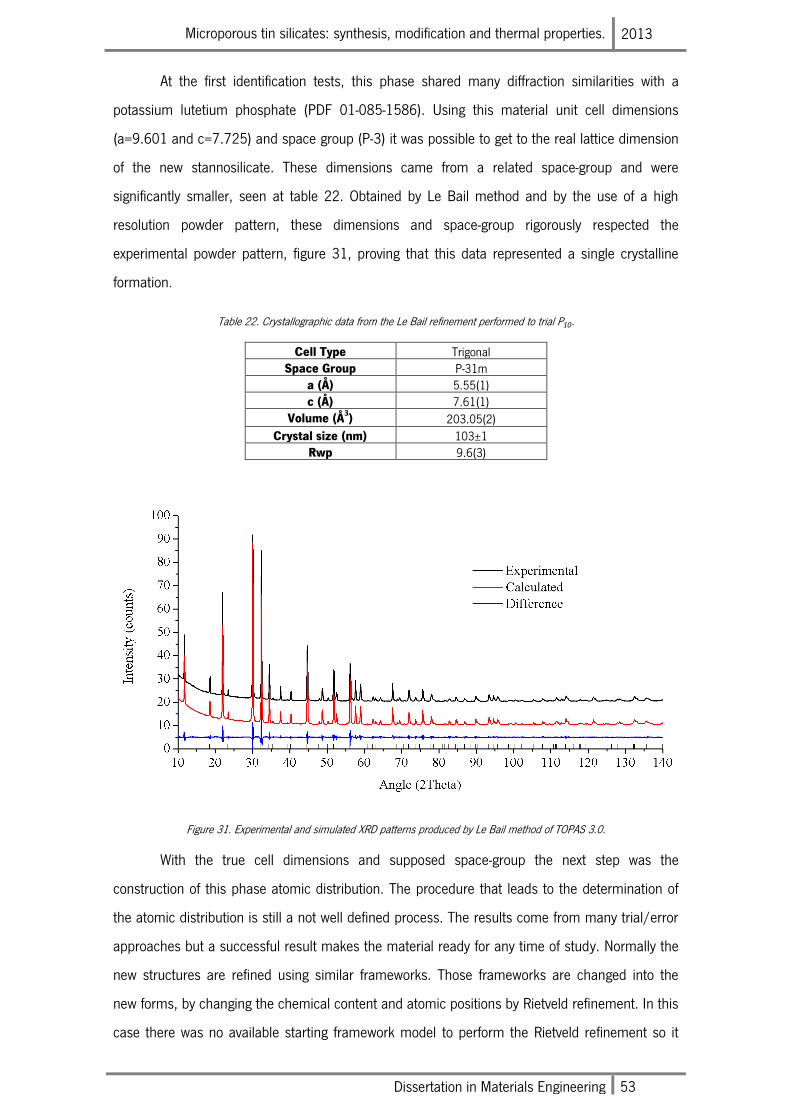
Microporous tin silicates: synthesis, modification and thermal properties. 2013
Dissertation in Materials Engineering 53
At the first identification tests, this phase shared many diffraction similarities with a
potassium lutetium phosphate (PDF 01-085-1586). Using this material unit cell dimensions
(a=9.601 and c=7.725) and space group (P-3) it was possible to get to the real lattice dimension
of the new stannosilicate. These dimensions came from a related space-group and were
significantly smaller, seen at table 22. Obtained by Le Bail method and by the use of a high
resolution powder pattern, these dimensions and space-group rigorously respected the
experimental powder pattern, figure 31, proving that this data represented a single crystalline
formation.
Table 22. Crystallographic data from the Le Bail refinement performed to trial P10.
Cell Type Trigonal Space Group P-31m
a (Å) 5.55(1) c (Å) 7.61(1)
Volume (Å3) 203.05(2)
Crystal size (nm) 103±1 Rwp 9.6(3)
Figure 31. Experimental and simulated XRD patterns produced by Le Bail method of TOPAS 3.0.
With the true cell dimensions and supposed space-group the next step was the
construction of this phase atomic distribution. The procedure that leads to the determination of
the atomic distribution is still a not well defined process. The results come from many trial/error
approaches but a successful result makes the material ready for any time of study. Normally the
new structures are refined using similar frameworks. Those frameworks are changed into the
new forms, by changing the chemical content and atomic positions by Rietveld refinement. In this
case there was no available starting framework model to perform the Rietveld refinement so it
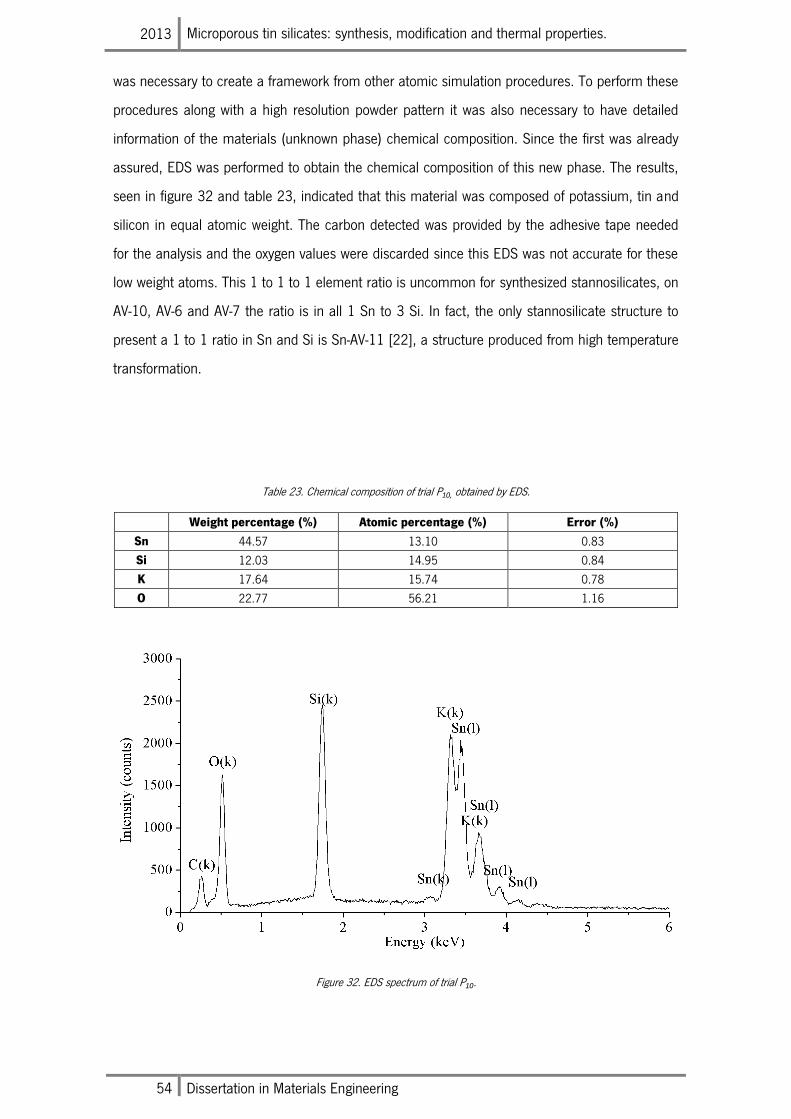
2013 Microporous tin silicates: synthesis, modification and thermal properties.
54 Dissertation in Materials Engineering
was necessary to create a framework from other atomic simulation procedures. To perform these
procedures along with a high resolution powder pattern it was also necessary to have detailed
information of the materials (unknown phase) chemical composition. Since the first was already
assured, EDS was performed to obtain the chemical composition of this new phase. The results,
seen in figure 32 and table 23, indicated that this material was composed of potassium, tin and
silicon in equal atomic weight. The carbon detected was provided by the adhesive tape needed
for the analysis and the oxygen values were discarded since this EDS was not accurate for these
low weight atoms. This 1 to 1 to 1 element ratio is uncommon for synthesized stannosilicates, on
AV-10, AV-6 and AV-7 the ratio is in all 1 Sn to 3 Si. In fact, the only stannosilicate structure to
present a 1 to 1 ratio in Sn and Si is Sn-AV-11 [22], a structure produced from high temperature
transformation.
Table 23. Chemical composition of trial P10, obtained by EDS.
Weight percentage (%) Atomic percentage (%) Error (%)
Sn 44.57 13.10 0.83
Si 12.03 14.95 0.84
K 17.64 15.74 0.78
O 22.77 56.21 1.16
Figure 32. EDS spectrum of trial P10.
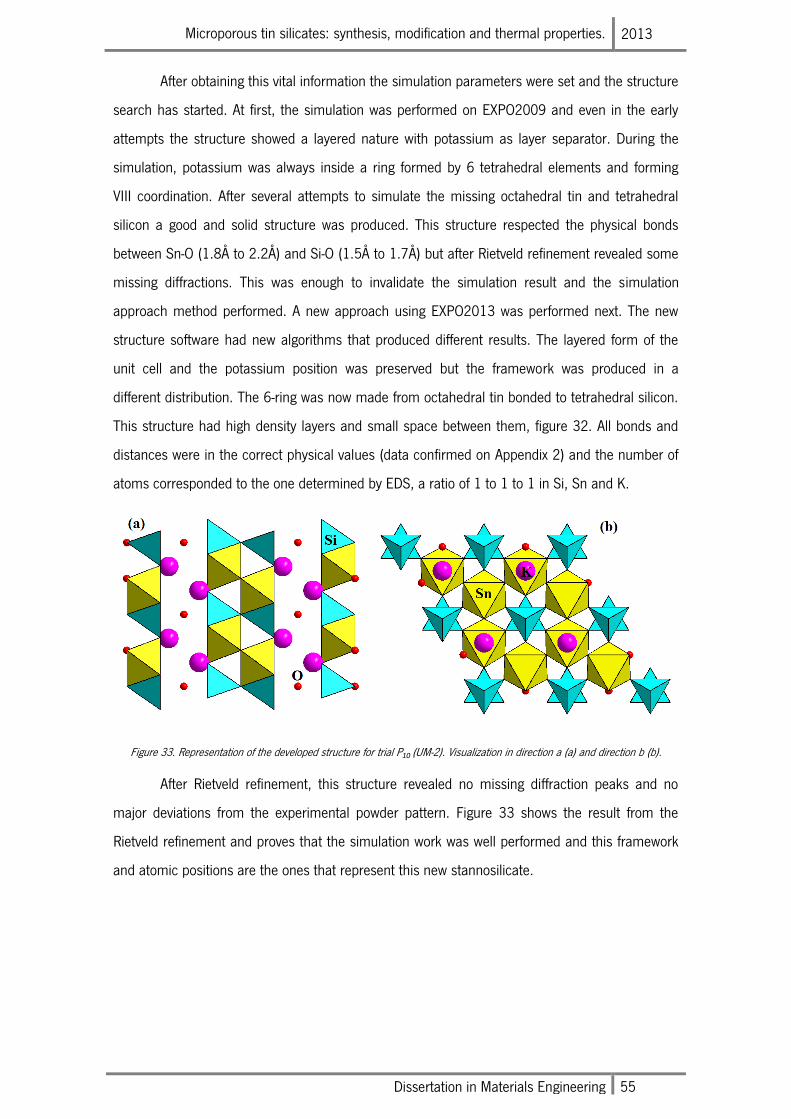
Microporous tin silicates: synthesis, modification and thermal properties. 2013
Dissertation in Materials Engineering 55
After obtaining this vital information the simulation parameters were set and the structure
search has started. At first, the simulation was performed on EXPO2009 and even in the early
attempts the structure showed a layered nature with potassium as layer separator. During the
simulation, potassium was always inside a ring formed by 6 tetrahedral elements and forming
VIII coordination. After several attempts to simulate the missing octahedral tin and tetrahedral
silicon a good and solid structure was produced. This structure respected the physical bonds
between Sn-O (1.8Å to 2.2Å) and Si-O (1.5Å to 1.7Å) but after Rietveld refinement revealed some
missing diffractions. This was enough to invalidate the simulation result and the simulation
approach method performed. A new approach using EXPO2013 was performed next. The new
structure software had new algorithms that produced different results. The layered form of the
unit cell and the potassium position was preserved but the framework was produced in a
different distribution. The 6-ring was now made from octahedral tin bonded to tetrahedral silicon.
This structure had high density layers and small space between them, figure 32. All bonds and
distances were in the correct physical values (data confirmed on Appendix 2) and the number of
atoms corresponded to the one determined by EDS, a ratio of 1 to 1 to 1 in Si, Sn and K.
Figure 33. Representation of the developed structure for trial P10 (UM-2). Visualization in direction a (a) and direction b (b).
After Rietveld refinement, this structure revealed no missing diffraction peaks and no
major deviations from the experimental powder pattern. Figure 33 shows the result from the
Rietveld refinement and proves that the simulation work was well performed and this framework
and atomic positions are the ones that represent this new stannosilicate.
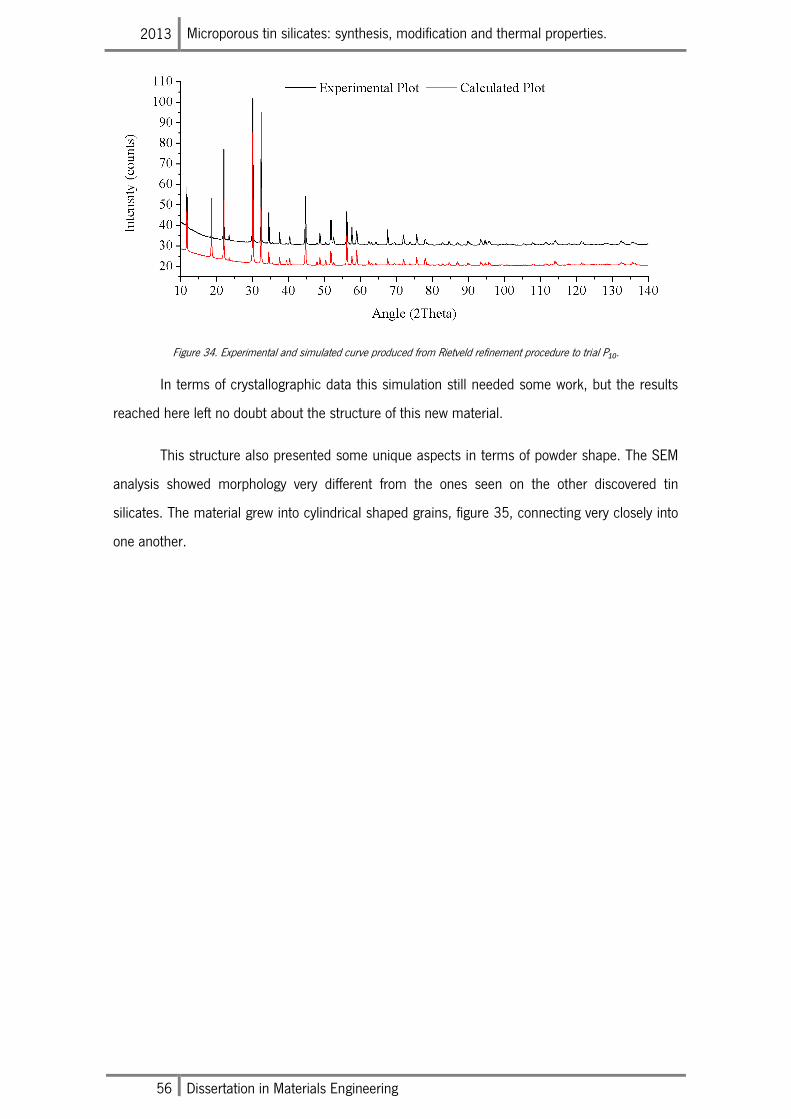
2013 Microporous tin silicates: synthesis, modification and thermal properties.
56 Dissertation in Materials Engineering
Figure 34. Experimental and simulated curve produced from Rietveld refinement procedure to trial P10.
In terms of crystallographic data this simulation still needed some work, but the results
reached here left no doubt about the structure of this new material.
This structure also presented some unique aspects in terms of powder shape. The SEM
analysis showed morphology very different from the ones seen on the other discovered tin
silicates. The material grew into cylindrical shaped grains, figure 35, connecting very closely into
one another.
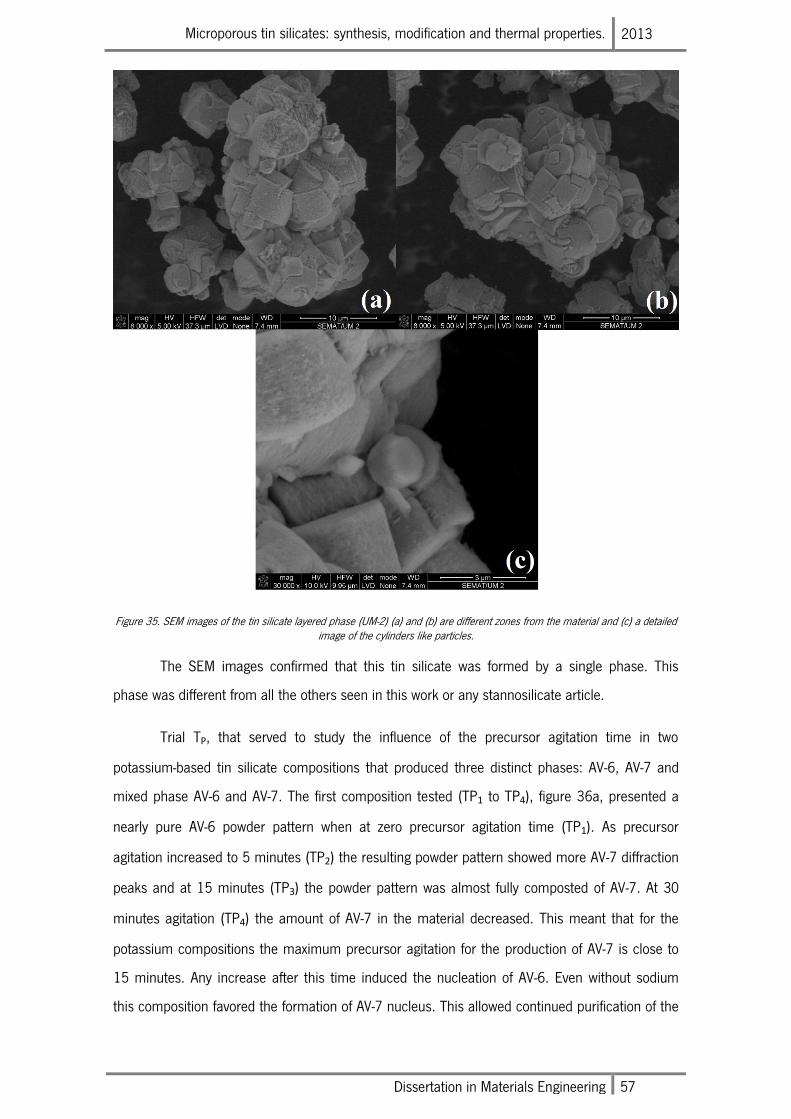
Microporous tin silicates: synthesis, modification and thermal properties. 2013
Dissertation in Materials Engineering 57
Figure 35. SEM images of the tin silicate layered phase (UM-2) (a) and (b) are different zones from the material and (c) a detailed image of the cylinders like particles.
The SEM images confirmed that this tin silicate was formed by a single phase. This
phase was different from all the others seen in this work or any stannosilicate article.
Trial TP, that served to study the influence of the precursor agitation time in two
potassium-based tin silicate compositions that produced three distinct phases: AV-6, AV-7 and
mixed phase AV-6 and AV-7. The first composition tested (TP1 to TP4), figure 36a, presented a
nearly pure AV-6 powder pattern when at zero precursor agitation time (TP1). As precursor
agitation increased to 5 minutes (TP2) the resulting powder pattern showed more AV-7 diffraction
peaks and at 15 minutes (TP3) the powder pattern was almost fully composted of AV-7. At 30
minutes agitation (TP4) the amount of AV-7 in the material decreased. This meant that for the
potassium compositions the maximum precursor agitation for the production of AV-7 is close to
15 minutes. Any increase after this time induced the nucleation of AV-6. Even without sodium
this composition favored the formation of AV-7 nucleus. This allowed continued purification of the
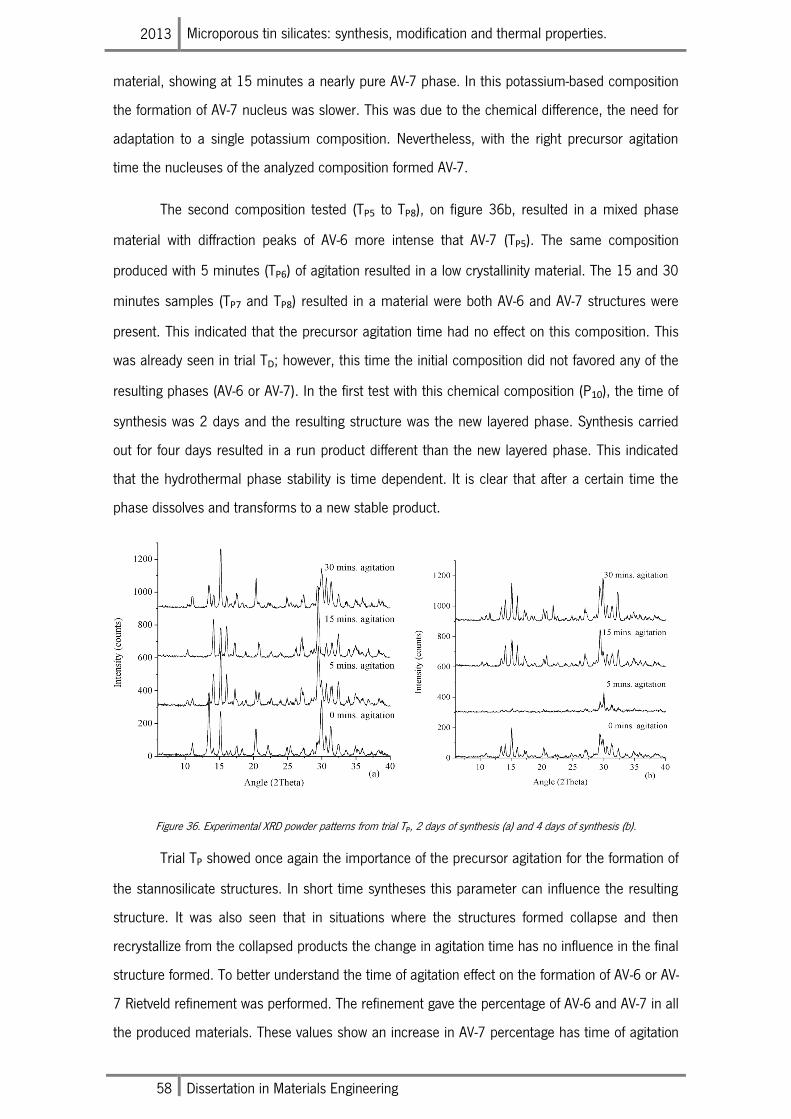
2013 Microporous tin silicates: synthesis, modification and thermal properties.
58 Dissertation in Materials Engineering
material, showing at 15 minutes a nearly pure AV-7 phase. In this potassium-based composition
the formation of AV-7 nucleus was slower. This was due to the chemical difference, the need for
adaptation to a single potassium composition. Nevertheless, with the right precursor agitation
time the nucleuses of the analyzed composition formed AV-7.
The second composition tested (TP5 to TP8), on figure 36b, resulted in a mixed phase
material with diffraction peaks of AV-6 more intense that AV-7 (TP5). The same composition
produced with 5 minutes (TP6) of agitation resulted in a low crystallinity material. The 15 and 30
minutes samples (TP7 and TP8) resulted in a material were both AV-6 and AV-7 structures were
present. This indicated that the precursor agitation time had no effect on this composition. This
was already seen in trial TD; however, this time the initial composition did not favored any of the
resulting phases (AV-6 or AV-7). In the first test with this chemical composition (P10), the time of
synthesis was 2 days and the resulting structure was the new layered phase. Synthesis carried
out for four days resulted in a run product different than the new layered phase. This indicated
that the hydrothermal phase stability is time dependent. It is clear that after a certain time the
phase dissolves and transforms to a new stable product.
Figure 36. Experimental XRD powder patterns from trial TP, 2 days of synthesis (a) and 4 days of synthesis (b).
Trial TP showed once again the importance of the precursor agitation for the formation of
the stannosilicate structures. In short time syntheses this parameter can influence the resulting
structure. It was also seen that in situations where the structures formed collapse and then
recrystallize from the collapsed products the change in agitation time has no influence in the final
structure formed. To better understand the time of agitation effect on the formation of AV-6 or AV-
7 Rietveld refinement was performed. The refinement gave the percentage of AV-6 and AV-7 in all
the produced materials. These values show an increase in AV-7 percentage has time of agitation
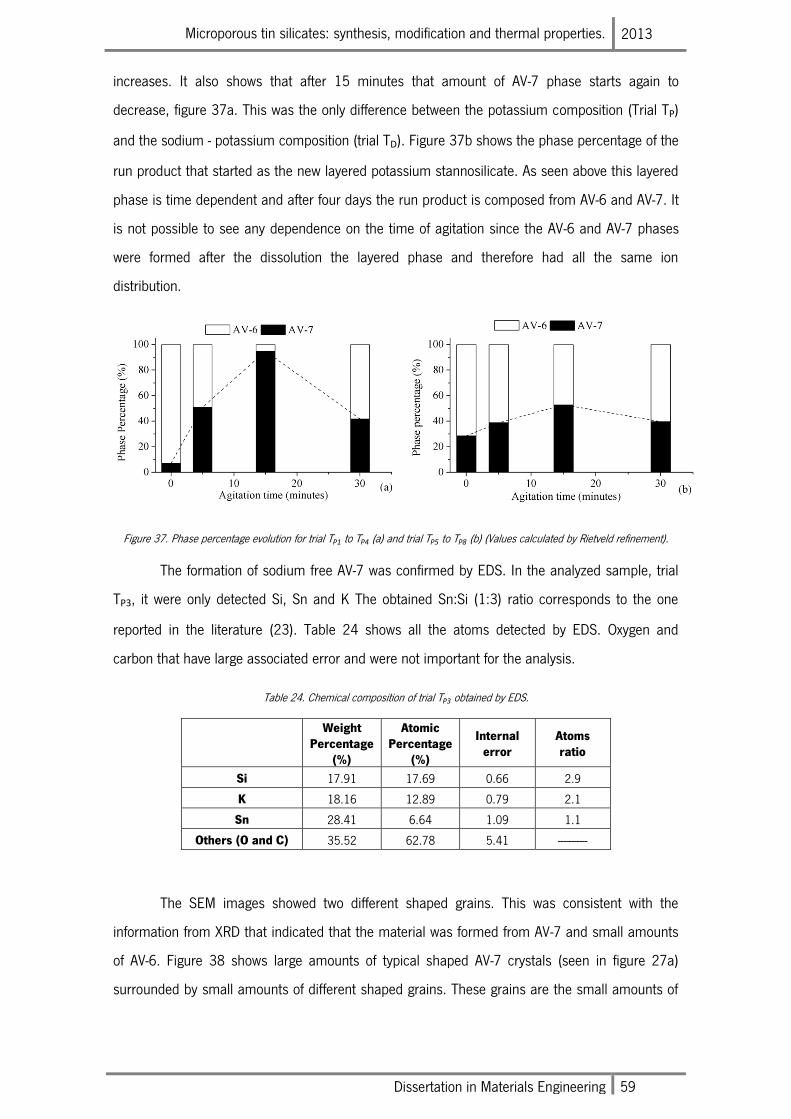
Microporous tin silicates: synthesis, modification and thermal properties. 2013
Dissertation in Materials Engineering 59
increases. It also shows that after 15 minutes that amount of AV-7 phase starts again to
decrease, figure 37a. This was the only difference between the potassium composition (Trial TP)
and the sodium - potassium composition (trial TD). Figure 37b shows the phase percentage of the
run product that started as the new layered potassium stannosilicate. As seen above this layered
phase is time dependent and after four days the run product is composed from AV-6 and AV-7. It
is not possible to see any dependence on the time of agitation since the AV-6 and AV-7 phases
were formed after the dissolution the layered phase and therefore had all the same ion
distribution.
Figure 37. Phase percentage evolution for trial TP1 to TP4 (a) and trial TP5 to TP8 (b) (Values calculated by Rietveld refinement).
The formation of sodium free AV-7 was confirmed by EDS. In the analyzed sample, trial
TP3, it were only detected Si, Sn and K The obtained Sn:Si (1:3) ratio corresponds to the one
reported in the literature (23). Table 24 shows all the atoms detected by EDS. Oxygen and
carbon that have large associated error and were not important for the analysis.
Table 24. Chemical composition of trial TP3 obtained by EDS.
Weight Percentage
(%)
Atomic Percentage
(%)
Internal error
Atoms ratio
Si 17.91 17.69 0.66 2.9
K 18.16 12.89 0.79 2.1
Sn 28.41 6.64 1.09 1.1
Others (O and C) 35.52 62.78 5.41 -----------
The SEM images showed two different shaped grains. This was consistent with the
information from XRD that indicated that the material was formed from AV-7 and small amounts
of AV-6. Figure 38 shows large amounts of typical shaped AV-7 crystals (seen in figure 27a)
surrounded by small amounts of different shaped grains. These grains are the small amounts of
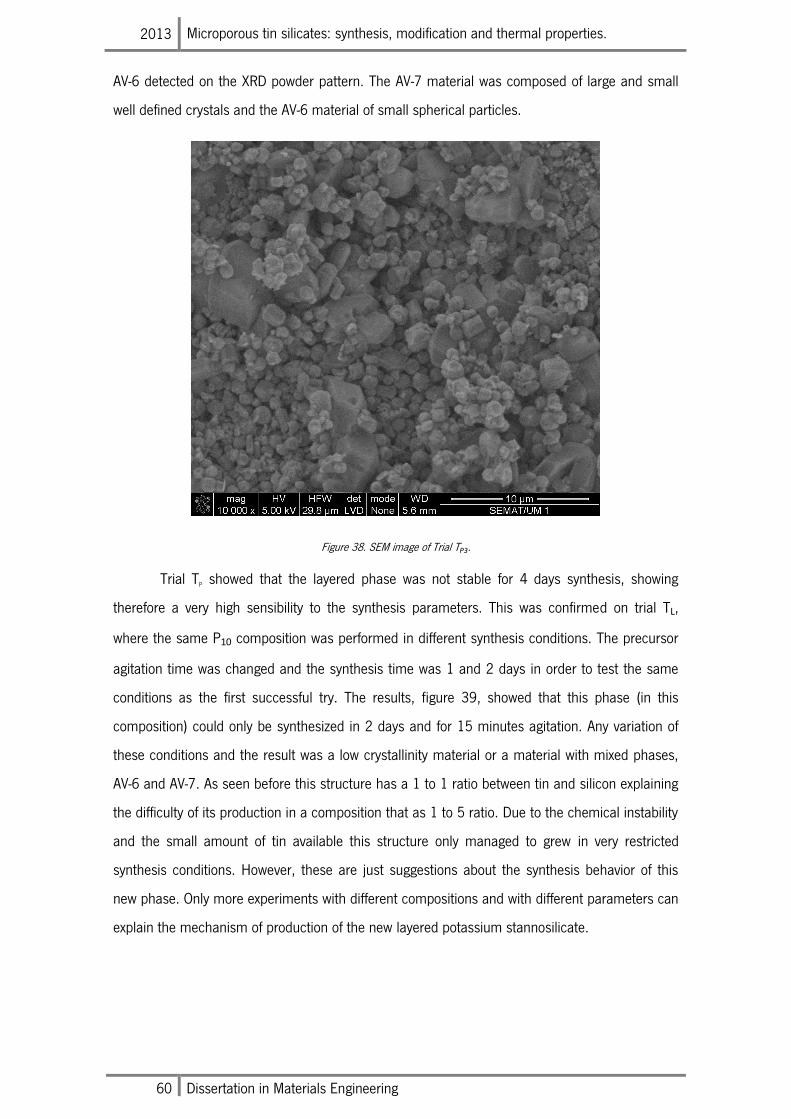
2013 Microporous tin silicates: synthesis, modification and thermal properties.
60 Dissertation in Materials Engineering
AV-6 detected on the XRD powder pattern. The AV-7 material was composed of large and small
well defined crystals and the AV-6 material of small spherical particles.
Figure 38. SEM image of Trial TP3.
Trial TP showed that the layered phase was not stable for 4 days synthesis, showing
therefore a very high sensibility to the synthesis parameters. This was confirmed on trial TL,
where the same P10 composition was performed in different synthesis conditions. The precursor
agitation time was changed and the synthesis time was 1 and 2 days in order to test the same
conditions as the first successful try. The results, figure 39, showed that this phase (in this
composition) could only be synthesized in 2 days and for 15 minutes agitation. Any variation of
these conditions and the result was a low crystallinity material or a material with mixed phases,
AV-6 and AV-7. As seen before this structure has a 1 to 1 ratio between tin and silicon explaining
the difficulty of its production in a composition that as 1 to 5 ratio. Due to the chemical instability
and the small amount of tin available this structure only managed to grew in very restricted
synthesis conditions. However, these are just suggestions about the synthesis behavior of this
new phase. Only more experiments with different compositions and with different parameters can
explain the mechanism of production of the new layered potassium stannosilicate.
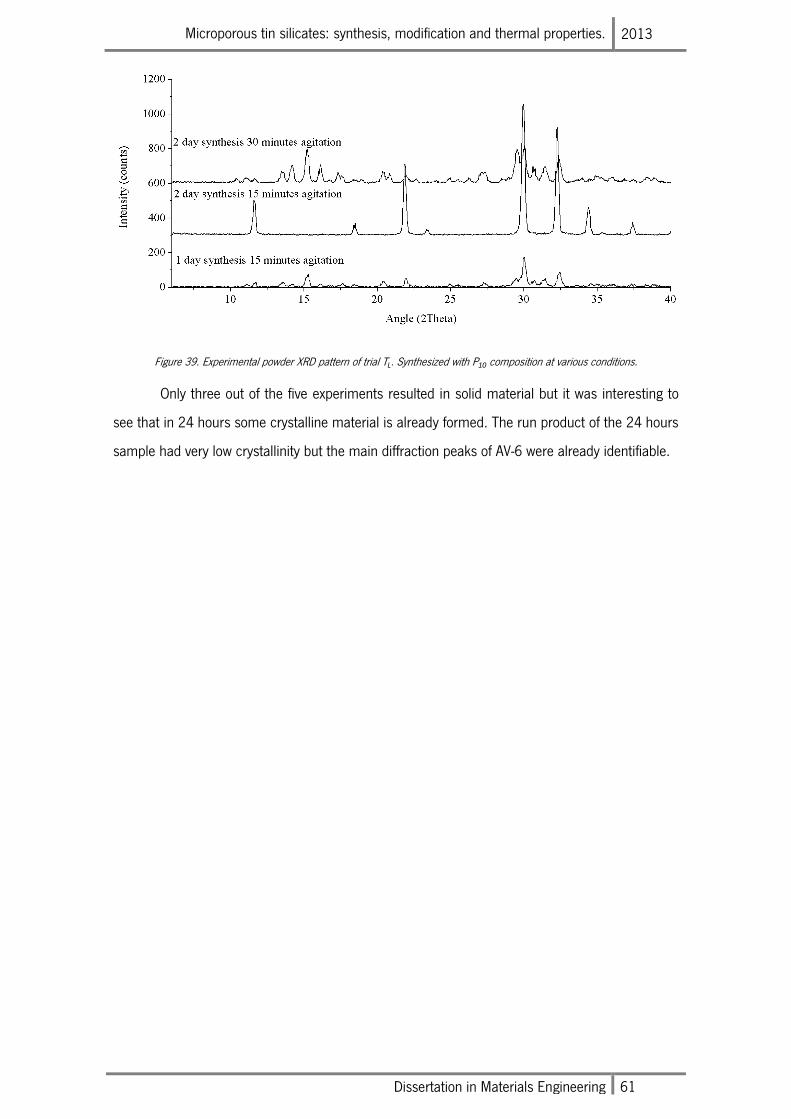
Microporous tin silicates: synthesis, modification and thermal properties. 2013
Dissertation in Materials Engineering 61
Figure 39. Experimental powder XRD pattern of trial TL. Synthesized with P10 composition at various conditions.
Only three out of the five experiments resulted in solid material but it was interesting to
see that in 24 hours some crystalline material is already formed. The run product of the 24 hours
sample had very low crystallinity but the main diffraction peaks of AV-6 were already identifiable.
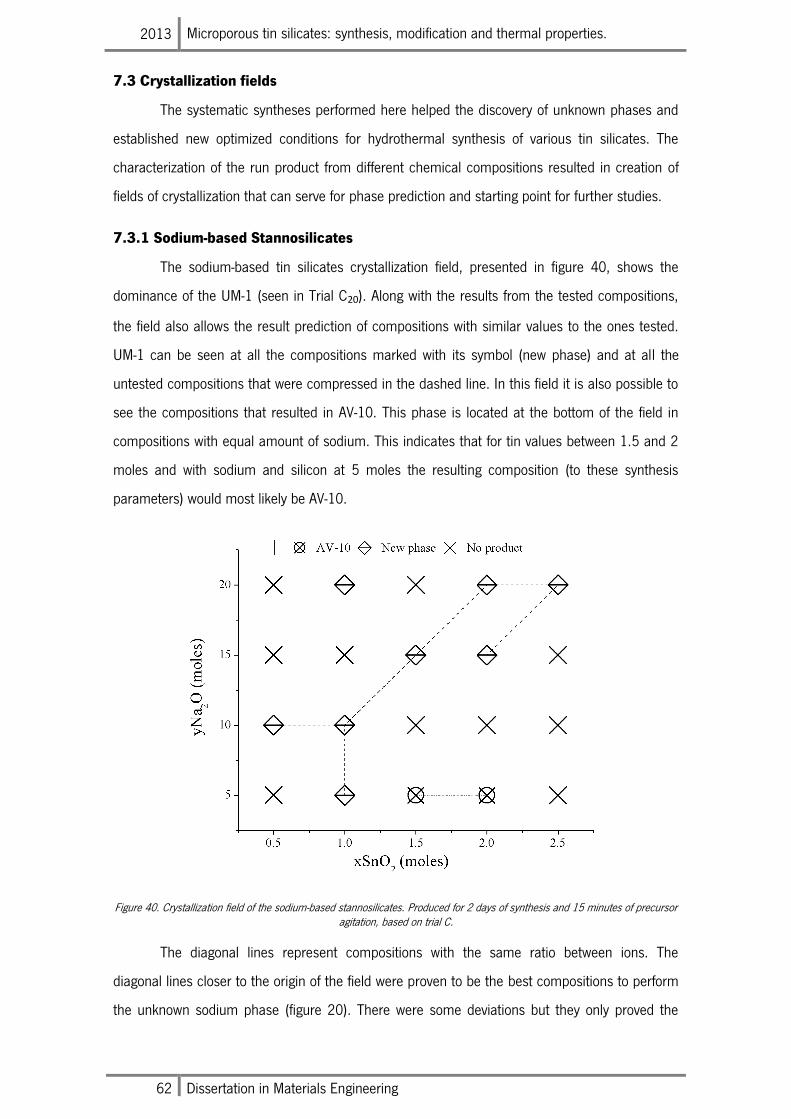
2013 Microporous tin silicates: synthesis, modification and thermal properties.
62 Dissertation in Materials Engineering
7.3 Crystallization fields
The systematic syntheses performed here helped the discovery of unknown phases and
established new optimized conditions for hydrothermal synthesis of various tin silicates. The
characterization of the run product from different chemical compositions resulted in creation of
fields of crystallization that can serve for phase prediction and starting point for further studies.
7.3.1 Sodium-based Stannosilicates
The sodium-based tin silicates crystallization field, presented in figure 40, shows the
dominance of the UM-1 (seen in Trial C20). Along with the results from the tested compositions,
the field also allows the result prediction of compositions with similar values to the ones tested.
UM-1 can be seen at all the compositions marked with its symbol (new phase) and at all the
untested compositions that were compressed in the dashed line. In this field it is also possible to
see the compositions that resulted in AV-10. This phase is located at the bottom of the field in
compositions with equal amount of sodium. This indicates that for tin values between 1.5 and 2
moles and with sodium and silicon at 5 moles the resulting composition (to these synthesis
parameters) would most likely be AV-10.
Figure 40. Crystallization field of the sodium-based stannosilicates. Produced for 2 days of synthesis and 15 minutes of precursor agitation, based on trial C.
The diagonal lines represent compositions with the same ratio between ions. The
diagonal lines closer to the origin of the field were proven to be the best compositions to perform
the unknown sodium phase (figure 20). There were some deviations but they only proved the
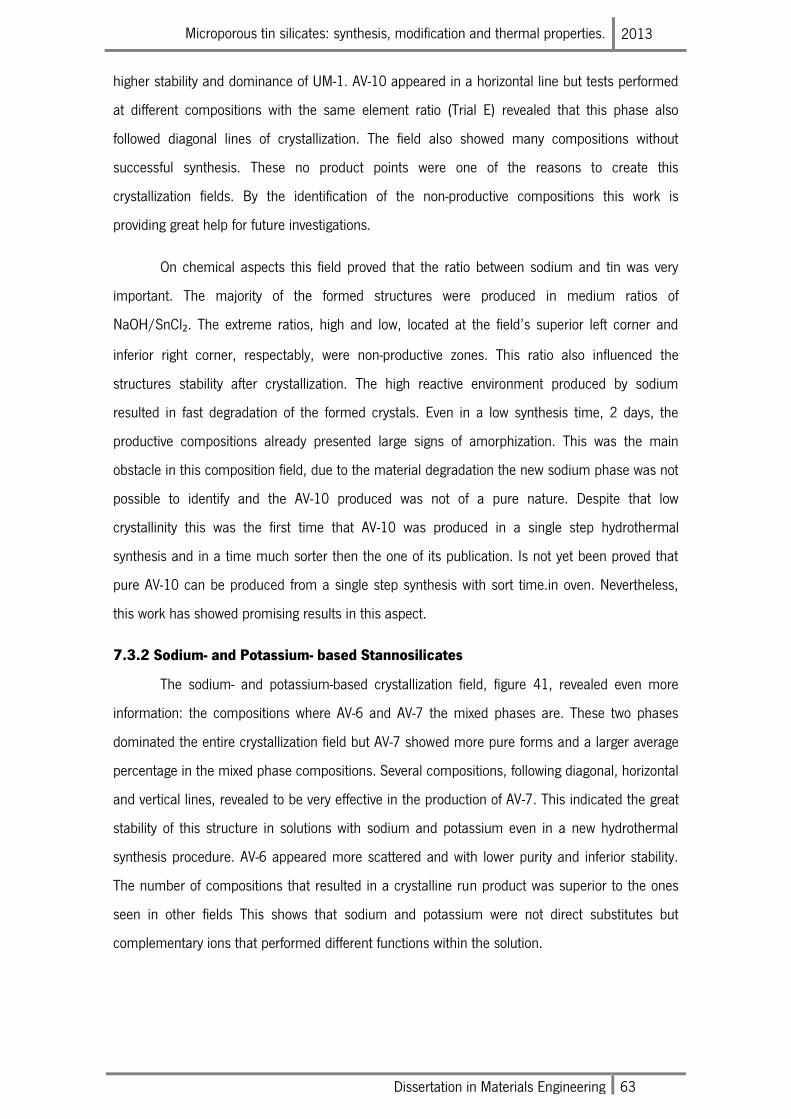
Microporous tin silicates: synthesis, modification and thermal properties. 2013
Dissertation in Materials Engineering 63
higher stability and dominance of UM-1. AV-10 appeared in a horizontal line but tests performed
at different compositions with the same element ratio (Trial E) revealed that this phase also
followed diagonal lines of crystallization. The field also showed many compositions without
successful synthesis. These no product points were one of the reasons to create this
crystallization fields. By the identification of the non-productive compositions this work is
providing great help for future investigations.
On chemical aspects this field proved that the ratio between sodium and tin was very
important. The majority of the formed structures were produced in medium ratios of
NaOH/SnCl2. The extreme ratios, high and low, located at the field’s superior left corner and
inferior right corner, respectably, were non-productive zones. This ratio also influenced the
structures stability after crystallization. The high reactive environment produced by sodium
resulted in fast degradation of the formed crystals. Even in a low synthesis time, 2 days, the
productive compositions already presented large signs of amorphization. This was the main
obstacle in this composition field, due to the material degradation the new sodium phase was not
possible to identify and the AV-10 produced was not of a pure nature. Despite that low
crystallinity this was the first time that AV-10 was produced in a single step hydrothermal
synthesis and in a time much sorter then the one of its publication. Is not yet been proved that
pure AV-10 can be produced from a single step synthesis with sort time.in oven. Nevertheless,
this work has showed promising results in this aspect.
7.3.2 Sodium- and Potassium- based Stannosilicates
The sodium- and potassium-based crystallization field, figure 41, revealed even more
information: the compositions where AV-6 and AV-7 the mixed phases are. These two phases
dominated the entire crystallization field but AV-7 showed more pure forms and a larger average
percentage in the mixed phase compositions. Several compositions, following diagonal, horizontal
and vertical lines, revealed to be very effective in the production of AV-7. This indicated the great
stability of this structure in solutions with sodium and potassium even in a new hydrothermal
synthesis procedure. AV-6 appeared more scattered and with lower purity and inferior stability.
The number of compositions that resulted in a crystalline run product was superior to the ones
seen in other fields This shows that sodium and potassium were not direct substitutes but
complementary ions that performed different functions within the solution.
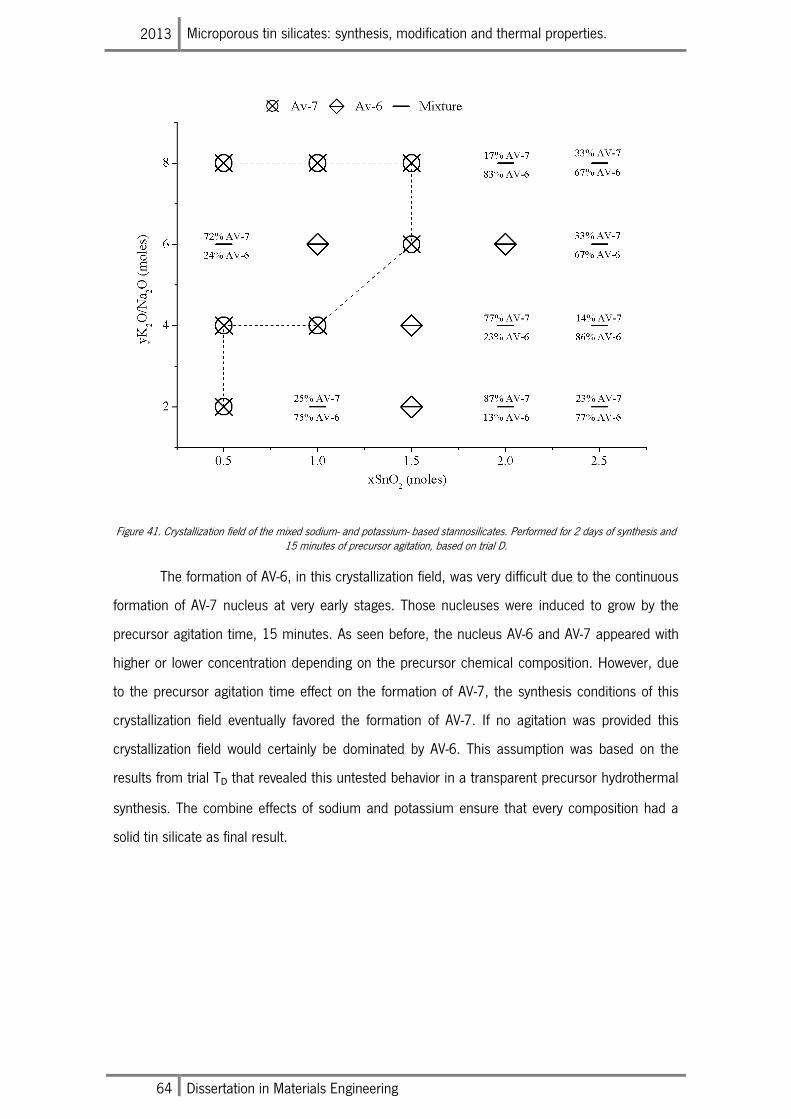
2013 Microporous tin silicates: synthesis, modification and thermal properties.
64 Dissertation in Materials Engineering
Figure 41. Crystallization field of the mixed sodium- and potassium- based stannosilicates. Performed for 2 days of synthesis and 15 minutes of precursor agitation, based on trial D.
The formation of AV-6, in this crystallization field, was very difficult due to the continuous
formation of AV-7 nucleus at very early stages. Those nucleuses were induced to grow by the
precursor agitation time, 15 minutes. As seen before, the nucleus AV-6 and AV-7 appeared with
higher or lower concentration depending on the precursor chemical composition. However, due
to the precursor agitation time effect on the formation of AV-7, the synthesis conditions of this
crystallization field eventually favored the formation of AV-7. If no agitation was provided this
crystallization field would certainly be dominated by AV-6. This assumption was based on the
results from trial TD that revealed this untested behavior in a transparent precursor hydrothermal
synthesis. The combine effects of sodium and potassium ensure that every composition had a
solid tin silicate as final result.
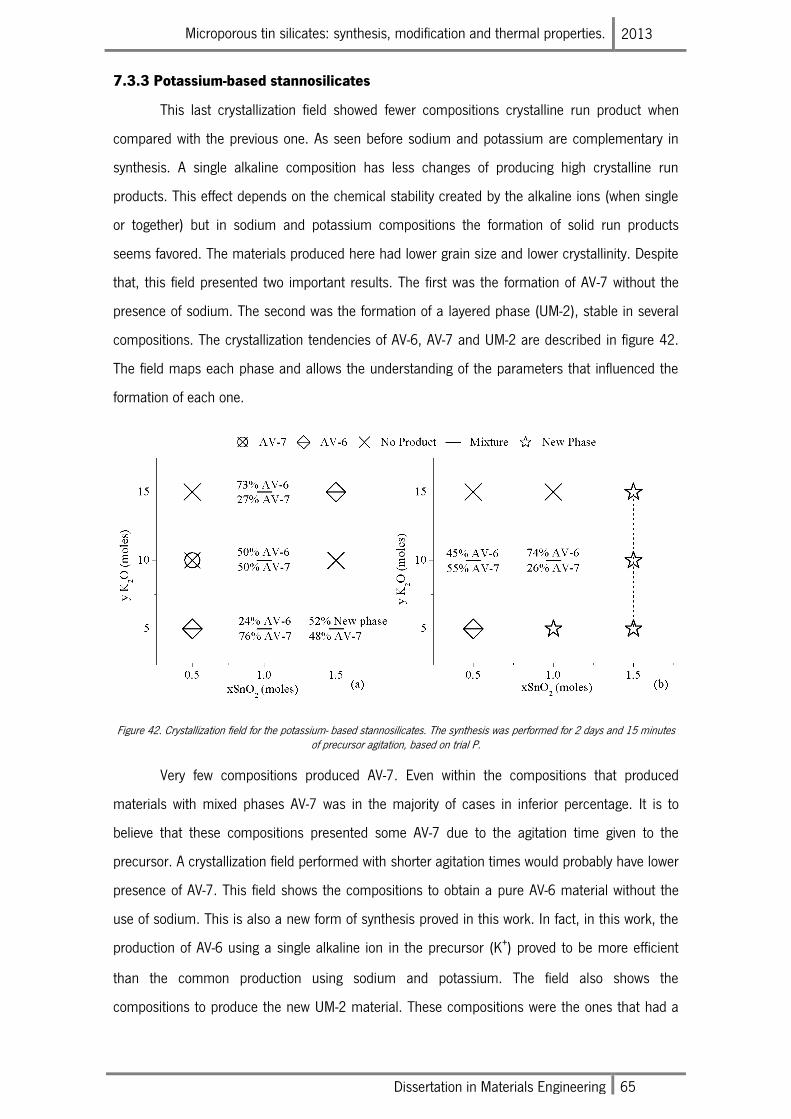
Microporous tin silicates: synthesis, modification and thermal properties. 2013
Dissertation in Materials Engineering 65
7.3.3 Potassium-based stannosilicates
This last crystallization field showed fewer compositions crystalline run product when
compared with the previous one. As seen before sodium and potassium are complementary in
synthesis. A single alkaline composition has less changes of producing high crystalline run
products. This effect depends on the chemical stability created by the alkaline ions (when single
or together) but in sodium and potassium compositions the formation of solid run products
seems favored. The materials produced here had lower grain size and lower crystallinity. Despite
that, this field presented two important results. The first was the formation of AV-7 without the
presence of sodium. The second was the formation of a layered phase (UM-2), stable in several
compositions. The crystallization tendencies of AV-6, AV-7 and UM-2 are described in figure 42.
The field maps each phase and allows the understanding of the parameters that influenced the
formation of each one.
Figure 42. Crystallization field for the potassium- based stannosilicates. The synthesis was performed for 2 days and 15 minutes of precursor agitation, based on trial P.
Very few compositions produced AV-7. Even within the compositions that produced
materials with mixed phases AV-7 was in the majority of cases in inferior percentage. It is to
believe that these compositions presented some AV-7 due to the agitation time given to the
precursor. A crystallization field performed with shorter agitation times would probably have lower
presence of AV-7. This field shows the compositions to obtain a pure AV-6 material without the
use of sodium. This is also a new form of synthesis proved in this work. In fact, in this work, the
production of AV-6 using a single alkaline ion in the precursor (K+) proved to be more efficient
than the common production using sodium and potassium. The field also shows the
compositions to produce the new UM-2 material. These compositions were the ones that had a
2013 Microporous tin silicates: synthesis, modification and thermal properties.
66 Dissertation in Materials Engineering
closer ratio of tin, silicon and potassium. These results are concurrent with the material chemical
composition since UM-2 as a 1 to 1 to 1 ratio in Sn, Si and K. Along with this relation in ratio the
best compositions to form the layer phase where also the ones that had 5 moles of SiO2. With
only 2.5 moles of SiO2 the only thing achieved was a mixed phase material with 52% of UM-2.
The studies performed to the P10 composition showed that this was a sensitive point of
crystallization. However, it is to believe that the other points of the layer phase (P16, P17 and P18)
formation would have larger tolerance for the synthesis parameters. This would happen due to
the closer resemblance between composition and structure chemical composition. This was the
crystallization field more influenced by the precursor agitation time. This parameter lowered the
production of AV-6 but also allowed the formation of a chemically modified AV-7 and the
production of an undiscovered tin silicate, the layered phase.
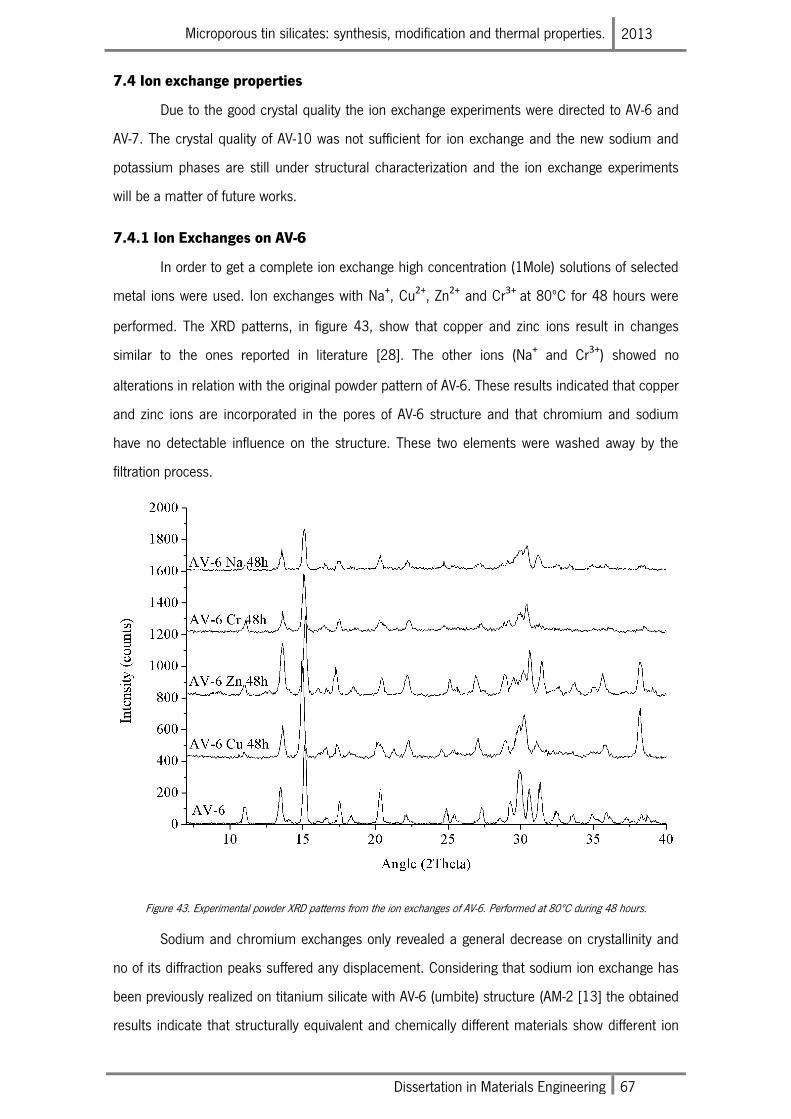
Microporous tin silicates: synthesis, modification and thermal properties. 2013
Dissertation in Materials Engineering 67
7.4 Ion exchange properties
Due to the good crystal quality the ion exchange experiments were directed to AV-6 and
AV-7. The crystal quality of AV-10 was not sufficient for ion exchange and the new sodium and
potassium phases are still under structural characterization and the ion exchange experiments
will be a matter of future works.
7.4.1 Ion Exchanges on AV-6
In order to get a complete ion exchange high concentration (1Mole) solutions of selected
metal ions were used. Ion exchanges with Na+, Cu2+, Zn2+ and Cr3+ at 80ºC for 48 hours were
performed. The XRD patterns, in figure 43, show that copper and zinc ions result in changes
similar to the ones reported in literature [28]. The other ions (Na+ and Cr3+) showed no
alterations in relation with the original powder pattern of AV-6. These results indicated that copper
and zinc ions are incorporated in the pores of AV-6 structure and that chromium and sodium
have no detectable influence on the structure. These two elements were washed away by the
filtration process.
Figure 43. Experimental powder XRD patterns from the ion exchanges of AV-6. Performed at 80ºC during 48 hours.
Sodium and chromium exchanges only revealed a general decrease on crystallinity and
no of its diffraction peaks suffered any displacement. Considering that sodium ion exchange has
been previously realized on titanium silicate with AV-6 (umbite) structure (AM-2 [13] the obtained
results indicate that structurally equivalent and chemically different materials show different ion
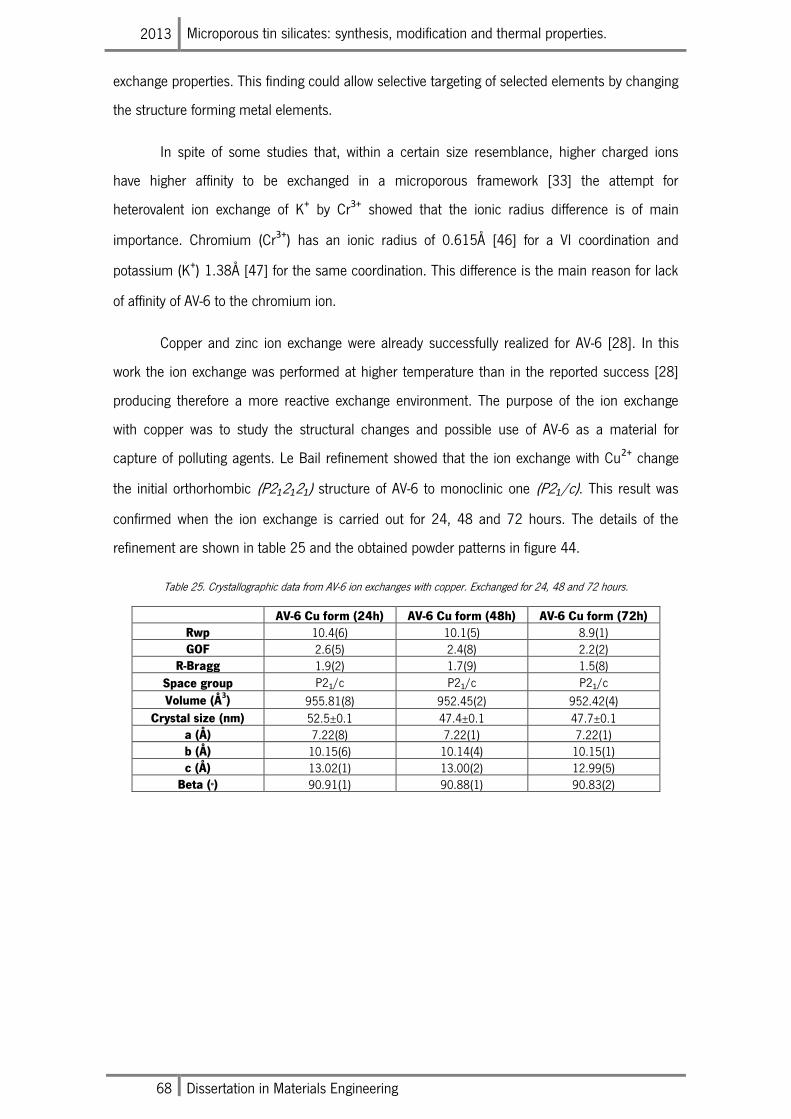
2013 Microporous tin silicates: synthesis, modification and thermal properties.
68 Dissertation in Materials Engineering
exchange properties. This finding could allow selective targeting of selected elements by changing
the structure forming metal elements.
In spite of some studies that, within a certain size resemblance, higher charged ions
have higher affinity to be exchanged in a microporous framework [33] the attempt for
heterovalent ion exchange of K+ by Cr3+ showed that the ionic radius difference is of main
importance. Chromium (Cr3+) has an ionic radius of 0.615Å [46] for a VI coordination and
potassium (K+) 1.38Å [47] for the same coordination. This difference is the main reason for lack
of affinity of AV-6 to the chromium ion.
Copper and zinc ion exchange were already successfully realized for AV-6 [28]. In this
work the ion exchange was performed at higher temperature than in the reported success [28]
producing therefore a more reactive exchange environment. The purpose of the ion exchange
with copper was to study the structural changes and possible use of AV-6 as a material for
capture of polluting agents. Le Bail refinement showed that the ion exchange with Cu2+ change
the initial orthorhombic (P212121) structure of AV-6 to monoclinic one (P21/c). This result was
confirmed when the ion exchange is carried out for 24, 48 and 72 hours. The details of the
refinement are shown in table 25 and the obtained powder patterns in figure 44.
Table 25. Crystallographic data from AV-6 ion exchanges with copper. Exchanged for 24, 48 and 72 hours.
AV-6 Cu form (24h) AV-6 Cu form (48h) AV-6 Cu form (72h)
Rwp 10.4(6) 10.1(5) 8.9(1) GOF 2.6(5) 2.4(8) 2.2(2)
R-Bragg 1.9(2) 1.7(9) 1.5(8)
Space group P21/c P21/c P21/c
Volume (Å3) 955.81(8) 952.45(2) 952.42(4)
Crystal size (nm) 52.5±0.1 47.4±0.1 47.7±0.1 a (Å) 7.22(8) 7.22(1) 7.22(1) b (Å) 10.15(6) 10.14(4) 10.15(1) c (Å) 13.02(1) 13.00(2) 12.99(5)
Beta (o) 90.91(1) 90.88(1) 90.83(2)
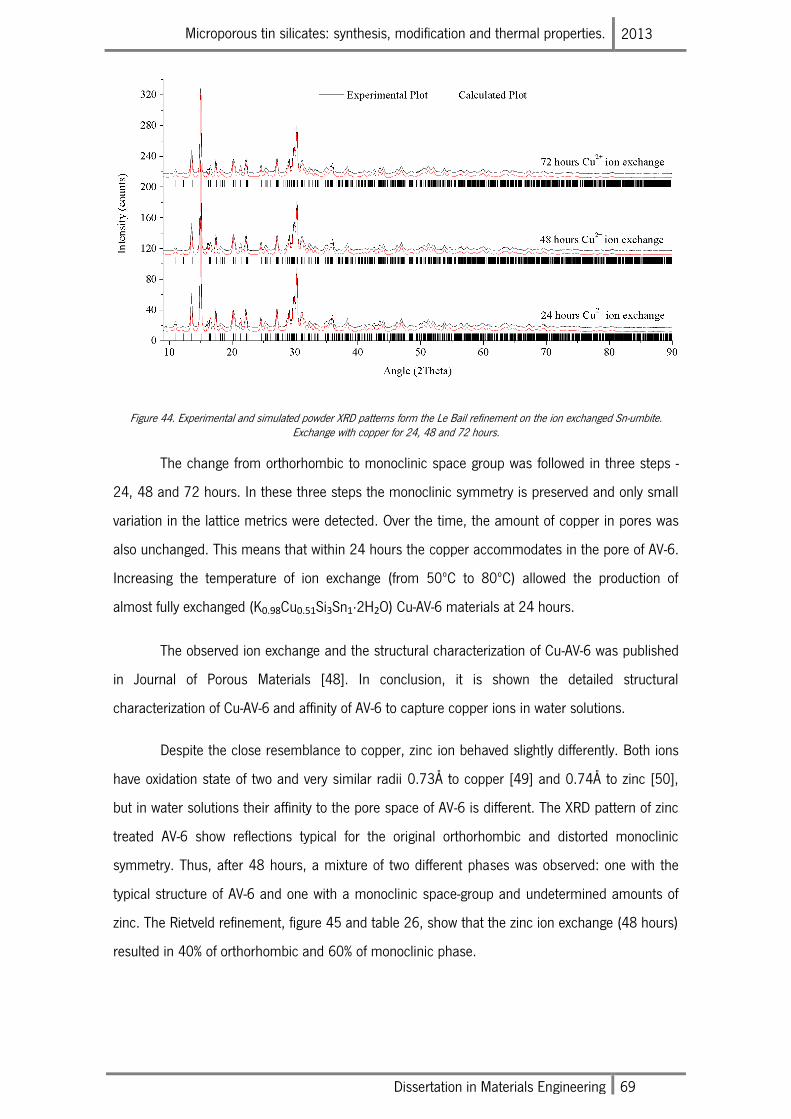
Microporous tin silicates: synthesis, modification and thermal properties. 2013
Dissertation in Materials Engineering 69
Figure 44. Experimental and simulated powder XRD patterns form the Le Bail refinement on the ion exchanged Sn-umbite. Exchange with copper for 24, 48 and 72 hours.
The change from orthorhombic to monoclinic space group was followed in three steps -
24, 48 and 72 hours. In these three steps the monoclinic symmetry is preserved and only small
variation in the lattice metrics were detected. Over the time, the amount of copper in pores was
also unchanged. This means that within 24 hours the copper accommodates in the pore of AV-6.
Increasing the temperature of ion exchange (from 50ºC to 80ºC) allowed the production of
almost fully exchanged (K0.98Cu0.51Si3Sn1∙2H2O) Cu-AV-6 materials at 24 hours.
The observed ion exchange and the structural characterization of Cu-AV-6 was published
in Journal of Porous Materials [48]. In conclusion, it is shown the detailed structural
characterization of Cu-AV-6 and affinity of AV-6 to capture copper ions in water solutions.
Despite the close resemblance to copper, zinc ion behaved slightly differently. Both ions
have oxidation state of two and very similar radii 0.73Å to copper [49] and 0.74Å to zinc [50],
but in water solutions their affinity to the pore space of AV-6 is different. The XRD pattern of zinc
treated AV-6 show reflections typical for the original orthorhombic and distorted monoclinic
symmetry. Thus, after 48 hours, a mixture of two different phases was observed: one with the
typical structure of AV-6 and one with a monoclinic space-group and undetermined amounts of
zinc. The Rietveld refinement, figure 45 and table 26, show that the zinc ion exchange (48 hours)
resulted in 40% of orthorhombic and 60% of monoclinic phase.
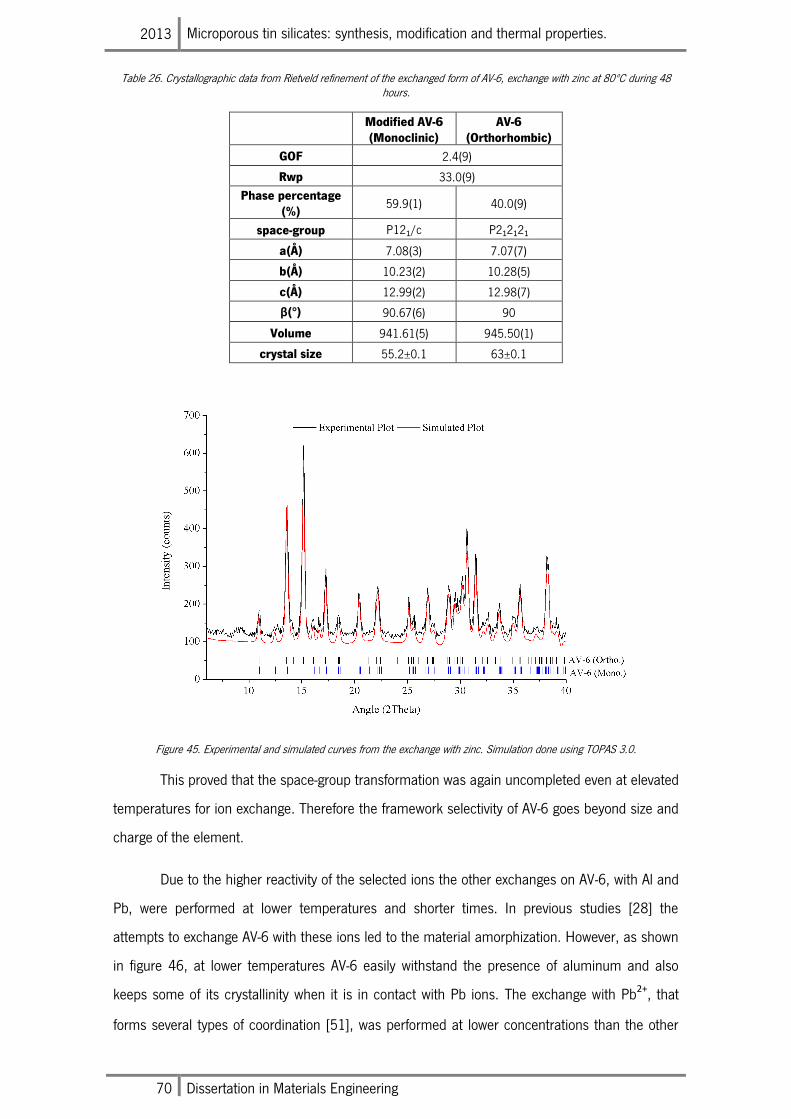
2013 Microporous tin silicates: synthesis, modification and thermal properties.
70 Dissertation in Materials Engineering
Table 26. Crystallographic data from Rietveld refinement of the exchanged form of AV-6, exchange with zinc at 80ºC during 48 hours.
Modified AV-6 (Monoclinic)
AV-6 (Orthorhombic)
GOF 2.4(9)
Rwp 33.0(9)
Phase percentage (%)
59.9(1) 40.0(9)
space-group P121/c P212121
a(Å) 7.08(3) 7.07(7)
b(Å) 10.23(2) 10.28(5)
c(Å) 12.99(2) 12.98(7)
β(°) 90.67(6) 90
Volume 941.61(5) 945.50(1)
crystal size 55.2±0.1 63±0.1
Figure 45. Experimental and simulated curves from the exchange with zinc. Simulation done using TOPAS 3.0.
This proved that the space-group transformation was again uncompleted even at elevated
temperatures for ion exchange. Therefore the framework selectivity of AV-6 goes beyond size and
charge of the element.
Due to the higher reactivity of the selected ions the other exchanges on AV-6, with Al and
Pb, were performed at lower temperatures and shorter times. In previous studies [28] the
attempts to exchange AV-6 with these ions led to the material amorphization. However, as shown
in figure 46, at lower temperatures AV-6 easily withstand the presence of aluminum and also
keeps some of its crystallinity when it is in contact with Pb ions. The exchange with Pb2+, that
forms several types of coordination [51], was performed at lower concentrations than the other
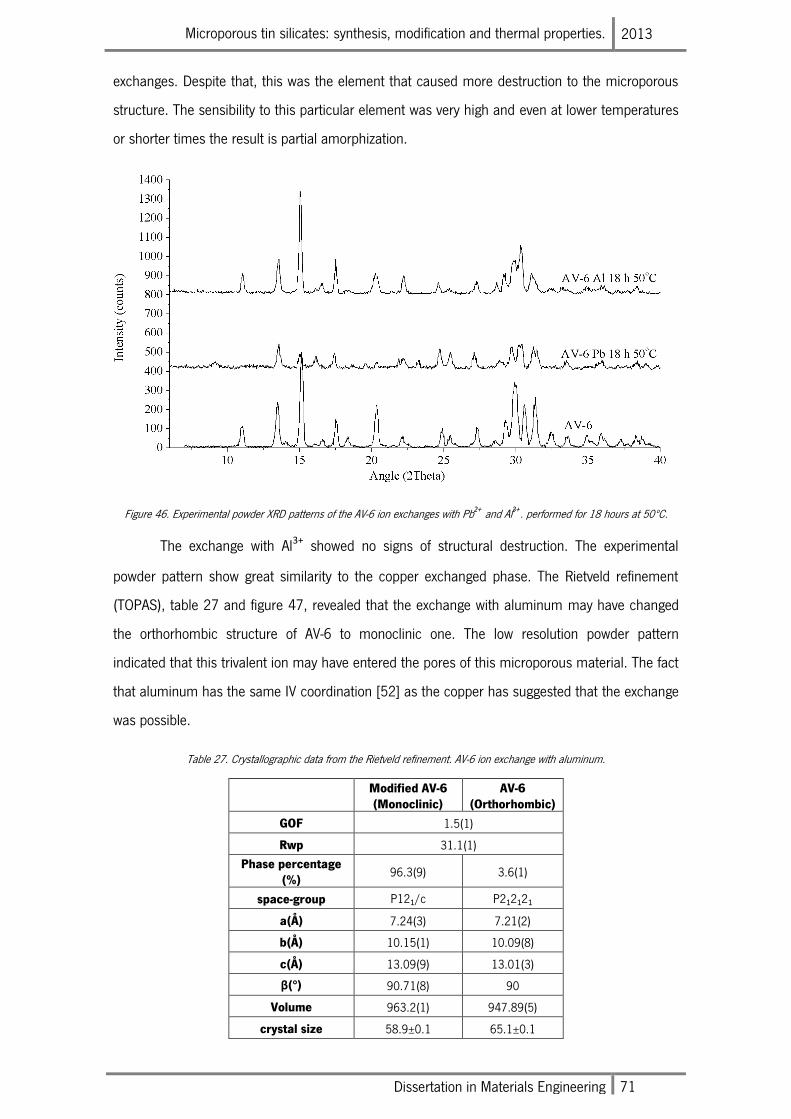
Microporous tin silicates: synthesis, modification and thermal properties. 2013
Dissertation in Materials Engineering 71
exchanges. Despite that, this was the element that caused more destruction to the microporous
structure. The sensibility to this particular element was very high and even at lower temperatures
or shorter times the result is partial amorphization.
Figure 46. Experimental powder XRD patterns of the AV-6 ion exchanges with Pb2+ and Al3+. performed for 18 hours at 50ºC.
The exchange with Al3+ showed no signs of structural destruction. The experimental
powder pattern show great similarity to the copper exchanged phase. The Rietveld refinement
(TOPAS), table 27 and figure 47, revealed that the exchange with aluminum may have changed
the orthorhombic structure of AV-6 to monoclinic one. The low resolution powder pattern
indicated that this trivalent ion may have entered the pores of this microporous material. The fact
that aluminum has the same IV coordination [52] as the copper has suggested that the exchange
was possible.
Table 27. Crystallographic data from the Rietveld refinement. AV-6 ion exchange with aluminum.
Modified AV-6 (Monoclinic)
AV-6 (Orthorhombic)
GOF 1.5(1)
Rwp 31.1(1)
Phase percentage (%)
96.3(9) 3.6(1)
space-group P121/c P212121
a(Å) 7.24(3) 7.21(2)
b(Å) 10.15(1) 10.09(8)
c(Å) 13.09(9) 13.01(3)
β(°) 90.71(8) 90
Volume 963.2(1) 947.89(5)
crystal size 58.9±0.1 65.1±0.1
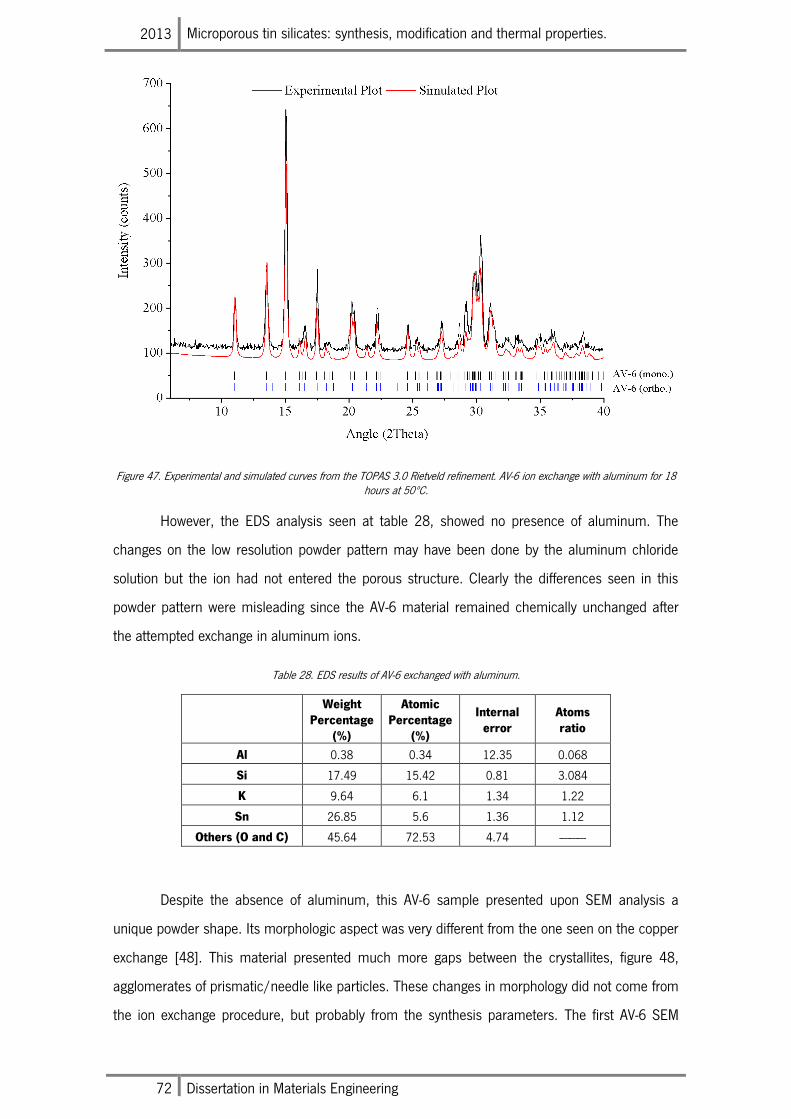
2013 Microporous tin silicates: synthesis, modification and thermal properties.
72 Dissertation in Materials Engineering
Figure 47. Experimental and simulated curves from the TOPAS 3.0 Rietveld refinement. AV-6 ion exchange with aluminum for 18 hours at 50ºC.
However, the EDS analysis seen at table 28, showed no presence of aluminum. The
changes on the low resolution powder pattern may have been done by the aluminum chloride
solution but the ion had not entered the porous structure. Clearly the differences seen in this
powder pattern were misleading since the AV-6 material remained chemically unchanged after
the attempted exchange in aluminum ions.
Table 28. EDS results of AV-6 exchanged with aluminum.
Weight Percentage
(%)
Atomic Percentage
(%)
Internal error
Atoms ratio
Al 0.38 0.34 12.35 0.068
Si 17.49 15.42 0.81 3.084
K 9.64 6.1 1.34 1.22
Sn 26.85 5.6 1.36 1.12
Others (O and C) 45.64 72.53 4.74 ----------
Despite the absence of aluminum, this AV-6 sample presented upon SEM analysis a
unique powder shape. Its morphologic aspect was very different from the one seen on the copper
exchange [48]. This material presented much more gaps between the crystallites, figure 48,
agglomerates of prismatic/needle like particles. These changes in morphology did not come from
the ion exchange procedure, but probably from the synthesis parameters. The first AV-6 SEM
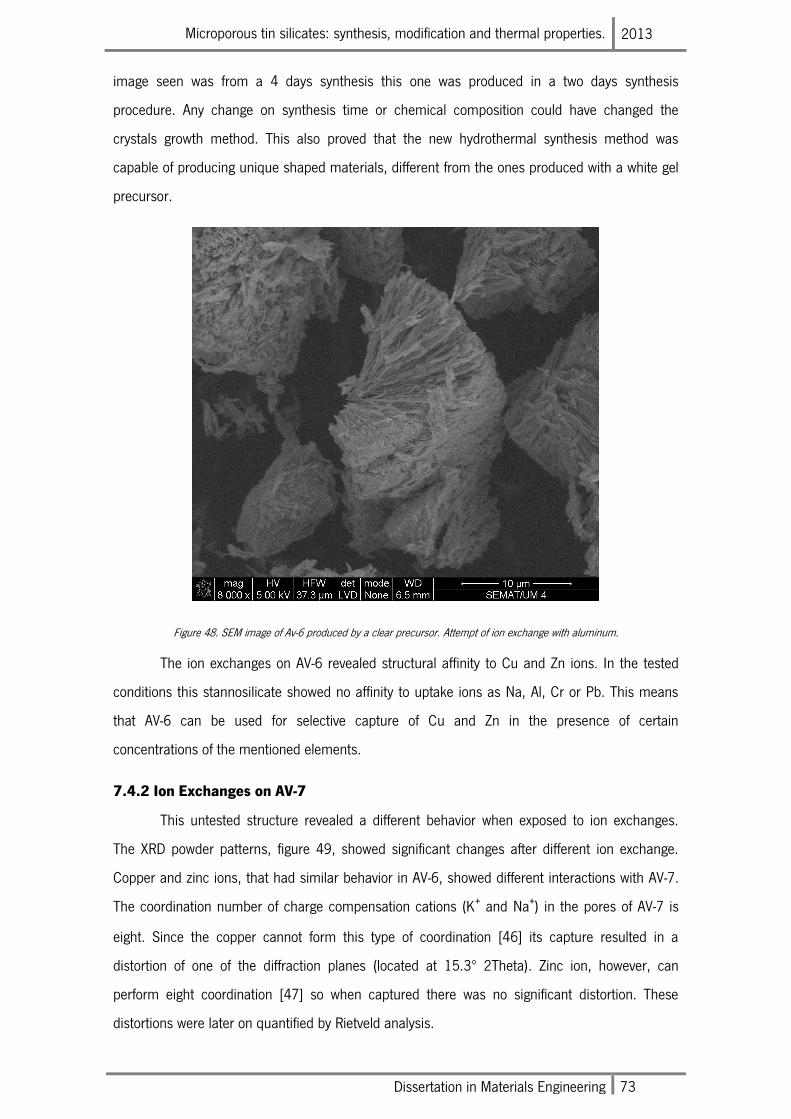
Microporous tin silicates: synthesis, modification and thermal properties. 2013
Dissertation in Materials Engineering 73
image seen was from a 4 days synthesis this one was produced in a two days synthesis
procedure. Any change on synthesis time or chemical composition could have changed the
crystals growth method. This also proved that the new hydrothermal synthesis method was
capable of producing unique shaped materials, different from the ones produced with a white gel
precursor.
Figure 48. SEM image of Av-6 produced by a clear precursor. Attempt of ion exchange with aluminum.
The ion exchanges on AV-6 revealed structural affinity to Cu and Zn ions. In the tested
conditions this stannosilicate showed no affinity to uptake ions as Na, Al, Cr or Pb. This means
that AV-6 can be used for selective capture of Cu and Zn in the presence of certain
concentrations of the mentioned elements.
7.4.2 Ion Exchanges on AV-7
This untested structure revealed a different behavior when exposed to ion exchanges.
The XRD powder patterns, figure 49, showed significant changes after different ion exchange.
Copper and zinc ions, that had similar behavior in AV-6, showed different interactions with AV-7.
The coordination number of charge compensation cations (K+ and Na+) in the pores of AV-7 is
eight. Since the copper cannot form this type of coordination [46] its capture resulted in a
distortion of one of the diffraction planes (located at 15.3º 2Theta). Zinc ion, however, can
perform eight coordination [47] so when captured there was no significant distortion. These
distortions were later on quantified by Rietveld analysis.
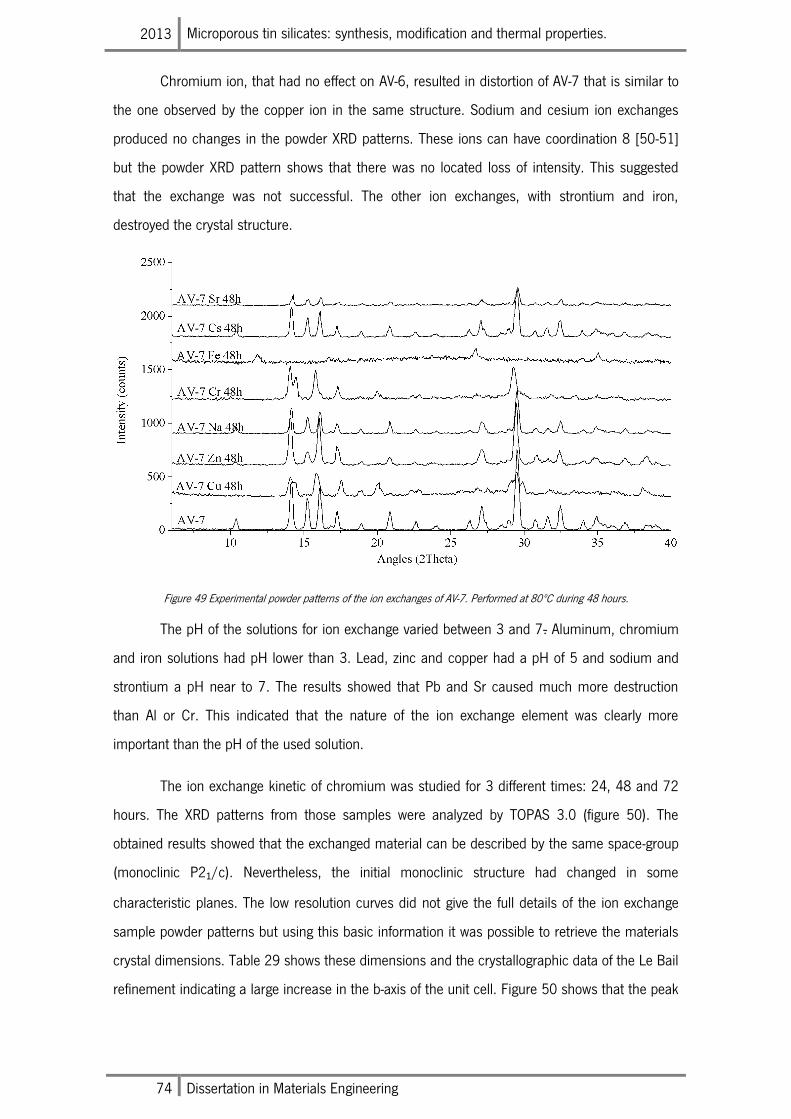
2013 Microporous tin silicates: synthesis, modification and thermal properties.
74 Dissertation in Materials Engineering
Chromium ion, that had no effect on AV-6, resulted in distortion of AV-7 that is similar to
the one observed by the copper ion in the same structure. Sodium and cesium ion exchanges
produced no changes in the powder XRD patterns. These ions can have coordination 8 [50-51]
but the powder XRD pattern shows that there was no located loss of intensity. This suggested
that the exchange was not successful. The other ion exchanges, with strontium and iron,
destroyed the crystal structure.
Figure 49 Experimental powder patterns of the ion exchanges of AV-7. Performed at 80ºC during 48 hours.
The pH of the solutions for ion exchange varied between 3 and 7. Aluminum, chromium
and iron solutions had pH lower than 3. Lead, zinc and copper had a pH of 5 and sodium and
strontium a pH near to 7. The results showed that Pb and Sr caused much more destruction
than Al or Cr. This indicated that the nature of the ion exchange element was clearly more
important than the pH of the used solution.
The ion exchange kinetic of chromium was studied for 3 different times: 24, 48 and 72
hours. The XRD patterns from those samples were analyzed by TOPAS 3.0 (figure 50). The
obtained results showed that the exchanged material can be described by the same space-group
(monoclinic P21/c). Nevertheless, the initial monoclinic structure had changed in some
characteristic planes. The low resolution curves did not give the full details of the ion exchange
sample powder patterns but using this basic information it was possible to retrieve the materials
crystal dimensions. Table 29 shows these dimensions and the crystallographic data of the Le Bail
refinement indicating a large increase in the b-axis of the unit cell. Figure 50 shows that the peak
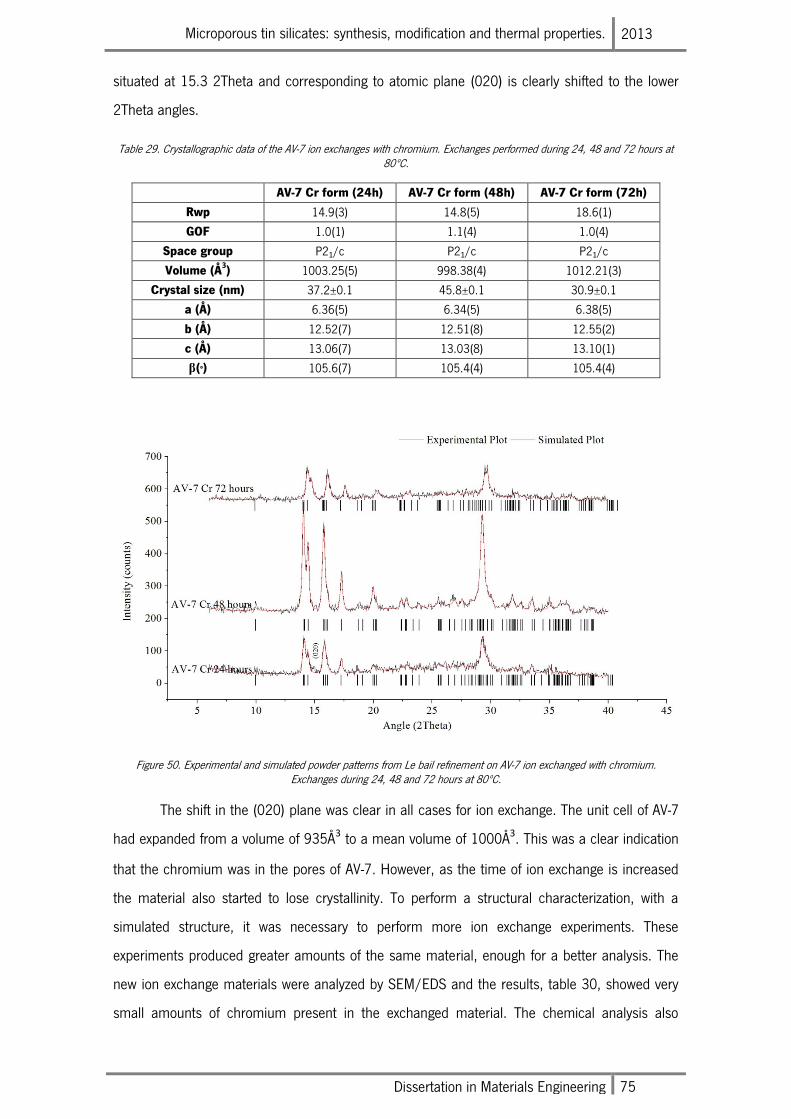
Microporous tin silicates: synthesis, modification and thermal properties. 2013
Dissertation in Materials Engineering 75
situated at 15.3 2Theta and corresponding to atomic plane (020) is clearly shifted to the lower
2Theta angles.
Table 29. Crystallographic data of the AV-7 ion exchanges with chromium. Exchanges performed during 24, 48 and 72 hours at 80ºC.
AV-7 Cr form (24h) AV-7 Cr form (48h) AV-7 Cr form (72h)
Rwp 14.9(3) 14.8(5) 18.6(1)
GOF 1.0(1) 1.1(4) 1.0(4)
Space group P21/c P21/c P21/c
Volume (Å3) 1003.25(5) 998.38(4) 1012.21(3)
Crystal size (nm) 37.2±0.1 45.8±0.1 30.9±0.1
a (Å) 6.36(5) 6.34(5) 6.38(5)
b (Å) 12.52(7) 12.51(8) 12.55(2)
c (Å) 13.06(7) 13.03(8) 13.10(1)
β(o) 105.6(7) 105.4(4) 105.4(4)
Figure 50. Experimental and simulated powder patterns from Le bail refinement on AV-7 ion exchanged with chromium. Exchanges during 24, 48 and 72 hours at 80ºC.
The shift in the (020) plane was clear in all cases for ion exchange. The unit cell of AV-7
had expanded from a volume of 935Å3 to a mean volume of 1000Å3. This was a clear indication
that the chromium was in the pores of AV-7. However, as the time of ion exchange is increased
the material also started to lose crystallinity. To perform a structural characterization, with a
simulated structure, it was necessary to perform more ion exchange experiments. These
experiments produced greater amounts of the same material, enough for a better analysis. The
new ion exchange materials were analyzed by SEM/EDS and the results, table 30, showed very
small amounts of chromium present in the exchanged material. The chemical analysis also
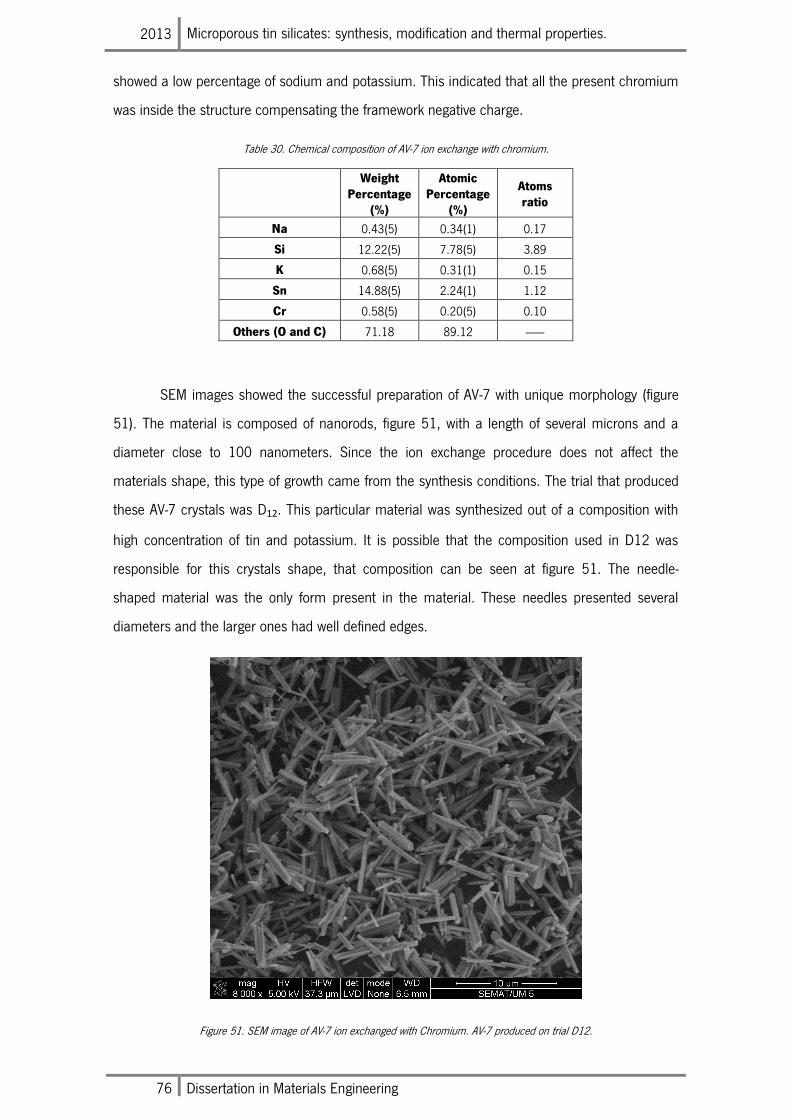
2013 Microporous tin silicates: synthesis, modification and thermal properties.
76 Dissertation in Materials Engineering
showed a low percentage of sodium and potassium. This indicated that all the present chromium
was inside the structure compensating the framework negative charge.
Table 30. Chemical composition of AV-7 ion exchange with chromium.
Weight Percentage
(%)
Atomic Percentage
(%)
Atoms ratio
Na 0.43(5) 0.34(1) 0.17
Si 12.22(5) 7.78(5) 3.89
K 0.68(5) 0.31(1) 0.15
Sn 14.88(5) 2.24(1) 1.12
Cr 0.58(5) 0.20(5) 0.10
Others (O and C) 71.18 89.12 -------
SEM images showed the successful preparation of AV-7 with unique morphology (figure
51). The material is composed of nanorods, figure 51, with a length of several microns and a
diameter close to 100 nanometers. Since the ion exchange procedure does not affect the
materials shape, this type of growth came from the synthesis conditions. The trial that produced
these AV-7 crystals was D12. This particular material was synthesized out of a composition with
high concentration of tin and potassium. It is possible that the composition used in D12 was
responsible for this crystals shape, that composition can be seen at figure 51. The needle-
shaped material was the only form present in the material. These needles presented several
diameters and the larger ones had well defined edges.
Figure 51. SEM image of AV-7 ion exchanged with Chromium. AV-7 produced on trial D12.
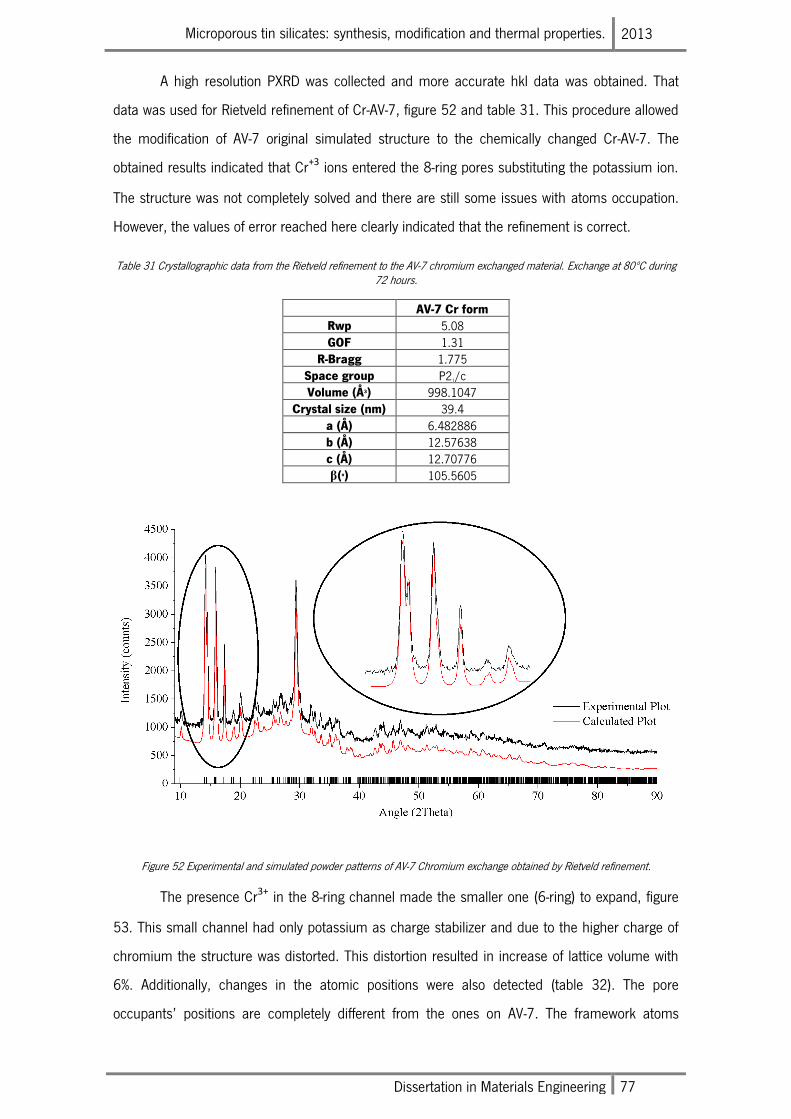
Microporous tin silicates: synthesis, modification and thermal properties. 2013
Dissertation in Materials Engineering 77
A high resolution PXRD was collected and more accurate hkl data was obtained. That
data was used for Rietveld refinement of Cr-AV-7, figure 52 and table 31. This procedure allowed
the modification of AV-7 original simulated structure to the chemically changed Cr-AV-7. The
obtained results indicated that Cr+3 ions entered the 8-ring pores substituting the potassium ion.
The structure was not completely solved and there are still some issues with atoms occupation.
However, the values of error reached here clearly indicated that the refinement is correct.
Table 31 Crystallographic data from the Rietveld refinement to the AV-7 chromium exchanged material. Exchange at 80ºC during 72 hours.
AV-7 Cr form
Rwp 5.08 GOF 1.31
R-Bragg 1.775 Space group P21/c Volume (Å3) 998.1047
Crystal size (nm) 39.4 a (Å) 6.482886 b (Å) 12.57638 c (Å) 12.70776 β(o) 105.5605
Figure 52 Experimental and simulated powder patterns of AV-7 Chromium exchange obtained by Rietveld refinement.
The presence Cr3+ in the 8-ring channel made the smaller one (6-ring) to expand, figure
53. This small channel had only potassium as charge stabilizer and due to the higher charge of
chromium the structure was distorted. This distortion resulted in increase of lattice volume with
6%. Additionally, changes in the atomic positions were also detected (table 32). The pore
occupants’ positions are completely different from the ones on AV-7. The framework atoms
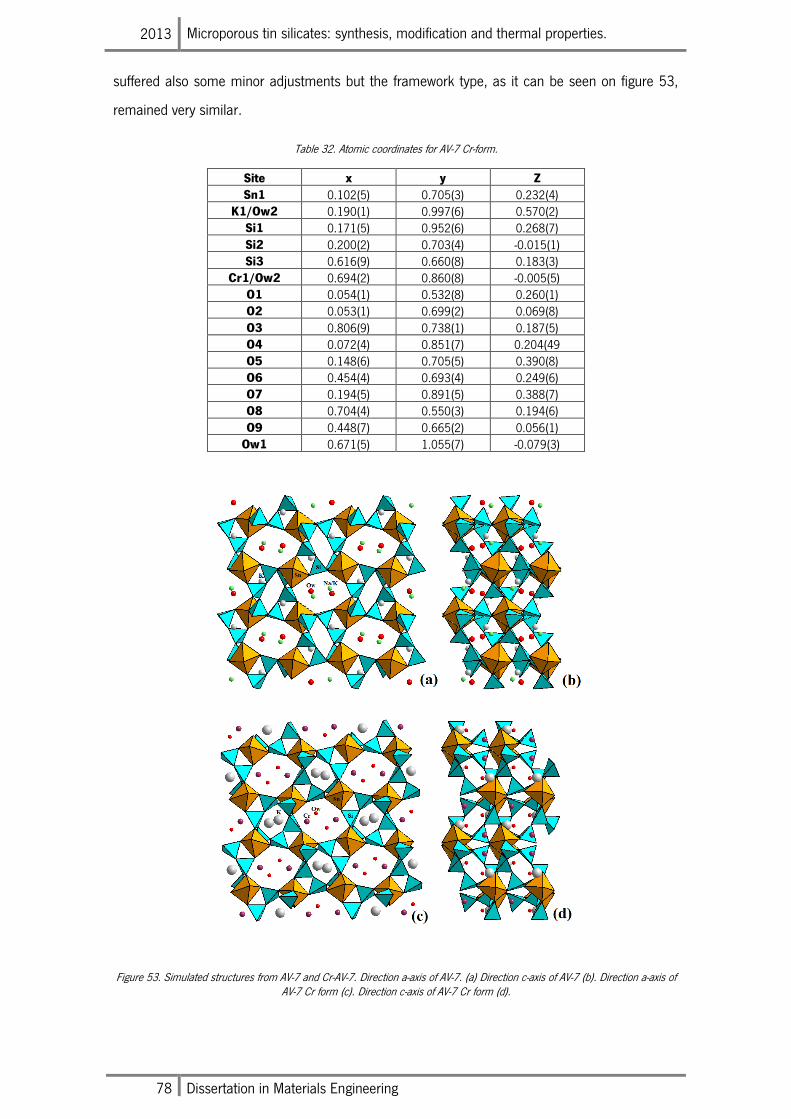
2013 Microporous tin silicates: synthesis, modification and thermal properties.
78 Dissertation in Materials Engineering
suffered also some minor adjustments but the framework type, as it can be seen on figure 53,
remained very similar.
Table 32. Atomic coordinates for AV-7 Cr-form.
Site x y Z
Sn1 0.102(5) 0.705(3) 0.232(4) K1/Ow2 0.190(1) 0.997(6) 0.570(2)
Si1 0.171(5) 0.952(6) 0.268(7) Si2 0.200(2) 0.703(4) -0.015(1) Si3 0.616(9) 0.660(8) 0.183(3)
Cr1/Ow2 0.694(2) 0.860(8) -0.005(5) O1 0.054(1) 0.532(8) 0.260(1) O2 0.053(1) 0.699(2) 0.069(8) O3 0.806(9) 0.738(1) 0.187(5) O4 0.072(4) 0.851(7) 0.204(49 O5 0.148(6) 0.705(5) 0.390(8) O6 0.454(4) 0.693(4) 0.249(6) O7 0.194(5) 0.891(5) 0.388(7) O8 0.704(4) 0.550(3) 0.194(6) O9 0.448(7) 0.665(2) 0.056(1)
Ow1 0.671(5) 1.055(7) -0.079(3)
Figure 53. Simulated structures from AV-7 and Cr-AV-7. Direction a-axis of AV-7. (a) Direction c-axis of AV-7 (b). Direction a-axis of AV-7 Cr form (c). Direction c-axis of AV-7 Cr form (d).
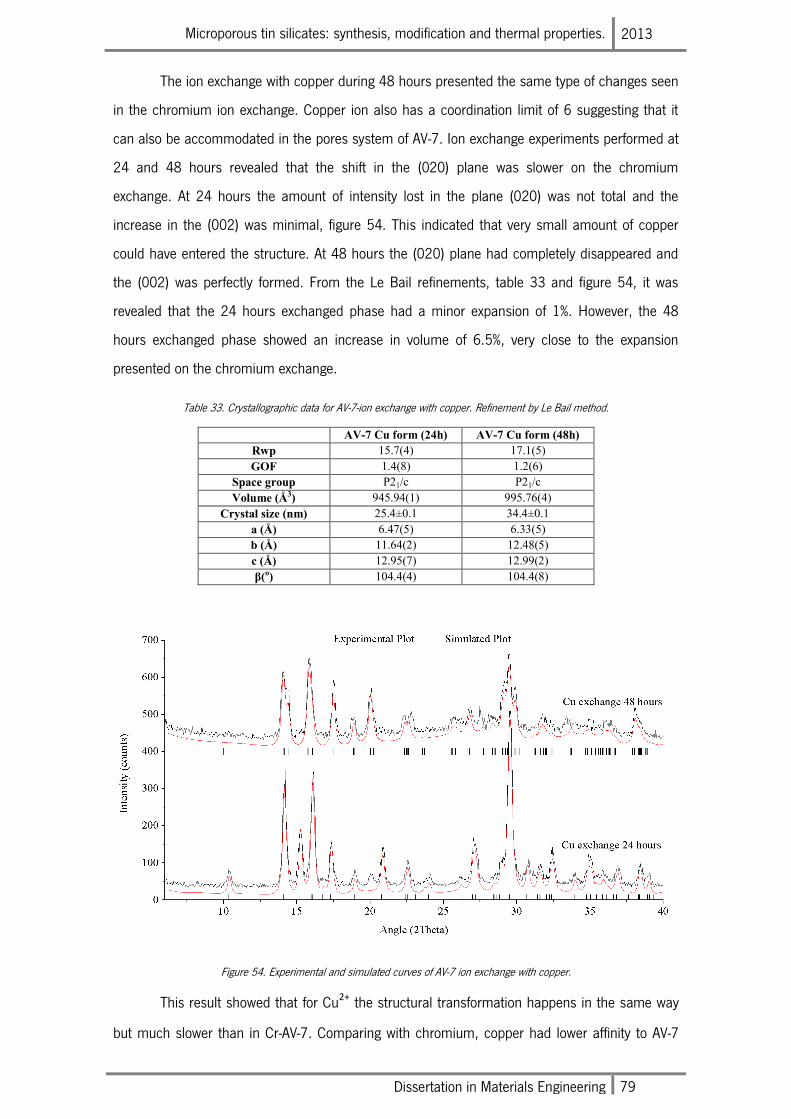
Microporous tin silicates: synthesis, modification and thermal properties. 2013
Dissertation in Materials Engineering 79
The ion exchange with copper during 48 hours presented the same type of changes seen
in the chromium ion exchange. Copper ion also has a coordination limit of 6 suggesting that it
can also be accommodated in the pores system of AV-7. Ion exchange experiments performed at
24 and 48 hours revealed that the shift in the (020) plane was slower on the chromium
exchange. At 24 hours the amount of intensity lost in the plane (020) was not total and the
increase in the (002) was minimal, figure 54. This indicated that very small amount of copper
could have entered the structure. At 48 hours the (020) plane had completely disappeared and
the (002) was perfectly formed. From the Le Bail refinements, table 33 and figure 54, it was
revealed that the 24 hours exchanged phase had a minor expansion of 1%. However, the 48
hours exchanged phase showed an increase in volume of 6.5%, very close to the expansion
presented on the chromium exchange.
Table 33. Crystallographic data for AV-7-ion exchange with copper. Refinement by Le Bail method.
AV-7 Cu form (24h) AV-7 Cu form (48h)
Rwp 15.7(4) 17.1(5)
GOF 1.4(8) 1.2(6)
Space group P21/c P21/c
Volume (Å3) 945.94(1) 995.76(4)
Crystal size (nm) 25.4±0.1 34.4±0.1
a (Å) 6.47(5) 6.33(5)
b (Å) 11.64(2) 12.48(5)
c (Å) 12.95(7) 12.99(2)
β(o) 104.4(4) 104.4(8)
Figure 54. Experimental and simulated curves of AV-7 ion exchange with copper.
This result showed that for Cu2+ the structural transformation happens in the same way
but much slower than in Cr-AV-7. Comparing with chromium, copper had lower affinity to AV-7
2013 Microporous tin silicates: synthesis, modification and thermal properties.
80 Dissertation in Materials Engineering
channels. Following the ion exchange behavior that Fewox proved in his thesis, higher charge
ions have higher affinity to be captured by ion exchange [33]. The EDS results confirmed the
presence of copper in the material exchanged for 48 hours. These results, table 34, showed, like
the chromium ion exchange, a low percentage of pore stabilizers. On normal AV-7 sodium and
potassium represent 2 moles in the materials chemical composition. However, it appears that
when ion exchanged this structure loses chemical ratio and the amount of stabilizers decreases.
Even with the higher charge compensation, in the copper case 2+, the total amount of positive
charge in the porous structure is insufficient for charge compensation. It seems that the ion
exchanged forms of AV-7 have unbalanced pores, indicating that some amounts of potassium
were expelled and not exchanged.
Table 34. Chemical composition of the AV-7 ion exchange with copper for 48 hours.
Weight Percentage
(%)
Atomic Percentage
(%) Error (%)
Atoms ratio
Corrected ratio
Si 19.38 17.575 0.18 2.92 2.92
Cl 0.6 0.43 0.01 0.07 0
K 2.135 1.41 0.685 0.23 0.23
Sn 28.49 6.145 2.38 1.02 1.02
Cu 6.01 2.41 0.08 0.40 0.36
Other elements 43.38 72.03 2.81 - -
The chlorine detected by the chemical analysis was superficial CuCl2. This material
resisted filtration process but did not interfere with the Rietveld refinement. The EDS results were
recalculated after chloride removal and the correct ratio is presented at table 34. The corrected
ratios give a total presence of charge stabilizers of 1. The missing charge may have come from
OH- compensation. The framework atoms Si and Sn may have change some of the Si-O and Sn-O
bonds to Si-OH and Sn-OH bonds, like in other reported works [12]. By doing this the total
amount of charge needed for compensation decreases and therefore the occupancy of positive
charge elements in the channels must be inferior to the normal of AV-7. These connections to
OH- are reflected in the bonds length, the hydroxide connections are longer and weaker. The
more hydroxide groups present in the structure the more disordered it gets.
The SEM analysis of this ion exchanged material revealed an already seen shape of AV-7
crystals, figure 55. This time however, the crystals had irregular surface, the material presented
the typical large crystals shape but the surface was covered by fine powders. It was also visible
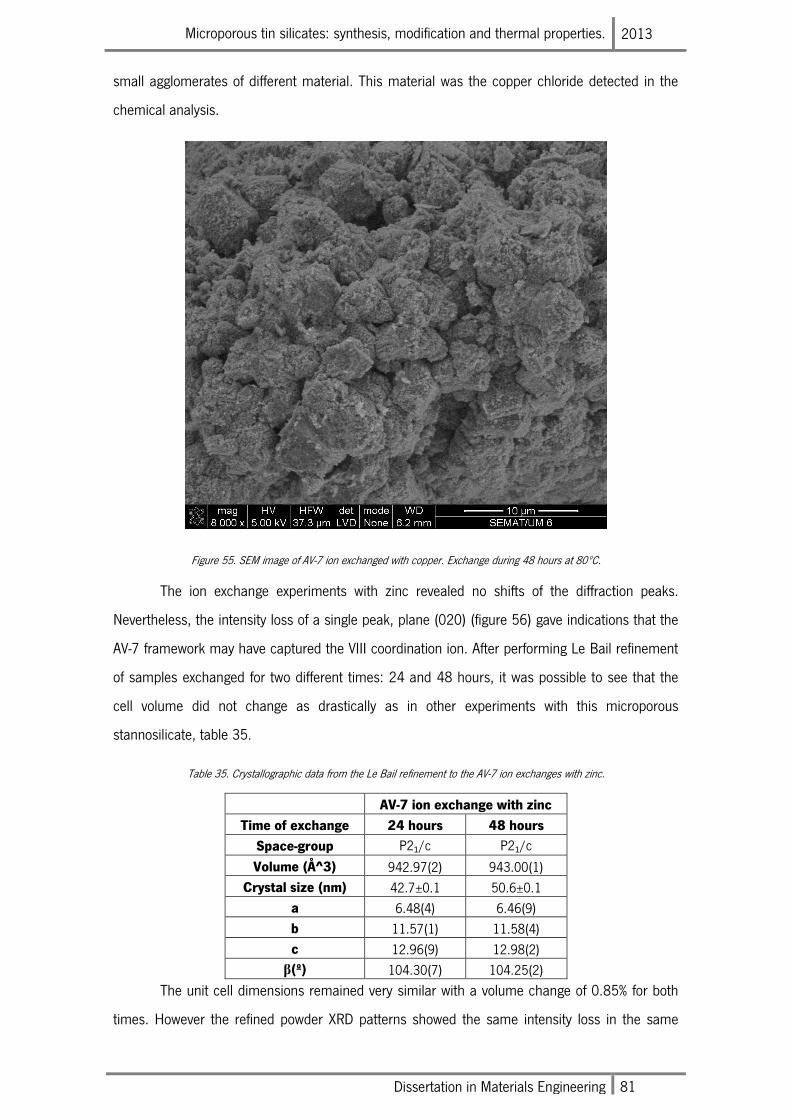
Microporous tin silicates: synthesis, modification and thermal properties. 2013
Dissertation in Materials Engineering 81
small agglomerates of different material. This material was the copper chloride detected in the
chemical analysis.
Figure 55. SEM image of AV-7 ion exchanged with copper. Exchange during 48 hours at 80ºC.
The ion exchange experiments with zinc revealed no shifts of the diffraction peaks.
Nevertheless, the intensity loss of a single peak, plane (020) (figure 56) gave indications that the
AV-7 framework may have captured the VIII coordination ion. After performing Le Bail refinement
of samples exchanged for two different times: 24 and 48 hours, it was possible to see that the
cell volume did not change as drastically as in other experiments with this microporous
stannosilicate, table 35.
Table 35. Crystallographic data from the Le Bail refinement to the AV-7 ion exchanges with zinc.
AV-7 ion exchange with zinc
Time of exchange 24 hours 48 hours
Space-group P21/c P21/c
Volume (Å^3) 942.97(2) 943.00(1)
Crystal size (nm) 42.7±0.1 50.6±0.1
a 6.48(4) 6.46(9)
b 11.57(1) 11.58(4)
c 12.96(9) 12.98(2)
β(º) 104.30(7) 104.25(2)
The unit cell dimensions remained very similar with a volume change of 0.85% for both
times. However the refined powder XRD patterns showed the same intensity loss in the same
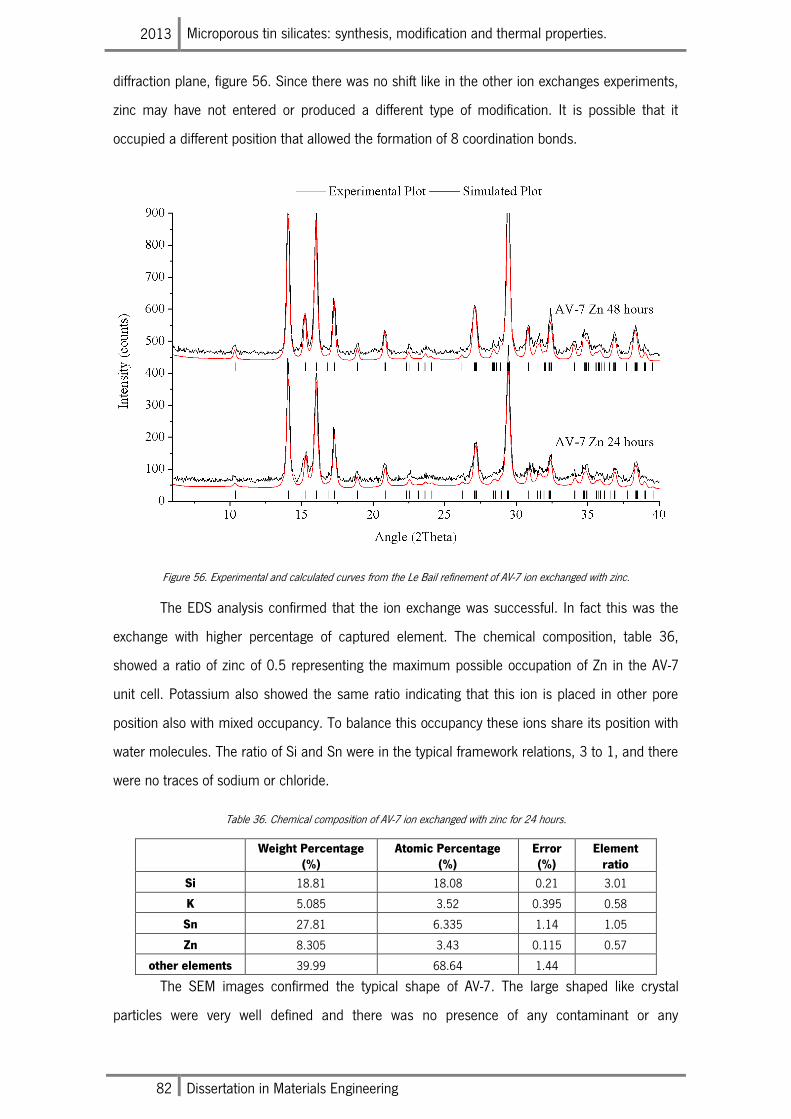
2013 Microporous tin silicates: synthesis, modification and thermal properties.
82 Dissertation in Materials Engineering
diffraction plane, figure 56. Since there was no shift like in the other ion exchanges experiments,
zinc may have not entered or produced a different type of modification. It is possible that it
occupied a different position that allowed the formation of 8 coordination bonds.
Figure 56. Experimental and calculated curves from the Le Bail refinement of AV-7 ion exchanged with zinc.
The EDS analysis confirmed that the ion exchange was successful. In fact this was the
exchange with higher percentage of captured element. The chemical composition, table 36,
showed a ratio of zinc of 0.5 representing the maximum possible occupation of Zn in the AV-7
unit cell. Potassium also showed the same ratio indicating that this ion is placed in other pore
position also with mixed occupancy. To balance this occupancy these ions share its position with
water molecules. The ratio of Si and Sn were in the typical framework relations, 3 to 1, and there
were no traces of sodium or chloride.
Table 36. Chemical composition of AV-7 ion exchanged with zinc for 24 hours.
Weight Percentage
(%) Atomic Percentage
(%) Error (%)
Element ratio
Si 18.81 18.08 0.21 3.01
K 5.085 3.52 0.395 0.58
Sn 27.81 6.335 1.14 1.05
Zn 8.305 3.43 0.115 0.57
other elements 39.99 68.64 1.44
The SEM images confirmed the typical shape of AV-7. The large shaped like crystal
particles were very well defined and there was no presence of any contaminant or any
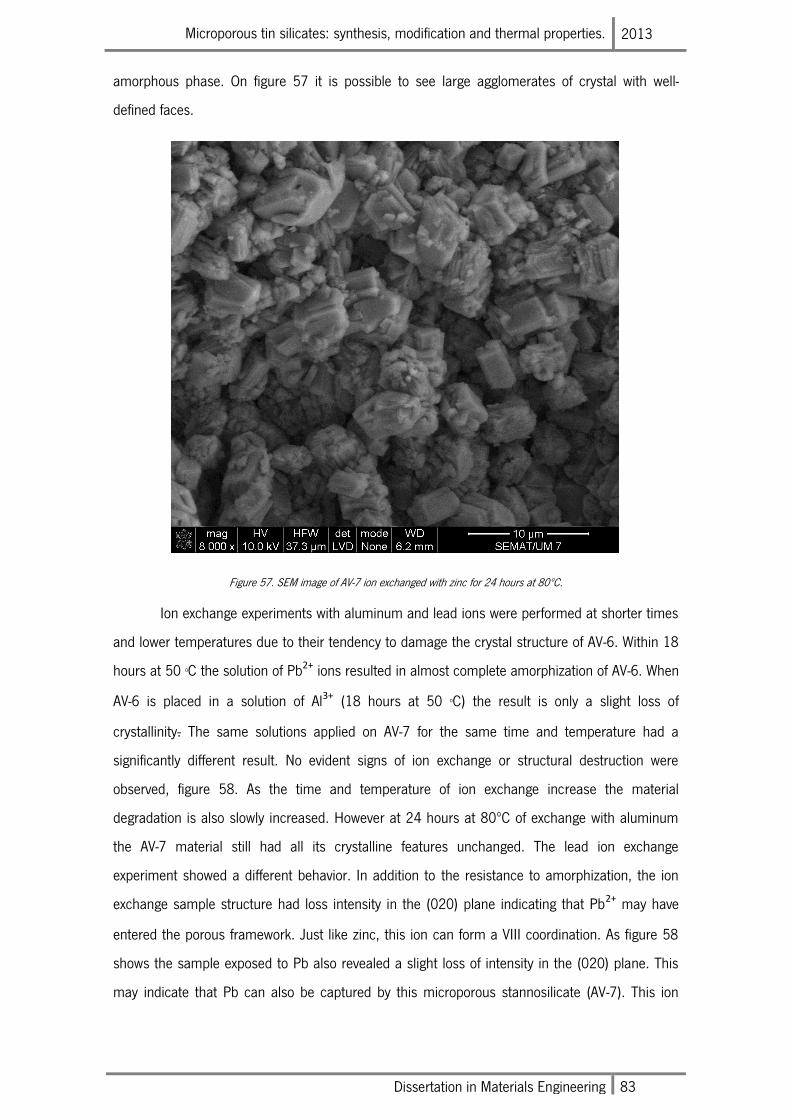
Microporous tin silicates: synthesis, modification and thermal properties. 2013
Dissertation in Materials Engineering 83
amorphous phase. On figure 57 it is possible to see large agglomerates of crystal with well-
defined faces.
Figure 57. SEM image of AV-7 ion exchanged with zinc for 24 hours at 80ºC.
Ion exchange experiments with aluminum and lead ions were performed at shorter times
and lower temperatures due to their tendency to damage the crystal structure of AV-6. Within 18
hours at 50 oC the solution of Pb2+ ions resulted in almost complete amorphization of AV-6. When
AV-6 is placed in a solution of Al3+ (18 hours at 50 oC) the result is only a slight loss of
crystallinity. The same solutions applied on AV-7 for the same time and temperature had a
significantly different result. No evident signs of ion exchange or structural destruction were
observed, figure 58. As the time and temperature of ion exchange increase the material
degradation is also slowly increased. However at 24 hours at 80ºC of exchange with aluminum
the AV-7 material still had all its crystalline features unchanged. The lead ion exchange
experiment showed a different behavior. In addition to the resistance to amorphization, the ion
exchange sample structure had loss intensity in the (020) plane indicating that Pb2+ may have
entered the porous framework. Just like zinc, this ion can form a VIII coordination. As figure 58
shows the sample exposed to Pb also revealed a slight loss of intensity in the (020) plane. This
may indicate that Pb can also be captured by this microporous stannosilicate (AV-7). This ion
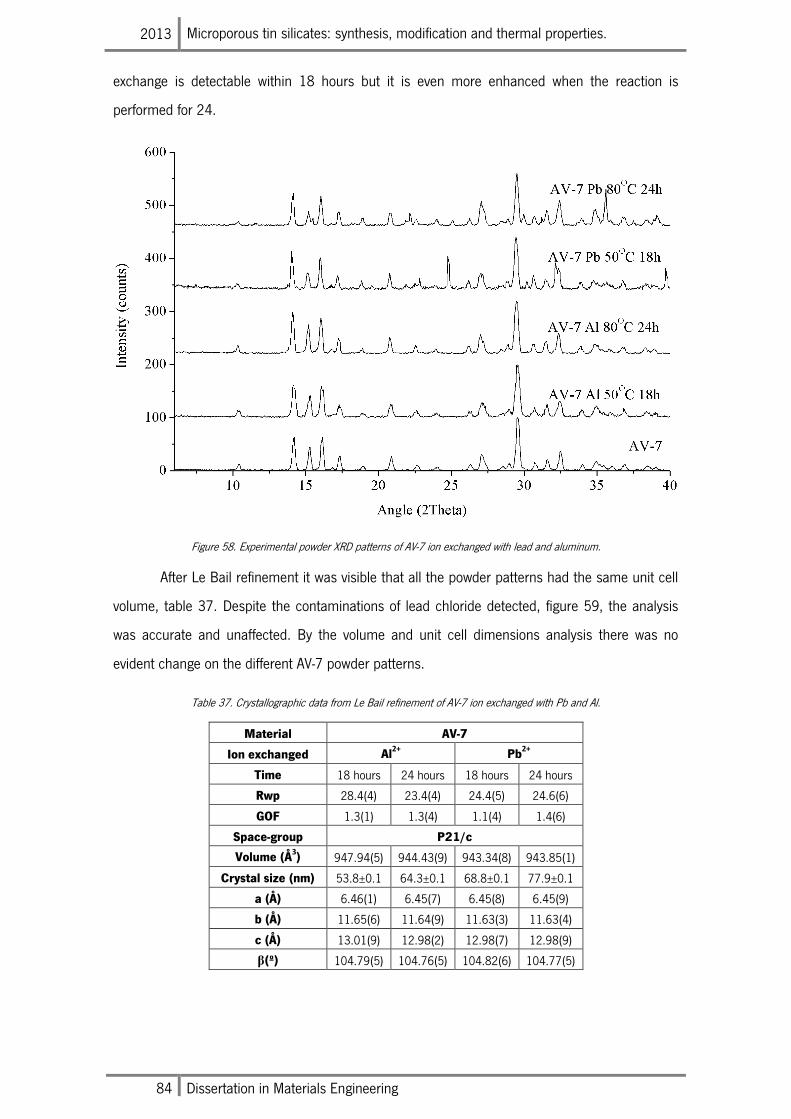
2013 Microporous tin silicates: synthesis, modification and thermal properties.
84 Dissertation in Materials Engineering
exchange is detectable within 18 hours but it is even more enhanced when the reaction is
performed for 24.
Figure 58. Experimental powder XRD patterns of AV-7 ion exchanged with lead and aluminum.
After Le Bail refinement it was visible that all the powder patterns had the same unit cell
volume, table 37. Despite the contaminations of lead chloride detected, figure 59, the analysis
was accurate and unaffected. By the volume and unit cell dimensions analysis there was no
evident change on the different AV-7 powder patterns.
Table 37. Crystallographic data from Le Bail refinement of AV-7 ion exchanged with Pb and Al.
Material AV-7
Ion exchanged Al2+
Pb2+
Time 18 hours 24 hours 18 hours 24 hours
Rwp 28.4(4) 23.4(4) 24.4(5) 24.6(6)
GOF 1.3(1) 1.3(4) 1.1(4) 1.4(6)
Space-group P21/c
Volume (Å3) 947.94(5) 944.43(9) 943.34(8) 943.85(1)
Crystal size (nm) 53.8±0.1 64.3±0.1 68.8±0.1 77.9±0.1
a (Å) 6.46(1) 6.45(7) 6.45(8) 6.45(9)
b (Å) 11.65(6) 11.64(9) 11.63(3) 11.63(4)
c (Å) 13.01(9) 12.98(2) 12.98(7) 12.98(9)
β(º) 104.79(5) 104.76(5) 104.82(6) 104.77(5)
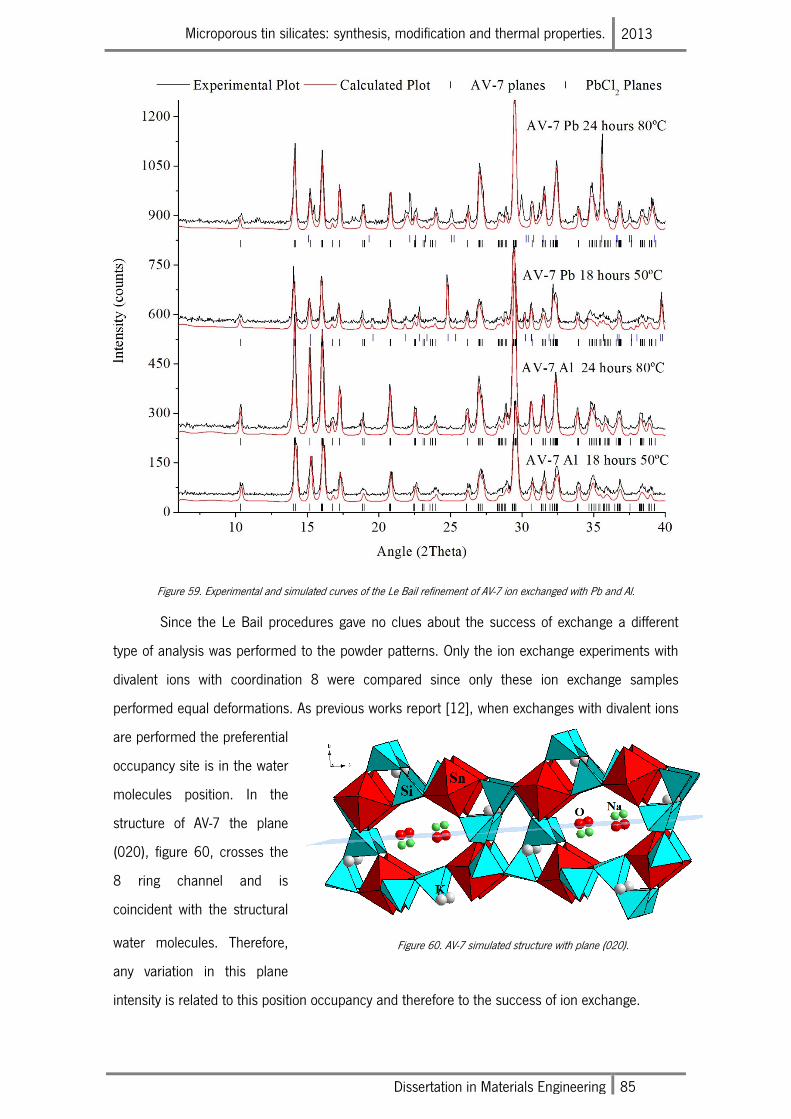
Microporous tin silicates: synthesis, modification and thermal properties. 2013
Dissertation in Materials Engineering 85
Figure 59. Experimental and simulated curves of the Le Bail refinement of AV-7 ion exchanged with Pb and Al.
Since the Le Bail procedures gave no clues about the success of exchange a different
type of analysis was performed to the powder patterns. Only the ion exchange experiments with
divalent ions with coordination 8 were compared since only these ion exchange samples
performed equal deformations. As previous works report [12], when exchanges with divalent ions
are performed the preferential
occupancy site is in the water
molecules position. In the
structure of AV-7 the plane
(020), figure 60, crosses the
8 ring channel and is
coincident with the structural
water molecules. Therefore,
any variation in this plane
intensity is related to this position occupancy and therefore to the success of ion exchange.
Figure 60. AV-7 simulated structure with plane (020).
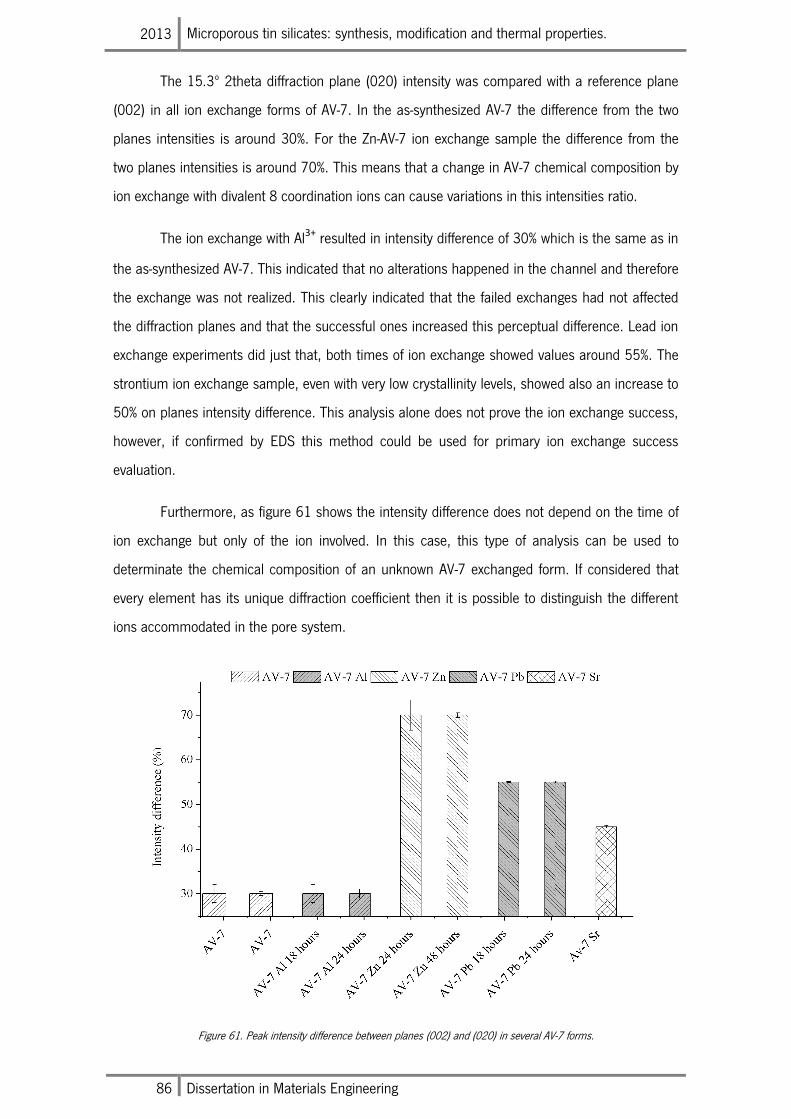
2013 Microporous tin silicates: synthesis, modification and thermal properties.
86 Dissertation in Materials Engineering
The 15.3º 2theta diffraction plane (020) intensity was compared with a reference plane
(002) in all ion exchange forms of AV-7. In the as-synthesized AV-7 the difference from the two
planes intensities is around 30%. For the Zn-AV-7 ion exchange sample the difference from the
two planes intensities is around 70%. This means that a change in AV-7 chemical composition by
ion exchange with divalent 8 coordination ions can cause variations in this intensities ratio.
The ion exchange with Al3+ resulted in intensity difference of 30% which is the same as in
the as-synthesized AV-7. This indicated that no alterations happened in the channel and therefore
the exchange was not realized. This clearly indicated that the failed exchanges had not affected
the diffraction planes and that the successful ones increased this perceptual difference. Lead ion
exchange experiments did just that, both times of ion exchange showed values around 55%. The
strontium ion exchange sample, even with very low crystallinity levels, showed also an increase to
50% on planes intensity difference. This analysis alone does not prove the ion exchange success,
however, if confirmed by EDS this method could be used for primary ion exchange success
evaluation.
Furthermore, as figure 61 shows the intensity difference does not depend on the time of
ion exchange but only of the ion involved. In this case, this type of analysis can be used to
determinate the chemical composition of an unknown AV-7 exchanged form. If considered that
every element has its unique diffraction coefficient then it is possible to distinguish the different
ions accommodated in the pore system.
Figure 61. Peak intensity difference between planes (002) and (020) in several AV-7 forms.
Microporous tin silicates: synthesis, modification and thermal properties. 2013
Dissertation in Materials Engineering 87
Since there are no ion exchanges reported on AV-7 there is no way to compare and
validate this approach for analysis. However, if other attempted exchanges behave the same way
and if the EDS results confirm the successful of ion exchange this method could be considered
optimal for AV-7 ion exchange evaluation. After that it is necessary to understand why these
different elements present this difference in this specific plane. If a physical property of the ions
is link to this behavior this analysis could gain even higher importance. It is also necessary to
prove by EDS that the different shifts come from ion type only and not by exchange percentage.
Nevertheless, even if this effect is only related to the amount of ion exchange it can be used to
calculate the amount of foreigner ions captured in this microporous framework. In this case it is
necessary to understand the relation between the intensity drop and the amount of ion
exchanged.
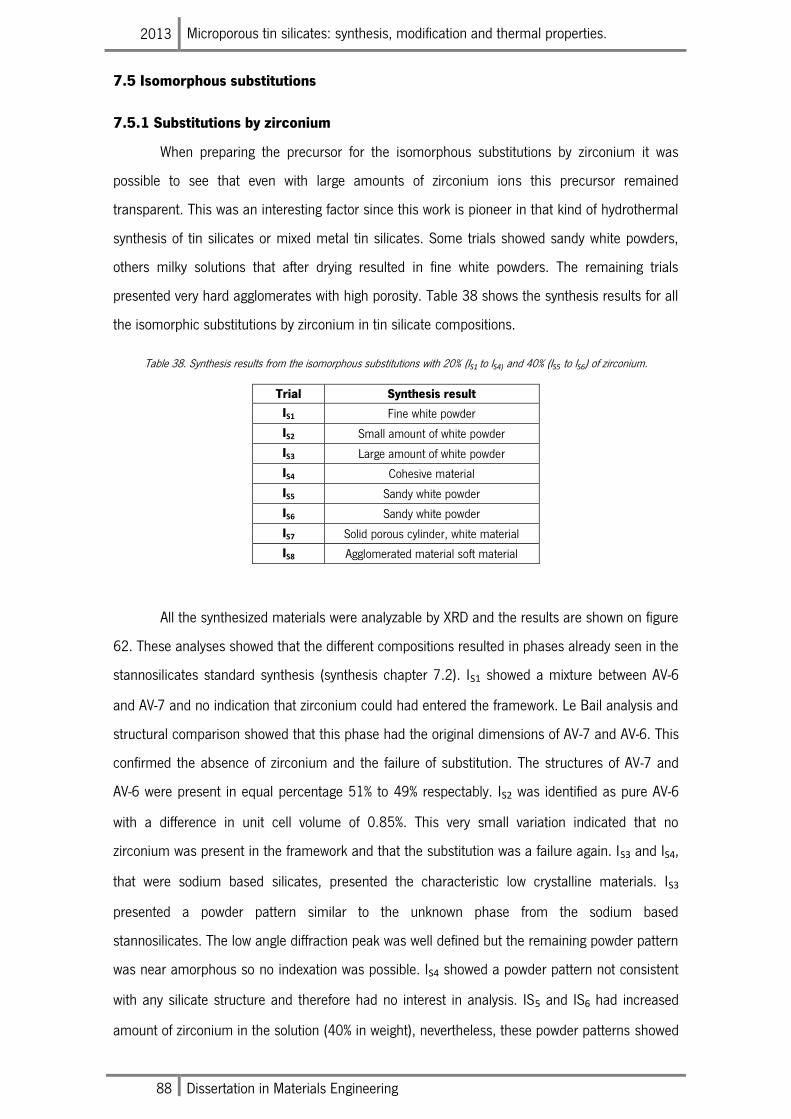
2013 Microporous tin silicates: synthesis, modification and thermal properties.
88 Dissertation in Materials Engineering
7.5 Isomorphous substitutions
7.5.1 Substitutions by zirconium
When preparing the precursor for the isomorphous substitutions by zirconium it was
possible to see that even with large amounts of zirconium ions this precursor remained
transparent. This was an interesting factor since this work is pioneer in that kind of hydrothermal
synthesis of tin silicates or mixed metal tin silicates. Some trials showed sandy white powders,
others milky solutions that after drying resulted in fine white powders. The remaining trials
presented very hard agglomerates with high porosity. Table 38 shows the synthesis results for all
the isomorphic substitutions by zirconium in tin silicate compositions.
Table 38. Synthesis results from the isomorphous substitutions with 20% (IS1 to IS4) and 40% (IS5 to IS6) of zirconium.
Trial Synthesis result
IS1 Fine white powder
IS2 Small amount of white powder
IS3 Large amount of white powder
IS4 Cohesive material
IS5 Sandy white powder
IS6 Sandy white powder
IS7 Solid porous cylinder, white material
IS8 Agglomerated material soft material
All the synthesized materials were analyzable by XRD and the results are shown on figure
62. These analyses showed that the different compositions resulted in phases already seen in the
stannosilicates standard synthesis (synthesis chapter 7.2). IS1 showed a mixture between AV-6
and AV-7 and no indication that zirconium could had entered the framework. Le Bail analysis and
structural comparison showed that this phase had the original dimensions of AV-7 and AV-6. This
confirmed the absence of zirconium and the failure of substitution. The structures of AV-7 and
AV-6 were present in equal percentage 51% to 49% respectably. IS2 was identified as pure AV-6
with a difference in unit cell volume of 0.85%. This very small variation indicated that no
zirconium was present in the framework and that the substitution was a failure again. IS3 and IS4,
that were sodium based silicates, presented the characteristic low crystalline materials. IS3
presented a powder pattern similar to the unknown phase from the sodium based
stannosilicates. The low angle diffraction peak was well defined but the remaining powder pattern
was near amorphous so no indexation was possible. IS4 showed a powder pattern not consistent
with any silicate structure and therefore had no interest in analysis. IS5 and IS6 had increased
amount of zirconium in the solution (40% in weight), nevertheless, these powder patterns showed
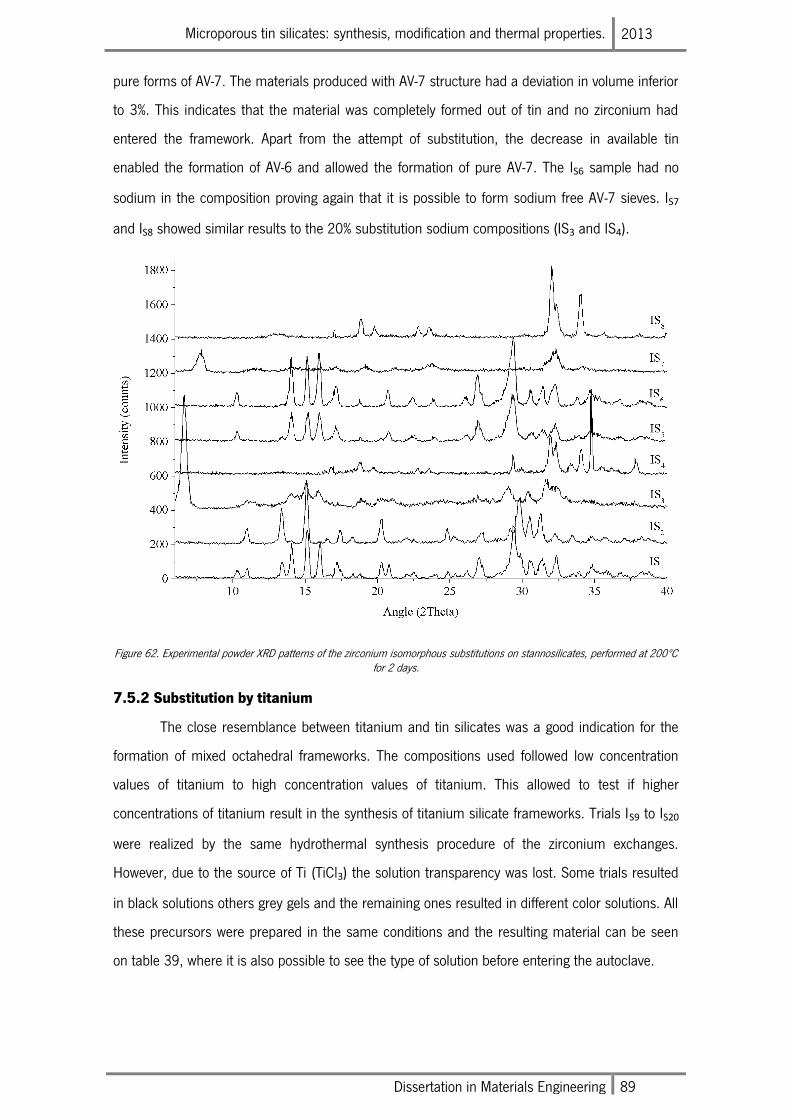
Microporous tin silicates: synthesis, modification and thermal properties. 2013
Dissertation in Materials Engineering 89
pure forms of AV-7. The materials produced with AV-7 structure had a deviation in volume inferior
to 3%. This indicates that the material was completely formed out of tin and no zirconium had
entered the framework. Apart from the attempt of substitution, the decrease in available tin
enabled the formation of AV-6 and allowed the formation of pure AV-7. The IS6 sample had no
sodium in the composition proving again that it is possible to form sodium free AV-7 sieves. IS7
and IS8 showed similar results to the 20% substitution sodium compositions (IS3 and IS4).
Figure 62. Experimental powder XRD patterns of the zirconium isomorphous substitutions on stannosilicates, performed at 200ºC for 2 days.
7.5.2 Substitution by titanium
The close resemblance between titanium and tin silicates was a good indication for the
formation of mixed octahedral frameworks. The compositions used followed low concentration
values of titanium to high concentration values of titanium. This allowed to test if higher
concentrations of titanium result in the synthesis of titanium silicate frameworks. Trials IS9 to IS20
were realized by the same hydrothermal synthesis procedure of the zirconium exchanges.
However, due to the source of Ti (TiCl3) the solution transparency was lost. Some trials resulted
in black solutions others grey gels and the remaining ones resulted in different color solutions. All
these precursors were prepared in the same conditions and the resulting material can be seen
on table 39, where it is also possible to see the type of solution before entering the autoclave.
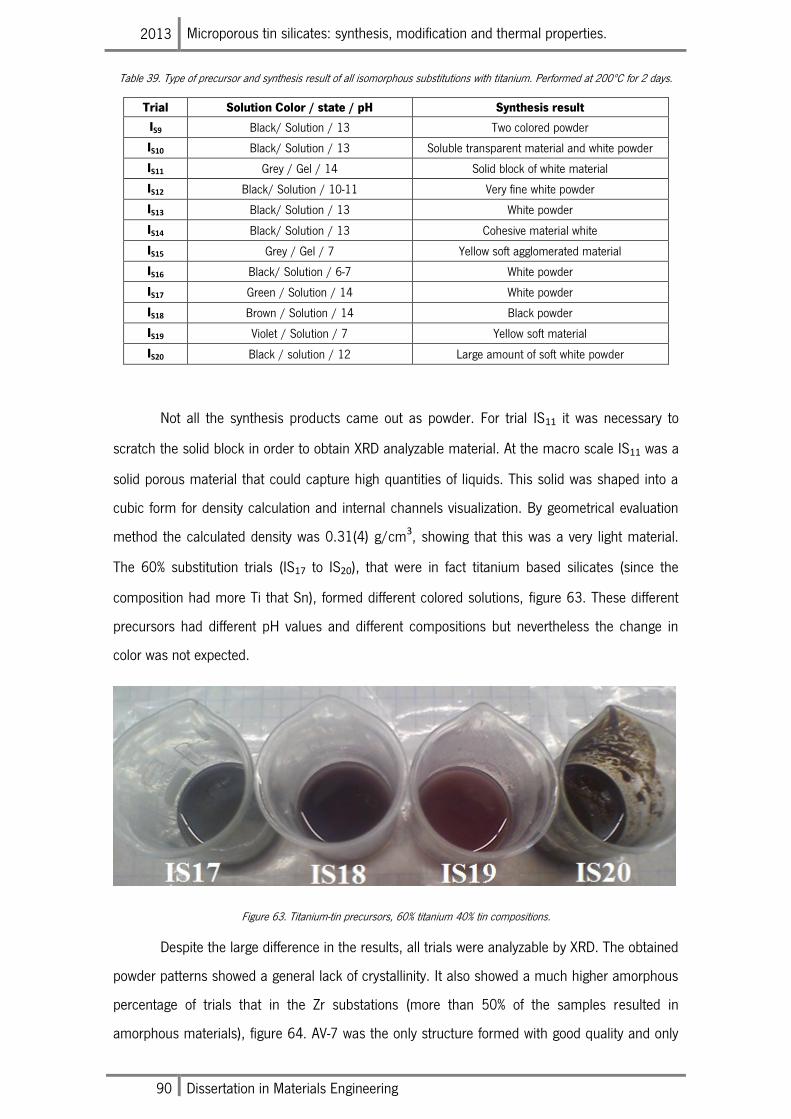
2013 Microporous tin silicates: synthesis, modification and thermal properties.
90 Dissertation in Materials Engineering
Table 39. Type of precursor and synthesis result of all isomorphous substitutions with titanium. Performed at 200ºC for 2 days.
Trial Solution Color / state / pH Synthesis result
IS9 Black/ Solution / 13 Two colored powder
IS10 Black/ Solution / 13 Soluble transparent material and white powder
IS11 Grey / Gel / 14 Solid block of white material
IS12 Black/ Solution / 10-11 Very fine white powder
IS13 Black/ Solution / 13 White powder
IS14 Black/ Solution / 13 Cohesive material white
IS15 Grey / Gel / 7 Yellow soft agglomerated material
IS16 Black/ Solution / 6-7 White powder
IS17 Green / Solution / 14 White powder
IS18 Brown / Solution / 14 Black powder
IS19 Violet / Solution / 7 Yellow soft material
IS20 Black / solution / 12 Large amount of soft white powder
Not all the synthesis products came out as powder. For trial IS11 it was necessary to
scratch the solid block in order to obtain XRD analyzable material. At the macro scale IS11 was a
solid porous material that could capture high quantities of liquids. This solid was shaped into a
cubic form for density calculation and internal channels visualization. By geometrical evaluation
method the calculated density was 0.31(4) g/cm3, showing that this was a very light material.
The 60% substitution trials (IS17 to IS20), that were in fact titanium based silicates (since the
composition had more Ti that Sn), formed different colored solutions, figure 63. These different
precursors had different pH values and different compositions but nevertheless the change in
color was not expected.
Figure 63. Titanium-tin precursors, 60% titanium 40% tin compositions.
Despite the large difference in the results, all trials were analyzable by XRD. The obtained
powder patterns showed a general lack of crystallinity. It also showed a much higher amorphous
percentage of trials that in the Zr substations (more than 50% of the samples resulted in
amorphous materials), figure 64. AV-7 was the only structure formed with good quality and only
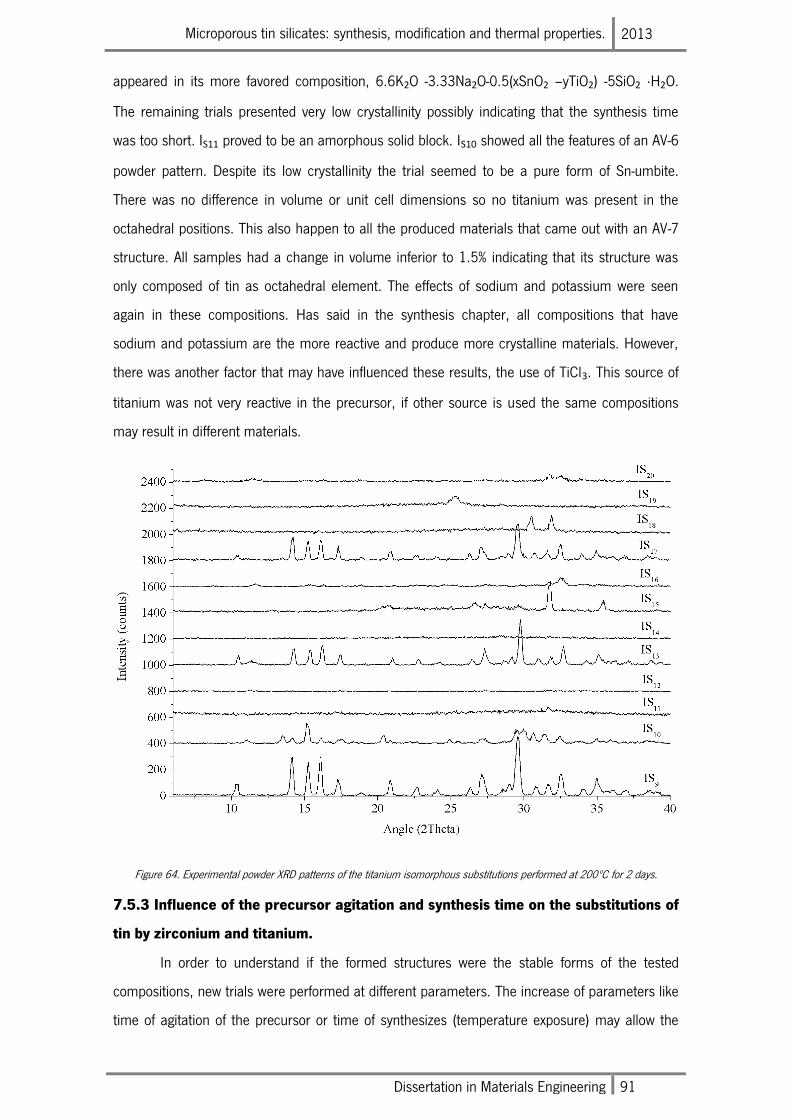
Microporous tin silicates: synthesis, modification and thermal properties. 2013
Dissertation in Materials Engineering 91
appeared in its more favored composition, 6.6K2O -3.33Na2O-0.5(xSnO2 –yTiO2) -5SiO2 ∙H2O.
The remaining trials presented very low crystallinity possibly indicating that the synthesis time
was too short. IS11 proved to be an amorphous solid block. IS10 showed all the features of an AV-6
powder pattern. Despite its low crystallinity the trial seemed to be a pure form of Sn-umbite.
There was no difference in volume or unit cell dimensions so no titanium was present in the
octahedral positions. This also happen to all the produced materials that came out with an AV-7
structure. All samples had a change in volume inferior to 1.5% indicating that its structure was
only composed of tin as octahedral element. The effects of sodium and potassium were seen
again in these compositions. Has said in the synthesis chapter, all compositions that have
sodium and potassium are the more reactive and produce more crystalline materials. However,
there was another factor that may have influenced these results, the use of TiCl3. This source of
titanium was not very reactive in the precursor, if other source is used the same compositions
may result in different materials.
Figure 64. Experimental powder XRD patterns of the titanium isomorphous substitutions performed at 200ºC for 2 days.
7.5.3 Influence of the precursor agitation and synthesis time on the substitutions of
tin by zirconium and titanium.
In order to understand if the formed structures were the stable forms of the tested
compositions, new trials were performed at different parameters. The increase of parameters like
time of agitation of the precursor or time of synthesizes (temperature exposure) may allow the
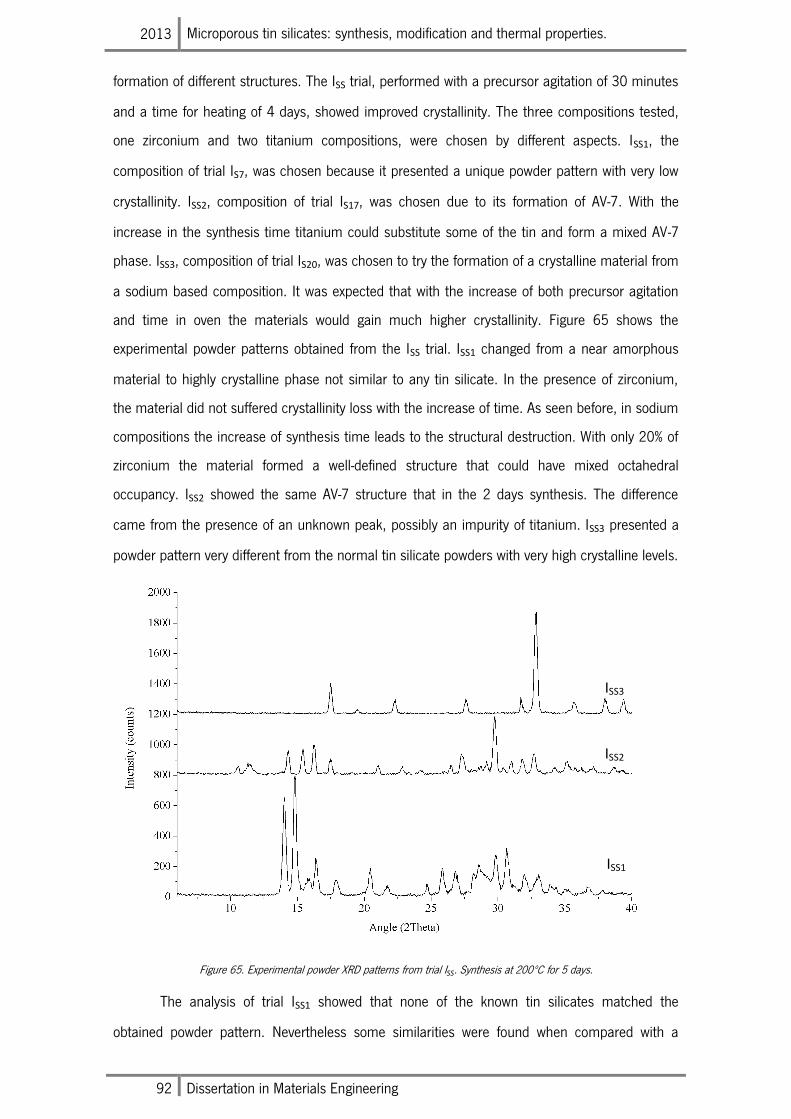
2013 Microporous tin silicates: synthesis, modification and thermal properties.
92 Dissertation in Materials Engineering
formation of different structures. The ISS trial, performed with a precursor agitation of 30 minutes
and a time for heating of 4 days, showed improved crystallinity. The three compositions tested,
one zirconium and two titanium compositions, were chosen by different aspects. ISS1, the
composition of trial IS7, was chosen because it presented a unique powder pattern with very low
crystallinity. ISS2, composition of trial IS17, was chosen due to its formation of AV-7. With the
increase in the synthesis time titanium could substitute some of the tin and form a mixed AV-7
phase. ISS3, composition of trial IS20, was chosen to try the formation of a crystalline material from
a sodium based composition. It was expected that with the increase of both precursor agitation
and time in oven the materials would gain much higher crystallinity. Figure 65 shows the
experimental powder patterns obtained from the ISS trial. ISS1 changed from a near amorphous
material to highly crystalline phase not similar to any tin silicate. In the presence of zirconium,
the material did not suffered crystallinity loss with the increase of time. As seen before, in sodium
compositions the increase of synthesis time leads to the structural destruction. With only 20% of
zirconium the material formed a well-defined structure that could have mixed octahedral
occupancy. ISS2 showed the same AV-7 structure that in the 2 days synthesis. The difference
came from the presence of an unknown peak, possibly an impurity of titanium. ISS3 presented a
powder pattern very different from the normal tin silicate powders with very high crystalline levels.
Figure 65. Experimental powder XRD patterns from trial ISS. Synthesis at 200ºC for 5 days.
The analysis of trial ISS1 showed that none of the known tin silicates matched the
obtained powder pattern. Nevertheless some similarities were found when compared with a
ISS1
ISS2
ISS3
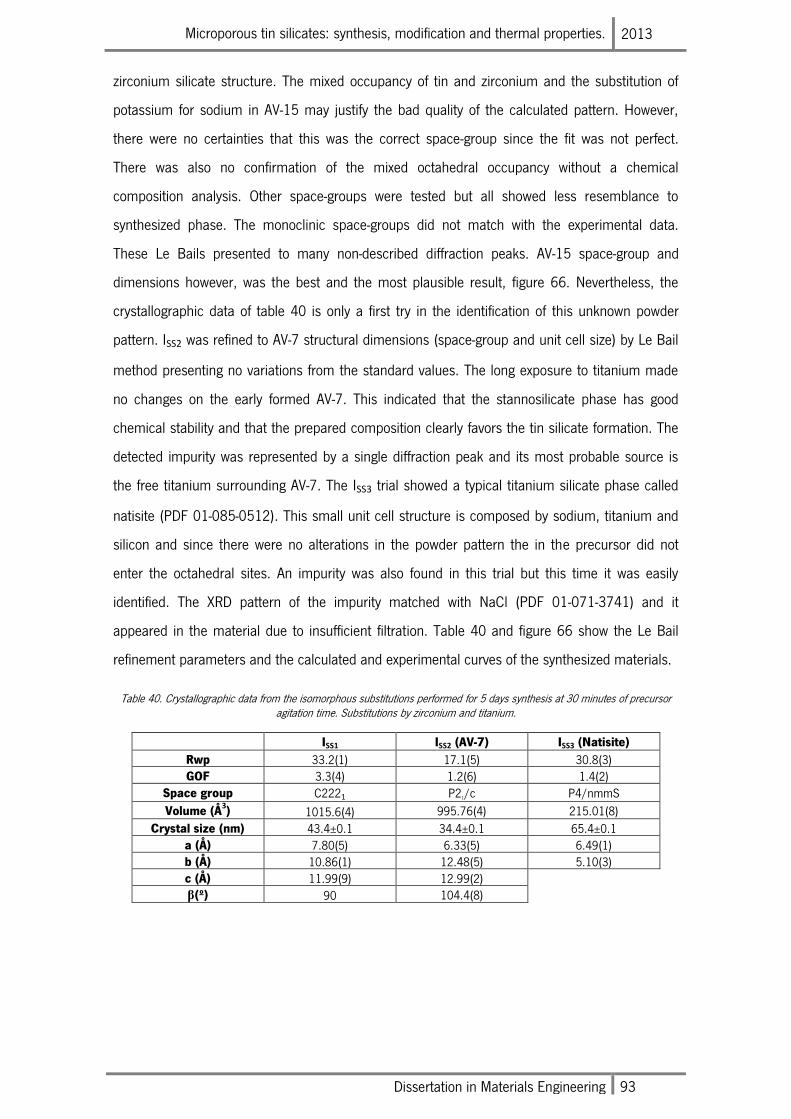
Microporous tin silicates: synthesis, modification and thermal properties. 2013
Dissertation in Materials Engineering 93
zirconium silicate structure. The mixed occupancy of tin and zirconium and the substitution of
potassium for sodium in AV-15 may justify the bad quality of the calculated pattern. However,
there were no certainties that this was the correct space-group since the fit was not perfect.
There was also no confirmation of the mixed octahedral occupancy without a chemical
composition analysis. Other space-groups were tested but all showed less resemblance to
synthesized phase. The monoclinic space-groups did not match with the experimental data.
These Le Bails presented to many non-described diffraction peaks. AV-15 space-group and
dimensions however, was the best and the most plausible result, figure 66. Nevertheless, the
crystallographic data of table 40 is only a first try in the identification of this unknown powder
pattern. ISS2 was refined to AV-7 structural dimensions (space-group and unit cell size) by Le Bail
method presenting no variations from the standard values. The long exposure to titanium made
no changes on the early formed AV-7. This indicated that the stannosilicate phase has good
chemical stability and that the prepared composition clearly favors the tin silicate formation. The
detected impurity was represented by a single diffraction peak and its most probable source is
the free titanium surrounding AV-7. The ISS3 trial showed a typical titanium silicate phase called
natisite (PDF 01-085-0512). This small unit cell structure is composed by sodium, titanium and
silicon and since there were no alterations in the powder pattern the in the precursor did not
enter the octahedral sites. An impurity was also found in this trial but this time it was easily
identified. The XRD pattern of the impurity matched with NaCl (PDF 01-071-3741) and it
appeared in the material due to insufficient filtration. Table 40 and figure 66 show the Le Bail
refinement parameters and the calculated and experimental curves of the synthesized materials.
Table 40. Crystallographic data from the isomorphous substitutions performed for 5 days synthesis at 30 minutes of precursor agitation time. Substitutions by zirconium and titanium.
ISS1 ISS2 (AV-7) ISS3 (Natisite)
Rwp 33.2(1) 17.1(5) 30.8(3) GOF 3.3(4) 1.2(6) 1.4(2)
Space group C2221 P21/c P4/nmmS
Volume (Å3) 1015.6(4) 995.76(4) 215.01(8)
Crystal size (nm) 43.4±0.1 34.4±0.1 65.4±0.1 a (Å) 7.80(5) 6.33(5) 6.49(1) b (Å) 10.86(1) 12.48(5) 5.10(3) c (Å) 11.99(9) 12.99(2) β(º) 90 104.4(8)
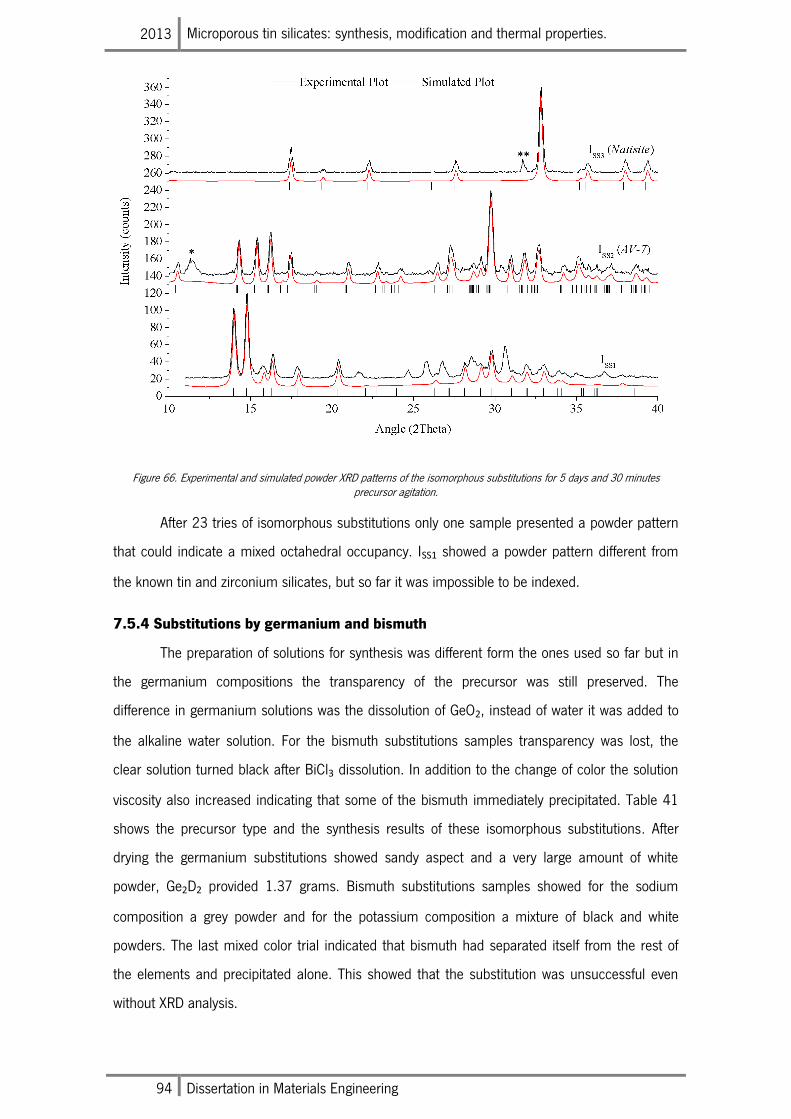
2013 Microporous tin silicates: synthesis, modification and thermal properties.
94 Dissertation in Materials Engineering
Figure 66. Experimental and simulated powder XRD patterns of the isomorphous substitutions for 5 days and 30 minutes precursor agitation.
After 23 tries of isomorphous substitutions only one sample presented a powder pattern
that could indicate a mixed octahedral occupancy. ISS1 showed a powder pattern different from
the known tin and zirconium silicates, but so far it was impossible to be indexed.
7.5.4 Substitutions by germanium and bismuth
The preparation of solutions for synthesis was different form the ones used so far but in
the germanium compositions the transparency of the precursor was still preserved. The
difference in germanium solutions was the dissolution of GeO2, instead of water it was added to
the alkaline water solution. For the bismuth substitutions samples transparency was lost, the
clear solution turned black after BiCl3 dissolution. In addition to the change of color the solution
viscosity also increased indicating that some of the bismuth immediately precipitated. Table 41
shows the precursor type and the synthesis results of these isomorphous substitutions. After
drying the germanium substitutions showed sandy aspect and a very large amount of white
powder, Ge2D2 provided 1.37 grams. Bismuth substitutions samples showed for the sodium
composition a grey powder and for the potassium composition a mixture of black and white
powders. The last mixed color trial indicated that bismuth had separated itself from the rest of
the elements and precipitated alone. This showed that the substitution was unsuccessful even
without XRD analysis.
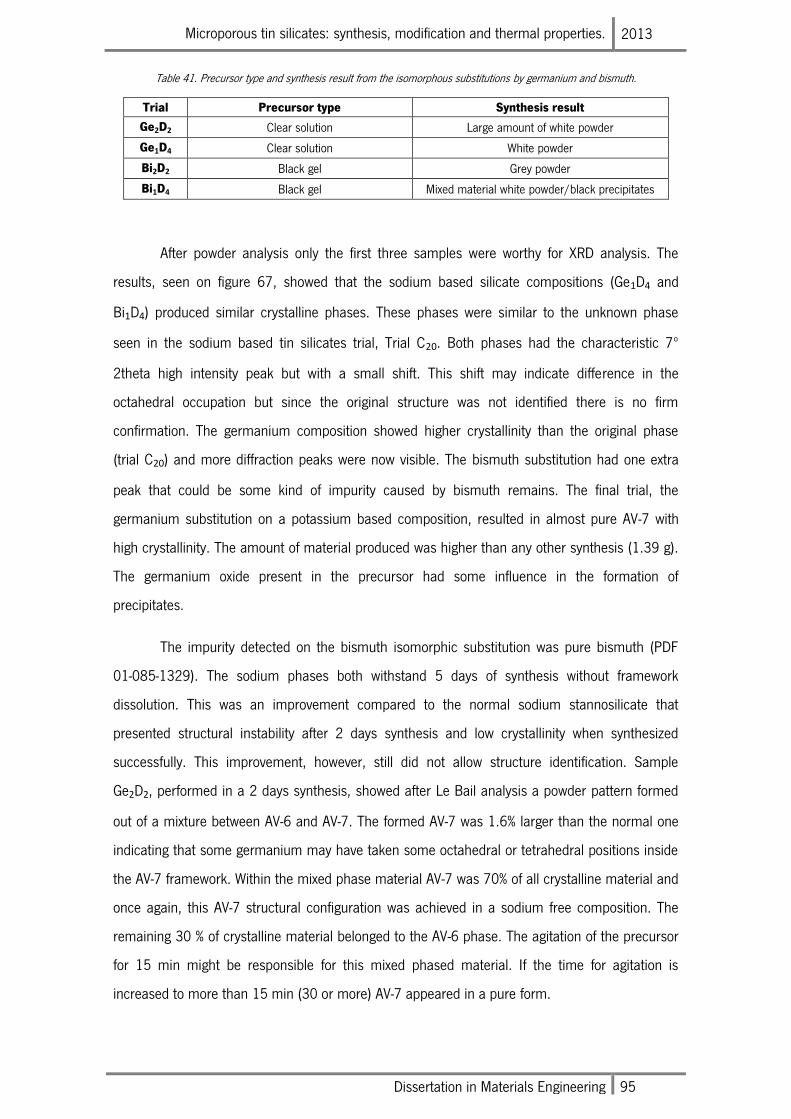
Microporous tin silicates: synthesis, modification and thermal properties. 2013
Dissertation in Materials Engineering 95
Table 41. Precursor type and synthesis result from the isomorphous substitutions by germanium and bismuth.
Trial Precursor type Synthesis result
Ge2D2 Clear solution Large amount of white powder
Ge1D4 Clear solution White powder
Bi2D2 Black gel Grey powder
Bi1D4 Black gel Mixed material white powder/black precipitates
After powder analysis only the first three samples were worthy for XRD analysis. The
results, seen on figure 67, showed that the sodium based silicate compositions (Ge1D4 and
Bi1D4) produced similar crystalline phases. These phases were similar to the unknown phase
seen in the sodium based tin silicates trial, Trial C20. Both phases had the characteristic 7º
2theta high intensity peak but with a small shift. This shift may indicate difference in the
octahedral occupation but since the original structure was not identified there is no firm
confirmation. The germanium composition showed higher crystallinity than the original phase
(trial C20) and more diffraction peaks were now visible. The bismuth substitution had one extra
peak that could be some kind of impurity caused by bismuth remains. The final trial, the
germanium substitution on a potassium based composition, resulted in almost pure AV-7 with
high crystallinity. The amount of material produced was higher than any other synthesis (1.39 g).
The germanium oxide present in the precursor had some influence in the formation of
precipitates.
The impurity detected on the bismuth isomorphic substitution was pure bismuth (PDF
01-085-1329). The sodium phases both withstand 5 days of synthesis without framework
dissolution. This was an improvement compared to the normal sodium stannosilicate that
presented structural instability after 2 days synthesis and low crystallinity when synthesized
successfully. This improvement, however, still did not allow structure identification. Sample
Ge2D2, performed in a 2 days synthesis, showed after Le Bail analysis a powder pattern formed
out of a mixture between AV-6 and AV-7. The formed AV-7 was 1.6% larger than the normal one
indicating that some germanium may have taken some octahedral or tetrahedral positions inside
the AV-7 framework. Within the mixed phase material AV-7 was 70% of all crystalline material and
once again, this AV-7 structural configuration was achieved in a sodium free composition. The
remaining 30 % of crystalline material belonged to the AV-6 phase. The agitation of the precursor
for 15 min might be responsible for this mixed phased material. If the time for agitation is
increased to more than 15 min (30 or more) AV-7 appeared in a pure form.
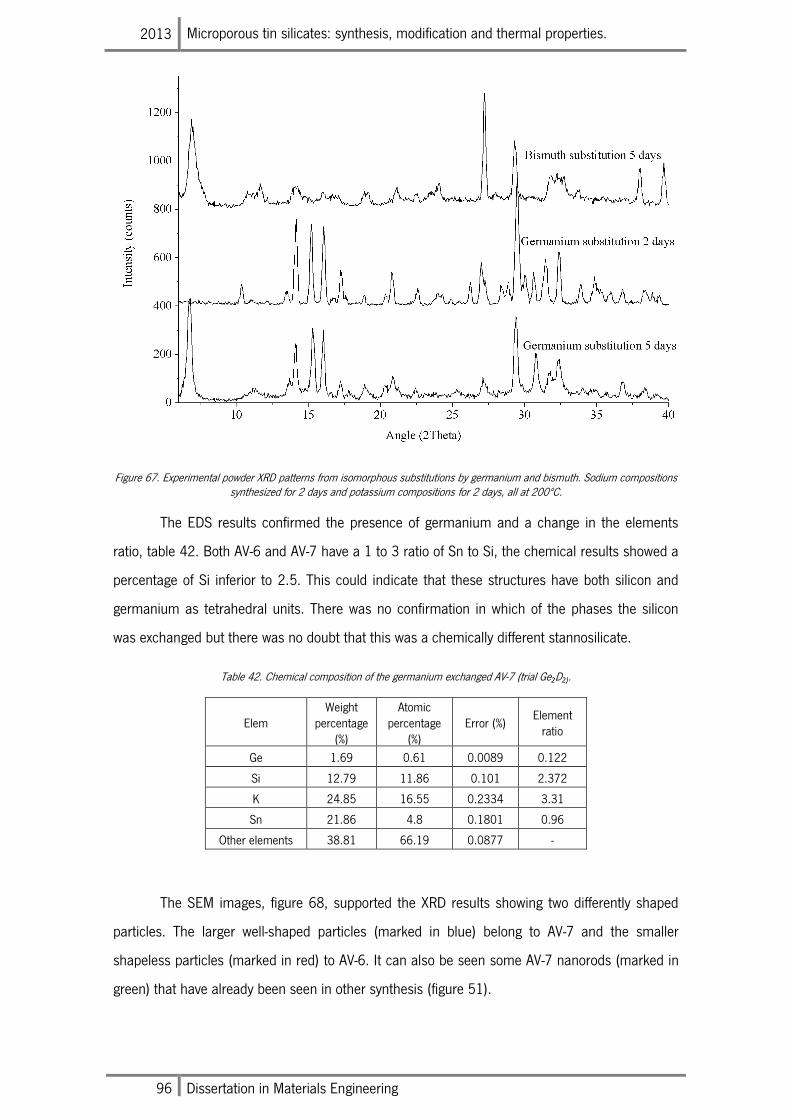
2013 Microporous tin silicates: synthesis, modification and thermal properties.
96 Dissertation in Materials Engineering
Figure 67. Experimental powder XRD patterns from isomorphous substitutions by germanium and bismuth. Sodium compositions synthesized for 2 days and potassium compositions for 2 days, all at 200ºC.
The EDS results confirmed the presence of germanium and a change in the elements
ratio, table 42. Both AV-6 and AV-7 have a 1 to 3 ratio of Sn to Si, the chemical results showed a
percentage of Si inferior to 2.5. This could indicate that these structures have both silicon and
germanium as tetrahedral units. There was no confirmation in which of the phases the silicon
was exchanged but there was no doubt that this was a chemically different stannosilicate.
Table 42. Chemical composition of the germanium exchanged AV-7 (trial Ge2D2).
Elem Weight
percentage (%)
Atomic percentage
(%) Error (%)
Element ratio
Ge 1.69 0.61 0.0089 0.122
Si 12.79 11.86 0.101 2.372
K 24.85 16.55 0.2334 3.31
Sn 21.86 4.8 0.1801 0.96
Other elements 38.81 66.19 0.0877 -
The SEM images, figure 68, supported the XRD results showing two differently shaped
particles. The larger well-shaped particles (marked in blue) belong to AV-7 and the smaller
shapeless particles (marked in red) to AV-6. It can also be seen some AV-7 nanorods (marked in
green) that have already been seen in other synthesis (figure 51).
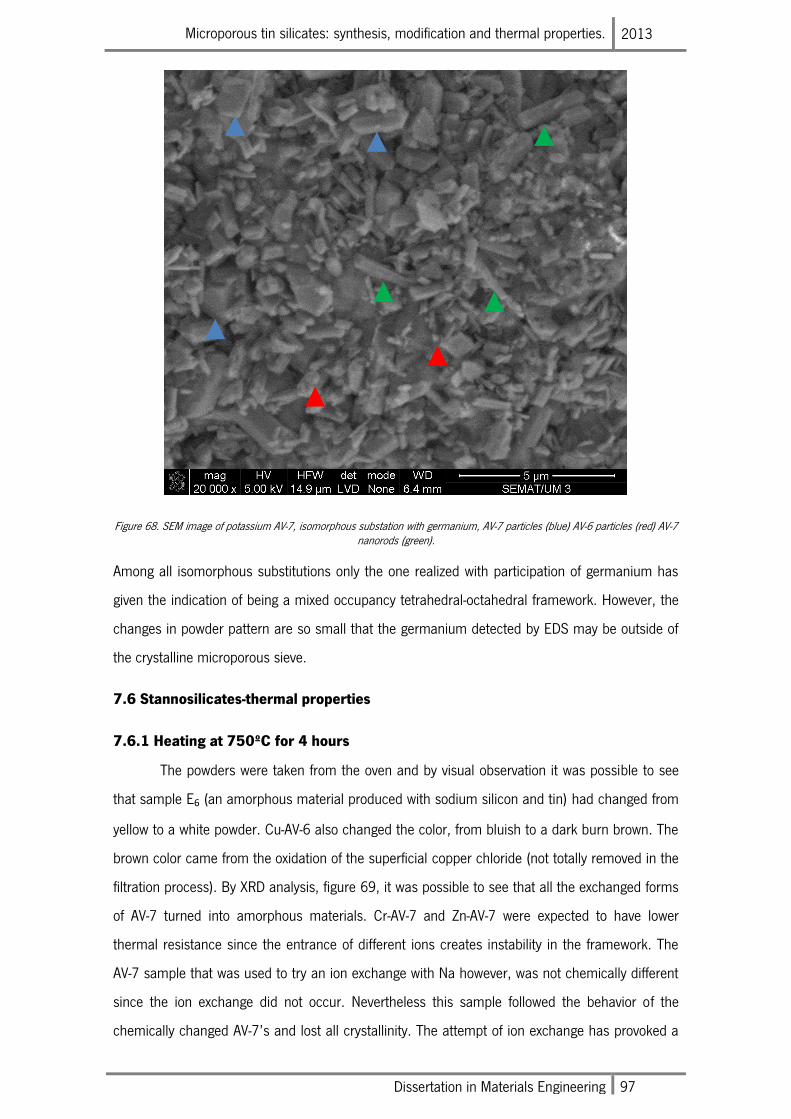
Microporous tin silicates: synthesis, modification and thermal properties. 2013
Dissertation in Materials Engineering 97
Figure 68. SEM image of potassium AV-7, isomorphous substation with germanium, AV-7 particles (blue) AV-6 particles (red) AV-7 nanorods (green).
Among all isomorphous substitutions only the one realized with participation of germanium has
given the indication of being a mixed occupancy tetrahedral-octahedral framework. However, the
changes in powder pattern are so small that the germanium detected by EDS may be outside of
the crystalline microporous sieve.
7.6 Stannosilicates-thermal properties
7.6.1 Heating at 750ºC for 4 hours
The powders were taken from the oven and by visual observation it was possible to see
that sample E6 (an amorphous material produced with sodium silicon and tin) had changed from
yellow to a white powder. Cu-AV-6 also changed the color, from bluish to a dark burn brown. The
brown color came from the oxidation of the superficial copper chloride (not totally removed in the
filtration process). By XRD analysis, figure 69, it was possible to see that all the exchanged forms
of AV-7 turned into amorphous materials. Cr-AV-7 and Zn-AV-7 were expected to have lower
thermal resistance since the entrance of different ions creates instability in the framework. The
AV-7 sample that was used to try an ion exchange with Na however, was not chemically different
since the ion exchange did not occur. Nevertheless this sample followed the behavior of the
chemically changed AV-7’s and lost all crystallinity. The attempt of ion exchange has provoked a
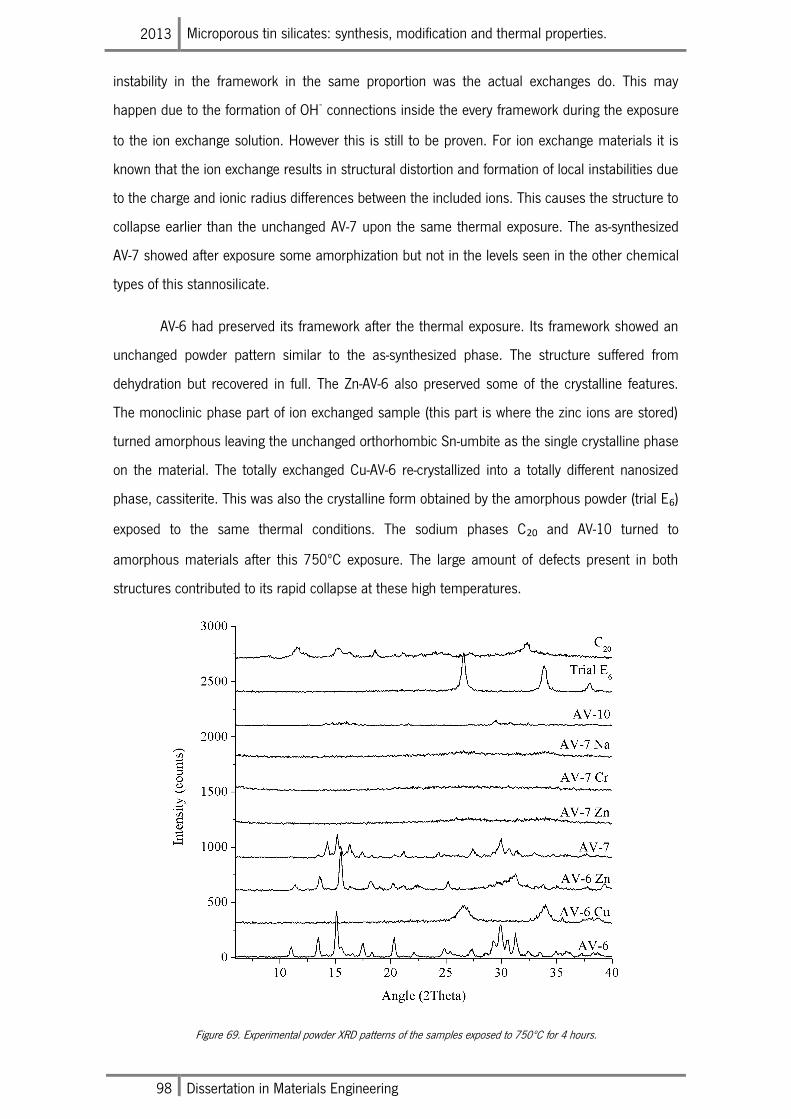
2013 Microporous tin silicates: synthesis, modification and thermal properties.
98 Dissertation in Materials Engineering
instability in the framework in the same proportion was the actual exchanges do. This may
happen due to the formation of OH- connections inside the every framework during the exposure
to the ion exchange solution. However this is still to be proven. For ion exchange materials it is
known that the ion exchange results in structural distortion and formation of local instabilities due
to the charge and ionic radius differences between the included ions. This causes the structure to
collapse earlier than the unchanged AV-7 upon the same thermal exposure. The as-synthesized
AV-7 showed after exposure some amorphization but not in the levels seen in the other chemical
types of this stannosilicate.
AV-6 had preserved its framework after the thermal exposure. Its framework showed an
unchanged powder pattern similar to the as-synthesized phase. The structure suffered from
dehydration but recovered in full. The Zn-AV-6 also preserved some of the crystalline features.
The monoclinic phase part of ion exchanged sample (this part is where the zinc ions are stored)
turned amorphous leaving the unchanged orthorhombic Sn-umbite as the single crystalline phase
on the material. The totally exchanged Cu-AV-6 re-crystallized into a totally different nanosized
phase, cassiterite. This was also the crystalline form obtained by the amorphous powder (trial E6)
exposed to the same thermal conditions. The sodium phases C20 and AV-10 turned to
amorphous materials after this 750ºC exposure. The large amount of defects present in both
structures contributed to its rapid collapse at these high temperatures.
Figure 69. Experimental powder XRD patterns of the samples exposed to 750ºC for 4 hours.
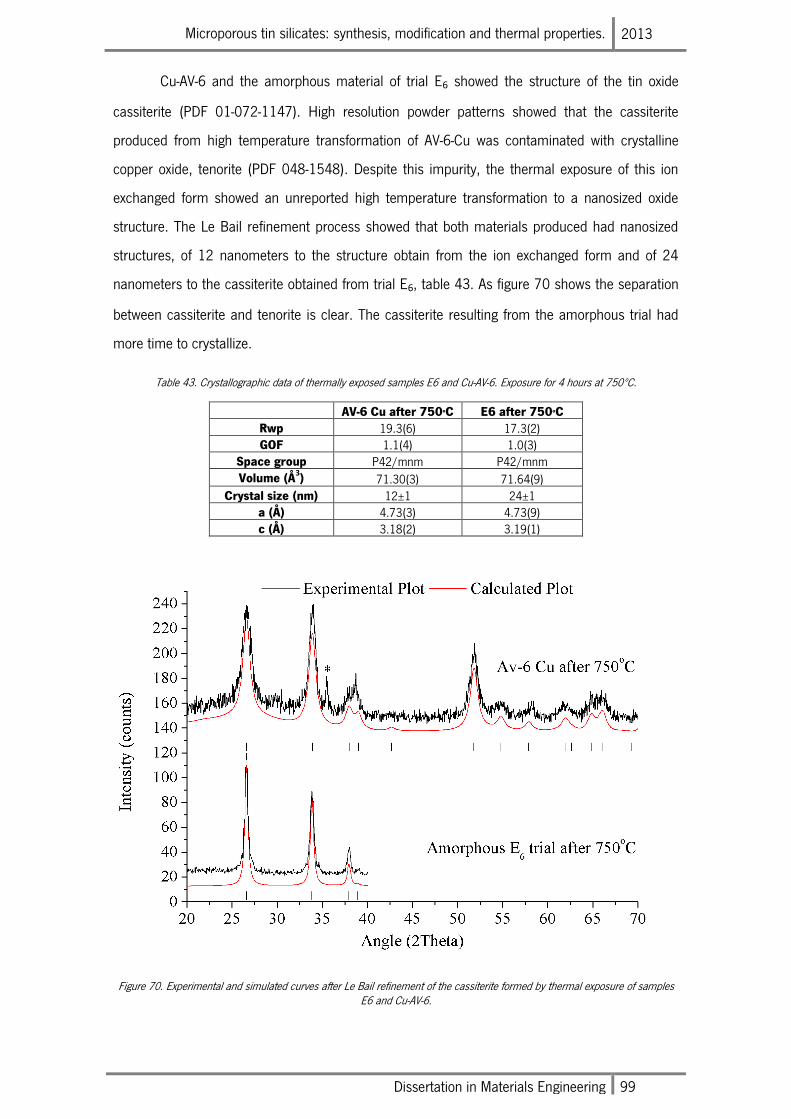
Microporous tin silicates: synthesis, modification and thermal properties. 2013
Dissertation in Materials Engineering 99
Cu-AV-6 and the amorphous material of trial E6 showed the structure of the tin oxide
cassiterite (PDF 01-072-1147). High resolution powder patterns showed that the cassiterite
produced from high temperature transformation of AV-6-Cu was contaminated with crystalline
copper oxide, tenorite (PDF 048-1548). Despite this impurity, the thermal exposure of this ion
exchanged form showed an unreported high temperature transformation to a nanosized oxide
structure. The Le Bail refinement process showed that both materials produced had nanosized
structures, of 12 nanometers to the structure obtain from the ion exchanged form and of 24
nanometers to the cassiterite obtained from trial E6, table 43. As figure 70 shows the separation
between cassiterite and tenorite is clear. The cassiterite resulting from the amorphous trial had
more time to crystallize.
Table 43. Crystallographic data of thermally exposed samples E6 and Cu-AV-6. Exposure for 4 hours at 750ºC.
AV-6 Cu after 750oC E6 after 750oC
Rwp 19.3(6) 17.3(2) GOF 1.1(4) 1.0(3)
Space group P42/mnm P42/mnm Volume (Å
3) 71.30(3) 71.64(9)
Crystal size (nm) 12±1 24±1 a (Å) 4.73(3) 4.73(9) c (Å) 3.18(2) 3.19(1)
Figure 70. Experimental and simulated curves after Le Bail refinement of the cassiterite formed by thermal exposure of samples E6 and Cu-AV-6.
2013 Microporous tin silicates: synthesis, modification and thermal properties.
100 Dissertation in Materials Engineering
The transformation of amorphous material into nanosized cassiterite was unexpected but
of small interest in terms of stannosilicates thermal properties. However, the Cu-AV-6 high-
temperature transformation into cassiterite was a unique behavior in this type of frameworks. The
normal thermal transformation of AV-6 is Sn-AV-14 or Sn-wadeite depending on the temperatures
of thermal exposure. Copper had a vital role in the formation of this phase so it is possible that
during the heating process some other phenomena may have happened differently from the
typical behavior of AV-6.
7.6.2 Detailed analysis of AV-6 and AV-6-Cu thermal stability
The thermal behavior of AV-6 was already studied and reported [54]. In that study it was
possible to see that this framework has a negative thermal expansion after 200ºC and that the
expansion is reversible as the samples temperature drops again. This negative thermal expansion
was detected by the shift of the diffraction peaks. In this work the same thermal study was
performed in order to compare the behavior of AV-6 and Cu-AV-6.
The two chemically different phases showed different behavior at high temperatures,
figure 71. The change in the powder pattern of AV-6 was correspondent to a negative thermal
expansion. This phenomenon was already reported [54] but in this sample the expansion happen
at higher temperatures. The main reason for this higher temperature reaction was the presence
of normal pressure in the surrounding environment. In the previous report [54] the thermal study
was performed in a vacuum environment causing the water release and consequent negative
expansion to happen at lower temperatures. This change was seen in the powder pattern by an
intensity increased peak and a slight movement on some diffraction planes. In terms of unit cell
the c-axis suffered higher contraction making the volume drop after the 300ºC. For Cu-AV-6 this
negative expansion appeared at lower temperature (200ºC). To this chemical form of AV-6 the
expansion caused even more changes in the powder pattern. The volume drop was near 2 times
the one seen on AV-6 due to the contractions of b- and c- axes (figure 71). The exchange of
potassium for copper accelerated and intensified the negative thermal expansion but also
introduced thermal instability. The AV-6 sample reached 700ºC without any crystallinity drop, Cu-
AV-6 started amorphization after 500ºC. This amorphization lead to the recrystallization of
cassiterite at 750ºC as it was seen in the previous point.
By Le Bail analysis it was possible to understand that AV-6 changes its space-group at
300ºC, from orthorhombic P212121 to monoclinic P21/c. This change happens without any
crystallinity loss and with complete reversibility as shown in figure 72. Figure 72 shows powder
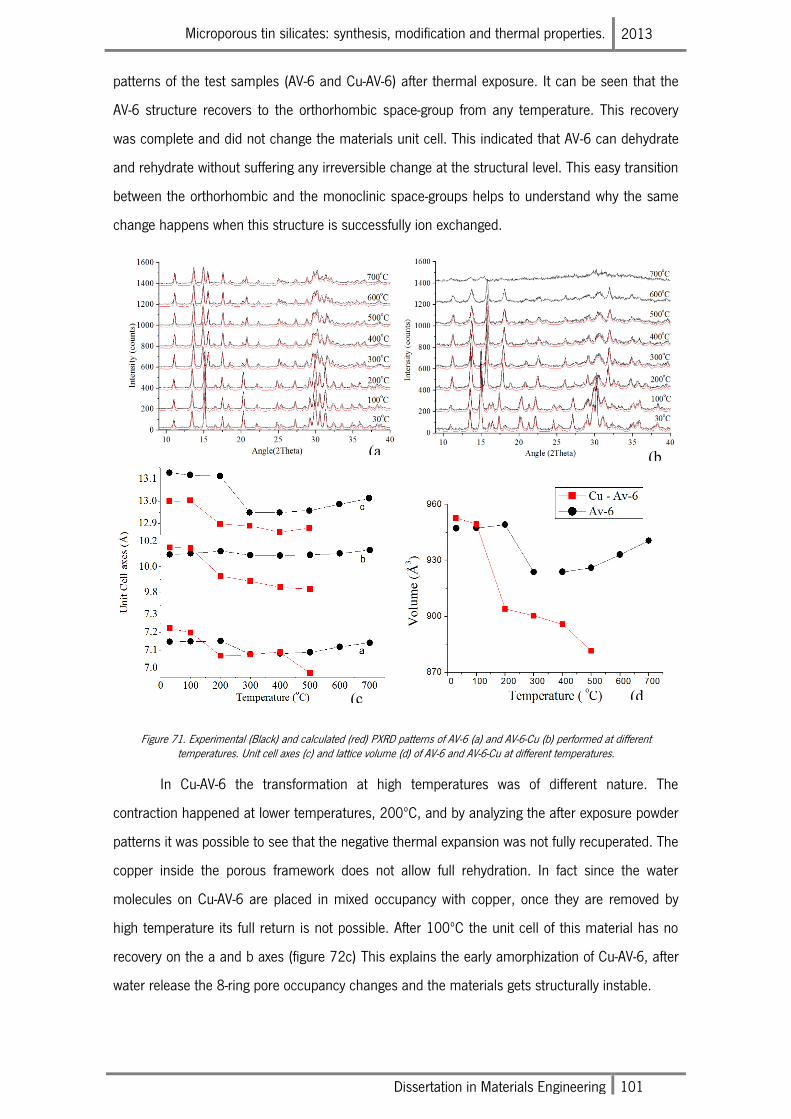
Microporous tin silicates: synthesis, modification and thermal properties. 2013
Dissertation in Materials Engineering 101
patterns of the test samples (AV-6 and Cu-AV-6) after thermal exposure. It can be seen that the
AV-6 structure recovers to the orthorhombic space-group from any temperature. This recovery
was complete and did not change the materials unit cell. This indicated that AV-6 can dehydrate
and rehydrate without suffering any irreversible change at the structural level. This easy transition
between the orthorhombic and the monoclinic space-groups helps to understand why the same
change happens when this structure is successfully ion exchanged.
Figure 71. Experimental (Black) and calculated (red) PXRD patterns of AV-6 (a) and AV-6-Cu (b) performed at different temperatures. Unit cell axes (c) and lattice volume (d) of AV-6 and AV-6-Cu at different temperatures.
In Cu-AV-6 the transformation at high temperatures was of different nature. The
contraction happened at lower temperatures, 200ºC, and by analyzing the after exposure powder
patterns it was possible to see that the negative thermal expansion was not fully recuperated. The
copper inside the porous framework does not allow full rehydration. In fact since the water
molecules on Cu-AV-6 are placed in mixed occupancy with copper, once they are removed by
high temperature its full return is not possible. After 100ºC the unit cell of this material has no
recovery on the a and b axes (figure 72c) This explains the early amorphization of Cu-AV-6, after
water release the 8-ring pore occupancy changes and the materials gets structurally instable.
(a
) (b
)
(d
) (c
)
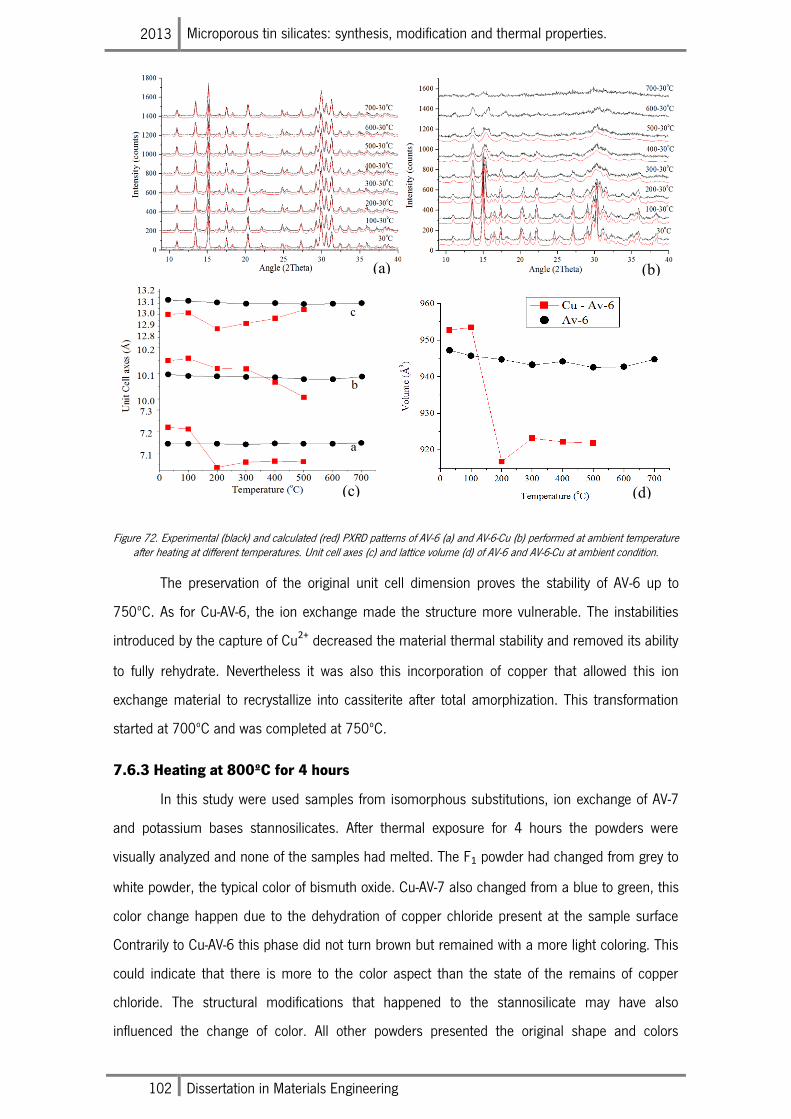
2013 Microporous tin silicates: synthesis, modification and thermal properties.
102 Dissertation in Materials Engineering
Figure 72. Experimental (black) and calculated (red) PXRD patterns of AV-6 (a) and AV-6-Cu (b) performed at ambient temperature after heating at different temperatures. Unit cell axes (c) and lattice volume (d) of AV-6 and AV-6-Cu at ambient condition.
The preservation of the original unit cell dimension proves the stability of AV-6 up to
750ºC. As for Cu-AV-6, the ion exchange made the structure more vulnerable. The instabilities
introduced by the capture of Cu2+ decreased the material thermal stability and removed its ability
to fully rehydrate. Nevertheless it was also this incorporation of copper that allowed this ion
exchange material to recrystallize into cassiterite after total amorphization. This transformation
started at 700ºC and was completed at 750ºC.
7.6.3 Heating at 800ºC for 4 hours
In this study were used samples from isomorphous substitutions, ion exchange of AV-7
and potassium bases stannosilicates. After thermal exposure for 4 hours the powders were
visually analyzed and none of the samples had melted. The F1 powder had changed from grey to
white powder, the typical color of bismuth oxide. Cu-AV-7 also changed from a blue to green, this
color change happen due to the dehydration of copper chloride present at the sample surface
Contrarily to Cu-AV-6 this phase did not turn brown but remained with a more light coloring. This
could indicate that there is more to the color aspect than the state of the remains of copper
chloride. The structural modifications that happened to the stannosilicate may have also
influenced the change of color. All other powders presented the original shape and colors
(a) (b)
(d) (c)
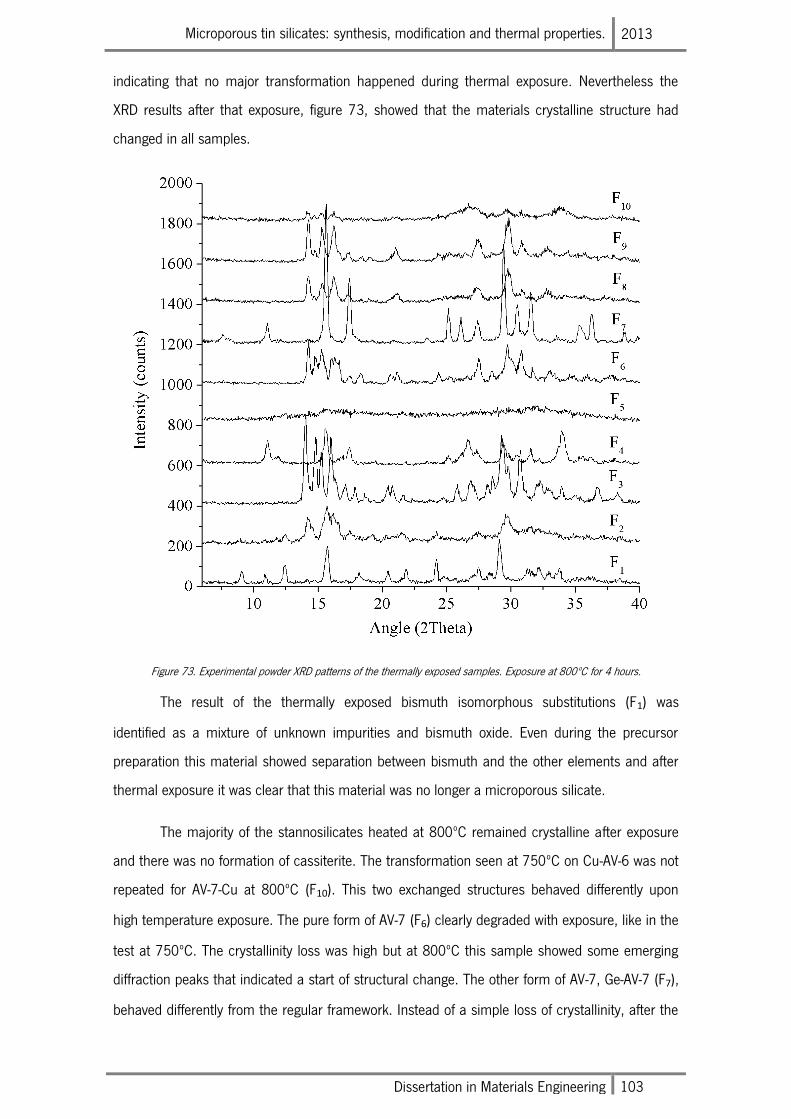
Microporous tin silicates: synthesis, modification and thermal properties. 2013
Dissertation in Materials Engineering 103
indicating that no major transformation happened during thermal exposure. Nevertheless the
XRD results after that exposure, figure 73, showed that the materials crystalline structure had
changed in all samples.
Figure 73. Experimental powder XRD patterns of the thermally exposed samples. Exposure at 800ºC for 4 hours.
The result of the thermally exposed bismuth isomorphous substitutions (F1) was
identified as a mixture of unknown impurities and bismuth oxide. Even during the precursor
preparation this material showed separation between bismuth and the other elements and after
thermal exposure it was clear that this material was no longer a microporous silicate.
The majority of the stannosilicates heated at 800ºC remained crystalline after exposure
and there was no formation of cassiterite. The transformation seen at 750ºC on Cu-AV-6 was not
repeated for AV-7-Cu at 800ºC (F10). This two exchanged structures behaved differently upon
high temperature exposure. The pure form of AV-7 (F6) clearly degraded with exposure, like in the
test at 750ºC. The crystallinity loss was high but at 800ºC this sample showed some emerging
diffraction peaks that indicated a start of structural change. The other form of AV-7, Ge-AV-7 (F7),
behaved differently from the regular framework. Instead of a simple loss of crystallinity, after the
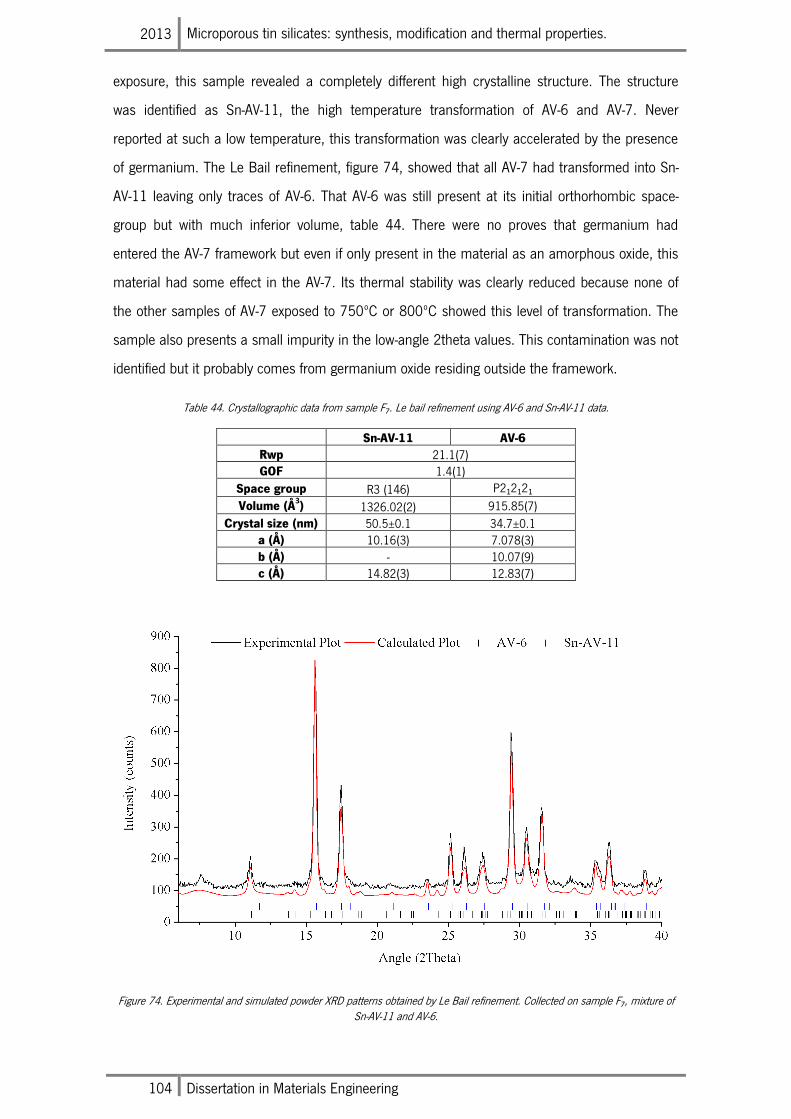
2013 Microporous tin silicates: synthesis, modification and thermal properties.
104 Dissertation in Materials Engineering
exposure, this sample revealed a completely different high crystalline structure. The structure
was identified as Sn-AV-11, the high temperature transformation of AV-6 and AV-7. Never
reported at such a low temperature, this transformation was clearly accelerated by the presence
of germanium. The Le Bail refinement, figure 74, showed that all AV-7 had transformed into Sn-
AV-11 leaving only traces of AV-6. That AV-6 was still present at its initial orthorhombic space-
group but with much inferior volume, table 44. There were no proves that germanium had
entered the AV-7 framework but even if only present in the material as an amorphous oxide, this
material had some effect in the AV-7. Its thermal stability was clearly reduced because none of
the other samples of AV-7 exposed to 750ºC or 800ºC showed this level of transformation. The
sample also presents a small impurity in the low-angle 2theta values. This contamination was not
identified but it probably comes from germanium oxide residing outside the framework.
Table 44. Crystallographic data from sample F7. Le bail refinement using AV-6 and Sn-AV-11 data.
Sn-AV-11 AV-6
Rwp 21.1(7) GOF 1.4(1)
Space group R3 (146) P212121
Volume (Å3) 1326.02(2) 915.85(7)
Crystal size (nm) 50.5±0.1 34.7±0.1 a (Å) 10.16(3) 7.078(3) b (Å) - 10.07(9) c (Å) 14.82(3) 12.83(7)
Figure 74. Experimental and simulated powder XRD patterns obtained by Le Bail refinement. Collected on sample F7, mixture of Sn-AV-11 and AV-6.
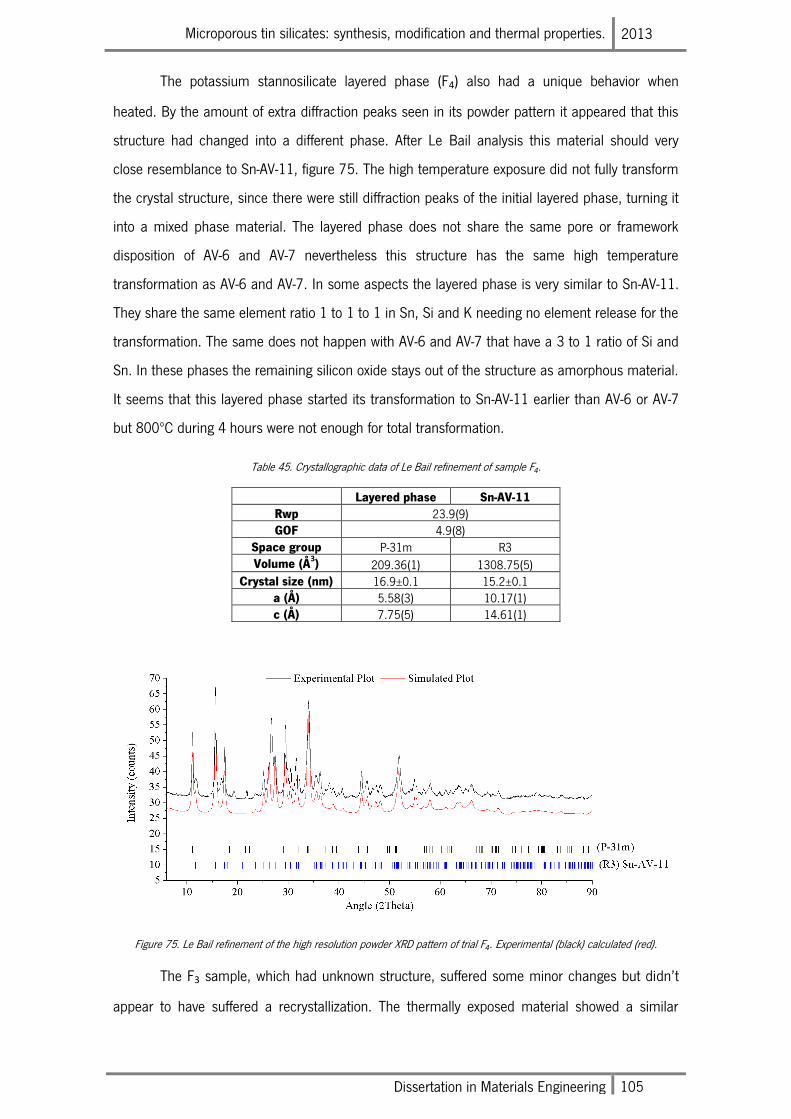
Microporous tin silicates: synthesis, modification and thermal properties. 2013
Dissertation in Materials Engineering 105
The potassium stannosilicate layered phase (F4) also had a unique behavior when
heated. By the amount of extra diffraction peaks seen in its powder pattern it appeared that this
structure had changed into a different phase. After Le Bail analysis this material should very
close resemblance to Sn-AV-11, figure 75. The high temperature exposure did not fully transform
the crystal structure, since there were still diffraction peaks of the initial layered phase, turning it
into a mixed phase material. The layered phase does not share the same pore or framework
disposition of AV-6 and AV-7 nevertheless this structure has the same high temperature
transformation as AV-6 and AV-7. In some aspects the layered phase is very similar to Sn-AV-11.
They share the same element ratio 1 to 1 to 1 in Sn, Si and K needing no element release for the
transformation. The same does not happen with AV-6 and AV-7 that have a 3 to 1 ratio of Si and
Sn. In these phases the remaining silicon oxide stays out of the structure as amorphous material.
It seems that this layered phase started its transformation to Sn-AV-11 earlier than AV-6 or AV-7
but 800ºC during 4 hours were not enough for total transformation.
Table 45. Crystallographic data of Le Bail refinement of sample F4.
Layered phase Sn-AV-11
Rwp 23.9(9) GOF 4.9(8)
Space group P-31m R3 Volume (Å
3) 209.36(1) 1308.75(5)
Crystal size (nm) 16.9±0.1 15.2±0.1 a (Å) 5.58(3) 10.17(1) c (Å) 7.75(5) 14.61(1)
Figure 75. Le Bail refinement of the high resolution powder XRD pattern of trial F4. Experimental (black) calculated (red).
The F3 sample, which had unknown structure, suffered some minor changes but didn’t
appear to have suffered a recrystallization. The thermally exposed material showed a similar
2013 Microporous tin silicates: synthesis, modification and thermal properties.
106 Dissertation in Materials Engineering
pattern to the one it had before. It is possible that the differences between patterns are due to
the material dehydration but without understanding exactly what this material is there was no
possible characterization to be made.
The Zn-AV-7 forms (F8 and F9) showed greater resistance to structural change when
compared with normal AV-7 (F6) or AV-7-Cu (F10). The powder patterns of these exchanged forms
kept more similar peaks to the AV-7 than the thermally exposed AV-7. As proven before, the zinc
enters in the 8-ring pores exchanging all of the sodium and potassium from that position. This
introduces some hydroxide bonds but also increases the strength of connection on the 8-ring
pore since zinc as a higher charge than sodium and potassium. With reinforced pores the Zn-AV-
7 material can withstand higher temperatures without the loss of the characteristic diffraction
peaks.
The 72 hours exchanged material presented even better results than the 24 hours
sample indicating that the more zinc is in the porous framework the more thermal resistance it
possesses. The Le Bail refinement to the 72 hours AV-7-Zn after 800ºC exposure showed that
this material was still represented by the crystallographic data of AV-7. Small changes were seen
in the cell volume, table 46, and on some of the diffraction peaks, figure 76. These changes
came from the irreversible dehydration phenomenon that occurs on the ion exchange
frameworks. Like on Cu-AV-6, after water release the Zn-AV-7 structure cannot rehydrate and
therefore loses structural stability.
Table 46. Crystallographic data for Zn-AV-7 after 800ºC for 4 hours.
AV-7-Zn 800ºC
Rwp 11.1(1) GOF 2.4(9)
Space group P21/c
Volume (Å3) 924.56(4)
Crystal size (nm) 32.6±0.1 a (Å) 6.42(2) b (Å) 11.58(5) c (Å) 12.88(1) β(o) 105.29(2)
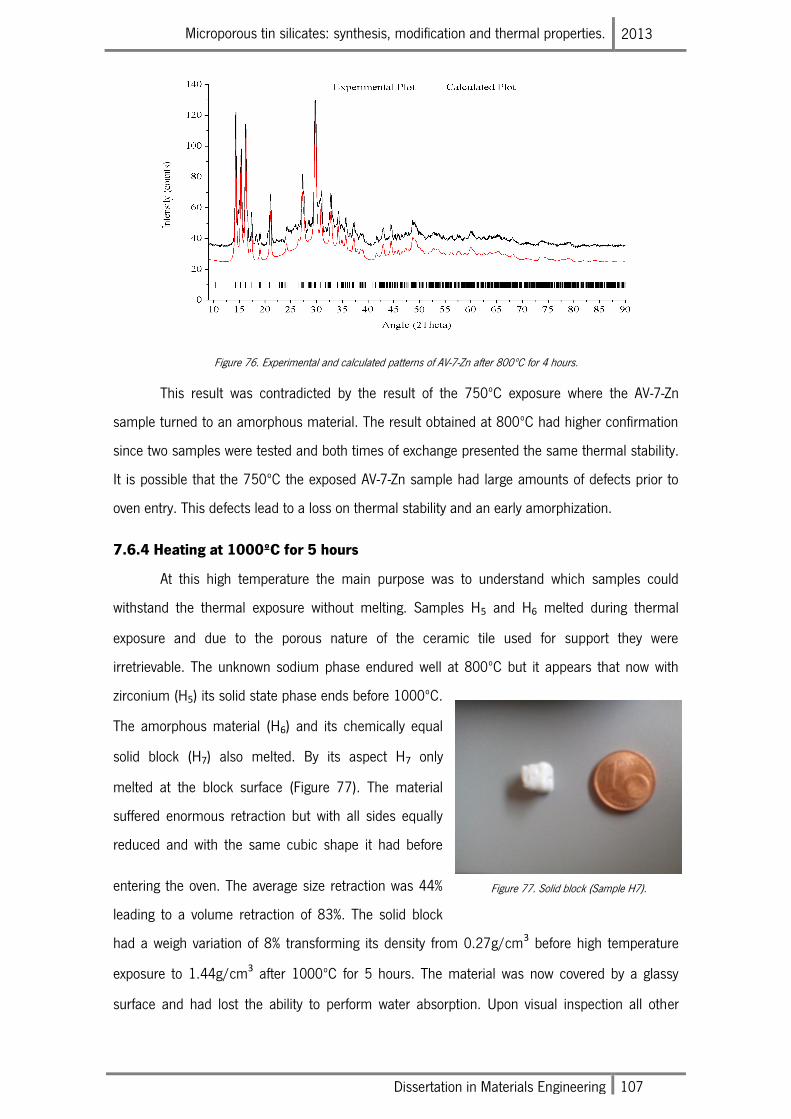
Microporous tin silicates: synthesis, modification and thermal properties. 2013
Dissertation in Materials Engineering 107
Figure 76. Experimental and calculated patterns of AV-7-Zn after 800ºC for 4 hours.
This result was contradicted by the result of the 750ºC exposure where the AV-7-Zn
sample turned to an amorphous material. The result obtained at 800ºC had higher confirmation
since two samples were tested and both times of exchange presented the same thermal stability.
It is possible that the 750ºC the exposed AV-7-Zn sample had large amounts of defects prior to
oven entry. This defects lead to a loss on thermal stability and an early amorphization.
7.6.4 Heating at 1000ºC for 5 hours
At this high temperature the main purpose was to understand which samples could
withstand the thermal exposure without melting. Samples H5 and H6 melted during thermal
exposure and due to the porous nature of the ceramic tile used for support they were
irretrievable. The unknown sodium phase endured well at 800ºC but it appears that now with
zirconium (H5) its solid state phase ends before 1000ºC.
The amorphous material (H6) and its chemically equal
solid block (H7) also melted. By its aspect H7 only
melted at the block surface (Figure 77). The material
suffered enormous retraction but with all sides equally
reduced and with the same cubic shape it had before
entering the oven. The average size retraction was 44%
leading to a volume retraction of 83%. The solid block
had a weigh variation of 8% transforming its density from 0.27g/cm3 before high temperature
exposure to 1.44g/cm3 after 1000ºC for 5 hours. The material was now covered by a glassy
surface and had lost the ability to perform water absorption. Upon visual inspection all other
Figure 77. Solid block (Sample H7).
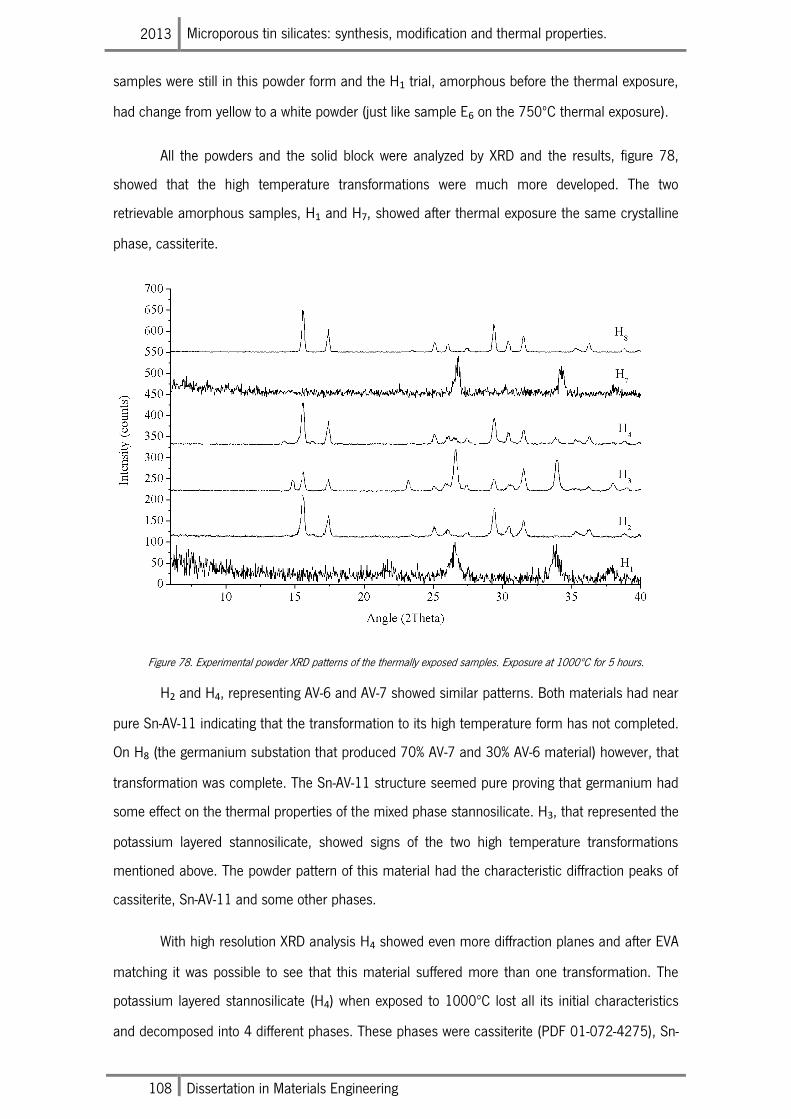
2013 Microporous tin silicates: synthesis, modification and thermal properties.
108 Dissertation in Materials Engineering
samples were still in this powder form and the H1 trial, amorphous before the thermal exposure,
had change from yellow to a white powder (just like sample E6 on the 750ºC thermal exposure).
All the powders and the solid block were analyzed by XRD and the results, figure 78,
showed that the high temperature transformations were much more developed. The two
retrievable amorphous samples, H1 and H7, showed after thermal exposure the same crystalline
phase, cassiterite.
Figure 78. Experimental powder XRD patterns of the thermally exposed samples. Exposure at 1000ºC for 5 hours.
H2 and H4, representing AV-6 and AV-7 showed similar patterns. Both materials had near
pure Sn-AV-11 indicating that the transformation to its high temperature form has not completed.
On H8 (the germanium substation that produced 70% AV-7 and 30% AV-6 material) however, that
transformation was complete. The Sn-AV-11 structure seemed pure proving that germanium had
some effect on the thermal properties of the mixed phase stannosilicate. H3, that represented the
potassium layered stannosilicate, showed signs of the two high temperature transformations
mentioned above. The powder pattern of this material had the characteristic diffraction peaks of
cassiterite, Sn-AV-11 and some other phases.
With high resolution XRD analysis H4 showed even more diffraction planes and after EVA
matching it was possible to see that this material suffered more than one transformation. The
potassium layered stannosilicate (H4) when exposed to 1000ºC lost all its initial characteristics
and decomposed into 4 different phases. These phases were cassiterite (PDF 01-072-4275), Sn-
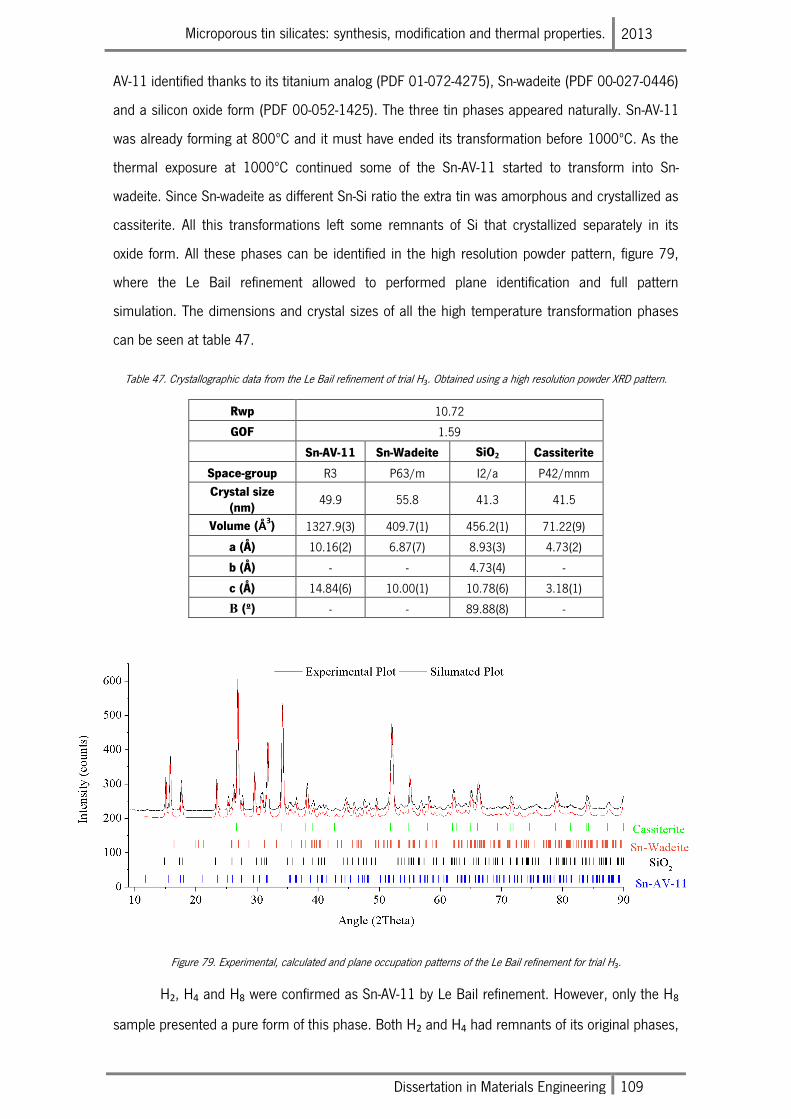
Microporous tin silicates: synthesis, modification and thermal properties. 2013
Dissertation in Materials Engineering 109
AV-11 identified thanks to its titanium analog (PDF 01-072-4275), Sn-wadeite (PDF 00-027-0446)
and a silicon oxide form (PDF 00-052-1425). The three tin phases appeared naturally. Sn-AV-11
was already forming at 800ºC and it must have ended its transformation before 1000ºC. As the
thermal exposure at 1000ºC continued some of the Sn-AV-11 started to transform into Sn-
wadeite. Since Sn-wadeite as different Sn-Si ratio the extra tin was amorphous and crystallized as
cassiterite. All this transformations left some remnants of Si that crystallized separately in its
oxide form. All these phases can be identified in the high resolution powder pattern, figure 79,
where the Le Bail refinement allowed to performed plane identification and full pattern
simulation. The dimensions and crystal sizes of all the high temperature transformation phases
can be seen at table 47.
Table 47. Crystallographic data from the Le Bail refinement of trial H3. Obtained using a high resolution powder XRD pattern.
Rwp 10.72
GOF 1.59
Sn-AV-11 Sn-Wadeite SiO2 Cassiterite
Space-group R3 P63/m I2/a P42/mnm
Crystal size (nm)
49.9 55.8 41.3 41.5
Volume (Å3) 1327.9(3) 409.7(1) 456.2(1) 71.22(9)
a (Å) 10.16(2) 6.87(7) 8.93(3) 4.73(2)
b (Å) - - 4.73(4) -
c (Å) 14.84(6) 10.00(1) 10.78(6) 3.18(1)
Β (º) - - 89.88(8) -
Figure 79. Experimental, calculated and plane occupation patterns of the Le Bail refinement for trial H3.
H2, H4 and H8 were confirmed as Sn-AV-11 by Le Bail refinement. However, only the H8
sample presented a pure form of this phase. Both H2 and H4 had remnants of its original phases,
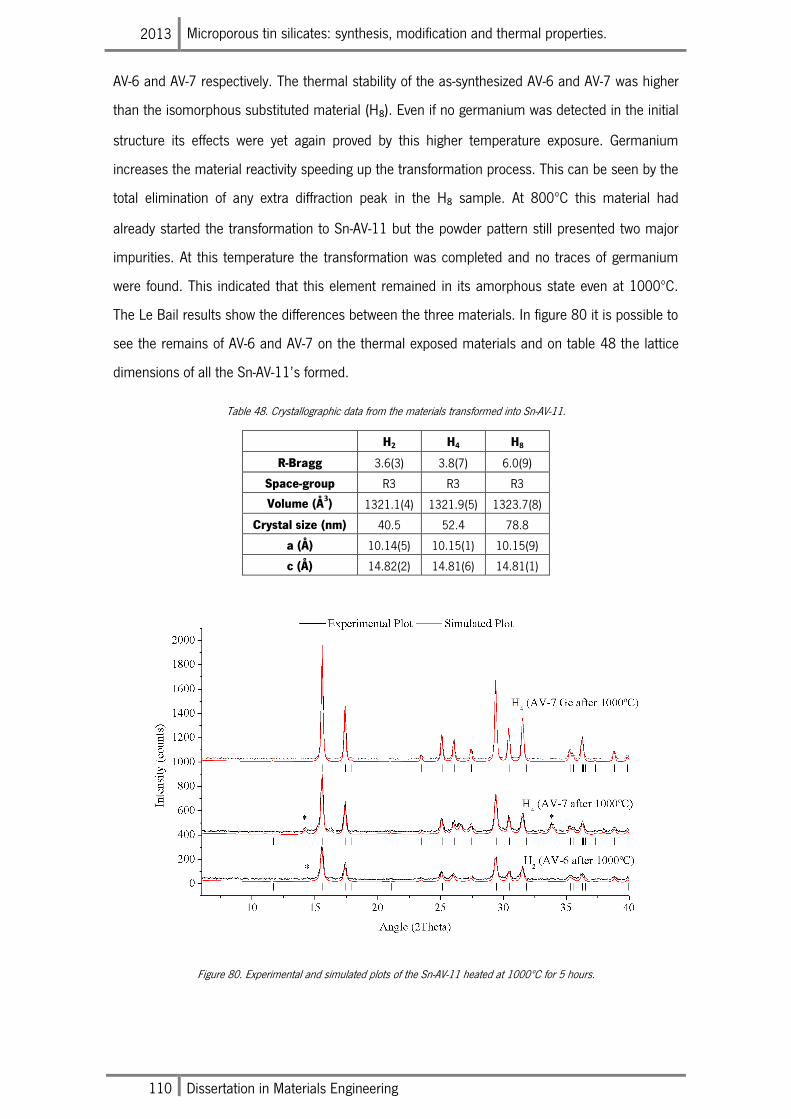
2013 Microporous tin silicates: synthesis, modification and thermal properties.
110 Dissertation in Materials Engineering
AV-6 and AV-7 respectively. The thermal stability of the as-synthesized AV-6 and AV-7 was higher
than the isomorphous substituted material (H8). Even if no germanium was detected in the initial
structure its effects were yet again proved by this higher temperature exposure. Germanium
increases the material reactivity speeding up the transformation process. This can be seen by the
total elimination of any extra diffraction peak in the H8 sample. At 800ºC this material had
already started the transformation to Sn-AV-11 but the powder pattern still presented two major
impurities. At this temperature the transformation was completed and no traces of germanium
were found. This indicated that this element remained in its amorphous state even at 1000ºC.
The Le Bail results show the differences between the three materials. In figure 80 it is possible to
see the remains of AV-6 and AV-7 on the thermal exposed materials and on table 48 the lattice
dimensions of all the Sn-AV-11’s formed.
Table 48. Crystallographic data from the materials transformed into Sn-AV-11.
H2 H4 H8
R-Bragg 3.6(3) 3.8(7) 6.0(9)
Space-group R3 R3 R3
Volume (Å3) 1321.1(4) 1321.9(5) 1323.7(8)
Crystal size (nm) 40.5 52.4 78.8
a (Å) 10.14(5) 10.15(1) 10.15(9)
c (Å) 14.82(2) 14.81(6) 14.81(1)
Figure 80. Experimental and simulated plots of the Sn-AV-11 heated at 1000ºC for 5 hours.
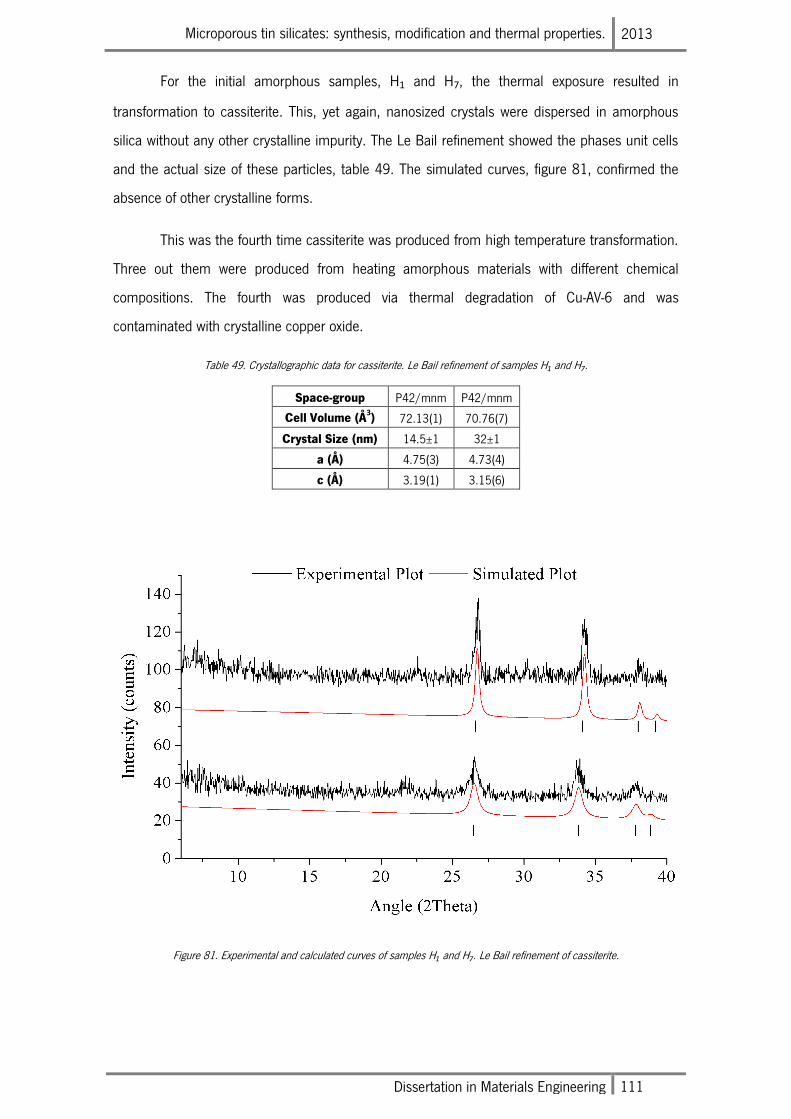
Microporous tin silicates: synthesis, modification and thermal properties. 2013
Dissertation in Materials Engineering 111
For the initial amorphous samples, H1 and H7, the thermal exposure resulted in
transformation to cassiterite. This, yet again, nanosized crystals were dispersed in amorphous
silica without any other crystalline impurity. The Le Bail refinement showed the phases unit cells
and the actual size of these particles, table 49. The simulated curves, figure 81, confirmed the
absence of other crystalline forms.
This was the fourth time cassiterite was produced from high temperature transformation.
Three out them were produced from heating amorphous materials with different chemical
compositions. The fourth was produced via thermal degradation of Cu-AV-6 and was
contaminated with crystalline copper oxide.
Table 49. Crystallographic data for cassiterite. Le Bail refinement of samples H1 and H7.
Space-group P42/mnm P42/mnm
Cell Volume (Å3) 72.13(1) 70.76(7)
Crystal Size (nm) 14.5±1 32±1
a (Å) 4.75(3) 4.73(4)
c (Å) 3.19(1) 3.15(6)
Figure 81. Experimental and calculated curves of samples H1 and H7. Le Bail refinement of cassiterite.

2013 Microporous tin silicates: synthesis, modification and thermal properties.
112 Dissertation in Materials Engineering
Microporous tin silicates: synthesis, modification and thermal properties. 2013
Dissertation in Materials Engineering 113
VIII Conclusions
After more than 400 experiments including synthesis, ion exchange, isomorphous
substitutions and thermal treatment this work produced more than 300 samples. As a result
more than 300 XRD powder patterns were collected. All in order to understand the unique
phenomena that is involved in the production of stannosilicates using a transparent precursor. All
this work served not only to identify the typical stannosilicate structures formed at each
composition but also to produce new frameworks and to identify unique behaviors of the
synthesis process. This work resulted in one publication in international journal and created the
first synthetic materials called after the University of Minho (UM-1 and UM-2)
8.1 Synthesis using a transparent precursor
This newly developed method started as a great incognita for what would be the optimal
compositions for the synthesis of the already known stannosilicate structures. The first syntheses
allowed understanding what compositions would favor each structure. As the experience has
advanced it was also possible to prove that not only initial batch composition is responsible for
the successful phase formation. This work managed, for the first time to produce different
stannosilicate structures by changing the precursor agitation time. This work also used different
compositions with a single alkaline element to search in crystallization fields that have never been
explored. By studying the effect of each alkaline element (sodium and potassium) it was possible
to understand its individual role in all stannosilicate compositions. The reduced time of synthesis
(2 days) also showed that stannosilicates have fast synthesis. This production speed makes a
large difference in terms of mass production for industrial purposes.
8.1.1 Sodium stannosilicates
These compositions were the least successful trials of all synthesis. The crystalline
phases only appeared in medium sodium and tin compositions but even those were far from high
crystalline materials. The pH given by the sodium hydroxide presence produced very aggressive
solutions that destroyed most of the crystalline material. From the synthesis parameters study it
was possible to conclude that more time of synthesis only progressed the destructive effect.
Despite that, the synthesis of sodium based silicates resulted in new material. It was found that
this material has a lattice with relatively big volume (more than 1400Å3) and possibly a porous
framework. It was produced by several compositions indicating that it was the most chemically
favored phase of all sodium-based tin silicates. From the studies performed it was possible to
conclude that this phase its only stable until 2 days synthesis at 200ºC. To its forming
composition any longer time than 2 days in oven produces a non-silicate material. However, due
2013 Microporous tin silicates: synthesis, modification and thermal properties.
114 Dissertation in Materials Engineering
to the low crystallinity of all samples this phase was not indexed. The other synthesized material,
AV-10, also appeared with low quality. The time of synthesis may have done the same damage
as to the other phase. Several adjustments were made to improve these phases crystallinity but
none of them had success. This sodium based tin silicates were the first compositions to reveal
the effect of precursor agitation time. The change from 15 to 30 minutes of precursor agitation
time made a composition of the unknown sodium phase produce a material with all the
characteristics of AV-10.
8.1.2 Potassium stannosilicates
This field was created to enhance the production of AV-6. The compositions tested were
very similar to the chemical composition of this stannosilicate. AV-6 appeared as the dominant
phase, however, there were other frameworks synthesized. AV-7 appeared in a free sodium
phase proving that this element is not decisive for its crystallization. The synthesis of a potassium
AV-7 showed that the framework is flexible to different charge stabilizers. These two phases AV-7
and AV-6, appeared in many compositions together as mixed phase material. This showed that
these two frameworks have similar initial building units and that probability to form one or the
other is close to 50%. In fact the study of the precursor agitation time came to prove just that.
That study also proved that it is possible to control the resulting structure by allying chemical
composition and precursor agitation time. AV-7 framework showed the need for high agitation
times in order to grow as a single phase and eliminate the AV-6 nucleus.
In terms of synthesis success, the potassium based silicates also proved to have some
deficiencies. The synthesized powders were most of the times of small size, enabling filtration.
Like in the sodium based tin silicates there were some compositions that did not form any solid
material. However, comparing to the sodium base tin silicates these powders had much higher
crystallinity and no tendency to dissolute in long time synthesis.
In these potassium based tin silicates it was also possible to produce a new type of
framework called UM-2. This layered potassium tin silicate had very small volume but
interconnected chains of SnO6 octahedra. These chains were separated by SiO4 tetrahedra and
the formed layers separated by potassium ions and water molecules. This phase has unknown
properties but from the structural information gathered here it is possible to say that it could have
possible applications in linear electronics or composite materials.
Microporous tin silicates: synthesis, modification and thermal properties. 2013
Dissertation in Materials Engineering 115
8.1.3 Sodium and potassium based tin silicates
The sodium and potassium based stannosilicate compositions are the most widely used.
The presence of small amounts of sodium increases the precursor activity leading to a faster
synthesis. The presence of potassium chemically stabilizes the precursor allowing it to form high
crystalline materials. These two elements together provide properties to the precursor that none
of the single alkaline compositions possess. In terms of success of synthesis, the use of sodium
and potassium in the precursor ensures the formation of crystalline material even in short time
precursor agitation and synthesis. Using these two alkaline elements there were no problems
with chemical stability at long/short time synthesis or low crystallinity. The potassium in the
precursor leads to materials with well-defined powder patterns of highly crystalline phases.. The
sodium leads to fast grain size growth and results in good quantities of crystalline material. These
compositions were optimal to produce Na-K-AV-7 but since the sodium often stays out of the
crystallization process the formation of AV-6 is also possible. To guaranty the formation of AV-7
the precursor agitation time must be high and to produce AV-6 the agitation must be kept at
minimum. These typical compositions were important to prove that the transition between AV-6
and AV-7 is also possible in sodium and potassium precursors. It also showed that it is possible
to produce high quality materials at short synthesis time making this process more industrially
profitable.
8.2 Ion exchange forms
These tests were used to characterize AV-6 and AV-7 in terms of ion exchange abilities.
The tests were used to understand which element had higher reactivity to each structure and to
obtain some chemically different forms of AV-6 and AV-7.
The exchanges performed on AV-6 did not reveal any unknown behavior. Nevertheless
the tests helped to develop the already discovered Cu-AV-6, looking for its ion exchange limits and
thermal stability. The ion exchange experiments done on AV-6 also revealed that zinc has affinity
to the microporous framework but its capturing process is much slower. After 48 hours of
exchange the materials crystalline structure was not completely changed. The ion exchange
result was a mixture of Zn-AV-6 and AV-6 meaning that the orthorhombic to monoclinic
transformation was not complete. Aluminum and lead ion exchange experiments showed that
this framework is destroyed not by the pH of the ion exchange solution but by the external ion
activity. In terms of reactivity, it was also seen that, in these ion exchange conditions, sodium and
chromium had no affinity to this microporous sieve. The exchange with aluminum showed some
2013 Microporous tin silicates: synthesis, modification and thermal properties.
116 Dissertation in Materials Engineering
signs of changing the structure of AV-6 to the monoclinic space-group but the EDS results
showed that no Al3+ was in the stannosilicate framework.
The ion exchanges experiments done on AV-7 showed some new unexpected results.
This structure showed a unique behavior when ion exchanged, presenting different powder
patterns depending on the coordination of the captured ion. The sixth coordinated ions that were
successfully exchanged (copper and chromium) made a great change on the material crystalline
structure. Both Cu-AV-7 and Cr-AV-7 had a shift in the (020) plane. The 8-ring pore occupants
completely changed its position in order to accumulate this different coordination ion. Chromium
showed a much faster exchange than copper mainly due to the ion valence difference. The
trivalent ions had much higher affinity to the microporous framework. The eighth coordinated
ions that were successfully exchanged (zinc, lead and strontium) had all divalent charge and did
not affect the position of plane (020). In fact, the only change in the powder patterns that
indicated its presence was the drop of intensity of the same plane. The amount of intensity loss
at each ion exchange experiment was directly influenced by the nature of the captured ion. Each
ion (zinc, lead and strontium) had its characteristic intensity loss. When the difference between
planes was 30% the material was at the as-synthesized AV-7 form, 70% indicated exchange with
zinc, 55% indicated exchange with lead and 50% exchange with strontium. This difference in
intensity depending on the captured ion can be used for sensor applications. Detecting lead in
consumable waters is a very likely application. By introducing AV-7 in that water it is possible to
know by XRD if the liquid is contaminated. The quick times of exchange also help in the use in
this application. The exchange with lead was performed in 18 hours. These preliminary tests
suggest that this material can be used for filtration or sensory applications. However, it is still
necessary to study the influence of multi ion exchange solutions to understand if this
stannosilicate captures ions in a selective way.
8.3 Isomorphous substitutions
This attempt to modify the stannosilicates existing phases was not successful. None of
the tried compositions revealed a clear modification of the framework characteristics. The
purpose was to create modified porous materials with differently sized pores. However, all
attempts to modify AV-7, AV-6 or any other phase failed and the majority of the products
produced were not even crystalline.
Previous reports [20] produced a Sn-Zr umbite material so some kind of interaction was
expected when performing the isomorphous substitution experiments. The Zr-Sn-umbite was the
Microporous tin silicates: synthesis, modification and thermal properties. 2013
Dissertation in Materials Engineering 117
most probable phase to be produced in these compositions. However that was not possible
within the conditions that were attempted. Both 20% and 40% of substitution failed and the only
crystalline silicates produced were AV-6 and K-AV-7. During these experiments with zirconium it
was a material with an unindexed powder pattern. This material presented some characteristics
of a zirconium silicate (AV-15) but no confirmation was possible. This phase had significant
changes in powder XRD pattern when compared with the original AV-15. Those changes could be
induced by the presence of a mixed octahedral occupation or simple by the presence of unknown
impurities. This material appeared in a long time synthesis (5 days) indicating that some
recrystallization phenomenon may had occurred. Increasing the time of synthesis in other
isomorphic substitution experiments could had increased the odds of structural modification In
order to form zirconium silicate building units the temperature or the synthesis time should have
been much higher.
The isomorphic substation by titanium experiments also should no modifications of
structures. The titanium source used in these trials was not the best. The lack of crystalline
titanium forms indicated that TiCl3 had very reduced reactivity in the precursor. From the tried
compositions, the only crystalline forms obtained had the single contribution of tin and as
percentage of titanium increased (from 20% then 40% and finally 60%) the tin silicates gradually
lost their crystallinity. The sodium and potassium compositions produced pure AV-7 showing no
interference from the large amounts of titanium in the precursor. A titanium silicate was
produced in a sodium composition with 60% of titanium and 5 days of synthesis. In 5 days and
with only sodium as alkaline element there were no conditions to form any tin silicate (as proven
in the synthesis chapter), only natisite (titanium silicate) was possible to produce. To make this
isomorphous substitutions work the single increase of time or synthesis temperature appeared to
be not enough, probably a change in the source of titanium would improve the chances of
obtaining a mixed octahedral silicate phase.
Despite the few attempts for substitution by germanium showed some detectable
changes. No mixed octahedral or tetrahedral phase was discovered but effects of adding small
amounts of germanium into the precursor were clearly noticed. The first was the increased
amount of product retrieved from the autoclave when using this element. The trials that normally
produced quantities of powder inferior to 1 gram produced, with small quantities of germanium,
near 1.5 grams. The second effect was the increase in crystallinity in all the produced materials.
Both AV-7 and the sodium tin silicate unknown phase had increased crystallinity induced by the
external presence of germanium atoms. The third and final effect was the acceleration of the AV-
2013 Microporous tin silicates: synthesis, modification and thermal properties.
118 Dissertation in Materials Engineering
7 high temperature transformations. The Ge-AV-7 turned to Sn-AV-11 200ºC below the normal
temperature.
The isomorphous substitutions by bismuth failed due to the rapid precipitation of
bismuth during precursor preparation. The synthesis resulting material had always two mixed
phases, chemically and structurally different. One formed from the precursor elements (sodium,
potassium, silicon and tin) the other formed out of the precipitated bismuth. This bismuth at
normal synthesis remained in its metal form and at high temperatures it turned into its oxide
form.
8.4 Thermal Properties
The heating of AV-6 and Cu-AV-6 showed difference in the thermal behavior of the two
phases. Upon heating the structural changes in Cu-AV-6 are irreversible while the ones in AV-6
are completely reversible (up to 800 ºC). Cu-AV-6 dehydrated at 200ºC become distorted and
slowly degrade when the temperature is further increased. At 700ºC Cu-AV-6 gets completely
amorphous and at 750ºC transforms to a nanosized tin oxide with cassiterite structure.
These thermal tests it was also possible to find all the high temperature transformations
of the potassium layered tin silicate. Starting the transformation to Sn-AV-11 before 800ºC and
completed before 1000ºC. At this temperature this phase decomposed into Sn-wadeite,
cassiterite and silicon oxide.
The transformations of AV-6 and AV-7 corresponded to the previous reports. These
phases started to turn into Sn-AV-11 around 1000ºC not finishing this transformation after 5
hours of exposure. The ions exchanged forms of these materials decomposed and turn
amorphous at 750ºC. This happen to all but the Zn-AV-7 that after 4 hours at 800ºC still showed
the main structural characteristics of its beginning phase. In fact this ion exchanged form showed
more thermal stability than the normal AV-7 that at 800ºC has nearly amorphous.
To report was also the transformation of all the amorphous samples into cassiterite when
exposed to high temperatures (>750ºC). This materials had unknown composition but turn from
a room temperature amorphous state onto a good quality cassiterite.
Microporous tin silicates: synthesis, modification and thermal properties. 2013
Dissertation in Materials Engineering 119
8.5 Final considerations
The main achievements of the present work can be summarized as follows:
-Creation of crystallization fields for the synthesis of various stannosilicates;
- Synthesis of stannosilicates using potassium based tin silicates;
-Discovery of a new layered phase of potassium stannosilicates;
- Revealed the effect of the precursor agitation time on the run product;
-Synthesized the first sodium free AV-7;
-Performed the first successful ion exchange experiments on AV-7;
-Modeled the structural changes performed by each ion on the AV-7 framework;
-Studied the effects of non-structural effect of Ge on the thermal properties of AV-7.
- Synthesized cassiterite by decomposition of an ion exchanged AV-6.

2013 Microporous tin silicates: synthesis, modification and thermal properties.
120 Dissertation in Materials Engineering
Microporous tin silicates: synthesis, modification and thermal properties. 2013
Dissertation in Materials Engineering 121
IX References
[1]- Cheetham, A.K. Peter Day. Solid State Chemistry. Clarendon Press, 1992;
[2]- F. Ramôa Ribeiro, Alírio E. Rodrigues, L. Deane Rollmann, Claude Naccache. Zeolites:
Science and Technology. 1984;
[3]- Cundy, C.S., & Cox, P. a. Chemical reviews, 103(3), (2003), 663-702;
[4]- G.D. Ilyushin, Inorganic Materials, 29, (1993), 1128-1133;
[5]- www.hypotheticalzeolites.net/NEWDATABASE/BRONZE_UNIQ/;
[6]- J. Rocha, M. W. Anderson, Eur. J. Inorganic Chemistry. (2000), 801-818;
[7]- Z. Lin, J. Rocha, P. Brandao, A. Ferreira, A. P. Esculcas, J. D. P. de Jesus, A. Philippou, M.
W. Anderson, The journal of Physical Chemistry. B 101, (1997), 7114-7120;
[8]- B. Mihailova, V. Valtchev, S. Mintova, L. Konstantinov, J. Mater. Sci. Lett. 16(1997) 1303-
1304;
[9]- M. S. Dadachov, A. LeBail, Eur. J. Solid State Inorg. Chem. 34 (1997) 381–390;
[10]- Z. Lin, J. Rocha, P. Ferreira, A. Thursfield, A.J. Agger, M.W. Anderson, J. Phys. Chem. B
103 (1999) 957-963;
[11]- D. M. Poojary, A. I. Bortun, L. N. Bortun, A. Clearfield, Inorg. Chem. 36 (1997) 3072–
3079;
[12]- S. R. Jale, A. Ojo, F. R. Fitch, Chem. Commun. (1999) 411–412;
[13]- Döbelin, N., & Armbruster, T. Microporous and Mesoporous Materials, 99(3), (2007), 279–
287;
[14]- Döbelin, N., & Armbruster, T. Materials Research Bulletin, 42(1), (2007) 113–125;
[15]- Thomas, B., Das, B. B., & Sugunan, S. Microporous and Mesoporous Materials, 95(1-3),
(2006) 329–338;
[16]- Coleman, N. J., Lewis, S. P., Mendham, A. P., & Trivedi, V. Journal of Porous Materials,
17(6) (2009);
2013 Microporous tin silicates: synthesis, modification and thermal properties.
122 Dissertation in Materials Engineering
[17]- Ferdov, S., Shikova, E., Ivanova, Z., Dimowa, L. T., Nikolova, R. P., Lin, Z., & Shivachev, B.
L. RSC Advances, 3(23), (2013) 8843;
[18]- Sebastián, V., Bosque, J., Kumakiri, I., Bredesen, R., Ansón, A., Maciá-Agulló, J. a., Linares-
Solano, Á., et al. Microporous and Mesoporous Materials, 142(2-3), (2011), 649–654;
[19]- S. Ferdov, Z. Lin, R. Sá Ferreira. Microporous and Microporous Materials. 96, (2006), 363-
368;
[20]- Pertierra, P., Salvadó, M. A., Garci’a-Granda, S., Bortun, A. I., Khainakov, S. A., & Garci’a, J.
R. Inorganic Chemistry Communications, 5(10), (2002), 824–828;
[21]- Zanardi, S., Dalconi, M. C., Gambaro, C., Bellussi, G., Millini, R., Rizzo, C., & Carati, A.
Microporous and Mesoporous Materials, (2009), 117(1-2);
[22]- Lin, Z., Ferreira, A., & Rocha, J. Journal of Solid State Chemistry, 175(2), (2003), 258–
263;
[23]- Lin, Z., Rocha, J., Pedrosa de Jesus, J. D., & Ferreira, a. Journal of Materials Chemistry,
10(6), (2000), 1353–1356;
[24]- Millini, R., Carati, A., Bellussi, G., Cruciani, G., Parker, W. O., Rizzo, C., & Zanardi, S.
Microporous and Mesoporous Materials, 101(1-2), (2007), 43–49;
[25]- Lin, Z., & Rocha, J. Microporous and Mesoporous Materials, 94(1-3), (2006), 173–178;
[26]- Ferreira, a, Lin, Z., Rocha, J., Morais, C. M., Lopes, M., & Fernandez, C. Inorganic
chemistry, 40(14), (2001), 3330–5;
[27]- Lo, F.-R., & Lii, K.-H. Journal of Solid State Chemistry, 178(4), (2005), 1017–1022;
[28]- Miguel A.R. Peixoto. Síntese e trocas iónicas em silicatos de estanho, Projeto Individual,
MIEMAT, Universidade do Minho. 2012;
[29]- Publishing, W. A., & York, N. HANDBOOK OF HYDROTHERMAL TECHNOLOGY. (2001).
New York.
[30]- http://abulafia.mt.ic.ac.uk/shannon/radius.php?Element=Ti, used for reading and values
checking.
Microporous tin silicates: synthesis, modification and thermal properties. 2013
Dissertation in Materials Engineering 123
[31]- http://abulafia.mt.ic.ac.uk/shannon/radius.php?Element=Sn, used for reading and values
checking.
[32]- Zagorodni, Andrei. A. Ion exchange Materials - Properties and Applications. (2007) Elsevier;
[33]- Fewox, C. S. Ion exchange behavior among metal trisilicates: Probing selectivity, structure
and mechanism. (August, 2008);
[34]- Aiello, R., Nagy, J. B., Giordano, G., Katovic, A., & Testa, F. Comptes Rendus Chimie, 8(3-
4), (2005) 321–329;
[35]- http://www.ctcms.nist.gov/wulffman/docs_1.2/;
[36]- Burton, A. W., Ong, K., Rea, T., & Chan, I. Y. Microporous and Mesoporous Materials,
117(1-2), (2009), 75–90.
[37]- Norbert Stribeck, X-Ray Scattering of Soft Matter, 2007;
[38]- http://www.semat.lab.uminho.pt;
[39]- http://www.icdd.com;
[40]- TOPAS V3.0, General profile and structure analysis software for powder diffraction data,
Bruker AXS, Karlsruhe, Germany;
[41]- R.W. Cheary, A.A. Coelho, Journal of Applied Crystallography. 25, 109 (1992);
[42]- http://www.iucr.org/resources/cif;
[43]- A. Kern, A.A. Coelho, R.W. Cheary, Convolution based profile fitting, in Diffraction analysis of
the microstructure of materials, ed. by E.J. Mittemeijer, P;
[44]- Shah, P., Ramaswamy, a. V., Lazar, K., & Ramaswamy, V. Microporous and Mesoporous
Materials, 100(1-3), (2007), 210–226;
[45]- Ng, E.-P., Chateigner, D., Bein, T., Valtchev, V., & Mintova, S. Science (New York, N.Y.),
335(6064), (2012), 70–3;
[46]- - http://abulafia.mt.ic.ac.uk/shannon/radius.php?Element=Cr;
[47]- http://abulafia.mt.ic.ac.uk/shannon/radius.php?Element=K;
[48]- Peixoto, M. A. R., & Ferdov, S. Journal of Porous Materials, (2013);
2013 Microporous tin silicates: synthesis, modification and thermal properties.
124 Dissertation in Materials Engineering
[49]- http://abulafia.mt.ic.ac.uk/shannon/radius.php?Element=Cu;
[50]- http://abulafia.mt.ic.ac.uk/shannon/radius.php?Element=Zn;
[51]- http://abulafia.mt.ic.ac.uk/shannon/radius.php?Element=Pb;
[52]- http://abulafia.mt.ic.ac.uk/shannon/radius.php?Element=Al;
[53]- Ferreira, A., Lin, Z., Soares, M. R., & Rocha, J.. Journal of Solid State Chemistry, 183(12).
(2010). 3067–3072;
5 - Pertierra, P., Salvadó, M. a., Garc a-Granda, S., Khainakov, S. a., & Garc a, J. R.
Thermochimica Acta, 423(1-2), (2004), 113–119;

Appendix
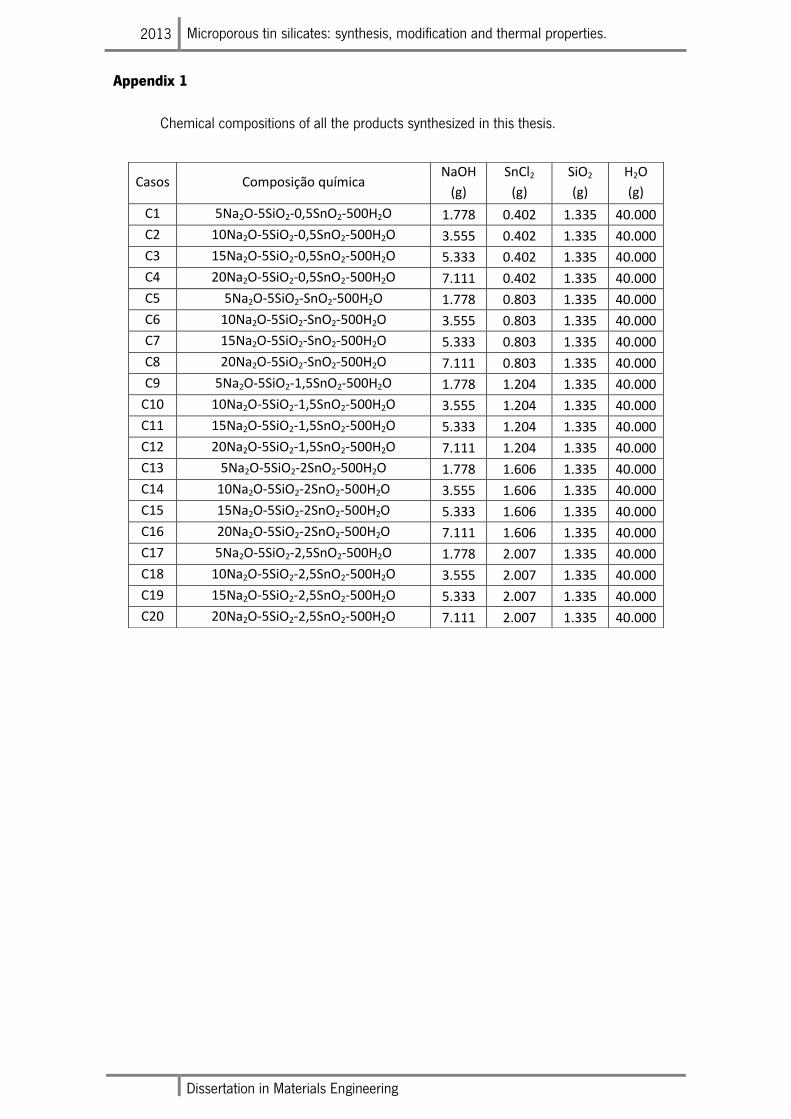
2013 Microporous tin silicates: synthesis, modification and thermal properties.
Dissertation in Materials Engineering
Appendix 1
Chemical compositions of all the products synthesized in this thesis.
Casos Composição química NaOH
(g)
SnCl2
(g)
SiO2
(g)
H2O
(g)
C1 5Na2O-5SiO2-0,5SnO2-500H2O 1.778 0.402 1.335 40.000
C2 10Na2O-5SiO2-0,5SnO2-500H2O 3.555 0.402 1.335 40.000
C3 15Na2O-5SiO2-0,5SnO2-500H2O 5.333 0.402 1.335 40.000
C4 20Na2O-5SiO2-0,5SnO2-500H2O 7.111 0.402 1.335 40.000
C5 5Na2O-5SiO2-SnO2-500H2O 1.778 0.803 1.335 40.000
C6 10Na2O-5SiO2-SnO2-500H2O 3.555 0.803 1.335 40.000
C7 15Na2O-5SiO2-SnO2-500H2O 5.333 0.803 1.335 40.000
C8 20Na2O-5SiO2-SnO2-500H2O 7.111 0.803 1.335 40.000
C9 5Na2O-5SiO2-1,5SnO2-500H2O 1.778 1.204 1.335 40.000
C10 10Na2O-5SiO2-1,5SnO2-500H2O 3.555 1.204 1.335 40.000
C11 15Na2O-5SiO2-1,5SnO2-500H2O 5.333 1.204 1.335 40.000
C12 20Na2O-5SiO2-1,5SnO2-500H2O 7.111 1.204 1.335 40.000
C13 5Na2O-5SiO2-2SnO2-500H2O 1.778 1.606 1.335 40.000
C14 10Na2O-5SiO2-2SnO2-500H2O 3.555 1.606 1.335 40.000
C15 15Na2O-5SiO2-2SnO2-500H2O 5.333 1.606 1.335 40.000
C16 20Na2O-5SiO2-2SnO2-500H2O 7.111 1.606 1.335 40.000
C17 5Na2O-5SiO2-2,5SnO2-500H2O 1.778 2.007 1.335 40.000
C18 10Na2O-5SiO2-2,5SnO2-500H2O 3.555 2.007 1.335 40.000
C19 15Na2O-5SiO2-2,5SnO2-500H2O 5.333 2.007 1.335 40.000
C20 20Na2O-5SiO2-2,5SnO2-500H2O 7.111 2.007 1.335 40.000
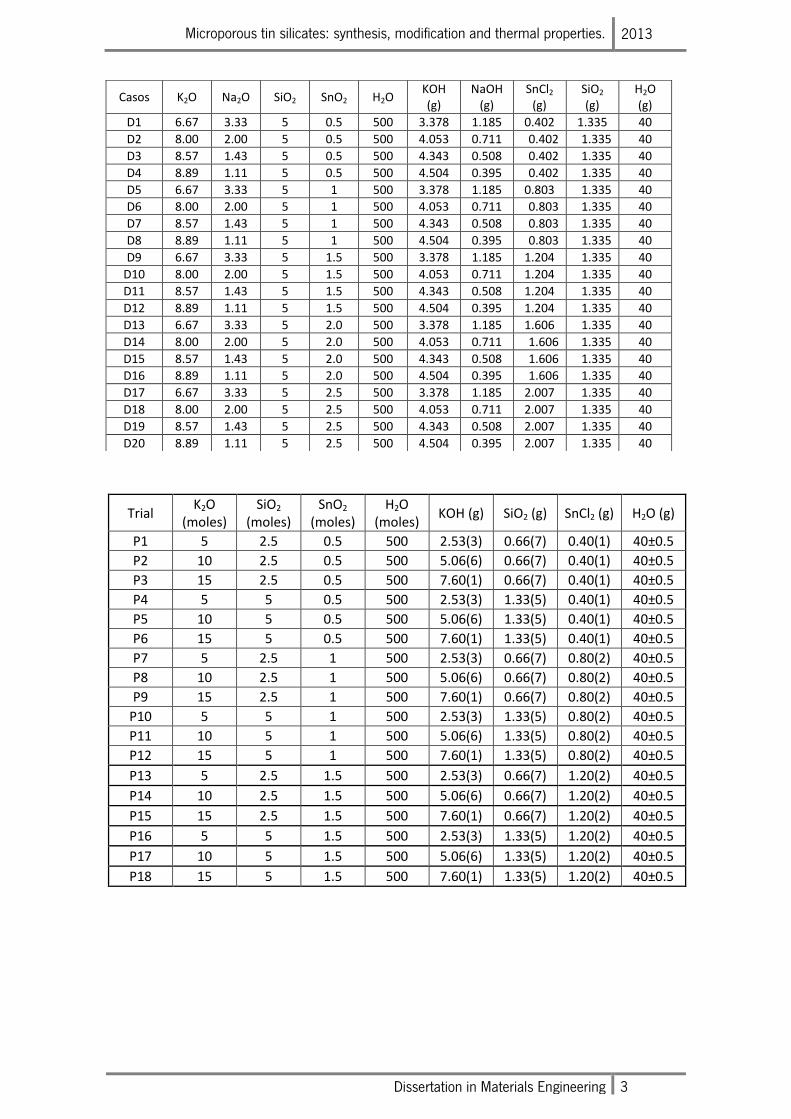
Microporous tin silicates: synthesis, modification and thermal properties. 2013
Dissertation in Materials Engineering 3
Trial K2O
(moles) SiO2
(moles) SnO2
(moles) H2O
(moles) KOH (g) SiO2 (g) SnCl2 (g) H2O (g)
P1 5 2.5 0.5 500 2.53(3) 0.66(7) 0.40(1) 40±0.5
P2 10 2.5 0.5 500 5.06(6) 0.66(7) 0.40(1) 40±0.5
P3 15 2.5 0.5 500 7.60(1) 0.66(7) 0.40(1) 40±0.5
P4 5 5 0.5 500 2.53(3) 1.33(5) 0.40(1) 40±0.5
P5 10 5 0.5 500 5.06(6) 1.33(5) 0.40(1) 40±0.5
P6 15 5 0.5 500 7.60(1) 1.33(5) 0.40(1) 40±0.5
P7 5 2.5 1 500 2.53(3) 0.66(7) 0.80(2) 40±0.5
P8 10 2.5 1 500 5.06(6) 0.66(7) 0.80(2) 40±0.5
P9 15 2.5 1 500 7.60(1) 0.66(7) 0.80(2) 40±0.5
P10 5 5 1 500 2.53(3) 1.33(5) 0.80(2) 40±0.5
P11 10 5 1 500 5.06(6) 1.33(5) 0.80(2) 40±0.5
P12 15 5 1 500 7.60(1) 1.33(5) 0.80(2) 40±0.5
P13 5 2.5 1.5 500 2.53(3) 0.66(7) 1.20(2) 40±0.5
P14 10 2.5 1.5 500 5.06(6) 0.66(7) 1.20(2) 40±0.5
P15 15 2.5 1.5 500 7.60(1) 0.66(7) 1.20(2) 40±0.5
P16 5 5 1.5 500 2.53(3) 1.33(5) 1.20(2) 40±0.5
P17 10 5 1.5 500 5.06(6) 1.33(5) 1.20(2) 40±0.5
P18 15 5 1.5 500 7.60(1) 1.33(5) 1.20(2) 40±0.5
Casos K2O Na2O SiO2 SnO2 H2O KOH (g)
NaOH (g)
SnCl2
(g) SiO2
(g) H2O (g)
D1 6.67 3.33 5 0.5 500 3.378 1.185 0.402 1.335 40
D2 8.00 2.00 5 0.5 500 4.053 0.711 0.402 1.335 40
D3 8.57 1.43 5 0.5 500 4.343 0.508 0.402 1.335 40
D4 8.89 1.11 5 0.5 500 4.504 0.395 0.402 1.335 40
D5 6.67 3.33 5 1 500 3.378 1.185 0.803 1.335 40
D6 8.00 2.00 5 1 500 4.053 0.711 0.803 1.335 40
D7 8.57 1.43 5 1 500 4.343 0.508 0.803 1.335 40
D8 8.89 1.11 5 1 500 4.504 0.395 0.803 1.335 40
D9 6.67 3.33 5 1.5 500 3.378 1.185 1.204 1.335 40
D10 8.00 2.00 5 1.5 500 4.053 0.711 1.204 1.335 40
D11 8.57 1.43 5 1.5 500 4.343 0.508 1.204 1.335 40
D12 8.89 1.11 5 1.5 500 4.504 0.395 1.204 1.335 40
D13 6.67 3.33 5 2.0 500 3.378 1.185 1.606 1.335 40
D14 8.00 2.00 5 2.0 500 4.053 0.711 1.606 1.335 40
D15 8.57 1.43 5 2.0 500 4.343 0.508 1.606 1.335 40
D16 8.89 1.11 5 2.0 500 4.504 0.395 1.606 1.335 40
D17 6.67 3.33 5 2.5 500 3.378 1.185 2.007 1.335 40
D18 8.00 2.00 5 2.5 500 4.053 0.711 2.007 1.335 40
D19 8.57 1.43 5 2.5 500 4.343 0.508 2.007 1.335 40
D20 8.89 1.11 5 2.5 500 4.504 0.395 2.007 1.335 40
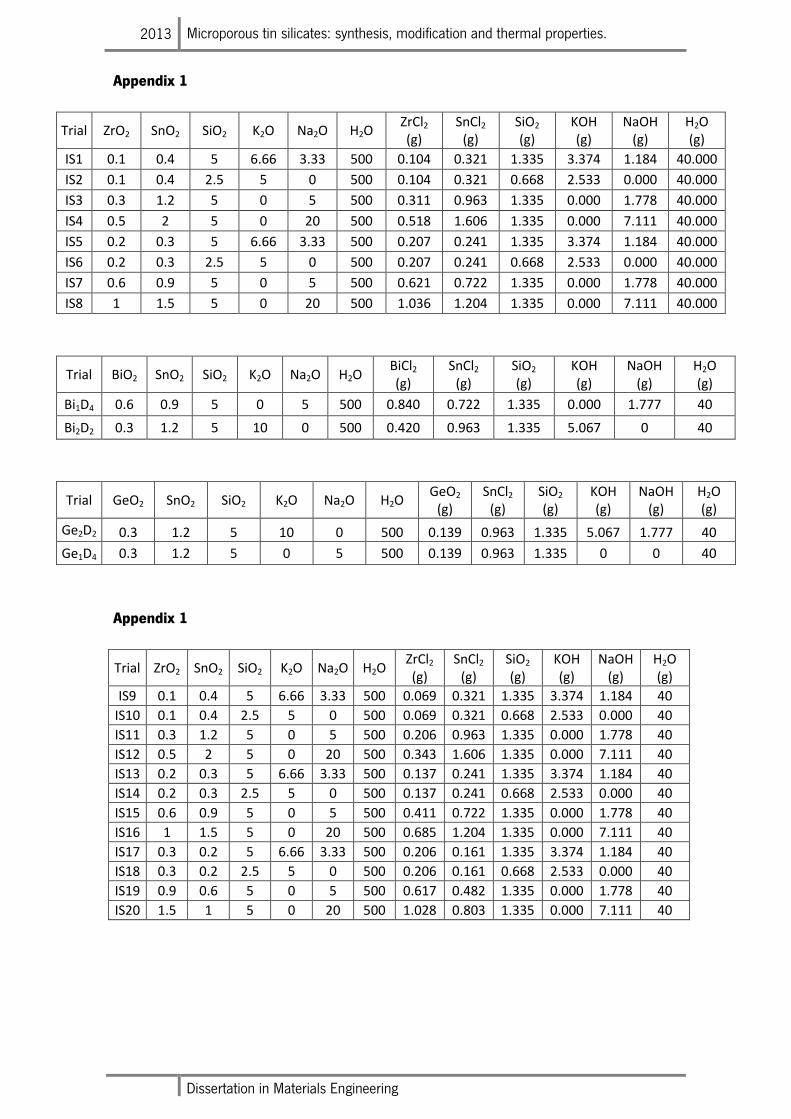
2013 Microporous tin silicates: synthesis, modification and thermal properties.
Dissertation in Materials Engineering
Appendix 1
Trial ZrO2 SnO2 SiO2 K2O Na2O H2O ZrCl2 (g)
SnCl2
(g) SiO2
(g) KOH (g)
NaOH (g)
H2O (g)
IS1 0.1 0.4 5 6.66 3.33 500 0.104 0.321 1.335 3.374 1.184 40.000
IS2 0.1 0.4 2.5 5 0 500 0.104 0.321 0.668 2.533 0.000 40.000
IS3 0.3 1.2 5 0 5 500 0.311 0.963 1.335 0.000 1.778 40.000
IS4 0.5 2 5 0 20 500 0.518 1.606 1.335 0.000 7.111 40.000
IS5 0.2 0.3 5 6.66 3.33 500 0.207 0.241 1.335 3.374 1.184 40.000
IS6 0.2 0.3 2.5 5 0 500 0.207 0.241 0.668 2.533 0.000 40.000
IS7 0.6 0.9 5 0 5 500 0.621 0.722 1.335 0.000 1.778 40.000
IS8 1 1.5 5 0 20 500 1.036 1.204 1.335 0.000 7.111 40.000
Trial BiO2 SnO2 SiO2 K2O Na2O H2O BiCl2 (g)
SnCl2 (g)
SiO2 (g)
KOH (g)
NaOH (g)
H2O (g)
Bi1D4 0.6 0.9 5 0 5 500 0.840 0.722 1.335 0.000 1.777 40
Bi2D2 0.3 1.2 5 10 0 500 0.420 0.963 1.335 5.067 0 40
Trial GeO2 SnO2 SiO2 K2O Na2O H2O GeO2
(g) SnCl2
(g) SiO2 (g)
KOH (g)
NaOH (g)
H2O (g)
Ge2D2 0.3 1.2 5 10 0 500 0.139 0.963 1.335 5.067 1.777 40
Ge1D4 0.3 1.2 5 0 5 500 0.139 0.963 1.335 0 0 40
Appendix 1
Trial ZrO2 SnO2 SiO2 K2O Na2O H2O ZrCl2 (g)
SnCl2
(g) SiO2
(g) KOH (g)
NaOH (g)
H2O (g)
IS9 0.1 0.4 5 6.66 3.33 500 0.069 0.321 1.335 3.374 1.184 40
IS10 0.1 0.4 2.5 5 0 500 0.069 0.321 0.668 2.533 0.000 40
IS11 0.3 1.2 5 0 5 500 0.206 0.963 1.335 0.000 1.778 40
IS12 0.5 2 5 0 20 500 0.343 1.606 1.335 0.000 7.111 40
IS13 0.2 0.3 5 6.66 3.33 500 0.137 0.241 1.335 3.374 1.184 40
IS14 0.2 0.3 2.5 5 0 500 0.137 0.241 0.668 2.533 0.000 40
IS15 0.6 0.9 5 0 5 500 0.411 0.722 1.335 0.000 1.778 40
IS16 1 1.5 5 0 20 500 0.685 1.204 1.335 0.000 7.111 40
IS17 0.3 0.2 5 6.66 3.33 500 0.206 0.161 1.335 3.374 1.184 40
IS18 0.3 0.2 2.5 5 0 500 0.206 0.161 0.668 2.533 0.000 40
IS19 0.9 0.6 5 0 5 500 0.617 0.482 1.335 0.000 1.778 40
IS20 1.5 1 5 0 20 500 1.028 0.803 1.335 0.000 7.111 40
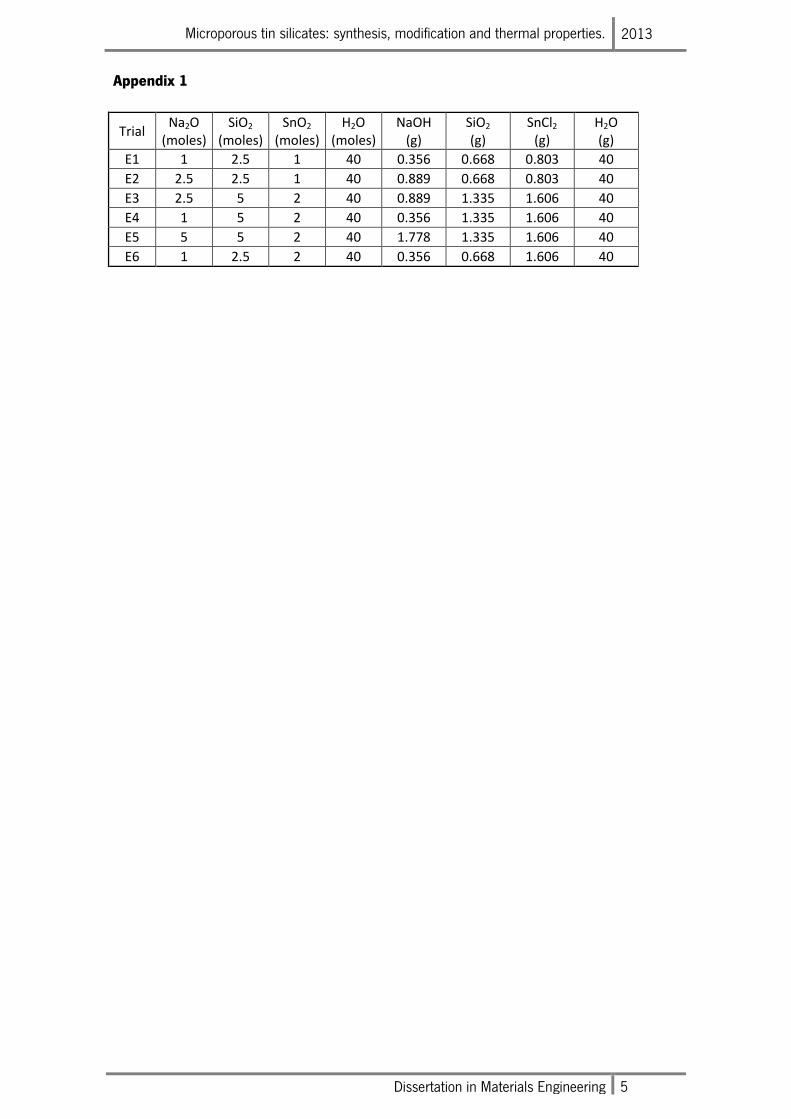
Microporous tin silicates: synthesis, modification and thermal properties. 2013
Dissertation in Materials Engineering 5
Appendix 1
Trial Na2O
(moles) SiO2
(moles) SnO2
(moles) H2O
(moles) NaOH
(g) SiO2
(g) SnCl2
(g) H2O (g)
E1 1 2.5 1 40 0.356 0.668 0.803 40
E2 2.5 2.5 1 40 0.889 0.668 0.803 40
E3 2.5 5 2 40 0.889 1.335 1.606 40
E4 1 5 2 40 0.356 1.335 1.606 40
E5 5 5 2 40 1.778 1.335 1.606 40
E6 1 2.5 2 40 0.356 0.668 1.606 40
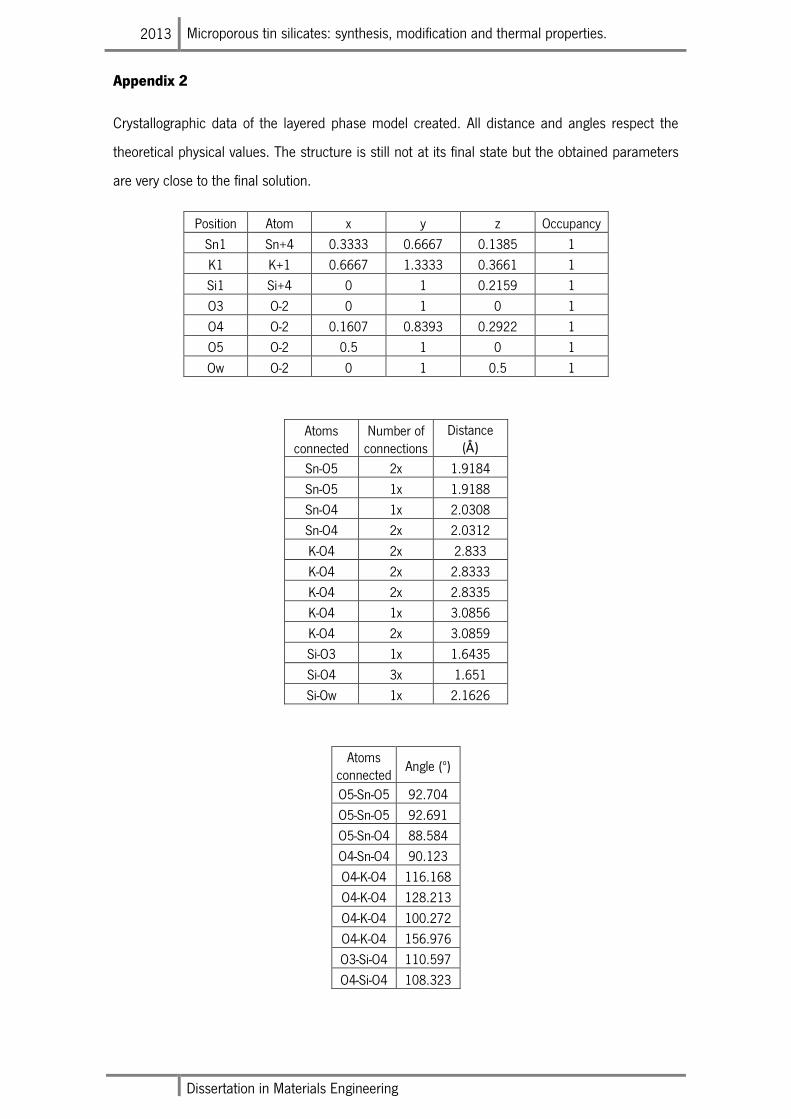
2013 Microporous tin silicates: synthesis, modification and thermal properties.
Dissertation in Materials Engineering
Appendix 2
Crystallographic data of the layered phase model created. All distance and angles respect the
theoretical physical values. The structure is still not at its final state but the obtained parameters
are very close to the final solution.
Position Atom x y z Occupancy
Sn1 Sn+4 0.3333 0.6667 0.1385 1
K1 K+1 0.6667 1.3333 0.3661 1
Si1 Si+4 0 1 0.2159 1
O3 O-2 0 1 0 1
O4 O-2 0.1607 0.8393 0.2922 1
O5 O-2 0.5 1 0 1
Ow O-2 0 1 0.5 1
Atoms connected
Number of connections
Distance (Å)
Sn-O5 2x 1.9184
Sn-O5 1x 1.9188
Sn-O4 1x 2.0308
Sn-O4 2x 2.0312
K-O4 2x 2.833
K-O4 2x 2.8333
K-O4 2x 2.8335
K-O4 1x 3.0856
K-O4 2x 3.0859
Si-O3 1x 1.6435
Si-O4 3x 1.651
Si-Ow 1x 2.1626
Atoms connected
Angle (º)
O5-Sn-O5 92.704
O5-Sn-O5 92.691
O5-Sn-O4 88.584
O4-Sn-O4 90.123
O4-K-O4 116.168
O4-K-O4 128.213
O4-K-O4 100.272
O4-K-O4 156.976
O3-Si-O4 110.597
O4-Si-O4 108.323


![Untitled Document [geocities.ws]geocities.ws/aylinkrzesaj/bombas.pdf · %RPEDV Bombas são equipamentos que transformam energia mecânica em energia hidráulica, que é fornecida](https://img.pdfslide.us/doc/110x75/5a71ca837f8b9ac0538d27dc/untitled-document-geocitieswsgeocitieswsaylinkrzesajbombaspdfpdf.jpg)