Embed Size (px)
Citation preview

Micronutrients: markers of status to understand function?
Susan Fairweather-Tait, Norwich Medical School

First, some definitions
[Bio]marker: a characteristic that is reliably and accurately measured and evaluated as an indicator of normal biological processes, pathogenic processes, or pharmacological responses to an intervention
Status: “state of the body in relation to the consumption and utilisation of nutrients”
Function: physiological role [and health sequelae]
Status Function
Biomarker that predicts function
Biomarker that validates prediction

The challenges
Biomarkers of status for many micronutrients are either inadequate or lacking
We do not have a comprehensive understanding of all of the functions of micronutrients
Even when functions are known, there may not be any in vivo biomarkers
The health consequences of changes in status and / or function are not well documented

Questions that will be addressed
What is a „good‟ biomarker of status?
How do biomarkers of status relate to function?
- Iron
- Selenium
- Vitamin D
What are the limitations of the present evidence?

What is a good biomarker of status?
Types of biomarkers
Analytes in blood, tissues and other body fluids e.g. serum concentration
Functional indices e.g. enzyme activity
Physiological measurements e.g. growth
Genetic / metabolic data
„Signatures‟ or patterns of sets of data (-omics technologies)
Attributes
Sensitive
Specific
Reproducible
Robust
Resistant to other influences
Changes under dietary conditions of deficiency and overload
Dose-responsive within the normal dietary range
Heaven by Salvadore Dali

Biomarkers of status: iron, iodine, copper, zinc, magnesium, selenium, folate and
related B vits, and polyphenols
R = Research only F = Field (survey) use Rating
– ***Excellent – ** Good – * Limited use – Not useful
Workshop of invited experts, Norwich UK, 2008 Reviews published in BJN supplement
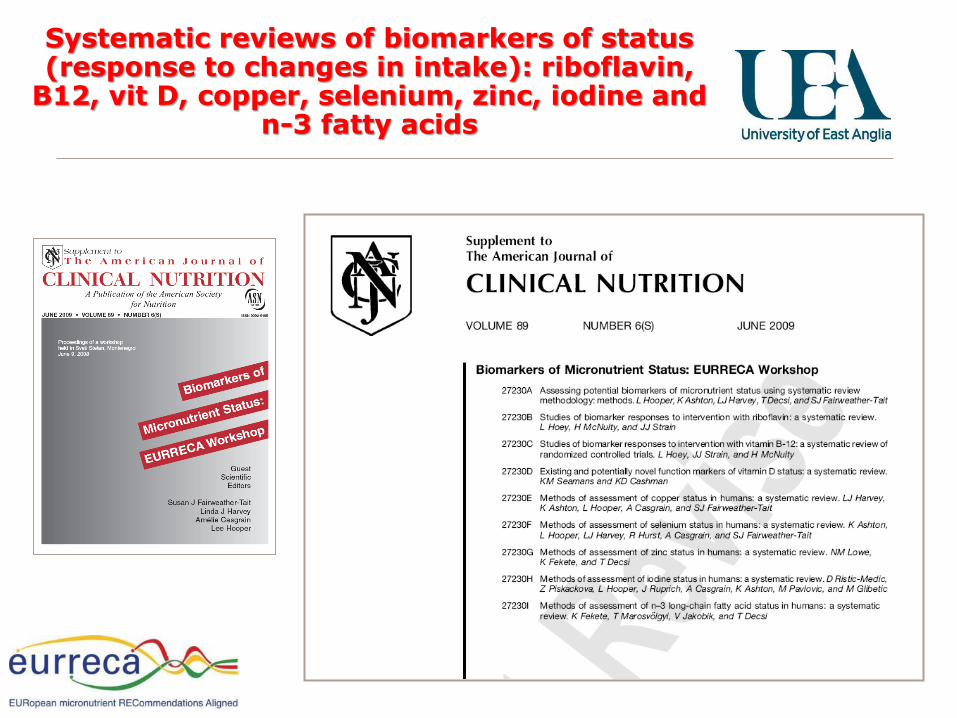
Systematic reviews of biomarkers of status (response to changes in intake): riboflavin,
B12, vit D, copper, selenium, zinc, iodine and n-3 fatty acids

How do biomarkers of status relate to function?
Functions of iron
Component of haemoglobin in red blood cells – transports oxygen around the body
Component of myoglobin – storage and use of oxygen in muscles
Component of haem and iron-sulphur complexes in enzymes responsible for electron transport and energy generation in mitochondrial respiration and the citric acid cycle etc.
Examples of biomarkers of status
Hb concentration is used to measure the presence and severity of deficiency
Insensitive
Transferrin receptor concentration measures the degree of iron deficiency
Plasma/serum ferritin is used to measure the size of iron stores
Confounded by infection/inflammation
Using iron as an example
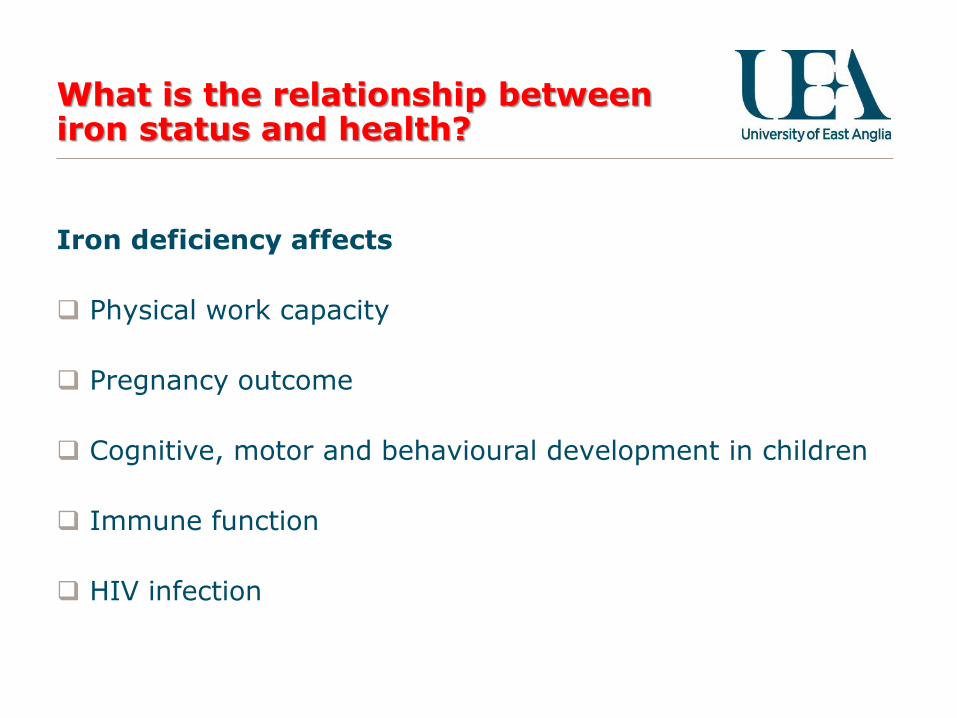
What is the relationship between iron status and health?
Iron deficiency affects
Physical work capacity
Pregnancy outcome
Cognitive, motor and behavioural development in children
Immune function
HIV infection

• Of the 4415 articles identified through searching, 333 RCTs were assessed as full-texts
and the following included for the prioritised health outcomes:
• The majority of analysis was based on iron intake (+/- supplement), although many trials
also measured biomarker responses these were not generally analysed directly in
relation to the health outcomes
• A small number of cohort studies were identified (3) which assessed the effect of training
regimes on iron status markers; one assessed the relationship between iron status and
physical ability in a frail elderly population
Systematic review of the relationship between iron status and selected health outcomes

Iron and physical performance (RCTs)
Aerobic Capacity/
Endurance
Max capacity test: VO2max, max minute ventilation
(VE), time to exhaustion, max work rate*, heart
rate (HR), max workload*
Sub-max. capacity test: VE, RER, HR, work rate*,
energy expenditure (VO2/RER), average oxygen
pulse (VO2/HR), % VO2max, workload*
Anaerobic capacity Blood lactate threshold, ventilatory threshold
Efficiency Tea picked, voluntary physical activity, pieces of
clothing sewn, % efficiency during exercise
*Can be measurement of maximal or sub-maximal capacity, depending on how assessed during the exercise trial.

Meta-analyses of aerobic capacity (effect of iron supplementation)
Mean difference
(95% CI) p
No included
studies I2 (%)
VO2max Athletes 1.99 (0.61, 3.37) >0.01 5 0
Untrained 0.25 (-2.36, 2.87) NS 2 0
Time to
exhaustion
(min)
Athletes 0.33 (-3.79, 4.44) NS 2 0
Untrained 1.70 (0.39, 3.01) 0.01 1 NA
Respiratory
exchange ratio
Athletes -0.02 (-0.04, 0.00) NS 3 0
Untrained 0.02 (-0.02, 0.05) NS 2 53
Heart rate Athletes -6.45 (-14.11, 1.22) NS 2 0
Untrained -5.00 (-11.18, 1.18) NS 1 NA
Work rate Athletes 5.50 (-25.92, 36.92) NS 1 NA
Untrained -0.36 (-14.81, 14.09) NS 3 (4 arms) 0
Ma
x c
ap
acity te
st
Su
b-M
ax c
ap
acity te
st

Study Main performance test Principal measures
Fogelholm 1992 Incremental ergometer test Blood lactate, VO2 max
Powell 1991 Endurance run on treadmill VO2, lactate, RER (respiratory exchange ratio)
LaManca 1993 Cycle ergometer with increasing intensity Heart rate (HR), lactate, RER, VO2 max
Friedmann 1999 Incremental treadmill test (+ training camp) HR, lactate
Klingshirn 1999 Graded maximal exercise test on treadmill RER, lactate concentration, time to exhaustion, VO2 max
Schone 1983 Cycle ergometer with progressive work protocol HR, lactate max, maximum workload, VO2 max
Yoshida 1990 3000m run + incremental treadmill test RER, lactate threshold, time trial, VO2 max
Zhu 1998 15km bicycle ergometer + incremental test Time trial, HR, energy expenditure, % VO2 peak
Newhouse 1989 Incremental cycle ergometer + treadmill tests Wingate power test, max & mean power
Rajaram 1995 Treadmill with increasing elevation Maximum time on treadmill, VO2 max
Lieden 1974 Increasing ergometer test Work capacity at 170bpm HR
Hinton 2000/ Brownlie 2004
Incremental ergometer + 15km tests Energy expenditure, HR, RER, % VO2, Time trial, efficiency
Hinton 2007 Cycle ergometer tests Total energy expenditure, max HR, RER, efficiency, ventilation threshold (VT), VO2 peak
Ericsson 1970 Bicycle ergometer tests Physical work capacity (HR max)
Cotes 1972 Cycle ergometer tests HR, VO2 @ 30W
Brutsaert 2003 Knee-extension exercise protocol Muscle fatigue
Edgerton 1979 Tea-picking (work productivity), daily activity KG tea per person, right ankle movement
Florencio 1981 Sewing clothes (work productivity) Efficiency = ((no. pieces per day x minutes per piece) / minutes at work) x 100
Magazanik 1991 Treadmill with increasing gradient + training VO2 max
Lyle 1992 Treadmill walking with increasing elevation VO2 max

Summary of the physical performance systematic review
Quality of included studies was low and risk of bias assessed as unclear or high in all studies
Physical performance is mostly measured in athletes or training volunteers - not relevant for the general population
Aerobic capacity was the most commonly assessed outcome: studies reported different tests that could not always be combined, making the meta-analysis difficult
Lack of good quality studies prevented meta-analysis of other outcomes
Future research should focus on standardising physical performance measures, using good quality and informative measures

How do biomarkers of status relate to function? Deriving DRVs for selenium
Input information
- Benefit: Plasma GPx activity (data from dose-response studies in China and NZ)
- Risk of selenosis: epidemiological data from China, and 200g/d supplementation trial (Clark)
EAR (50% response) 45g/d
UL (50% response) 3200g/d
0.001
0.01
0.1
1
10
100
10 100 1000 10000
Selenium Daily Intake (g/day)
% I
ncid
en
ce Absence
of benefit
Risk of
selenosis
Adapted from Renwick et al 2008

Effect of selecting different functional endpoints
Input data
- Possible anti-cancer effect
(Clark study and other trials)
- Prolonged prothrombin time (data from high Se areas in China)
EAR 143g/d
UL 897g/d
Adapted from Renwick et al 2008
0.001
0.01
0.1
1
10
100
10 100 1000 10000
Selenium Daily Intake (g/day)
% I
ncid
en
ce
Effect
used
for EAR
Possible anti- cancer effect
Effect
used
for UL
Possible pro-thrombin effect

Translating biomarkers of status into dietary recommendations
0 50 100 150 200
05
01
00
15
02
00
Total Se intake (µg/d)
pla
sm
a S
e c
on
ce
ntr
atio
n (
ng
/ml)
100 µg/d Se yeastplacebo50 µg/d Se yeast200 µg/d Se yeastunenriched onionsSe-enriched onions
0 50 100 150 200 250 300
02
46
81
0
Total Se intake (µg/d)
se
len
op
rote
in P
co
nce
ntr
atio
n (
µg
/ml)
100 µg/d Se yeastplacebo50 µg/d Se yeast200 µg/d Se yeastunenriched onionsSe-enriched onions
Hurst et al. Am J Clin Nutr 2010
Dose-response relationship between selenium intake and plasma selenium and selenoprotein P concentrations

*Clark et al. JAMA 1996;276:1957-63
Copyright restrictions may apply.
Relationship between selenium intake, status (serum Se) and health outcome (prostate cancer)
SELECT trial (2001-2004)
Double-blind randomised placebo-controlled trial of 35,533 men with raised serum prostate-specific antigen levels - USA, Canada and Puerto Rico
Assigned to Se (200µg/d as SeMet), vit E, Se + Vit E, or placebo groups
0
50
100
150
200
250
300
Baseline 6m 1y 2y 4y
Placebo Selenium
Serum Se µg/L
*NPC trial effect cut-off 120µg/L
Lippman, S. M. et al. JAMA 2009;301:39-51

Relationship between nutrient intake, status and function
Morris & Tangney JAMA 2011;305:13-14.
Intake

Example of a well-accepted function that cannot be measured
Scientific Opinion on the substantiation of health claims related to calcium and ... muscle function and neurotransmission... pursuant to Article 13(1) of Regulation (EC) No 1924/2006 EFSA Journal 2009; 7(9):1210
Muscle function and neurotransmission
The claimed effects are “muscle function”, “nerve transmission/function”, “nerves and muscle”. The target population is assumed to be the general population. Normal muscle function and neurotransmission are beneficial to human health.
A cause and effect relationship has been established between calcium and normal muscle function and neurotransmission in healthy subjects.
The evidence provided does not establish that inadequate intake of calcium leading to impaired muscle function and neurotransmission occurs in the general EU population.
The following wording reflects the scientific evidence: “Calcium contributes to normal muscle function and neurotransmission”.

How do biomarkers of status relate to intake? Using Vitamin D as an example
The relation between serum 25-hydroxyvitamin D[25(OH)D] concentrations (in late winter 2007) and total vitamin D intake(diet and supplemental) in 20–40-y-old healthy persons (n 215) living at northerly latitudes. Mean response and 95% CIs in the shaded area. Cashman et al. Am J Clin Nutr 2008;88:1535-43
What is the target 25(OH)D concentration for ‘optimal’ function?

Lack of consensus for target values for 25(OH)D
Examples from the literature
Preventing rickets / osteomalacia: 25-30 nmol/L
- US DRI committee: 40 nmol/L EAR: mid-point of the range (30-50 nmol/L) which includes an additional 30% to cover needs of 97.5% of the population
- Optimal bone health: 75 nmol/L (e.g. Vieth 2011)
Various non-skeletal effects, including CVD risk, colorectal cancer, prostate cancer, diabetes, immune function (e.g. respiratory function)...
Multiple health outcomes: 75 nmol/L (consensus statement, Dawson-Hughes et al 2005)
Need to define „optimal‟ requirements in particular sub-groups of the population for a wide range of outcomes (Rank Forum, Lanham-New et al 2011)
Effects of obesity: increases requirements? (Cheng et al 2010)
Effects of inflammation: reduces 25(OH)D concentration but not „status‟ (Reid et al 2011)

Functional effects of genotype
Jablonska et al 2009 Eur J Nut 48, 383-386
No effect of GPx1 polymorphism on mean plasma Se concentration or GPx activity, but the relationship between GPx activity and Se concentration was significantly affected by the SNP
47% 43% 10%

Genotype-phenotype database
Functional SNPs and Intake/Status/Health data
for selenium, folate, B12, zinc and iron

Reflections on current evidence
Intake-health relationships depend on the choice of biomarker(s) – can significantly influence dietary requirements and recommendations
A dose-response relationship between status and some well-accepted functions cannot be demonstrated because life not sustained below the threshold at which an effect can be observed
The baseline status of volunteers participating in an RCT may mask the functional effects of the nutrient and lead to an inappropriate interpretation of effects on health
- this is sometimes the reason why there is disparity between results from different RCTs
Genotype may have functional effects with some biomarkers

New work on biomarkers
Goal of the BOND Program The BOND Program aims to harmonize the processes for making decisions about what biomarkers are best for use in support of research, program development and evaluation, and generation of evidence-based policy.
The Translational Track will develop processes to inform various user groups about appropriate biomarker selection and use. The development and use of the translational materials will then generate a research agenda that will support the next track.
The Research Track will support the discovery of biomarkers and development of their use.
http://www.nichd.nih.gov/global_nutrition/programs/bond/
AJCN 2011 Aug;94(2):633S-50S. Epub 2011 Jul 6

What is the future for biomarkers?
Wise thoughts from the past
“If your results don't make sense, think and think again! You may have made a mistake or you may have made a discovery. Above all, treasure your exceptions; you will learn most from them.”
Elsie Widdowson (1906-2000)
“Much needs to be learned about the quantitative extent to which genetic, epigenetic and dietary factors interact to determine the nutritional phenotype.”
Vernon Young (1937-2004) TEMA-11 2002 (J. Nutr 2003;133)
New / improved biomarkers of micronutrient status are needed – these will allow us to examine the relationships between intake, function and health to
- inform public health policies
- enhance personalised nutrition
- facilitate the development of healthier food products

Thank you for listening!
Acknowledgements
EURRECA colleagues, including the UEA team
Rachel Collings
Amelie Casgrain
Lee Hooper
Linda Harvey
Rachel Hurst
Maria King


![WELCOME [ilsi.eu]ilsi.eu/.../06/Session-1-Talk-1-Presentation-ILSI-Eu-SV-4ap12-ppt.pdfWELCOME to the ILSI Europe Workshop MONITORING IMMUNE MODULATION BY NUTRITION IN THE GENERAL POPULATION](https://img.pdfslide.us/doc/110x75/5b00b7867f8b9a65618c7d3a/welcome-ilsieuilsieu06session-1-talk-1-presentation-ilsi-eu-sv-4ap12-pptpdfwelcome.jpg)


![Exploring Germplasm Diversity to Understand the Domestication …oar.icrisat.org/8206/1/fetchObject.pdf · and DArT markers for chickpea have recently been developed [29]. The present](https://img.pdfslide.us/doc/110x75/600fb6abcfe2c843bc60a154/exploring-germplasm-diversity-to-understand-the-domestication-oar-and-dart-markers.jpg)