Embed Size (px)
Citation preview

Microgravity Compatible Reagentless Instrumentationfor Detection of Dissolved Organic Acids and Alcohols
in Potable Water.
Final Report
James R. Akse, Ph.D.Principle Investigator
April 2002
Advanced Human Support Technology Program:Advanced Environmental Monitoring and Control
Grant Number: NAG9.1081
Submitted to:
Darrell L. Jan, Ph.D.
Advanced Environmental Monitoring and Control ManagerJet Propulsion LaboratoryMIS 180-604
4800 Oak Grove Drive
Pasadena, CA 91109-6099
https://ntrs.nasa.gov/search.jsp?R=20020052433 2018-06-20T16:46:09+00:00Z

TABLE OF CONTENTS
TABLE OF CONTENTS ............................................................................................. i
LIST OF FIGURES ................................................................................................... ii
LIST OF TABLES .................................................................................................... iv
PROJECT SUMMARY ............................................................................................. v
1.0 INTRODUCTION ................................................................................................ 1
2.0 MATERIALS AND EQUIPMENT ...................................................................... 7
2.1 Chemicals ................................................................................................... 7
2.2 Materials ..................................................................................................... 7'
2.3 Analytical Instruments ............................................................................. 8
2.4 Computer Hardware and Software ......................................................... 8
3.0 EXPERIMENTAL SECTION ............................................................................. g
3.1 Solid Phase Acidification Module (SPAM) .............................................. 9
3.2 CO 2 Degassing Membrane (CDM) .......................................................... 113.3 Organic Acid Transfer Module (OATM) ................................................. 12
3.4 Modified Conductivity Detector ............................................................. 133.5 Immobilization of Alcohol Oxidase ....................................................... 13
3.6 Preparation of Improved Oxidation Catalyst Supports ....................... 16
3.6.1 Surface Charge and Organic Acid Adsorption ............................ 17
3.6.2 Silica Mesocellular Foams (MCFs) ............................................... 18
3.7 Preparation of Oxidation Catalysts on MCF Supports ........................ 20
3.8 Evaluation of Oxidation Catalysts Performance ................................. 22
3.9 Separation of Organic Acids ................................................................. 24.
4.0 DEVELOPMENT OF OAAM COMPONENTS AND OAAM PROTOTYPE.. 26
4.1 Solid Phase Acidification Module (SPAM) Performance .................... 264.2 CDM Performance ................................................................................... 26
4.30ATM Performance ................................................................................ 28
4.3.1 Temperature Effects ....................................................................... 28
4.4 Performance Testing of Stopped Flow OAAM Configuration ............ 29
4.5 Performance Testing of Flow Injection Analyzer Configuration ....... 33
4.6 Performance Testing of Immobilized Alcohol Oxidase ...................... 35
4.7 Performance Testing of Oxidation Catalysts ....................................... 36
4.8 Determination of Alcohols Using Improved Oxidation Catalysts ..... 38
5.0 CHARACTERIZATION OF PROTOTYPE OAAM PERFORMANCE! ............ 39
5.1 Organic Acids - OAAM Analytical Performance .................................. 40
5.2 Separation of Organic Acids on OAAM Prototype .............................. 47
5.3 Alcohols - OAAM Prototype Analytical Performance ......................... 54
6.0 CONCLUSIONS ............................................................................................... 60
7.0 REFERENCES ................................................................................................. 64
8.0 APPENDIX: Publication in Life Support & Biosphere Science ................. 67
URC 80985 i

LIST OF FIGURES
FIGURENUMBER FIGURE DESCRIPTION
PAGE
NUMBER
1 International Space Station Water Recovery System (WRS) Schematic. 22 Organic Acid and Alcohol Monitor (OAAM) Schematic. 33 Tube-in-Shell Counter-Current Gas Transfer Module. 12
4 Modified Flow Through Model 515 Micro-Conductivity Cell. 135 Titanium Activation Method for Immobilization of Alcohol Oxidase. 15
6 Immobilization of Alcohol Oxidase on Cyanogen Bromide Activated
Agarose. 167 Zeta Potential for Amorphous Silica. 21
8 UV-VIS Spectra from Ethylenediamine Solution Containing Platinic Acid. 239 FIowTest Apparatus. 2310 Separation of Organic Acids on Ion Exchange Column. 2511 CO2 Degassing Performance for PTFE and PDMS Membranes. 2712 Effect of Temperature on OATM Transfer Efficiency for Formic Acid. 2913 Stopped Flow Time Conductiometric Response for Various Organic Acids. 30
14 High Level Organic Acid Response Curves. 3115 Low Level Organic Acid Response Curves. 3216 Theoretical Equilibrium Conductiometric Response for Acetic Acid. 32
17 Acetic Acid High Range Response Curve for FIA Version of the OAAM. 3418 Acetic Acid Low Range Response Curve for FIA Version of the OAAM. 3419 Oxidation of 7.9 mg/L Methanol and Ethanol by Immobilized Alcohol
Oxidase on Diatomaceous Earth at Ambient Temperature. 35
20 Comparison of Theoretical and Measured Conductiometric Response of
Oxidized 1-Propanol. 3621 Propionaldehyde Oxidation Kinetics Curve for MCF #1: 2.0% Pt Catalyst. 3722 Ethanol Response Curve using Alcohol Oxidase plus MCF: 2.0% Pt
Catalyst Sequential Oxidation Beds. 3823 Flow Injection Peaks for Formic, Acetic and Propionic Acid Standards. 4024 High Range Formic Acid Response Curve. 4125 Ionization of Organic Acids versus Concentration. 4226 Equilibrium Specific Conductance for Organic Acids versus Concentration. 4227 Low Range Formic Acid Response Curve. 43
28 High Range Acetic Acid Response Curve. 4429 Low Range Acetic Acid Response Curve. 45
30 High Range Propionic Acid Response Curve. 4631 Low Range Propionic Acid Response Curve. 4632 500 rtg/L Formic Acid Injection with Analytical Stream Separation Column. 47
33 500 p.g/L Acetic Acid Injection with Analytical Stream Column. 48
34 500 l_g/L Propionic Acid Injection with Analytical Stream Column. 4835 Blank Injection with Analytical Stream Column. 4936 Separation of Organic Acid Mixtures with Analytical Stream Column. 50
37 500 l_g/L Formic Acid Injection with Analytical Stream Separation Column. 51
URC 80985 ii

FIGURENUMBER
38
39
40
41
424344454647
48
FIGURE DESCRIPTION
500 l_g/L Acetic Acid Injection with Analytical Stream SeparationColumn.
500 t_g/L Propionic Acid Injection with Analytical Stream SeparationColumn.
Chromatogram for 500 I_g/L Each of Formic, Acetic, and PropionicAcids with Corresponding Single Acid Retention Time.Chromatogram for 10 mg/L Each of Formic, Acetic, and PropionicAcids with Corresponding Single acid Retention Time.
Flow Injection Peaks for Methanol, Ethanol and n-Propanol.Methanol Response Curve.Methanol Low Level Response Curve.Ethanol Response Curve.Ethanol Low Level Response Curve.n-Propanol Response Curve.
n-Propanol Low Level Response Curve.
PAGENUMBER
51
52
52
5354
555657575859
URC 80985 iii

TABLE
NUMBER
LIST OF TABLES
TABLE DESCRIPTION
Isoelectric Points for Common Oxides.
PAGE
NUMBER
18
URC 80985 iv

PROJECT SUMMARY
The Organic Acid and Alcohol Monitor (OAAM) program has resulted in thesuccessful development of a computer controlled prototype analyzer capable of accuratelydetermining aqueous organic acids and primary alcohol concentrations over a largedynamic range with high sensitivity. Formic, acetic, and propionic acid were accuratelydetermined at concentrations as low as 5 to 10 l_g/L in under 20 minutes, or as high as 10
to 20 mg/L in under 30 minutes. Methanol, ethanol, and propanol were determined atconcentrations as low as 20 to 100 l_g/L, or as high as 10 mg/L in under 30 minutes.Importantly for space based application, the OAAM requires no reagents or hazardouschemicals to perform these analyses needing only power, water, and CO 2 free purge gas.The OAAM utilized two membrane processes to segregate organic acids from interferingions. The organic acid concentration was then determined based upon theconductiometric signal. Separation of individual organic acids was accomplished using achromatographic column. Alcohols are determined in a similar manner after conversion toorganic acids by sequential biocatalytic and catalytic oxidation steps. The OAAM wasdesigned to allow the early diagnosis of under performing or failing sub-systems within theWater Recovery System (WRS) baselined for the International Space Station (ISS). Toachieve this goal, several new technologies were developed over the course of the OAAM
program.The new technologies developed during this program included; 1) a Solid Phase
Acidification Module (SPAM) based upon sequential layers of CaSO 4 granules and strongacid ion exchange resin beads in the hydrogen ion form capable of lowering the pH of aflowing water stream to less than 1.75; 2) a counter-flow, polydimethylsiloxane membranebased CO 2 Degassing Module (CDM) capable of rapidly separating carbon dioxide froman acidified solution containing volatile organic acids without loss of organic acids; 3) an
efficient microporous polypropylene membrane based Organic Acid Transfer Module(OATM) capable of rapidly transfering volatile organic acids from an acidified carrierstream to a deionized water analytical stream; 4) a bed containing robust and highly activealcohol oxidase immobilized on a diatomaceous earth support for the conversion of
primary organic acids to the corresponding aldehyde at ambient temperature withoutretention of the aldehyde product, and; 5) an ambient temperature noble metal catalystsupported on a novel mesocellular foam (MCF) carrier capable of oxidizing aldehydes toorganic acids without retention of organic acids. The OAAM was configured as a FlowInjection Analyzer (FIA) using these basic components. Software programs which controlpump speeds, acquire data, and analyze data were interfaced with the OAAM to view,store, and analyze data for the determination of organic acid and alcohol concentrations inwater.
The computer controlled, prototype OAAM developed during this program iscapable of rapidly determing alcohols and organic acids in water with great sensitivity anda wide dynamic range. The attributes of this enabling technology fit well with a potentialrole as an analytical instrument that will characterize sub-system performance in the WRSthat has been baselined for the ISS. Full development of this technology will allow a realtime evaluation of WRS performance and the diagnosis of incipient and evident sub-
system malfunctions. This technology also has the potential for expansion to otheranalytes of interest including nitrate, nitrite, and ammonia with minor modification of thebasic components. The results from the OAAM development program have been reportedin Life Support and Biosphere Science. 36 In addition, a synopsis of the operation
principles used by the OAAM as well as some analytical results is presented on theUMPQUA Research Company webpage at http:llwww.urc.ccloam.htm.
URC 80985 v

1.0 INTRODUCTION.
The 'reagentless' microgravity compatible organic acid and alcohol monitor for
the determination of these contaminants at various points in the Water Recovery
System (WRS) aboard the International Space Station (ISS) was developed to insure
potable water quality by allowing better process control and providing diagnostic data
useful for the identification of potential problems. An overview of the significance of
organic acids and alcohols in the reclamation of waste water as well as the Organic
Acid and Alcohol Monitor (OAAM) operation principles are summarized below to
facilitate the description of the achievements during the third year of this program.
Organic acids and alcohols occur in humidity condensate, urine distillate, and
composite waste waters, which consitute a significant fraction of all contaminated water
streams aboard spacecraft such as ISS. 1-4 The WRS that is designed to produce
potable water from such waste waters is shown schematically in Figure 1._.6 The WRS
removes contaminant species using a combination of processes. Ionic contaminants
such as organic acids and inorganic salts are removed by ion exchange (IX), while the
majority of organic species are removed by sorption media within the multifiltration (MF)
subsystem. Highly polar, low molecular weight organic contaminants such as alcohols
are not efficiently removed by MF, and therefore, must be catalytically oxidized in the
Volatile Removal Assembly (VRA)J -11 Oxidation of alcohols forms organic acids which
are removed by a post-treatment IX bed. The concentration of organic acids and
alcohols at the outlets to MF, VRA, and post-treatment IX beds indicates process
effectiveness at elimination or conversion of the corresponding contaminant fraction.
The ability to quantify alcohols and organic acids at various points within the WRS will
provide a means for verification of proper operation of MF, VRA, or post-treatment IX
processes and for diagnoses of developing problems.
Currently, the only WRS on-line sensor determines conductivity, which provides
limited diagnostic information with which to trace sub-system failures or potential
problems. The ability to accurately quantify both organic acids and alcohols
significantly enhances and refines such capabilities. For example, the initial MF
process is expected to eliminate all ionic and most organic contaminants. Detection of
organic acids at the MF outlet, strongly indicates failure of the IX components within the
MF train. At the same time, alcohols will be present at a concentration that depends on
alcohol generation and useage rates within the spacecraft. The VRA oxidizes these
alcohols and other low molecular weight, highly polar organics. The chief oxidation by-
products are organic acids and carbon dioxide. Consequently, the presence of alcohols
URC 80985 1
Multifiltration Beds (MF): 10 Tubes ContainingVarious Ion Exchange and Sorbent Media
Pump
[_ = Conductivity Sensor
Degasser
___ Combined _Waste Hygiene Water
Water
m "" VCD Urine Distillate
HumidityCondensate
len
Inlet
(_),(_)and (_) are Sample
Points for Diagnosis ofPotential WRS Problems
ProductWater
Figure 1. International Space Station Water Recovery System (WRS) Schematic.
at the VRA outlet indicates less than optimal oxidation conditions within the VRA. If
organic acids are not detected at the VRA outlet, then either the VRA catalyst or oxygen
supply has failed. The detection of organic acids confirms proper VRA operation. The
post-treatment IX beds remove organic acids from the VRA effluent. If organic acids
are present at the WRS outlet, then the post-treatment IX beds have failed. In short,
the addition of organic acid and alcohol analytical capability provides an essential tool
for rapid on-line diagnosis of water processor problems. Response to such problems
as they become evident will facilitate maintenance of each process and result in the
production of high quality potable water.
A schematic of the OAAM is shown in Figure 2. The prototype OAAM is
configured as a flow injection analyzer (FIA). A stopped flow version of the OAAM was
also tested during the program. Although the stopped flow version provided lower
detection limits, a number of factors favored the FIA design. These included a faster
response, a nearly equivalent sensitivity, ease of use, and design flexibility. Only power,
water, carbon dioxide free purge gas, and solid phase reagent producing beds are
required to operate the OAAM, which minimizes storage and handling of hazardous
URC 80985 2

alcohol oxidase
pluscatalyst beds
_1 Flow _ Flow
nJection_. #1 ./ ResU_or
- Deionization _ Valve / _ \_ _ ca_ierst_am;1,!,Acidification Iffg"nT_l I_
DeionizationBed
Peristaltic
Pump
Water
Reservoir
separaUoncolumn
c_ __ __ CO=Free
CO= Degasslng
Module (CDM)
_o_ Purge Gas Organic Acid
acid stream Mlxl_ Tee -- -- Transfer
I_,_-_ towaste Module(OATM)
analytical stream _ "_H_.
_-nc=osure [ .........................................
alternativeseparaUon kcaUonfor
Valve f] column separation
_ cc_unm
ColtdllJ_ll_8 _..........................................................
Meter
Platinum
Conductivity
_.. Cell
,Q__ FlowRestdct_x
to wasteComputer Data Acquisition and Analysis
Figure 2. Organic Acid and Alcohol Monitor (OAAM) Schematic.
reagents, eliminates reagent preparation and replacement, and reduces the
expenditure of valuable astronaut time to performance of the immediate analysis only.
Water is withdrawn from a selected sample port within the WRS either manually or by
an automated sampling device. The 1 mL injection loop of the OAAM is then filled with
sample, the flow injection valve is actuated, and a plug of sample enters the carrier
stream. This plug is carried into the mixing Tee where it is acidified with an equal
volume from the acid stream. The acid stream was created by flowing water through a
Solid Phase Acidification Module (SPAM). The SPAM contains a bed of CaSO 4
particles followed by a bed of strong acid ion exchange (IX) resin in the hydrogen ion
form. The dissolution of CaSO 4 produces Ca 2+ and SO4 = ions. When this solution
passes through the IX bed, each Ca 2+ ion is exchanged for two H+ ions and a dilute
sulfuric acid solution is generated with a pH of 1.60 to 1.75.12-14 Mixing of the acid and
carrier streams lowers the pH and protonates acid gas species causing them to
volatilize. In the sample, these acid gases include the chief interferant, CO 2, and
organic acids. As the acidified sample plug passes through the CO2 Degassing Module
URC 80985 3

(CDM), 002 is selectively removed by a flow of CO 2 free N 2 gas. The degassed sample
plug then passes into the Organic Acid Transfer Module (OATM). In the OATM, volatile
organic acids diffuse across the OATM membrane into the deionized analytical stream.
Due to the pH gradient between the analytical and carrier streams, the analytical stream
acts as an organic acid sink. In the analytical stream, organic acids dissociate and
cause the conductivity to increase. This solution then passes through the conductivity
detector which determines the solution's specific conductance. The quadratic
relationship between organic acid concentration and the specfic conductance
corresponds to the equilibrium speciation of organic acids as a function of pH.
To determine the concentration of each organic acid in a mixture, they must be
chromatically separated prior to detection. Two choices exist for the position of the
separation column. In the first, the carrier stream is directed at bypass valve #2 into a
separation column immediatedly after the mixing Tee. In this position, organic acids
are chromatically separated using the acidified solution as the eluent. Alternatively, the
separation column is placed in the analytical stream immediately downstream of the
OATM. In this position, organic acids are chrmatically separated using water as the
eluent.
For alcohols, the sample plug is initially directed through bypass valve #1 to flow
through an immobilized alcohol oxidase bed. This enzyme converts alcohols to the
corresponding aldehyde. Immediately downstream from the enzyme bed, a catalyst
bed converts any aldehyde to the corresponding organic acid. 1_-1_ After the conversion
of an alcohol to an organic acid has been completed, the sample plug flow path is
identical to that of an organic acid analysis and the specific conductance response is
utilized to quantitate the alcohol concentration.
During the first year of the program, the first OAAM was assembled and tested.
Both CDM and OATM were optimized to improve transfer of carbon dioxide and organic
acids, respectively. A new SPAM was developed capable of a lower achievable pH
between 1.60 and 1.75, allowing better transfer of organic acids. Detection limits of
0.125 mg/L for formic acid and 1.0 mg/L for acetic acid were demonstrated with a
predictable conductiometric response over a wide concentration range up to 40 mg/L
for both contaminants. This eady version of the OAAM utilized a flow injection
configuration with a response time of 10 minutes.
During the second year, a stopped flow variation of the OAAM was constructed
utilizing the optimized CDM and OATM that were developed during the first year. Using
URC 80985 4

these components the OAAM was capable of determining formic, acetic, and propionicacids at concentrations between 0.005 and 40 mg/L (i.e., 5 ppb to 40 ppm) in less than
20 minutes. The limits of detection were between 0.001 to 0.003 mg/L (i.e., 1 to 3 ppb).
Chromatographic separation of individual organic acids in mixtures at much higherconcentrations was demonstrated. Alcohol oxidase immobilized on diatomaceous earth
successfully oxidized methanol, ethanol, and n-propanol to the corresponding aldehyde.
Subsequent oxidation of aldehydes to organic acids over platinum catalysts supportedon zirconia and alumina was demonstrated; however, adsorption of organic acids by the
catalyst support degraded sensitivity and time response. Software was also developed
to digitize and store conductivity data, allowing analyte concentrations to be determined
from the stopped flow peak height. These results were disseminated at the AEMC PI
meeting, the 4th Life Support and Biosphere Scence Conference, the Bioastronautics
Investigators' Workshop, and on our Web site at http://www.umpqua-
research.com/oam.htm.
During the third year, a FIA configuration for the OAAM was developed which
allowed rapid and consistent data aquisition. In particular, the time required to reduce
background conductivity in the new OAAM configuration was reduced and simplified by
continuously flowing both carrier and analytical streams, and eliminating switching
valves. The sensitive quatitation of alcohols was accomplished with the development of
platinum catalysts supported on mesoporous silica. The open mesoporous structure of
these catalysts results in a high surface area and oxidation activity as well as a surface
charge that precludes strong adsorption of organic acids at intermediate pH values.
These catalysts quantitatively converted aldehydes to organic acids without significant
adsorption or memory effects. The determination of individual organic acids within a
matrix using conductiometric detection was a significant challenge, which centered
around the ability to chromatographically separate these species on a packed column
using water as the eluent. Separation of formic, acetic, and propionic acids was
accomplished using a HPLC column at concentrations above 200 pg/L; however, as the
concentration decreased further, the peaks associated with each acid tended to
coalesce. This version of the FIA OAAM was capable of quantifying formic, acetic, and
propionic acid concentrations individually between 5 p.g/L and 10 i_g/L (ppb), and
methanol, ethanol, and isopropanol concentrations between 20 l_g/L (ppb) and 100 p.g/L
(ppb). The time for each analysis depends on concentration, with the lowest
concentrations requiring -30 minutes.
URC 80985 5

The prototype OAAM is configured as an analyzer capable of evaluating WRS
sub-system performance and diagnosing potential problems. The attributes of this
technology for ISS operation include: 1) the capability to quantitate contaminants that
characterize operational performance of major WRS sub-systems; 2) the elimination of
hazardous reagents through the use of solid phase acidification; 3) minimization of
reagent preparation time through the use of solid phase reagents and catalytic
processes; 4) low dection limits and wide dynamic range; 5) rapid time response, and;
6) a high potential for expanding the list of analytes using many of the basic
components.18,19
URC 80985 6

2.0 MATERIALS AND EQUIPMENT
2.1 Chemicals.
Formic acid, acetic acid, propionic acid, drierite, alginic acid, proprionaldehyde,
hydrogen hexachloroplatinate(IV) (H2PtCI6.xH20), alcohol oxidase, cyanogen bromide
activated Sepharose 4B, tungsten trioxide,and molybdenum trioxide were purchased
from Sigma-Aldrich (Milwaukee, WI). Ethanol, methanol, and 1-propanol were
purchased from VWR Scientific Products (Seattle, WA).
2.2 Materials.
Celgard Xl0 400 microporous polypropylene hollow fibers were obtained from
Hoechst Celanese (Charlotte, NC). KPF 360A-12 and 190M microporous
polypropylene hollow fibers were obtained from Mitsubishi Rayon (New York, NY).
Silastic tubing was purchased from VVVR (Seattle, WA). Polyether Ether Ketone
(PEEK) fittings, ferrules, tubing, bypass valves, and flow injection valves were
purchased from Upchurch Scientific (Oak Harbor, WA). The Chromalox 2110
temperature controller was obtained from Valin Inc. (Bellevue, WA). Thermocouples
were acquired from Omega Engineering Inc. (Stamford, CT). A 35.3 W, silicone
coated, adhesive backed, circular heating element was purchased from McMaster-Carr
(Los Angeles, CA) The Masterflex Console Drive peristaltic pump, 06485-13 peristatic
pump tubing, gas flowmeter (No. 23-19), and Model 1054 conductivity bridge were
purchased from Cole Parmer (Vernon Hills, IL). A Model 515 conductivity cell was
purchased from Amber Science (Eugene, OR). PTFE (Teflon ®) tubing was purchased
from Jensen Inert Products (Miami FL). Strong acid, IRN-77, and mixed ion exchange
IRN-150 resins were purchased from Rohm and Haas.(Philadelphia, PA). High surface
area ZrO2 (XZ 16075 and XZ. 16052 at 51 and 90 m2/g respectively), TiO2 (XT 25384
and XT 25376 at 37 and 150 m2/g, respectively), and SiO 2 (XS 16080 at 144 m2/g)
catalyst supports were purchased from Norton Chemical Process Products Corporation
(Akron, OH). Celite 560 diatomaceous earth was obtained from Manville Specialty
Products Group (Denver, CO). High surface area AI203 supports, spherical samples
KA 275 and K 210, were donated by Condea Chemie (Houston, TX). CARiACT Q-6
silica gel was obtained from Fuji Silysia Chemical Ltd. (Portland, OR). PEEK end
fittings 7.5 mm PEEK columns (100 and 150 mm) and 4.6 mm PEEK lined stainless
steel columns were purchased from AIItech (Deerfield, IL). Silicone filled silicone epoxy
(RTV630A) was purchased from GE Silicone (Wterford, NY). Activated carbon 580-26
URC 80985 7

was purchased from Barnebey Sutcliffe Corporation (Columbus, OH). Platinum tubing
was obtained fom Goodfellow (Berwyn, PA). Teflon ® and nylon unions and ferrules
were purchased from Eugene Valve and Fitting (Eugene, OR). The fast fruit juice
HPLC column (Part Number 10639) was obtained from Waters Chromatography
Division (Milford, MA).
2.3 Analytical Equipment.
Aqueous concentrations of methanol, ethanol, propanol, formaldehyde,
acetaldehyde, and propionaldehyde were detemined using an HP Model 5710A Gas
Chromatograph with an FID detector and an SP1000 column The platinic acid
concentration in solution was monitored using an HP 8452A diode array
spectrophotometer. TOC determinations were made using an OI Analytical Model 1010
Wet Oxidation Total Organic Carbon (TOC) Analyzer.
2.4 Computer Hardware and Software.
LabVIEW TM software was purchased from National Instruments (Austin, TX).
Analogue to digital I/O boards were obtained from Access I/O Products Inc. (San Diego,
CA).
URC 80985 8

3.0 EXPERIMENTAL SECTION
3.1 Solid Phase Acidification Module (SPAM).
Reproducible acidification of organic acid containing samples is a fundamental
process in the sequence of steps that separates interfering acid gases such as carbon
dioxide from the sample, and then transfers the organic acids to a low conductivity
analytical stream to eliminate background conductivity and matrix effects. The attributes
of in-line beds containing solid phase media include simplicity, ease of use, and the
elimination of corrosive liquid reagents. The first solid phase media investigated was
molybdenum trioxide, MoO 3, which dissolves according to (1), forming a weak diprotic
acid which releases hydrogen ions via a two step dissociation.
MoO 3 + H20 -_ H2MoO 4 (1)
In deionized water, an equilibrium pH of 2.5 is attained; however, in flow-through beds
pH values between 3 and 3.2 are achieved. As indicated by the dissociation equilibria
and pK a values shown in (2) through (5) for formic acid, acetic acid, propionic, and
carbonic acids, respectively, at this pH, most of the common volatile organic acids will
exist predominately in the volatile undissociated form at a pH obetween 3 and 3.2,
allowing transfer across the microporous membrane in the organic acid transfer module
K1 HHCO 2 +H ÷*--_-*HCO2 (g) $ PK1= 3.75 (2)
CH3CO2 +H + .. K2 ;CH3CO2H(g)$ pK2=4.75 (3)
CH3CH2CO 2 +H ÷ _ K3 ; CH3CH2CO2H(g )T pK 3 = 4.87 (4)
H÷ +HCO_ ." K, ._CO2(g)T+H20 PK4=6.37 (5)
(OATM). However since the pH due to solid phase media such as MoO 3 is unbuffered,
the transfer efficiency across the OATM for all organic acids over a range of
concentrations would benefit from a lower initial pH value. By lowering the initial pH,
the pH is less affected by the loss of protons due to recombination with the organic acid
anion and subsequent volatilization of the organic acid.
Several possible avenues to achieve a lower pH in SPAM effluents were
investigated, including: improving the MoO 3 media, utilizing other solid phase media,
and using a combination of solid phase media and ion exchange (IX) resins. Although
URC 80985 9

increased contact times would minimize the pH from the MoO 3 media, very long contact
times were required to reach equilibrium pH values in practice. As an alternative, non-
stoichiometric MOO3_ x was prepared to increase the dissolution rate and lower the
effluent pH for shorter contact times. Second, higher surface area MoO 3, WO 3, and
HBO 2 particles were encapsulated in alginate beads providing alternative acidification
media and improving dissolution rates. Finally, sequential beds of a soluble divalent
salt and a strong acid cation exchange resin were incorporated into a composite SPAM
which utilized the higher solubility of the soluble divalent cation to exchange for
hydrogen ions in the IX bed and produce a lower pH.
These attempts to improve SPAM performance were unsuccessful with one
major exception. A variety of non-stoichiometric MOO3_x samples were produced with x
depending on thermal treatment and oxygen partial pressure. In more strongly reduced
samples, solubility decreased, while in less reduced samples, solubility increased. In
general, the pH values produced by these materials were equal to or higher than those
of stoichiometric MoO 3. Encapsulation of MoO 3 in alginate beads was a minor success
since it allowed the use of very fine MoO 3 powder within the SPAM without producing
excessive backpressure. The powder was first mixed with alginic acid and then
droplets of this supension were extruded through a syringe needle and allowed to fall
into a solution containing divalent cations such as Ca 2÷, Sr 2+, and Ba 2+. The droplets
gelled into spherical beads as a polymeric structure formed between alginate
monomers. Of the divalent cations, only beads formed with Ba 2÷ remained
dimensionally stable as cations leached from the beads. Beds of this material
produced higher pH values than the crystalline MoO 3 containing SPAM, most probably
due to poor exchange of MoO 3 with interstitial water. The final novel SPAM media
consisted of sequential beds containing a soluble divalent salt and a strong acid cation
exchange resin.
This approach produced much lower pH than previous SPAM beds, since the pH
depended on the solubility of the first bed which could be adjusted by selection of the
appropriate salt. In the most successful modification, the first bed contained CaSO 4
(i.e., hydrated Drierite ®) which dissolves according to (6). The solubility product for
CaSO4 at 25°C is also given in (6). Dissolution of this salt releases Ca 2÷ which then
CaSO4 -" K,0 >Ca2+ + SO_ K,p = [Ca 2+][SOj,] = 2.45x10 -_ (6)
U RC 80985 10
enters into the strong acid cation exchange resin bed which is in the hydrogen ion form.
The Ca2÷ quantitatively displaces two H÷ ions, creating a strong acid whose
concentration is dependent on the solubility of the salt. Based upon the solubility
product of anydrous CaSO4at 25°C, a pH of 2.0 should be produced; however, based
upon the solubility of CaSO4,2H20 (i.e., gypsum) a pH of 1.55 should be produced. A
composite SPAM with the first bed filled with CaSO4 particles between 300 to 990 p.mindiameter and the second bed filled with hydrogen form strong acid cation exchange
resin produced an effluent pH of 1.74. This is a significant improvement over the pH
attainable using MoO3crystalline particles, and was adopted as the preferred SPAM forthe OAAM.
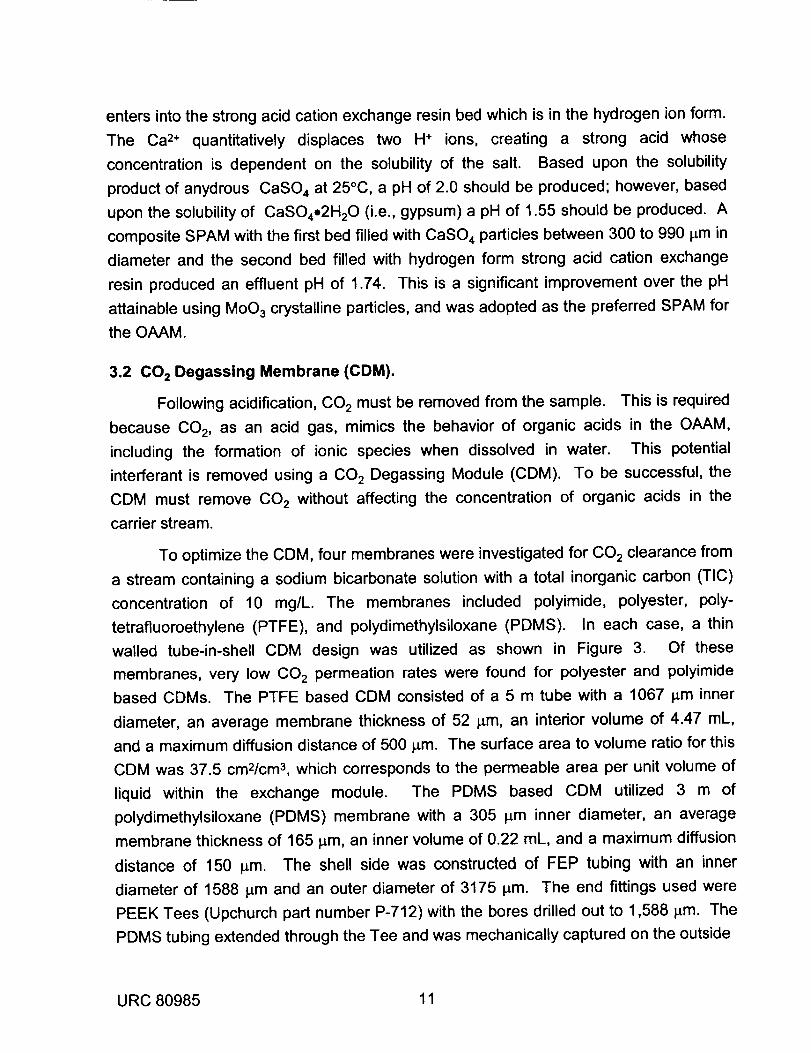
3.2 CO2 Degassing Membrane (CDM).
Following acidification, CO 2 must be removed from the sample. This is required
because CO 2, as an acid gas, mimics the behavior of organic acids in the OAAM,
including the formation of ionic species when dissolved in water. This potential
interferant is removed using a CO 2 Degassing Module (CDM). To be successful, the
CDM must remove CO 2 without affecting the concentration of organic acids in the
carrier stream.
To optimize the CDM, four membranes were investigated for CO 2 clearance from
a stream containing a sodium bicarbonate solution with a total inorganic carbon (TIC)
concentration of 10 mg/L. The membranes included polyimide, polyester, poly-
tetrafluoroethylene (PTFE), and polydimethylsiloxane (PDMS). In each case, a thin
walled tube-in-shell CDM design was utilized as shown in Figure 3. Of these
membranes, very low CO 2 permeation rates were found for polyester and polyimide
based CDMs. The PTFE based CDM consisted of a 5 m tube with a 1067 p.m inner
diameter, an average membrane thickness of 52 I_m, an interior volume of 4.47 mL,
and a maximum diffusion distance of 500 p.m. The surface area to volume ratio for this
CDM was 37.5 cm2/cm 3, which corresponds to the permeable area per unit volume of
liquid within the exchange module. The PDMS based CDM utilized 3 m of
polydimethylsiloxane (PDMS) membrane with a 305 p.m inner diameter, an average
membrane thickness of 165 p.m, an inner volume of 0.22 mL, and a maximum diffusion
distance of 150 l_m. The shell side was constructed of FEP tubing with an inner
diameter of 1588 p.m and an outer diameter of 3175 p.m. The end fittings used were
PEEK Tees (Upchurch part number P-712) with the bores drilled out to 1,588 I_m. The
PDMS tubing extended through the Tee and was mechanically captured on the outside
URC 80985 11

Shell Side Outlet Shell Side Inlet
PEEK Tee_l
TubeIII1_
Tube_z_:::'_Outlet
Figure 3. Tube-in-Shell Counter-Current Gas Transfer Module.
junction of the Tee with a compression fitting around the 1588 p.m PTFE tubing
connection. The PDMS tubing was encased in a single section of PTFE tubing that
better matched the inner diameter of the PTFE tubing. A semi-rigid section of polyimide
tubing 394 I_m in diameter was placed within the PDMS tubing to support the PDMS
elastomer when compressed. This CDM design allowed rapid assembly and effective
sealing. The surface area to volume ratio in this CDM was 131.1 cm2/cm 3.
3.3 Organic Acid Transfer Module (OATM).
The Organic Acid Transfer Module (OATM) utilizes a tube-in-shell counter-
current design similar to that of the CDM. In the OATM, the analytical stream is
contained within a central microporous polypropylene hollow fiber membrane, while the
degassed sample flows between the microporous hollow fiber and the stainless steel
shell. The 2.0 m OATM consists of a central hollow fiber membrane with outer
diameter of 355 l_m and an inner diameter of 300 i_m. This surface porosity of this
membrane varies between 45 and 50%, and the average pore size is 0.05 I_m, which
corresponds to a bubble point (i.e., the pressure required to force water through the
membrane) of 12.1 atm (1.23 MPa). The end fittings on the OATM consist of PEEK
Tees similar to those used in the CDM, except that the bores were drilled out to 1016 !_
m. The microporous hollow fiber extends through the Tee and into a short section of
PEEK tubing 1575 l_m in diameter. This hollow fiber was potted inside this outer
URC 80985 12

section of tubing using silicone epoxy (RTV630A). The shell side is constructed of
PEEK tubing with an inner diameter of 762 p.m and an outer diameter of 1588 l_m. The
surface area to volume ratio for the OATM is 133.3 cm2/cm 3 with an internal volume of
141 pL.
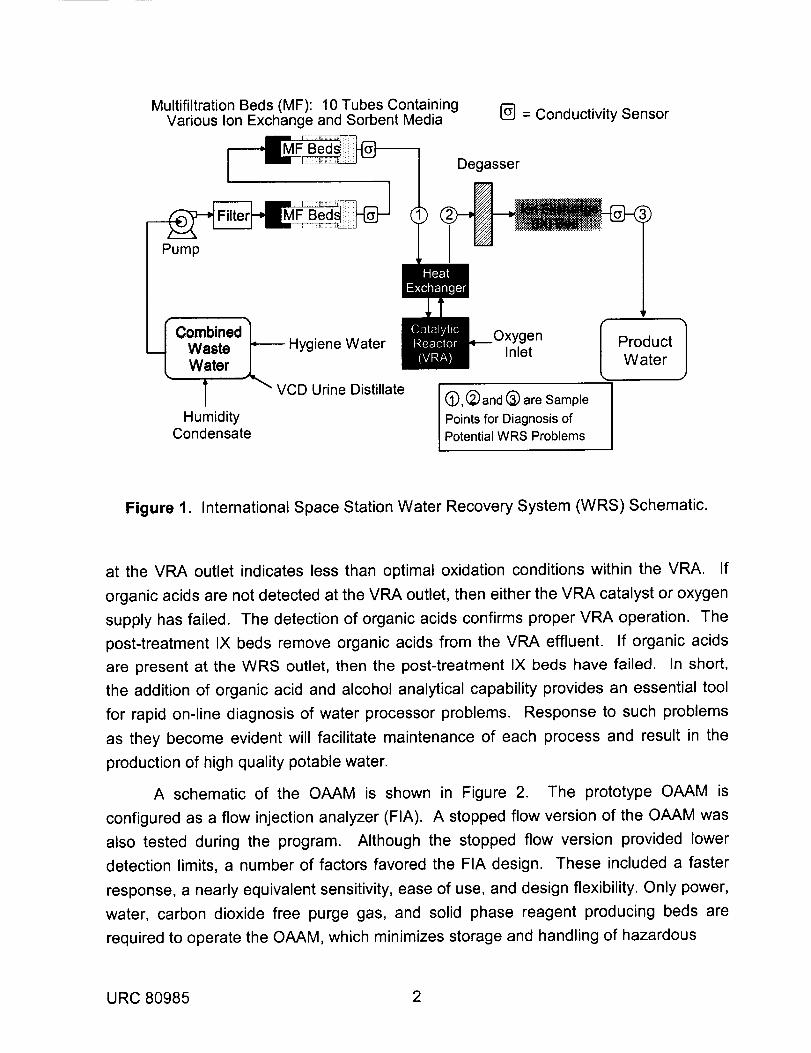
3.4 Modified Conductivity Detector.
The Model 515 flow through micro-conductivity cell was modified to reduce the
background conductivity at low flows. The 1/16 inch (i.e., 1.59 mm) outside diameter
stainless steel inlet and outlet tubing to the flow through cell were replaced with 2 mm
outside diameter platinum tubing. The inside diameters for the stainless steel and
platinum tubing were 1.1 and 1.6 mm, respectively. This modification significantly
reduced the background due to stainless steel corrosion. The cell constant for the new
cell was 5.19 compared to 5.73 for the stainless steel cell. This cell is shown in Figure
4. The active volume of this cell is 7 I_L.
Outlet
Electrode Plates-
Delrin Spacer
.=f
J/
Metal Shield to Screen
Stray Capacitance
PlatinumTube/Electrode
7 uL Active VolumeThermistor
Inlet
Figure 4. Modified Flow Through Model 515 Micro-Conductivity Cell.
3.5 Immobilization of Alcohol Oxidase.
The quantitation of primary alcohols such as methanol, ethanol, or 1-propanol
using the OAAM requires that the alcohol must first be converted to an organic acid.
This may be accomplished at ambient temperature using a two step oxidation process.
URC 80985 13

The first step utilizes an enzyme, alcohol oxidase (AO), that has been immobilized on a
solid support. This enzyme catalyzes the reaction between dissolved oxygen and
primary alcohols to form the corresponding aldehyde and hydrogen peroxide. In the
second step, aldehydes are oxidized to the corresponding organic acid over a
heterogeneous catalyst using dissolved oxygen as the oxidant. For these two
processes to be successfully applied in the OAAM, the oxidation reactions must occur
rapidly at ambient temperature, and the reaction by-products must be rapidly released
to the carrier stream. Slow reactions or retention of the aldehyde or organic acid by-
products by the immobilized enzyme or the supported catalyst will lead to peak
broadening, poor sensitivity, and slow response times.
AO was immobilized onto two supports, diatomaceous earth and agarose.
Diatomaceous earth is a structured natural product of diatoms which consists primarily
of SiO 2 with minor amounts of clay consisting of Na, K, Mg, and AI containing silicates.
Agarose is another natural product consisting of chemically modified, crosslinked
polysaccharrides derived from seaweed. Different immobilization procedures were
used for these two supports. For diatomaceous earth, the titanium activation procedure
was used, while for agarose, a cyanogen bromide activation process was employed. In
addition to oxidation rates, enzyme life and release of aldehyde and/or organic acid
reaction byproducts were two issues of concern during the development of immobilized
enzyme beds. The diatomaceous earth support was impregnated with platinum catalytic
sites to decompose the hydrogen peroxide formed by action of the oxidase enzyme on
primary alcohols. 15,1T This was intended to extend the AO enzyme life by preventing
denaturing reactions with the hydrogen peroxide.
The reaction scheme for immobilization of AO on diatomaceous earth using the
titanium activation procedure is shown in Figure 5.15,17 In this procedure, surface
hydroxyls are first linked to titanium chloride. To achieve this linkage, diatomaceous
earth is immersed in a 15 % titanium oxychloride solution (in 10% HCI) which is then
evaporated to dryness over several hours at 45°C. The titanium linked support is then
washed with methanol and dried. Next, the titanium bound chlorines are reacted with
ethylenediamine to create a surface coating with terminal primary amine functional
groups. This is accomplished by immersion of the titanium activated diatomaceous
earth in a 5 % ethylenediamine solution in carbon tetrachloride at 45°C for two hours.
The diatomaceous earth is then washed with methanol and dried. The terminal amine
groups provide sites for the Schiff base addition of a dialdehyde. This addition is
accomplished by rolling the diatomaceous earth in a 5% glutaraldehyde solution in a pH
URC 80985 14

7.5 phosphate buffer overnight. The diatomaceous earth is then rinsed with distilled
water. At this point, terminal aldehyde groups are available for a second Schiff base
addition to terminal amino groups on alcohol oxidase. In the final step, 1000 EU of
alcohol oxidase per gram of diatomaceous earth is dissolved in a pH 7.5 phosphate
buffer, and the mixture is rolled overnight at ambient temperature.
a)
b)
--" ) _Ti
-H_O )--0 _cl
HCCH2CH2CH2CH
-H20
Glutaraldehyde
H2N--AO
c)-H20
Alcohol Oxidase
H2N--R--_NH2 _>---O_Ti jN_-R-NH2
-HCl _-_O j _I--R--NH2Diamine H
O_ jN--R--N=CCH2CH2CH2C--H
0 j Ti_]_-- R--N=_CH2CH2CH2_-- H
H H O
O_ /N--R--N=CCH2CHtCH2C'=N--AO
0 / Ti""]_ -- R--N =_CH2CH2CH2_-_N -- AO
H H H
Figure 5. Titanium Activation Method for Immobilization of Alcohol Oxidase.
Alcohol oxidase was also immobilized on agarose using cyanogen bromide
activation. The general procedure is shown in Figure 6. To simplify the immobilization,
cyanogen bromide activated agarose beads were purchased. The cyanogen bromide
activated beads were first hydrated in 10 mM HCI for 15 min at ambient temperature.
They were then washed with distilled water and bicarbonate buffer (pH 8.3). One gram
of the swollen beads was added to 1000 EU of alcohol oxidase in the pH 8.3
bicarbonate buffer. This mixture was placed in a test tube and rotated at 4 °C
overnight. The preferred immobilization structure from Figure 6 is the substituted
imidocarbonate, due to stability and the absence of residual charge; however, an
isourea derivative may also form. The substituted imidocarbonate structure is
promoted by the selection of reaction conditions. After rinsing the resin with buffer,
URC 80985 15

agarose
(.<<<
<--OH<<<
< I__OHS>>>
agarose cyanate cyclicester imidocarbonate
NaOH O" CNBr
OH
OONIOoNHl ON
alcohol oxidase AO--NH2 AM-NH2
I ,NH2+
O---_--C...AO
OH
isourea derivative
or
substituted imidocarbonate
Figure 6. Immobilization of Alcohol Oxidase on Cyanogen Bromide Activated Agarose.
unreacted surface groups were blocked by adding a high concentration of
ethanolamine. The mixture was agitated in a tube rotator at ambient temperature for 2
hours. This reduces multiple bonds to terminal amino groups on the enzyme. Four
rinse cycles with pH 8.3 borate buffer and pH 4 acetate buffer were used to remove
excess reagents.
3.6 Preparation of Improved Oxidation Catalyst Supports.
The preliminary investigation of the conductiometric response for organic acids
produced from alcohol oxidation using sequential beds of alcohol oxidase immobilized
on diatomaceous earth and platinum catalysts impregnated on various supports
produced flow injection peaks that were broadened, and at low concentrations, spread
out to the point where they were undetectable. This was attributed to organic acid
URC 80985 16

adsorption on the materials used to support the noble metal catalyst. Significantly,
adsorption was traced to hydrogen bonding between the organic acid anions and the
positively charged, protonated surface of the support. A brief description of the
relationship between surface charge and oxide surfaces will clarify this conclusion.
3.6.1 Surface Charge and Organic Acid Adsorption.
When a solid contacts water, an electric potential difference develops at the
interface due to a number of mechanisms, including the affinity of ions and electrons for
the two phases, the ionization of surface groups, and the physical entrapment of non-
mobile charge. 20 Associated with this electric potential difference is the development of
a double layer in which surface charge is compensated by a distribution of counter ions
in solution. 21-23 The electric potential that develops between charges firmly bound to
the surface and ions that are free to move in solution is called the zeta potential. The
zeta potential is a measureable quantity that reflects the charge that develops on a
surface immersed in a solution. For oxides in aqueous solutions, the zeta potential
varies strongly with pH due to protonation and deprotonation reactions with the surface.
For each oxide, the zeta potential may be reduced to zero by adjustment of pH. The
pH at which a zero surface charge is reached is called the isoelectric point (IEP). At a
pH above the IEP, the zeta potential is negative and the surface is negatively charged.
At a pH below the IEP, the zeta potential is positive and the surface is positively
charged. IEP values for common oxide surfaces are shown in Table 1.24
A positive zeta potential will attract organic acid anions, and if the positive
surface charge is due to hydrogen ions, hydrogen bonding can occur. Accordingly, a
catalyst support should preferably exhibit a negative zeta potential or at the very least a
neutral zeta potential at the pH of the alcohol oxidase bed effluent. Of the oxides listed
in Table 1, SiO 2 will naturally repell, while AI20 3 will naturally attract organic acid anions
at the nominal 5.8 pH downstream of the alcohol oxidase bed. The properties of oxides
such as ZrO 2 or TiO 2 are less clear. Consequently, SiO 2 was the focal point of the
search for a more effective catalyst support without a strong affinity for organic acids.
Other properties of the ideal silica support include high surface area, porosity
characterized by low pore diffusion resistance, and means to homogeneously
impregnate the support surface with small, highly active noble metal catalyst nuclei.
U RC 80985 17

Table 1. Isoelectric Points for Common Oxides.
Material
M90NiO
La20._CuOZnO
c_-AI20,_
Cr20._CeO 2
Fe,_O4
3AI20,_o2SiO 2BaTiO,_
TiO2
ZrO 2MnO 2
SiO_ (amorphous)
Isoelectric Point (IEP)
pH12.4
10-1110.4
9.5
98-9
7.06.7
6.56-8
5-6
4-64-6
4.0-4.52-3
3.6.2 Silica Mesocellular Foams (MCFs).
Silica Mesocellular Foams (MCFs) are a new class of sol-gel prepared materials
that exhibit many of the properties expected for an ideal silica support. These include
high surface area, three dimensional interconnected mesoporosity of uniform size
between 20 and 30 nanometers, and high fractional porosity. Monolithic pieces of
MCFs which would be suitable as a catalyst support were prepared using an adaptation
of previously developed methods for the synthesis of MCF particles. 25-27 The basic
approach utilized an acidic hydrolysis of tetraethyl orthosilicate (TEOS) in the presence
of a surfactant and swelling agent to self-assemble into a three dimensional
interconnected structure. The three dimensional surfactant - swelling agent structure
serves as template for the sol-gel formation of the silica network that forms the MCF.
The non-ionic surfactant is an amphiphilic block copolymer (i.e., P123 or EO20-PO_0-
EO20 where EO = ethylene oxide and PO = propylene oxide) that contains hydrophilic
(i.e., poly(ethylene oxide) blocks) and hydrophobic regions (i.e., poly(propylene oxide)
blocks). The swelling agent, 1,3,5-trimethyl benzene (TMB), is attracted to the
poly(propylene oxide) regions of the surfactant, initially forming an oil-in-water
microemulsion and effectively increasing the size of the hydrophobic region. When
mixed together at the appropriate temperature, TMB, P123, and acidified water will self-
URC 80985 18

assemble into a three dimensional interconnected structure.28,29 Water surrounds
these cores and fills the interconnected channels with the phase assembly representing
the thermodynamically most favorable structure for each composition and temperature.
The preparation of an MCF begins with the dissolution of P123 in an HCI solution
at room temperature. TMB is then added under vigorous magnetic stirring until a
homogeneous, opalescent microemulsion is formed. The solution is heated to 37 - 40 °C and stirred for an additional 30 minutes. TEOS is added to the microemulsion with
continuous stirring at temperatures between 35° and 60°C. This begins the TEOS
hydrolysis process shown in (7). First a sol is formed, and as the silica network grows,
nSi(OCH2CH3 )4 + 2nH20 -_ nSiO2 + 4nCH3CH2OH (7).
eventually the viscosity increases and a gel is formed. The newly formed colloidal sols
are amorphous and protonated under acidic conditions. 3°-33 Due to the amphiphilic
surfactant, the positively charged silica sol preferentially associates with the hydrophilic
EO outward facing component of the microemulsion. 28-31 A continuous network of
silicon oxygen bonds begins to cover the three dimensional surfactant - swelling agent
structure. The silica network continues to expand and intergrow, forming a three
dimensional structure surrounding the surfactant swelling agent structure. This
surfactant structure will eventually form the pores and interconnected channels in the
MCF. After 20 hours at the lower temperatue, the mixture is heated to 80°-120°C and
aged for an additional 20 hours in an autoclave. The silica network is incompletely
formed at the lower temperature, and by raising the temperature additional
interconnections are made and the network matures. At the same time, the size of the
hydrophobic surfactant - swelling agent cores increase due to interfacial tension. 30 The
combination of silica network maturation and swelling cores leads to larger pores. The
overall process results in well formed MCF with large pores. By a combination of
network expansion and intergrowth, larger MCF aggregates form.
In the synthesis procedure described in the literature for the preparation of MCF
particles, 4.4 g of TEOS was added to the structured mixture of P123, TMB, and
acidified water which was then stirred for 20 hours at 37 - 40°C. Under these
conditions, MCF particles and aggregated particles are formed; however, these are
limited in size due to the availability of reactants and the concentration of surfactant and
swelling agent (i.e., TMB). To prepare a continuous monolithic intergrown MCF
structure, the concentration of the three major components, P123, TMB, and TEOS
URC 80985 19

must be sufficient to allow continuous intergrowth of MCF islands. In the standard
monolithic MCF formulation, 6 g of P123 and 6 g of TMB were added to 75 mL of 1.6 M
HCI. As in the formation of individual MCF particles, this solution was heated to 37 - 40
°C for 30 minutes and then 13.2 g of TEOS was added. This solution was mixed for 5
to 60 minutes and then allow to sit undisturbed, which promotes the formation of a
continuous gel. This gel was then autoclaved at temperatures between 115 and 120°C
for an additional 20 hours to mature the MCF. The green MCF contains entrained P123
and TMB. Some of this is removed by washing with deionized water. The green MCF
is dried at 50°C. Some shrinkage occurs during drying, resulting in the formation of
cracks within the monolith. This is minimized by slow drying and lower temperatures.
These pieces were then heated in air to temperatures between 450 and 700°C to
remove P123 and TMB, and consolidate the silica network. Temperatures in excess of
500°C resulted in white, char free monolithic SiO 2 pieces. These pieces exhibited very
low density and were almost translucent in appearance.
A range of compositions and initial synthesis temperatures were evaluated
following the same general preparation scheme. The compositional variables included
the P123 to TMB ratio, the concentration of P123 and TMB, the relative amount of
TEOS, and the presence of ammonium fluoride, NH4F. The use of ammonium fluoride
is designed to promote maturation of the silica network, since it increases silica
solubility. The use of ammonium fluoride generally produced more readily gelled and
mechanically strong MCFs. Two compositions were selected for catalyst preparation.
The first preparation utilized 6 g of P123, 6 g of TMB, and 13.2 g of TEOS processed at
37°-40°C for 20 hours, and then at 115°C for 20 hours. The second preparation utilized
12 g of P123, 12 g of TMB, 26.4 g of TEOS, and 0.023 g of NH4F processed at 370-40 °
C for 20 hours, and then at 115°C for 20 hours.
3.7 Preparation of Oxidation Catalysts on MCF Supports.
Selected MCFs were impregnated with platinum salts in solutions designed to
utilize the MCF surface charge to promote homogeneous adsorption of the noble metal
species. Initial investigations utilized 2.0% platinum by weight of the support. The
surface charge of silica as a function of pH is shown in Figure 7. These data show that
below a pH of -2.4 the surface of silica becomes positively charged due to protonated
surface sites. Above this pH, the surface becomes progressively more negatively
charged until all surface sites become deprotonated. At a pH of 2.4, the isoelectric
point, the surface becomes uncharged. The surface charge strongly influences
URC 80985 20

adsorption of the platinum ionic species, etc[6 "2. Since it is a weak acid, a platinic acid
solution will have a pH close to the isoelectric point for amorphous silica, and platinum
will not strongly adsorb. One can acidify this solution; however, changes in the ionic
strength resulting from the introduction of chloride, sulfate, or nitrate counter-ions will
change the isoelectric point, and hence, will affect the adsorption of the
hexachloroplatinate anion.
2O
15
..--. 10>E
v 5
om
(-0
OQ_
-5
Q)
N -10
-15
-2O
-- zeta potential for SiO 2
point
chargedsurface
0 1 2 3 4 5 6 7 8
pH
Figure 7. Zeta Potential for Amorphous Silica.
A successful approach to improve surface adsorption involved the addition of
hydrogen hexachloroplatinate (H2PtCIs.xH20) to a 0.1 M ethylenediamine solution.
Ethylenediamine, H2N(CH2)2NH 2, is a strongly alkaline diamine which in an aqueous
solution will form a monoprotonated, H2N(CH2)2NH3*, or diprotonated amine,
+H3N(CH2)2NH3 ÷, depending on concentration. The PKal and PKa2 for ethylenediamine
are 10.71 and 7.56, respectively, meaning that at a pH of 10.71 an equal concentration
of unprotenated and monoprotenated ethylenediamine species exist, while at a pH of
7.56, an equal concentration of diprotonated and monoprotonated ethylenediamine
species exist as shown in (8) and (9).
URC 80985 21

[H2N(CH2)2NH2][H+ ] = 10 -'°'1 (8)H2N(CH2)2NH_ _-_ H2N(CH2)2NH2 +H + Kal-[H2N(CH2)2NH_]
*H3N(CH2)2NH _ _-) H2N(CH2)2NH:_ +H+ Ka2 = [H2N(CH2)2NH_][ H÷ ] = 10 -7._[÷H3N(CH2)2NH_]
(9)
Since the pH of a 0.1 M ethylenediamine solution is 11, these equilibria are significant,
with respect to the adsorption of platinum from this solution, in two ways. In the first
place, the highly alkaline pH insures that the surface charge of amorphous silica will be
strongly negative. Secondly, most of the amine will be unprotonated. Ethylenediamine
(ED) is known to complex Pt(IV), forming Pt(ED)2CI22*,34 and since the complex is
positively charged, it will be strongly sorbed by amorphous silica at this pH. MCF silicas
were immersed in this solution and heated to temperatures between 50 ° and 110°C.
These solutions quickly discolored (i.e., yellow to clear) as shown by the UV-VIS
spectrum in Figure 8, indicating rapid incorporation of the platinum complex. When
these amorphous silicas were fired under reducing conditions, homogeneity was
retained as evidenced by uniform coloration.
3.8 Evaluation of Oxidation Catalysts Performance.
Oxidation catalysts consisting of 2 % platinum on an MCF support were
evaluated using the test stand shown in Figure 9. In this arrangement, a plug flow
reactor containing the catalyst bed was challenged with an aqueous stream containing
propionaldehye at ambient temperature. Under controlled flow conditions, the effluent
concentration of the contaminant was determined as a function of contact time by gas
chromatography using an SP 1000 column, a FID detector, and a column temperature
of 60°C. These data were then reported as fractional conversions.
Global oxidation rates were determined using pseudo first order plug flow
kinetics. This model provided a practical approach for gathering and comparing
catalysts without detailed knowledge of the reaction mechanism. Since the oxidation of
propionaldehyde involves dissolved oxygen and propionaldehyde, the presence of a
large oxygen excess eliminates the O2(aq) concentration term from the rate expression
given by,
URC 80985 22

3.5
3.0
2.5
O¢- 2.0
.Q
0t_ 1.5.Q<
1.0
0.5
Figure 8.
\\\"='
1: time = 02: time = 180
3: time = 12604: time = 27155:0.1 M Ethylenediamine6:0.1 M EthylenediamineplusPlatinicAcid
200 250 300 350 400 450 500 550 600 650 700 750 800
Wavelength (nm)
UV-VlS Spectra from Ethylenediamine Solution Containing Platinic Acid.
Figure 9. Flow Test Apparatus: 1- Oxygen Sparger, 2- Influent Reservoir, 3- Pump, 4-
Pressure Transducers, 5- Plug Flow Catalyst Bed, and 6- Effluent Reservoir.
URC 80985 23

dC
d-T = kC°2CA (10).
Since the O2(aq ) concentration term is constant, it is incorporated into the rate constant
and following integration the pseudo first order dependency shown in (11 ) results,
C=Co e-kt (11),
where C is the outlet organic contaminant concentration, CO is the inlet organic
contaminant concentration, k is the pseudo first order reaction rate constant in s-1, and t
is the residence time within the reactor (i.e., reactor space time). The value of t
depends on the void volume, Vr,, within the catalyst bed, and the flow rate, Q. The
reactor space-time, t, is determined according to (12),
t- V,q_ (12),Q
where dpis the fractional void volume of the packed catalyst bed and Vr is the reactor
volume. When the fractional void volume is not known, the empty bed volume is used
in place of the fractional void volume and d_becomes 1. Plug flow conditions were
validated based on flow rates, reactor length, and catalyst particle size. Rate constants
(k) for the first order plug flow rate law were derived from the resulting (C, t) ordered
pairs using the Levenberg-Marquardt method. 35 Correlation coefficients (r2) for the
derived rate constants were calculated using a linear regression of experimentally
observed concentrations versus those calculated from (11).
3.9 Separation of Organic Acids.
The ability to separate organic acids in the analytical stream is a prerequisite for
the quantitation of individual organic acids in mixtures. Preliminary work toward this
end yielded positive results. A 200 mg/L mixture of formic, acetic, and propionic acids
in unbuffered deionized water was fed to a column containing strong acid cation
exchange resin in the hydrogen ion form. The absorbance of the effluent at 204 nm
was then monitored versus time in a 1 cm path length cell. The resulting chromatogram
shown in Figure 10 indicates that the three primary organic acids are separable in a low
ionic strength aqueous solution using water as the mobile phase. Adjustment of the
ionic strength and pH of the mobile phase by the addition of 0.1, 0.05, and 0.001%
phosporic acid had little affect on the chromotograms for individual organic acids. The
mobilities roughly correlate with the relative fraction of each species that is ionized in
water. Although these preliminary experiments utilized high concentrations of organic
URC 80985 24

acids due to low absorbance sensitivity, this approach indicates one method that can
be utilized in future work to discriminate between organic acids in mixtures.
0.040
0.035
E¢" 0.030
O0.025
@(:D 0.020
=o0.015
<0.005
0.000
I I
Formic Acetic PropionicAcid Acid Acid
0 100 200
A i I i ¢ i i
300 400
Time (seconds)
Figure 10. Separation of Organic Acids on Ion Exchange
Column with Water as the Mobile Phase.
URC 80985 25
4.0 DEVELOPMENT OF OAAM COMPONENTS AND OAAM PROTOTYPE.
4.1 Solid Phase Acidification Module (SPAM) Performance.
Control of the pH in the carrier stream of the OAAM controls two vital functions,
the removal of the CO 2, an acid gas which mimics the behavior of organic acids, and
consequently, will interfere with their quantitation, and the segregation of organic acids
away from other ionic constituents in the sample by transfer to the analytical stream.
To provide similar levels of transfer for different organic acids, the pH must be
sufficiently low that the various organic acids are in the volatile non-dissociated forms.
Initially, the utilization of MoO 3 media in the SPAM produced pH values between 3 and
3.2. This was somewhat less acidic than the expected value of 2.5 for equilibrium
dissolution of MOO3; however since dissolution kinetics were involved, it was
explainable. To improve the rate of MoO 3 dissolution, several approaches were
evaluated. First, substoichiometric MoO z was prepared to increase solubility and
dissolution rate; however, slightly reduced MoO 3 produced similar pHs to those of fully
oxidized MoO 3. Next, fine MoO 3 particles were captured within alginate beads in an
attempt to increase solubility and dissolution rate through increased surface area.
However, pH values remained in the 3.0 to 3.2 range. A comparison of the attainable
pH values with MoO 3 with the dissociation constants for formic, acetic, and propionic
anions indicated that unequal protonation would occur and significant differences in
membrane transport would apply. Consequently, an alternative solid phase
acidification approach was investigated.
An innovative usage of a sparingly soluble salt in combination with a strong acid
cation exchange resin in the hydrogen form proved capable of significantly lowering the
achievable pH using solid phase media. Sequential beds of CaSO 4 and a strong acid
ion exchange resin lowered the effluent pH to 1.74 using a pure water feed. The
dissolution of CaSO 4 releases Ca 2. which then displace hydrogen ions from the strong
acid cation exchange resin. Since each Ca 2+ ion quantitatively displaces two H* ions,
the achievable SPAM pH depends only on the salt solubility and CaSO 4 dissolution
kinetics. At this pH, the transfer of different organic acids across the OATM proceeded
much more equally than when using the previous SPAMs.
4.2 CDM Performance.
The CDM membranes that
polytetrafluoroethylene (PTFE), and
membranes were andpolyimide
were tested included polyimide, polyester,
polydimethylsiloxane (PDMS). The thinnest
polyester with thicknesses of 6.4 and 19 i_m,
URC 80985 26
respectively. These membranes displayed very poor CO 2 permeation even at
temperatures as high as 96 °C in the case of polyimide tubing. Only PTFE and PDMS
tubing exhibited significant CO 2 permeability in these tests.
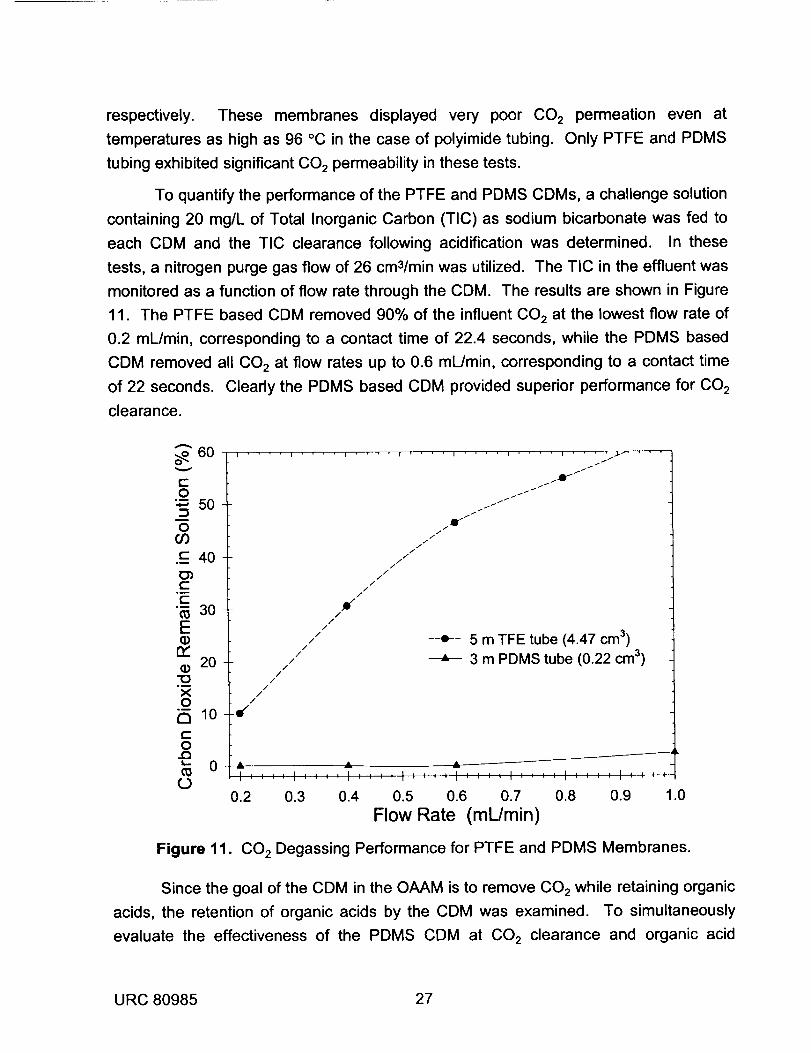
To quantify the performance of the PTFE and PDMS CDMs, a challenge solution
containing 20 mg/L of Total Inorganic Carbon (TIC) as sodium bicarbonate was fed to
each CDM and the TIC clearance following acidification was determined. In these
tests, a nitrogen purge gas flow of 26 cm3/min was utilized. The TIC in the effluent was
monitored as a function of flow rate through the CDM. The results are shown in Figure
11. The PTFE based CDM removed 90% of the influent CO2 at the lowest flow rate of
0.2 mL/min, corresponding to a contact time of 22.4 seconds, while the PDMS based
CDM removed all CO 2 at flow rates up to 0.6 mL/min, corresponding to a contact time
of 22 seconds. Clearly the PDMS based CDM provided superior performance for CO 2
clearance.
60
t-O
50
Qo0
._ 40E_EE
•_ 30E(D
n"20
"10.i
XO
E0
.D_- 0
0
I .... i .... t .... 1 I.,I- f ..../ /
/ /
//
/
//
///
//
//
//
//
//
//
//
//
//
//
--IF- 5 m TFE tube (4.47 cm 3)
3 m PDMS tube (0.22 cm 3)
J
-.A. Jk A
i _ _ = = t _ I , I I , , : : I = '. = : I '. : '. = = : = _ = ] = ' I : ', : : ; :
0.2 0.3 0.4 0.5 0.6 0.7 0.8 0.9 1.0
FI0w Rate (mL/min)
Figure 11. 002 Degassing Performance for PTFE and PDMS Membranes.
Since the goal of the CDM in the OAAM is to remove 002 while retaining organic
acids, the retention of organic acids by the CDM was examined. To simultaneously
evaluate the effectiveness of the PDMS CDM at CO 2 clearance and organic acid
URC 80985 27

retention, inlet and outlet TIC and Total Organic Carbon (TOC) levels were determined
separately for challenge solutions of formic, acetic, and propionic acids. In addition to
the organic acid, each solution contained 10 mg/L of TIC. For a contact time of 22
seconds, CO 2 clearance was uniformly high in all cases. The relative TOC retentions of
formic, acetic, and propionic acids were 94.8, 97.8, and 95.2%, respectively. These
important results clearly demonstrates that the PDMS based CDM effectively clears
CO 2, while retaining simple organic acids. The PDMS based CDM was selected for
incorporation into the OAAM.
4.30ATM Performance.
Initial operation of a breadboard OAAM as a FIA with the PDMS CDM and the
2.0 m OATM, resulted in an organic acid detection limit of -50 l_g/L. With this level of
uncertainty in organic acid concentration, the TOC uncertainty would range between +_
13 and ___24p.g/L, depending on the specific organic acid being detected. Since the
effluent TOC from the WRS must be less than 500 l_g/L, of which 300 pg/L must be
identified, significant improvements in the OAAM sensitivity was required to enable
effective diagnostic analysis of process water.
4.3.1 Temperature Effects.
The most obvious area for improvement in OAAM sensitivity was the OATM and
its transfer efficiency for organic acids. Such improvements could take the form of
better membranes or improved membrane performance. In the latter area, a
straightforward approach was to increase diffusivity of the volatile organic acid vapors
by raising temperature. The OATM transfer efficiency for formic acid as a function of
temperature was determined using a continuous flow of both carrier and analytical
streams. In this configuration, the carrier stream was formed by combining formic and
dilute sulfuric acid solutions in a mixing Tee. The formic acid concentration in the
combined carrier stream was 19.1 mg/L. Downstream from the mixing Tee, the carrier
stream flowed through the 3 m PDMS CDM and a special 0.24 m OATM at 0.6 mL/min.
The analytical stream flowed through the OATM at 0.1 mL/min. The contact time for
the analytical stream within the OATM was 10 seconds. The transfer efficiency was
then determined based on comparison of the specific conductances between the carrier
and analytical streams. The data for temperatures between 20°C to 50°C are shown in
Figure 12. The relatively low fraction transferred in this test arrangement was primarily
due to the small dimensions of the OATM and the short contact time. These data
indicated a threefold improvement in transfer efficiency when the temperature was
URC 80985 28

raised from 20 ° to 50°C. As a result of this information, 50°C was selected as the
operation temperature for the OATM.
.... i .... i .... i .... t .... i .... i .... i ....
"o(1)
u)t-
I-- 3
,m
o<O2E5,--
OLL
O
0
+ contact time of 10 seconds
2O
''I .... I .... I .... I .... t .... I .... I ....
25 30 35 40 45 50 55 60
Temperature (°C)
Figure 12. Effect of Temperature on OATM Transfer Efficiency for Formic Acid.
4.4 Performance Testing of Stopped Flow OAAM Configuration.
The next improvement that was investigated was modification of the time during
which organic acids from the carrier are pumped down the concentration gradient into
the analytical stream. Increasing the transfer time between the carrier and analytical
streams will increase the transfer of organic acids. The OAAM was operated as a
stopped flow analyzer. The sample stream was continuously pumped through the
OATM at 0.6 mL/min, while the analytical stream was stopped for a specified time. At
the end of the stopped flow time, the analytical stream was then pumped through the
conductivity detector at 0.4 mL/min. To reduce background conductivity levels a
continuous flow was maintained through the conductivity detector. This was
accomplished using two solenoid valves which bypassed the stopped flow plug in the
OATM during the stopped flow time. At the end of this time, flow was resumed through
the conductivity detector. Using this arrangement, spurious contributions to the
conductivity signal from the dissolution of metal in the conductivity cell and the in-
URC 80985 29

diffusion of ion forming species such as 002 was prevented. On the shell side of the
OATM, the continuous passage of the acidified carrier creates a concentration gradient
across the membrane. On the carrier side, organic acids are present in the protonated
and volatile form, while on the analytical stream side, organic acids are present in the
ionized and non-volatile form. Consequently, organic acids are driven from the carrier
into the analytical stream. By increasing the stopped flow time, the concentration of
organic acids in the analytical stream increases. This is demonstrated in Figure 13
where the specific conductance of the analytical stream is given as a function of the
stopped flow time for formic, acetic, and propionic acids. A stopped flow time of 10
minutes was selected as the best compromise between response time and sensitivity
based on these results. A detection limit of ~20 i_g/L for formic acid was obtained
operating the OAAM at 50°C with a 10 minute stopped flow time. The stopped flow
specific conductance peak remained unchanged below this concentration.
I .... I .... I .... I .... I .... I ....
70 --_- 100 p.g/L Formic Acid tt//_/
- e- 100 I_g/L Acetic Acid ._.-
60 -@- 100 I_g/L PropionicAcid ./I/
E ......D Blank ///
tJ /
00 50 /=L /
v /.E 40 /
/{33 /(b /
"1- 30 ///
-_ /I .........-e--.................-o
(D 20 / .... -e- .............. _-._..... -e- ...........................13. // _;./_ ..... ._................
0 ......................................0 .......................................................................[]
0 _0:" °IL" ' ' I I I .... I .... I
0 5 10 15 20 25 30 35
Stopped Flow Time (minutes)
Figure 13. Stopped Flow Time Conductiometric Response for Various Organic Acids.
Further investigation of the response fall off at low concentration indicated that
adsorption of organic acids by the thin protective oxide layer (i.e., Cr203) on the
stainless steel surface of the OATM shell limited organic acid detectability. The
URC 80985 30

detection limits were significantly improved when a new OATM was fabricated in which
the stainless steel outer tube was replaced with a PEEK (poly ether ether ketone) tube.
The new OATM consisted of a 2 m PEEK shell with an inner diameter of 762 i_m and a
coaxial microporous polypropylene tube with a 355 pm outer diameter, a 300 l_m inner
diameter, 0.05 _m pores, and 45% open porosity.
The OAAM performance was evaluated with the new OATM operated at 50°C,
with a 10 minute stopped flow time. The specific conductance responses for standard
solutions of formic, acetic, and propionic acids were determined. The results for
concentrations between 0.1 and 40 mg/L are shown in Figure 14, while the results for
lower concentrations between 5 _g/L and 1000 pg/L are given in Figure 15. Each curve
was fit to a third order polynomial, resulting in correlation coefficients of better than
0.9993. Sensitivity was dramatically improved over previous OAAM configurations with
detection limits for all organic acids on the order of 1-5 p.g/L. The theoretical
conductiometric response for acetic acid concentrations between 1 and 2000 pg/L is
shown in Figure 16. A comparison of the measured and theoretical values
demonstrates that the exchange of acetic acid during the 10 minute stopped flow time
40
35
_J30
O_E
v 25t-O
.m
20I,..
t-(1) 15(3CO 10
_J
5
//
....--
.....•
0
0 10 20 30
....o........Formic Acid--_-- Acetic Acid----- Propionic Acid
t I I I I I I _ J ' I II I I
40 50 60
A Specific Conductance (pS/cm)
Figure 14. High Level Organic Acid Response Curves.
URC 80985 31

V
c-O
m
{-
(3¢-O
(O
2200
2000
1800
1600
1400
1200
1000
800
600
400
200
0
0
/
I
I
; /
II
II
II
//
/
Formic Acid---o-- Acetic Acid
........-"......Propionic Acid
2 4 6 8 10 12
L_Specific Conductance (gS/cm)
Figure 15. Low Level Organic Acid Response Curves.
14
2000
.Qo. 1800
t-- 1600o
o_
1400
C(po 1200c-O
O 1000
•_ 800<:.o_ 600(D0< 400
•_ 200O!-
0
Theoretical Specific ConductanceValues for Acetic Acid
0 1 2 3 4 5 6 7
z_ Specific Conductance (l_S/cm)
Figure 16. Theoretical Equilibrium Conductiometric Response for Acetic Acid.
URC 80985 32

very nearly achieved equilibrium values (i.e., 6.4 versus 6.6 p.S/cm at 2000 p.g/L). This
confirms that the pH derived concentration gradient rapidly pumps acetic acid from the
carrier to the analytical stream. Due to this efficient transfer, low detection limits were
achieved without improvements in the conductivity detector sensitivity (i.e., 0.001 p.
S/cm). This OAAM configuration, consisting of a PDMS CDM and a heated,
microporous polypropylene OATM, provided a reasonable time response with sufficient
sensitivity to determine organic acids in the WRS for diagnostic purposes. However,
the utilization of a continuously flowing carrier stream with this configuration had several
drawbacks including system complexity with multiple switching solenoids and
associated tubing runs, and sample withdrawal required hard plumped connections.
Due to the improvements in sensitivity achieved by the elimination of stainless steel
components and operation of the OATM at higher temperatures, a second look at the
more versatile FIA configuration was initiated.
4.5 Performance Testing of Flow Injection Analyzer(FIA) OAAM Configuration.
The FIA version of the OAAM utilized the configuration shown previously in
Figure 2. In this OAAM, the CDM was 2 m long using a coaxial tube-in-shell design.
The outer shell had an inside diameter of 1.59 mm and the inner tube had an inside
diameter of 305 p.m inner diameter. The CO 2 selective membrane thickness was 165 p.
m and the volume within the inner tube was 141 I_L. The surface to volume ratio was
131.1 cm2/cm 3 for the CDM. The shell side of the OATM was constructed of 1.5 m of
PEEK tubing with an inside diameter of 762 p.m. The transfer membrane inside
diameter was 400 p.m and the membrane thickness averaged 30 p.m. The surface to
volume ratio was 100 cm2/cm 3 for the OATM. The injection volume was 1 mL.
Response curves were determined for high and low acetic acid concentration
ranges. These results are shown in Figures 17 and 18. These curves were fit to a
second order polynomial. The correlation coefficients for were 0.9990 and 0.9973 for
the higher and lower ranges, respectively. The detection limits were on the order of 10
p.g/L and depended on the flow rates and injection volume used. The absolute value of
the conductiometric response was significantly lower than in the stopped flow case at
equivalent concentrations. This was expected since the concentration gradient across
the membrane changes more rapidly in the FIA case, as compared to the stopped flow
case, due to the limited quantity of organic acids in the injection plug. The curve shape
also differed from the stopped flow case yielding an increasing conductivity response
with concentration (i.e., the curves bend down rather than up). This counters the
URC 80985 33
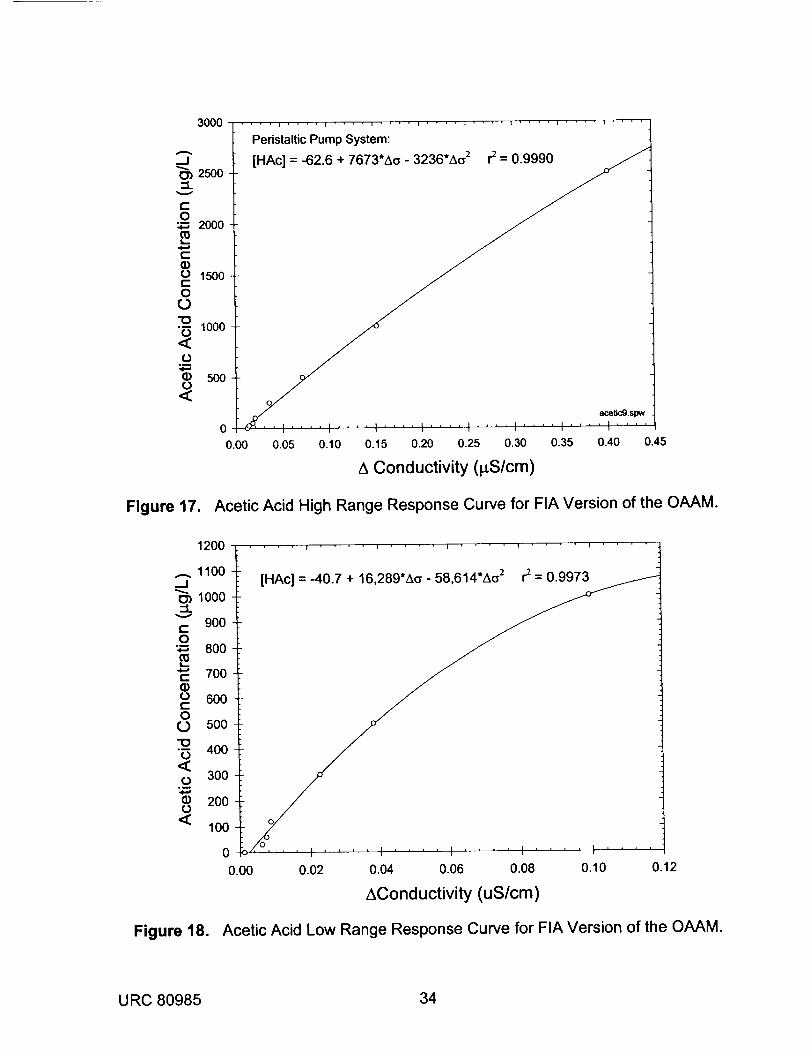
30O0
Figure 17.
Peristaltic Pump System:
[HAc] = -62.6 + 7673"Aa - 3236"Aa z rz = 0.9990
acet_:9.spw
00.00 0.05 0.10 0.15 0.20 0.25 0.30 0.35 0.40 0.45
A Conductivity (gS/cm)
Acetic Acid High Range Response Curve for FIA Version of the OAAM.
1200 .....
....1100
_1000-¢
v
900t-
O:m 800
*" 700t-(Do 600c-O
O 500"1o-_ 400<o 300
°m
200O<
100
0
0.00
' ' ' I i i i i I i i i j [ , , , , _ = i i i I ' ' ' '
0.02 0.04 0.06 0.08 0.10 0.12
AConductivity (uS/cm)
Figure 18. Acetic Acid Low Range Response Curve for FIA Version of the OAAM.
U RC 80985 34
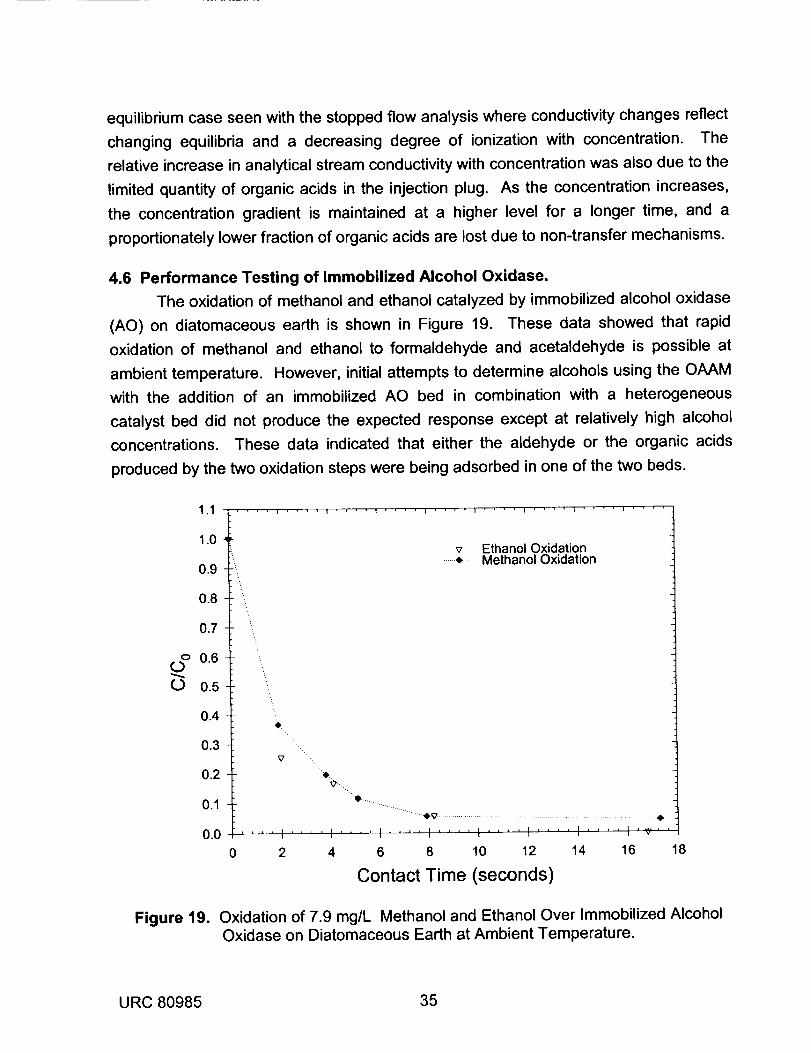
equilibrium case seen with the stopped flow analysis where conductivity changes reflect
changing equilibria and a decreasing degree of ionization with concentration. The
relative increase in analytical stream conductivity with concentration was also due to the
limited quantity of organic acids in the injection plug. As the concentration increases,
the concentration gradient is maintained at a higher level for a longer time, and a
proportionately lower fraction of organic acids are lost due to non-transfer mechanisms.
4.6 Performance Testing of Immobilized Alcohol Oxidase.
The oxidation of methanol and ethanol catalyzed by immobilized alcohol oxidase
(AO) on diatomaceous earth is shown in Figure 19. These data showed that rapid
oxidation of methanol and ethanol to formaldehyde and acetaldehyde is possible at
ambient temperature. However, initial attempts to determine alcohols using the OAAM
with the addition of an immobilized AO bed in combination with a heterogeneous
catalyst bed did not produce the expected response except at relatively high alcohol
concentrations. These data indicated that either the aldehyde or the organic acids
produced by the two oxidation steps were being adsorbed in one of the two beds.
.1 , ' ' ' .... I .... I .... I .... I .... l .... I .... I ....
1.0
0.9
0.8
0.7
o 0.6O
O 0.5
0.4
0.3
0.2
0.1
0.0
\
v Ethanol Oxidation......• ..... Methanol Oxidation
V .
V",%
........• v .............................................................................. I .... I .... = .... I .... I .... I .... I .... I'_''
2 4 6 8 10 12 14 16 18
Contact Time (seconds)
Figure 19. Oxidation of 7.9 mg/L Methanol and Ethanol Over Immobilized AlcoholOxidase on Diatomaceous Earth at Ambient Temperature.
URC 80985 35

4.7 Performance Testing of Oxidation Catalysts.
A new experiment was devised to determine whether adsorption of aldehydes or
organic acids was the cause of disproportionately low conductiometric responses for
the conversions of alcohols to organic acids. In this experiment, alcohol oxidase
immobilize on agarose beads was challenged with 1-propanol. The agarose support
was used for these experiments to eliminate propionaldehyde oxidation by the platinum
catalyst co-immobilized on the diatomaceous earth with alcohol oxidase since sorption
by the diatomaceous earth support would then be an issue. The complete oxidation of
1-propanol to propionaldehyde using alcohol oxidase was verified using gas
chromatography. When this AO bed was combined with a 1% platinum on zirconia
catalyst and coupled to the OAAM, however, a disproportionately low response was
seen, as with the bed containing alcohol oxidase immobilized on diatomaceous earth.
This is shown in Figure 20 where the actual conductiometric response is compared to
the theoretical response for 1-propanol that has been completely converted to propionic
acid. These data strongly suggest that a significant fraction of the organic acids
produced by the two step oxidation was adsorbed by the catalyst bed. It became
11
10
(" V
(D t-"1o 0 6_=_-_50"-'
-- e-
_ 3
0
o Conductivity Based on FIAPeak Height Meaurements
• Predicted Conductivity Based on100% Conversion and Detection
0 2 4 6 8 10 12 14 16 18 20
Specific Conductance (pS/cm)
Figure 20. Comparison of Theoretical and Measured Conductiometric Response of
Oxidized 1-Propanol.
URC 80985 36

evident that another heterogeneous catalyst was needed to oxidize aldehydes to
organic acids without undo adsorption. This becomes particularly important as thealcohol concentration is lowered. These efforts focused on silica MCF supports
because catalysts using activated carbon, alumina (AI203), and titania (TiO2) as
supports produced similar results to those for the zirconia (ZrO2) support.
A MCF was prepared using 6 g of P123, 6 g of TMB, and 13.2 g of TEOS under
the standard preparation conditions. The material was calcined at 600°C for 2 hours
and then sized to -16 +50 mesh. This support was impregnated with 2.0% platinum
and fired under reducing conditions at 600°C for 2 hours. A catalyst bed was prepared
containing 33 mg (i.e., 0.51 cm 3) of this catalyst. The catalyst was then challenged with
10 mg/liter of propionaldehyde. The influent was saturated with air, resulting in 8
mg/liter of dissolved oxygen, corresponding to 2.9 times the stoichiometric requirement
to oxidize propionaldehyde to propionic acid. The oxidation results at ambient
temperature are shown in Figure 21. The influent and effluent propionaldehyde
concentrations were determined as a function of flow rate. These data were fit to a
pseudo first order kinetics model, yielding an r2 of 0.9972. The reaction rate constant,
' ' ' ' I .... I .... I .... I ' ' ' ' I .... I .... I ' ' ' '
• pseudo first order propionaldehyde oxidation kine'dcs:
C/Co= a*e'kt where k is reaction rate constanta = 0.9960k=0.1508s 1
r2= 0.9972
ReactorSpaceTime(s)8O
Figure 21. Propionaldehyde Oxidation Kinetics Curve for MCF #1" 2.0% Pt Catalyst.
URC 80985 37

k, was 0.151 s-1which indicated that propionaldehyde oxidized rapidly over this catalyst.
Since the oxidation activity was high, other catalysts were not investigated. This
oxidation catalyst was combined with an alcohol oxidase bed to determine whether
sorption of organic acids was a problem.
4.8 Determination of Alcohols Using Improved Oxidation Catalysts.
The OAAM was assembled with an alcohol oxidase bed followed by the MCF
supported platinum catalyst as an FlA. The alcohol oxidase was immobilized on
cyanogen bromide activated Sepaharose A. This support was used to insure that none
of the aldehyde or organic acid product would be retained by the alcohol oxidase
support. A series of ethanol injections were performed covering concentrations
between 25 and 2500 l_g/L. The results are presented in Figure 22. These data show
good conversion, and since each 1.0 i_g/L of ethanol corresponds to 1.3 l_g/L of acetic
acid, this FIA configuration provided equivalent or better response than that determined
for acetic acid in Figure 18. Unfortunately, the alcohol oxidase bed was short-lived,
failing after 72 hour of continuous flow. The most likely cause of failure was
contamination by bacteria which disrupt the enzyme.
1100
I000
-J 900{3)::Lv 800
C
0 700._
600t"(1)O 5OOCO
(J 4OO
Ot-
J::
LU
Figure 22.
300
200
100
0
0.O0
I .... I I .... I .... I I .... I ' ' '
0.02 0.04 0.06 0.08 0.10 0.12 0,14 0.16
A Specific Conductance (gS/cm)
Ethanol Response Curve using Alcohol Oxidase plus MCF: 2.0% Pt
Catalyst Sequential Oxidation Beds.
URC 80985 38

5.0 CHARACTERIZATION OF PROTOTYPE OAAM PERFORMANCE.
Based on the preliminary testing of OAAM stopped flow and flow injection
configurations, the computer controlled OAAM was configured as a flow injection
analyzer (FIA). A schematic of this configuration was shown earlier in Figure 2. A more
complete description including the control programs is given in the Operation Manual.
A brief description of the FIA OAAM follows. Three aqueous streams flow into the
OAAM. These include analytical and carrier streams, and an acidified stream. These
streams are fed by a three channel peristaltic pump with flow rates between 0.15 and
0.17 mL/min. After passing through ion exchange beds, the deionized carrier stream
passes into the flow injection valve where a sample plug may be introduced via a 1 mL
injection loop. Following the flow injection valve, the carrier passes through or
bypasses two sequential beds containing alcohol oxidase and catalyst that convert
alcohols to organic acids. In either case, the carrier is then mixed with the acidified
stream, lowering its pH to -2. Downstream from the mixing Tee, the acidified carrier
passes through the CO 2 Degassing Module (CDM) where CO 2 is removed across 2 m
of PDMS membrane in a tube-in-shell arrangement to a counter-current, CO 2 free
purge gas flowing at 35 mL/min. From the CDM outlet, the carrier passes into a 1.5 m
microporous polypropylene membrane in the tube-in-shell OATM. The CO 2 free carrier
stream flows through the shell side, while the analytical stream, which has been
deionized by passage through the ion exchange bed, flows through the central tube.
The OATM is operated at 50°C. After passage through the OATM, the carrier stream
flows to waste and the analytical stream flows to the conductivity detector, or through a
chromatographic separation column and then to the conductivity detector.
The operation of the OAAM control program requires several operator inputs.
These include the pump speed, file name for the sample, the file name for the matrix
blank that will be used to correct conductivity data, the file name for the calibration
curve that will be used to calculate the concentration, and the run time. When the
program is initiated and a sample injected, the conductivity signal is continuously read,
displayed on the CRT screen, and stored to a file. After the conductivity returns to the
baseline value, the control program will determine the matrix corrected flow injection
peak height and area, and assign a concentration dependent on the selected calibration
file. For either organic acids or alcohols, between 15 and 30 minutes are required for
the flow injection peaks to clear the conductivity detector. At concentrations in excess
of 1000 i_g/L, the return to baseline requires a longer time period due to sample
URC 80985 39

retention within the carrier and analytical stream flow paths. This is especially evident
for alcohols, due to retention in the alcohol oxidase and catalyst beds.
5.1 Organic Acids - OAAM Analytical Performance.
After the OAAM was assembled, it was tested against formic, acetic, and
propionic acid standard solutions. The analytical and carrier stream flow rates were set
at approximately 0.175 and 3.45 mL/min, respectively. The most critical task prior to
sample injection was to reach a low and stable background specific conductance in the
analytical stream. For the organic acid detection configuration of the instrument,
specific conductance readings generally were less than 0.09 p.S/cm, which closely
approaches that for pure water (i.e., 0.056 p.S/cm). At this point, a matrix blank
consisting of the distilled water from which the standard solutions were made was first
injected, followed by organic acid standards over the concentration range of 20 p.g/L to
10,000 I_g/L. The matrix contained a detectable volatile acid gas component. The
source of this contaminant was unclear, but most probably originated from either the
packaging or via airborne contamination. Response curves were determined for
concentration as a function of baseline corrected peak heights. Figure 23 presents flow
injection peaks for 60, 150, and 300 I_g/L standards of formic, acetic and propionic
.18 _]_l_4i_l_I_I_i_I_ll_i_i_i_
0.16
EO 0.14_O::L
t- 0.12
(D-1-
00 0.10
Q.
0.08
0.06
300 I_g/L
10 minutes
150 i_g/L
60 _g/La22i formic acetic propionic
I_i_i_il_i1L_L_i_l_i_i_i_i_tiij_]_i_i_i_ii_[_iiL_i_iii_i_
I I I I I I I I I
0 20 40 60 80 100 120 140 160 180 200
Time (mnutes)
Figure 23. Flow Injection Peaks for Formic, Acetic and Propionic Acid Standards.
URC 80985 40

acids. The response from different organic acids was similar at similar concentrations,
with slight increases in peak height going from formic to acetic to propionic acids. The
peaks were characterized by a peak width at half maximum of ~7 minutes. In general,
between 20 and 25 minutes were required between each injection.
The OAAM response to formic acid was evaluated first. The formic acid
response curve for concentrations between 10 l_g/L to 10,000 p.g/L is shown in Figure
24. These data were plotted as concentration versus baseline corrected peak height.
The concentration data were fit to a second order polynomial expression for baseline
corrected peak heights. The choice of a quadratic fit originated from the concentration
dependent ionization and consequent specific conductances for organic acids shown in
Figures 25 and 26, respectively. Quadratic least squares fits of these theoretical values
gave r2 values of six nines or better. Over the concentration range between 10 i_g/L to
10,000 pg/L, the fit was excellent with an r2 of 0.9995. A similar response curve was
determined for the concentration range between 10 _g/L to 1,000 pg/L and is shown in
Figure 27. The r2 value for a polynomial fit for this curve was 0.9991. Overall these
10000
..J9000
=Lv 8000c-O:_ 7000
C 6000
Ot- 50000
0"1o 4000.m
o< 300oo
E 2o000
LL 1000
0
[Formic Acid] = 2875.0*(BCPH) - 53.69*(BCPH) 2+ 65.73 r2 = 0.9995
0.0 0.5 1.0 1.5 2.0 2.5 3.0
Baseline Corrected Peak Height (gS/cm)
3.5
Figure 24. High Range Formic Acid Response Curve.
URC 80985 41

2000
200
Figure 25. Ionization of Organic Acids versus Concentration.
2000
1800
-J03 1600::L
E 1400O"_ 12000_
t- 1000(9OE0 8000
6000}-- 4OO
200
./
./
/-
//
/ .../ .
/ .
1 .... I .... I .... I ' '
-- Formic Acid
............Acetic Acid
..... Propionic Acid
0 2 4 6 8 10 12 14
Equilibrium Specific Conductance (gS/cm)
Figure 26. Equilibrium Specific Conductance for Organic Acids versus Concentration.
URC 80985 42

.'--- 1000-J
:::L
r-- 800o._
¢-• 6000c-O0
"_ 400o_
<
o_
E 200t,--
OLL
0
[ I I I I
1.00 0.05 0.10 0.15 0.20 0.25 0.30
Baseline Corrected Peak Height (pS/cm)
Figure 27. Low Range Formic Acid Response Curve.
was 0.9991. Overall these data demonstrate very good sensitivity and a wide dynamic
concentration range of the OAAM for formic acid.
A comparison of the theoretical and experimental results show two distinct
differences. First, the theoretical conductiometric response is much larger than the
experimental specific conductance. Secondly, the concentration dependencies have
different curvatures, with the theoretical specific conductances curving upward with
concentration, while the OAAM specific conductances curve downward with
concentration. These differences are understandable in terms of the transfer efficiency
for formic acid in the OAAM. As was shown in the experimental section, the transfer
efficiency for formic acid is low, and consequently, the concentration of formic acid in
the analytical stream will be lower than that in the sample. As the formic acid
concentration in the sample increases, the analytical stream concentration also
increases. Evidently, the increase in formic acid concentration in the analytical stream
overrides the relative decrease in ionization with concentration that would normally be
observed for formic acid resulting in an increasing conductiometric response with
concentration (i.e., downward curvature). The analytical results for formic acid
URC 80985 43

indicated a detection limit between 5 and 10 p.g/L. This may be improved by increasing
the injection loop size, slowing the analytical stream flow rate, or both.
The OAAM response to acetic acid was then evaluated. The acetic acid
response curve for concentrations between 10 _g/L to 10,000 _g/L is shown in Figure
28. The fit for the polynomial equation given by [HAc] = 4625.3(peak height) +
320.6(peak height) 2 -23.3 was excellent with an r2 of 0.9999. Interestingly, the curve
displayed an upward concentration dependency. As with formic acid, the cause of this
dependency lies in the interaction between the concentration dependence for ionization
and the transfer efficiency. Another interesting feature is the lower specific
conductance response at the higher acetic acid concentrations when compared to
those for formic acid. This is expected, based on the lower fractional ionization for
acetic acid, as was shown in Figure 25. The low level acetic acid response curve for
concentrations between 10 and 1,000 l_g/L is shown in Figure 29. The fit for this curve
was also very good at 0.9994. Based on the low level response curve, the detection
limits for acetic acid is between 5 and 10 l_g/L.
..J
E_::L
v
t-O
oD
EQ)
¢-O_J
°_
<O
(_(3
<
10000
9000
8000
7000
6000
5000
4000
3000
2000
1000
0
0.0
[Acetic Acid] = 4625.3"(BCPH) + 320.6*(BCPH) 2- 23.30 r2 = 0.9999
0.2 0.4 0.6 0.8 1.0 1.2 1.4 1.6 1.8
Baseline Corrected Peak Height (_S/cm)
2.0
Figure 28. High Range Acetic Acid Response Curve.
URC 80985 44
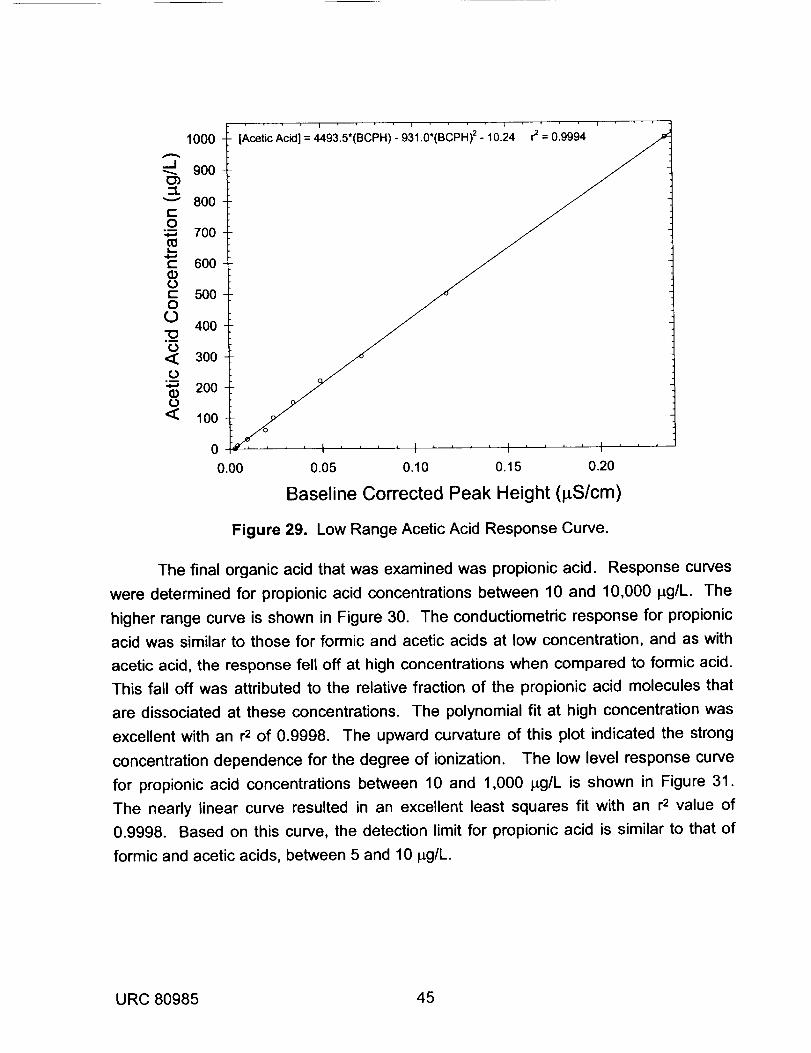
1000
..J900
0")"tv 800C0:_ 700
c 600
oc 5000
L)4OO
"O°_
<I: 300o
200
0<
[AceticAcid]= 4493.5*(BCPH) - 931.0*(BCPH) 2 - 10.24
100
0
0.00
r2 = 0.9994
0.05 0.10 0.15 0.20
Baseline Corrected Peak Height (l_S/cm)
Figure 29. Low Range Acetic Acid Response Curve.
The final organic acid that was examined was propionic acid. Response curves
were determined for propionic acid concentrations between 10 and 10,000 l_g/L. The
higher range curve is shown in Figure 30. The conductiometric response for propionic
acid was similar to those for formic and acetic acids at low concentration, and as with
acetic acid, the response fell off at high concentrations when compared to formic acid.
This fall off was attributed to the relative fraction of the propionic acid molecules that
are dissociated at these concentrations. The polynomial fit at high concentration was
excellent with an r2 of 0.9998. The upward curvature of this plot indicated the strong
concentration dependence for the degree of ionization. The low level response curve
for propionic acid concentrations between 10 and 1,000 p.g/L is shown in Figure 31.
The nearly linear curve resulted in an excellent least squares fit with an r2 value of
0.9998. Based on this curve, the detection limit for propionic acid is similar to that of
formic and acetic acids, between 5 and 10 l_g/L.
URC 80985 45

.-. 10000._1
Cn 9O00::L
c 80000.m
zooo
60000
0 50000
40000<o 3000E
.9 2000O.O
100013_
0
0.0
[PropionicAcid]= 3004.5*(BCPH) + 1209.7*(BCPH)2+ 31.56 r2= 0.9998
0.2 0.4 0.6 0.8 1.0 1.2 1.4 1.6 1.8
Matrix Corrected Peak Height (_S/cm)
Figure 30. High Range Propionic Acid Response Curve.
2.0
i I '
[PropionicAcid] = 4095.8*(BCPH) - 1243.2*(BCPH)2- 7.14 r2 = 0.9998
I .... I .... I ' ' '
0.05 0.10 0.15 0.20
Matrix Corrected Peak Height (_.S/cm)
' I
0.25
Figure 31. Low Range Propionic Acid Response Curve.
URC 80985 46

5.2 Separation of Organic Acids on OAAM Prototype.
A chromatography column for the separation of organic acids was inserted into
the analytical stream flow path of the OAAM downstream of the OATM. This HPLC
column was designed to separate organic acids present in fruit juices using a 0.1%
phosphoric acid solution as the eluent. When operated in this manner, formic, acetic,
and propionic acids are well separated with retention times increasing with increasing
carbon number. Figure 32 through 34 show flow injection peaks for 500 l_g/L samples
of formic, acetic, and propionic acids for carrier and analytical stream flow rates of
0.484 and 0.233 mL/min, respectively. The retention times were 13.7, 15.5, and 16.8
minutes, respectively, using water as the eluent. The longer retention times for the less
ionic organic acids reflect ion exclusion by the strongly sulfonated styrene
divinylbenzene resin contained within this column. Due to the highly ionic nature of this
resin, highly ionic organic acids are excluded from the sulfonated resin and the
associated hydration sphere, while protonated organic acids are retained by the resin,
since they are not ionized. In addition, the affinity of the protonated form of the organic
acid for the resin increases with carbon number. The retention times for propionic,
acetic, and formic acids reflect their progressively increasing affinities for the resin. The
peak at 29.5 minutes is an unknown contaminant present in the blank water sample.
0.30
0.28
0.26
_- 0.24
0.22
0.20
......... I ......... I ......... I ......... I ......... I ......... I ......... I .........
0 5 10
-- 500 ug/L formicacidretentiontime = 13.7 minutes
Unknown
Contaminant
15 20 25 30 35 40
Time (minutes)
Figure 32. 500 l_g/L Formic Acid Injection with Analytical Stream Separation Column.
URC 80985 47

0.28
Eo 0.26
o3::L
r- 0.24030
"1-
(0• 0.22EL
0.20
......... ] ......... i ......... r ......... i ......... i ......... I ......... i .........
/
J
/
/J
........ 500 ug/L acetic acidretention time = 15.5 minute
UnknownContaminant
.__,:_:._:._,...:-:-_.:......... _......... II ............................................,, , ,4
5 10 15 20 25 30 35 40
Time (minutes)
Figure 33. 500 l_g/L Acetic Acid Injection with Analytical Stream Separation Column.
0.28
Eo 0.26
co::L
t-- 0.24030"1-
¢00.22
(3.
0.20
......... i ......... i ......... i • ' _,_.' .... i ......... i ......... i ......... t .........
j" ',
- ........ 500 ug/L propionic acidretention time = 16.8 minute
:!
/
/ :: Unknown.: _- Contaminant/ '..,
!
......... I ......... ',......... ','"1 ...... I ......... I ......... I ......... I ........
0 5 10 15 20 25 30 35 40
Time (minutes)
Figure 34, 500 _g/L Propionic Acid Injection with Analytical Stream Separation
Column.
URC 80985 48

This is seen in Figure 35. This contaminant has been seen for all injections of sample
blanks and is responsible for the matrix contribution for distilled water, analytical
stream. As an example, Figure 41 shows the chromatogram for 10 mg/L each of
formic, acetic,
:LV
¢-._3b
°_
¢)"l-
G)Q.
0.191
0.190
0.189
0.188
0.187
0.186
0.185
I I ......... I
Contaminant in Distilled Water Blankwith a retention time = 28.8 minutes
0 5 10 15 20 25 30 35 40
Time (minutes)
Figure 35. Blank Injection with Analytical Stream Separation Column.
Mixtures containing different concentrations of formic, acetic, and propionic acids
were then injected into the OAAM. The results are shown in Figure 36 for 10,000, 500,
and 100 _g/L of each acid. At the highest concentration, separation of the three
organic acids is evident, although the retention times do not correspond to those for
injections of a single organic acid. The peaks correspond at progressively longer
retention times for formic, acetic, and propionic acids based on the ion exclusion
mechanism. As the concentration of the organic acid mixture decreases; however,
separation between organic acids disappears and the retention time for the peak
centroid shifts to shorter times. The loss of peak separation as well as the retention
time shift is due to the decrease in hydrogen ion concentration. In pure water, the
analyte concentration influences the degree of ionization for each organic acid due to
the changing pH. Thus, efforts to quantitate organic acids in mixtures using a
URC 80985 49

separation column in the analytical stream would be extremely difficult due to the
changing nature of the peaks as their concentration and the pH is changed.
3.0
2.5
EO"_. 2.0
O3::L
v
*- 1.5.__0
"l-v,
1.00O.
0.5
0.0
i ......... r ......... I ......... i i i .......
-- 10 mg/L //'\
S00uQ/L / /100 ug/L
........................ ...._I I ......... I ......... I ......... I ......... I .......
5 10 15 20 25 30
Time (minutes)
Figure 36. Separation of Organic Acid Mixtures with Analytical Stream Column.
Due to the problems intrinsic to an analytical stream separation column, a
second set of experiments was initiated with the separation column in the carrier stream
immediately upstream of the CDM. In this arrangement, the sample plug is first
acidified and then flows through the separation column. The carrier and analytical
stream flow rates were 0.167 and 0.213 mL/min, respectively. In this arrangement, pH
is controlled by the SPAM (or its equivalent) and any influence of the organic acid
concentration on the pH will be minor. Using the new configuration, 500 i_g/L samples
of formic, acetic, and propionic acids were injected into the carrier stream. The
chromatograms for individual organic acids are shown in Figures 37 through 39. The
retention times for formic, acetic, and propionic acids were 21.0, 27.1, and 32.0
minutes, respectively. A mixture containing 500 i_g/L each of formic, acetic, and
propionic acids was then injected into the carrier stream. The resulting chromatogram
is shown in Figure 40. At this concentration, the peaks are not well separated, but there
is a clear correspondence for peaks associated with each organic acid. Next, a series
of samples containing 200 i_g/L, 2 mg/L, and 10 mg/L each of formic, acetic, and
URC 80985 50

Eo
03zL
v
O)°_
d_"l-v,
EL
0.085
0.080
0.075
0.070
0.065
0.060
retention time = 21.0
0 5 10 15 20 25 30 35 40 45
Time (minutes)
Figure 37. 500 pg/L Formic Acid Injection with Carrier Stream Separation Column.
0.12
0.11
E 0.10o
03::L
v 0.09
,_
_) 0.08"1-
_) 0.07EL
0.06
0.05
retention time = 27.1
0 5 10 15 20 25 30 35 40 45
Time (minutes)
Figure 38. 500 _g/L Acetic Acid Injection with Carrier Stream Separation Column.
URC 80985 51

E(3
(/)::L
V
t-
°_
(1)"r
13_
Figure 39.
Et.)
(/)::L
V
t-
o_
"i-
n
o.18 lllllllllll_llVlllllll_llll_lllJ+l+llllllTl11111111111'lllllllll+IIlll ll+lllllllrlllllll+
0.16
0.14
0.12
0.10
0.08
0.06
0.04
retention time = 32.0
1ii iii ii i i Ii111 illllll ii iiii iiI ii i iiiiiiIi iii iiii i IIILII ILJ III III II] II Illll ILl Ill IIIII Ill
I I I I I I I 1
0 5 10 15 20 25 30 35 40 45
Time (minutes)
500 i_g/L Propionic Acid Injection with Carrier Stream Separation Column.
0.16
0.14
0.12
0.10
0.08formic acetic
] I0.06
0 5 10 15 20 25 30 35 40 45
Figure 40.
Time (minutes)
Chromatogram for 500 I_g/L Each of Formic, Acetic, andPropionic Acids with Corresponding Single Acid Retention Times.
URC 8O985 52

propionic acids were injected into the carrier stream. These chromatograms displayed
the same shifts in retention times that were observed with the separation column in the
analytical stream. As an example, Figure 41 shows the chromatogram for 10 mg/L
each of formic, acetic, and propionic acids. There is better separation for the individual
organic acid peaks which correspond well to the retention times for a 10 mg/L injection
of a single organic acid. The retention times for formic, acetic, and propionic acids
were 27.4, 34.3, and 39.3 minutes, respectively. After changing the organic acid
concentration by a factor of twenty the retention times increased 6.4, 6.2, and 7.3
minutes for formic, acetic, and propionic acid, respectively. The reason for these
concentration dependent retention times under the controlled pH conditions is
unknown.
Eo
v
t-E_(D"l-
EL
2.2
2.0
1.8
1.6
1.4
1.2
1.0
0.8
0.6
0.4
0.2
0.0
0 5 10 15 20 25 30 35 40 45
Time (minutes)
Figure 41. Chromatogram for 10 mg/L Each of Formic, Acetic, and
Propionic Acids with Corresponding Single Acid Retention Times.
These data show that separation can be accomplished using either water or an
acid solution as an eluent. Although this separation column showed potential for the
determination of individual organic acids in a mixture, the effort would involve a complex
transformation and accuracy would be low. Other separation media should be
investigated for organic acid separation and quantitation. In particular, the FIA
URC 80985 53

configuration allows the use of a dilute acid solution to elute organic acids from such a
column without the need to utilize special reagents. This provides added flexibility in
the selection of the most appropriate chromatography media.
5.3 Alcohols - OAAM Prototype Analytical Performance.
Following the determination of the simple organic acids, the OAAM response to
low molecular weight primary alcohols was characterized. This was accomplished by
first processing the sample through sequential layers of immobilized alcohol oxidase
and catalyst in the alcohol conversion loop. The alcohol oxidase and catalyst layer
volumes were 0.44 and 0.19 cm 3, respectively. Flow injection peaks for concentrations
between 50 and 400 l_g/L are shown in Figure 42. The specific conductiometric
responses for alcohols were lower than those for the corresponding organic acids on a
per mole basis (with a molar conversion for methanol, ethanol, and propanol of 0.69,
0.77, and 0.81, respectively). This was expected, due to peak broadening during
passage through the alcohol conversion loop. The peak widths at half maximum were
also larger than for the equivalent organic acid and increased from 7.8 minutes for
methanol to 9.2 minutes for propanol. Taken together, the analytical response for
alcohols indicated a somewhat lower sensitivity than for the equivalent organic acid.
.22 iiillllllllllllllllllllllllllllllllltllllllllllllIIll
0.20
E 0.18o
O3::L
0.16
t-._
_) 0.14"1""4(0
0.12EL
0,10
0.08
25O
10 minutes
P_
4OOIO0
2O0
\Methanol Ethanol n-Propanol
If lllllllJllillllllllllllilllJlllll llllllillllllllliliI I I I
0 50 100 150 200 250
Time (minutes)
Figure 42. Flow Injection Peaks for Methanol, Ethanol and n-Propanol.
URC 80985 54

The analytical response of the OAAM to methanol was evaluated for
concentrations between 25 and 10,000 pg/L. The baseline corrected conductiometric
response varied between 0.011 and 2.75 p.S/cm over this concentration range. This
compares to a range of 0.0096 to 4.318 for formic acid, indicating significantly lower
peak heights for equivalent sample concentrations. The response curve over this range
for methanol is shown in Figure 43. The data were fit to a second order polynomial with
an r2 value of 0.9993, indicating an good fit. A comparison of the polynomial
coefficients for formic acid and methanol reinforces the nearly equivalent but lower
analytical response of methanol. The polynomial fit at lower concentrations between 25
and 1,000 pg/L is shown in Figure 44. These data fit the polynomial expression even
better, with an r2 value of 0.9999. Comparison of the two curves indicates a transition
in conversion efficiency with a decided upward curvature at higher methanol
concentrations. This may well have been due to a falling conversion efficiency as the
methanol concentration increased. This explanation is plausible since the equilibrium
specific conductance for formic acid (see Figure 26), the methanol oxidation product
giving the specific conductance response, exhibited the least upward curvature with
concentration of all the organic acids because it dissociates more readily than the other
10000
._I 9000
::k 8000
t-O 7000,_-w
•*" 6000E(I)o 5O00E0
(._ 4000
O¢- 3000
t--2000
1000
0
[Methanol]= 1087.1*(BCPH) + 920.0*(BCPH) 2+ 62.2 r2= 0.9993
0.0 0.5 1.0 1.5 2.0 2.5
Baseline Corrected Peak Height (pS/cm)
Figure 43. Methanol Response Curve.
URC 80985 55

._1
::L
t-O
°D
t-(1)L)t-O
Ot-
t-
3000
2500
2000
1500
1000
5OO
[Methanol]= 2149.5*(BCPH) - 10.9*(BCPH)z + 0.1 r2 = 0.9999
0
0.0 0.1 0.2 0.3 0.4 0.5 0.6 0.7 0.8 0.9 1.0 1.1 1.2
Baseline Corrected Peak Height (l_S/cm)
Figure 44. Methanol Low Level Response Curve.
organic acids. Based on these results, the detection limits for methanol are between 20
and 40 t_g/L.
The analytical response of the OAAM to ethanol over the concentration range of
100 to 10,000 i_g/L was determined next. The experimental results are shown in Figure
45. The baseline corrected specific conductance over this concentration range varied
between 0.008 and 0.399 l_S/cm, as compared to 0.033 and 2.394 for acetic acid. As
with methanol, the values for ethanol are significantly lower than for equivalent
concentrations of acetic acid, especially at higher concentrations. There are several
factors that influence this response including slow conversion in the alcohol oxidase
bed, and retention of the acetic acid product. The response curve made an excellent fit
to a second order polynomial expression with an r2 value of 0.9999. Figure 46 shows
the analytical data for concentrations between 100 and 1,000 p.g/L. Although the fit to a
second order polynomial is quite good with an r2 of 0.9995, the curve exhibits poor
resolution at concentrations below 100 I_g/L. The poor conversion of ethanol to acetic
acid in combination with peak broadening and the high background limits the minimum
URC 80985 56

._1E_=L
v
c-O
¢-a_L_t-O
Ot-
t-
LU
10000
9000
8000
7000
6000
5000
4000
3000
2000
1000
0
0.00
[Ethanol] = 9,372.0*(BCPH) + 39,342*(BCPH)2- 7.1 r2 = 0.9999
0.05 0.10 0.15 0.20 0.25 0.30 0.35
Baseline Corrected Peak Height (l_S/cm)
Figure 45. Ethanol Response Curve.
0.40
.--I
:=Lv
t-O
t-
Ot-OO
Ot-
t-,4.._
LU
1000
9O0
8O0
700
600
500
400
300
200
100
0
0.00
[Ethanol] = 6578.7*(BCPH) + 61,180*(BCPH)2 + 52.0 r2 = 0.9995
0.01 0.02 0.03 0.04 0.05 0.06 0.07
Baseline Corrected Peak Height (l_S/cm)
Figure 46. Ethanol Low Level Response Curve.
0.08
URC 80985 57

detectble levels for ethanol to approximately 100 l_g/L. The relatively high detection
limit for ethanol may well have been due to the fact that the alcohol oxidase bed had
been installed within the OAAM for nearly 10 days, in which time it had processed over
5,000 mL of water. As a consequence of this extended use, the bed's performance
may well have degraded.
The OAAM analytical response to n-propanol was also evaluated. The high level
response curve for propanol concentrations between 25 and 10,000 _g/L is shown in
Figure 47. The conductiometric response varied between 0.0065 and 0.389 p.S/cm
over that range, as compared to 0.0057 and 4.98 _S/cm for equivalent concentrations
of propionic acid. As with ethanol, the data at high concentrations indicate some loss
mechanism, either due to incomplete conversion or retention in the conversion loop.
The least squares fit to a second order polynomial resulted in a good r2 value of 0.9993.
As with acetic acid, the plot curves upward, most likely for the same reasons. The low
level response curve for concentrations between 25 and 1,000 I_g/L is shown in Figure
48. The least squares fit for this curve provided a better r2 value of 0.9998 than did the
fit for the higher concentrations, yet at very low levels, insensitivity becomes evident.
The detection limit was estimated at 25 to 50 p.g/L.
0
0.00
[Propanol] = 13,817.8*(BCPH) + 31,590*(BCPH)2 - 141.1 r2 = 0.9993
0.05 0.10 0.15 0.20 0.25 0.30 0.35
Baseline Corrected Peak Height (p.S/cm)
Figure 47. n-Propanol Response Curve.
0.40
URC 80985 58

._1CTJ:L
v
c-O
t,..,.l=,a
t-
oc-O
0
0t-
On
1000
900
800
700
600
500
400
300
200
100
[Propanol]= 6,082.2*(BCPH) + 88,497*(BCPH)2 - 19.1 r2= 0.9998
0
0.00 0.01 0.02 0.03 0.04 0.05 0.06 0.07
Baseline Corrected Peak Height (l_S/cm)
Figure 48. n-Propanol Low Level Response Curve.
0.08
URC 80985 59

6.0 CONCLUSIONS.
The Organic Acid and Alcohol Monitor (OAAM) development program has
resulted in a computer controlled prototype analyzer capable of accurately quantitating
organic acids and primary alcohols in water over a large dynamic range with high
sensitivity and without the use of pre-formulated reagents, eluents, or other potentially
hazardous chemicals. The OAAM operates as a Flow Injection Analyzer (FIA) utilizing
membrane separation of organic acids from interfering ions followed by conductiometric
quantitation. Formic, acetic, and propionic acids were accurately quantified at
concentrations as low as 5 to 10 I_g/L in under 20 minutes, and at concentrations as
high as 10 to 20 mg/L in less than 30 minutes. Methanol, ethanol, and propanol were
determined at concentrations as low as 20 to 100 I_g/L, or as high as 10 mg/L in under
30 minutes following conversion to the corresponding organic acid by a combined
biocatalytic and catalytic conversion process. New technologies developed during this
program include solid phase acidification media capable of producing a pH of 1.60 to
1.75 in a flow through bed, a selective membrane for the removal of carbon dioxide
from an acidified solution of volatile organic acids, a highly efficient membrane system
for the transfer of volatile organic acids from an acidified carrier stream to a pure water
stream, and an enzyme based process for the quantitative in-line oxidation of primary
alcohols to organic acids without retention of intermediate or final oxidation products.
These developments were incorporated into a versatile instrument requiring only water,
power, and a carbon dioxide free purge gas. The OAAM was designed to allow the
early diagnosis of underperforming or failing sub-systems within the Water Recovery
System baselined for the International Space Station, while minimizing expendable
supplies, hazardous materials, and reagent preparation and handling time. These
goals were achieved through the development of several new technologies.
The quantitation of organic acids by specific conductance requires that the
organic acids must be separated from other ionic contaminants. This was achieved by
acidification of the sample to a pH of ~2, which protonates organic acids in solution
converting them to the volatile form. This pH was achieved without the need for an acid
solution by using a flow through Solid Phase Acidification Module (SPAM) containing
two layers of solid phase media. The first layer consisted of CaSO 4 granules, a
sparingly soluble salt, while the second layer was composed of strong acid ion
exchange (IX) resin beads in the hydrogen ion form. The dissolution of CaSO 4
produces Ca 2+ ions which upon contact with the IX resin is exchanged for two H + ions,
resulting in a dilute sulfuric acid solution with a pH of 1.60 to 1.75. This pH was much
URC 80985 60

lower than that obtained by flow through beds of MoO 3 or other acidic oxides.
Acidification of the sample volatilizes organic acids as well as other acid gases. Since
carbon dioxide is the most common acid gas and also interfers with the determination
of organic acids, its removal was necessitated. This was accomplished by a selective
membrane process in the CO 2 Degassing Module (CDM). Numerous membranes at
different temperatures were investigated. PolydimethylsUoxane (PDMS) membranes
proved capable of facilitating CO 2 removal to a flowing CO 2 free gas without a
significant loss of the volatile organic acids. The quantitation of organic acids requires
their separation from the dilute sulfuric acid solution by a membrane process in which
organic acids are transferred into the deionized water of the analytical stream. This is
accomplished by a membrane process in the Organic Acid Transfer Module (OATM).
In the OATM, due to the pH differences between the analytical and carrier streams,
volatile organic acids diffuse down a concentration gradient across the membrane. Of
the numerous membranes and transfer conditions evaluated for the OATM, a counter-
flow arrangement of carrier and analytical streams separated by a hydrophobic
microporous membrane operated at 50°C proved to be the best. Once in the analytical
stream, the organic acids dissociate, and the increase in specific conductance is used
to quantitate the organic acid concentration.
The quantitation of each organic acid in a mixture utilized a HPLC
chromatographic column with the capability to separate organic acids prior to
conductiometric detection. An anion exclusion resin proved capable of this task at high
organic acid concentrations. This strongly sulfonated styrene divinylbenzene resin
separates organic acids based on the affinity of the resin for the protonated and ionized
organic acid forms under the separation conditions. The ionized form will have the
least affinity due to the repulsion between the sulfonate anion moiety and the organic
acid anion. Although protonated organic acids are still polar, they will exhibit affinity for
the styrene divinylbenzene polymer resin, the degree of which will depend on the
functionality and length of the carbon backbone. The separation of organic acids was
evaluated at two locations in the OAAM. The first location was in the analytical stream
immediately upstream of the conductivity detector. The second location was in the
carrier stream immediately upstream of the CDM. In the analytical stream, separation
of organic acids was poor and dependent on the total concentration of organic acids.
The latter effect was attributed to the influence of total organic acid concentration on pH
which controls the relative fraction of protonated and unprotonated organic acid
species. Placement of the separation column in the carrier stream improved separation
URC 80985 61

conditions, since the pH of ~2 was constant and controlled. At high concentrations, a
good correlation was achieved between the retention times of a single organic acid and
the same organic acid in a mixture. Using this arrangement, formic, acetic, and
propionic acids were sufficiently separated at high concentrations to deconvolute the
overlapping peaks and quantitate individual organic acids. At lower concentrations,
peak separation suffered and quantitation was less than optimal. These results
indicated that, with additional work and optimized separation media, the probability of
success for the quantitation of individual organic acids in a mixture is high.
The quantitation of alcohols utilizes the same components developed for the
detection of organic acids, following oxidation steps which result in the formation of the
corresponding organic acid. The oxidation of alcohols at ambient temperature in a
process compatible with the analytical objectives required the development of an
improved biocatalyst and an innovative heterogeneous catalyst that did not significantly
adsorb the organic acid product. Immobilized alcohol oxidase which utilizes molecular
oxygen to rapidly oxidize primary alcohols, forming the corresponding aldehyde and
hydrogen peroxide, served as the biocatalyst. Since hydrogen peroxide will rapidly
denature the enzyme due to the formation of free radicals, the biocatalyst carrier must
contain means to destroy hydrogen peroxide and lengthen the enzyme life. This was
accomplished using a novel impregnation method to apply 0.5% by weight of highly
distributed platinum onto the diatomaceous earth support. Following the partial
oxidation of the alcohol, a heterogeneous catalyst is employed to complete the
oxidation to the corresponding organic acid. The major requirements for this catalyst to
succeed in this analytical application were rapid oxidation kinetics and low adsorptivity
of the organic acid product. Catalyst development resulted in unique mesocellular silica
supports homogeneously impregnated with 1% by weight of platinum. This catalyst
rapidly oxidized aldehydes, forming organic acids, and more importantly, did not adsorb
any of the organic acid product due to the support's surface charge. Consequently,
flow injection peaks were sharp and detection limits were low.
The prototype OAAM was computer interfaced using programs which control
pump speeds, acquire data, and analyze data. The main sample analysis program
requires operator inputs to identify the file name where analytical data is to be stored,
the calibration curve that will be used to evaluate the analyte concentration, the matrix
blank used to correct for the sample matrix effects, and the pump speeds used during
analysis. When the program is initiated and the sample injected, conductivity data are
recorded on the screen and written to the sample file. Data acquisition continues until
URC 80985 62

the program is stopped manually or automatically. Data is acquired until a pre-set time
has been reach after sample injection, a pre-set time has been reached after a peakmaximum has occurred, or when the operator has decided to truncate the run. When
the run is terminated, raw data are recorded permanently in the sample file, the matrix
corrected peak height and area are determined, and the analyte concentration isevaluated based upon the calibration file selected. A separate program allows the
operator to retrieve preexisting calibration standards and create a calibration file.
Based on this calibration file, the sample analysis program will determine the
concentration of each peak from its baseline corrected specific conductance in terms of
either peak height or peak area using a second order polynomial fit from the calibration
file. The sample analysis program provides great flexibility in viewing, storing, and
analyzing FIA data for the determination of organic acid and alcohol concentrations inwater.
The computer controlled prototype OAAM developed during this program is
capable of rapidly determing alcohols and organic acids in water with great sensitivity
and a wide dynamic range. This enabling technology requires only power, water, a
carbon dioxide purge gas, and solid phase reagent beds to operate. The elimination of
reagent preparation, and the storage and handling of acid solutions enhances safety,
simplifies operation, and significantly reduces time required by astronauts to perform
analyses. These attributes fit well with a potential role as an analytical instrument that
will characterize sub-system performance in the Water Recovery System (WRS) thathas been baselined for the International Space Station. Full development of this
technology will allow a real time evaluation of WRS performance and the diagnosis ofincipient and evident sub-system malfunctions. This technology also has the potential
for expansion to other analytes of interest including nitrate, nitrite, and ammonia with
minor modification of the basic components.
The results from the OAAM development program have been reported in Life
Support and Biosphere Science.36 In addition, a synopsis of the operation principles
used by the OAAM as well as some analytical results is presented on the UMPQUA
Research Company webpage at http:llwww.urc.ccloam.htm.
URC 80985 63

7.0 REFERENCES.
1. Carter, D.L.; Holder, D.W.; Alexandre, K.; Shaw; R.G.; and Hayase, J.K., PreliminaryECLSS Waste Water Model, SAE Technical Paper Series 951150, presented at the21 st International Conference on Environmental Systems, San Francisco, 1991.
2. Carter, D.L.; Cole, H.; Habercom, M.; Griffith, G.; and Slivon, L., Determination ofOrganic Carbon and Ionic Accountability of Various Waste and Product WaterDerived from ECLSS Water Recovery Tests and Spacelab Humidity Condensate.,SAE Technical Paper Series 921313, presented at the 22rid InternationalConference on Environmental Systems, Seattle, 1992.
3. Atwater, J.E., Thermodynamics of the Oxidation of Dissolved Organic Contaminantsin Shuttle Orbiter Humidity Condensates, J. Environ. Sci. Health, A30 (4), 817-830,1995.
4. Sauer, R.L.; Pierre, L.M.; Schultz, J.R.; Sinyak,Y.E.; Skuratov, V.M.; Protasov, N.N.;and Bobe, L.S., Chemical Analysis of Potable Water and Humidity Condensate:Phase One Final Results and Lessons Learned, SAE Technical Paper Series 1999-01-2028, presented at the 29th International Conference on Environmental
Systems, Denver, 1999.5. Carter, D.L.; and Bagdigian, R.M., Phase III Integrated Water Recovery Testing at
MSFC: Single Loop Test Results and Lessons Learned, SAE Technical PaperSeries 932048, presented at the 22nd International Conference on Environmental
Systems, Colorado Springs, 1993.6. Bagdigian, R.; Parker, D.S.; and O'Connor, E.W., ISS Water Reclamation System
Design, SAE Technical Paper Series 1999-01-1950, presented at the 29thInternational Conference on Environmental Systems, Denver, 1999.
7. Atwater, J.E.; Akse, J.R.; DeHart, J.; and Wheeler, Jr., R.R., Fiber-OpticChemiluminescent Biosensors for Monitoring Aqueous Alcohols and Other WaterQuality Parameters, Final Report, NASA Contract NAS9-19021, 1994.
8. Akse, J.R. and Atwater, J.E., Advanced Catalytic Methods for the Destruction ofEnvironmental Contaminants, Paper No. 95-LS-70, presented at AIAA Life Sciencesand Space Medicine Conference '95, Houston, April 3-5, 1995.
9. Akse, J.R. and Jolly, C.D., Catalytic Oxidation for Treatment of ECLSS & PMMSWaste Streams, SAE Technical Paper Series No. 911539, Regenerative Life
Support Systems & Processes, SP-873, SAE, Warrendale,. PA, 1991.10. Atwater, J.E.; Akse, J.R.; DeHart, J.;. Wheeler, Jr, R.R; and Verostko, C.E., Fiber-
Optic Chemiluminescent Biosensors for Monitoring Aqueous Alcohols and OtherWater Quality Parameters, U.S. Patent 5,792,621, 1998.
11. Thompson, J.O.; Akse, J.R.; Wheeler, Jr., R.R.; Wisely, M.T.; and Atwater, J.E.,Microgravity Compatible Reagentless Instrumentation for Detection Of DissolvedOrganic Acids in Potable Water, Final Report, NASA Contract NAS9-97095, 1997.
12. Jolly, C.D., Solid Phase Calibration Standards, U.S. Patent 5,559,035, 1996.13. Jolly, C.D. and DeHart, J., A ReagenUess Separator for Removal of Inorganic
Carbon from Solution, Final Report Contract NAS8-38460, Marshall Space FlightCenter, June 1990.
URC 80985 64

14. Jolly, C.D., Reagentless Separator for Removal of Acid Gases and their HydrolysisProducts from Solutions, U.S. Patent 5,244,478, September, 1993.
15. Jolly, C.D.; Schussel, L.J.; and Carter, L., Advanced Development of ImmobilizedEnzyme Reactors, Regenerative Life Support: Systems & Processes, Behrend, A.F.,MacEIroy, R.D., and Reysa, R.P., Eds., Society of Automotive Engineers,Warrendale, PA, 1991.
16. Jolly, C.D. and Schussel, L.J., Enzymatic Catalytic Beds for Oxidation of Alcohols,NASA Tech Briefs, May 1993.
17. Schussel, L.J. and Atwater, J.E., A Continuous Alcohol Oxidase Bioreactor for
Regenerative Life Support, Enzyme Microb. Technol., 18, 229-235, 1996.18. Akse, J.R.; Atwater, J.E.; Thompson, J.O.; and Sauer, R. L., Reagentless Flow
Injection Determination of Ammonia and Urea Using Membrane Separation andSolid Phase Basification, Microchem. J., 59, 372-382, 1998.
19. Akse, J.R.; Atwater, J.E.; Thompson, J.O.; and Sauer, R. L., Ammonia Monitor,U.S. Patent 5,882,937, 1999.
20. Hunter, R.J., Zeta Potential in Colloid Science Principles and Applications,Academic Press, New York, 1981.
21. Adamson, A.W., Physical Chemistry of Surfaces, John Wiley and Sons, New York,1976.
22. Stern, O., Z. Elektrochem., 30, 508, 1924.23. Laitinen, H., Chemical Analysis, McGraw-Hill Book Company, New York, 1960.24. Lewis, J.A., Colloidal Processing of Ceramics, J. Am. Cer. Soc., 83, 2341-2359,
2000.
25. Yang, P., D. Zhao, B.F. Chmelka, and G.D. Stucky, Triblock-Copolymer-DirectedSyntheses of Large Pore Mesoporous Silica Fibers, Chem. Mater., 10, 2033-2036,1998.
26. Schmidt-Winkel, P., W. Lukens, Jr., P. Yang, D.I. Margolese, J.S. Lettow, J.Y.
Ying, and G.D. Stucky, Microemulsion Templating of Siliceous MesostructuredCellular Foams with Well-Defined Ultralarge Pores, Chem. Mater., 12,686-696,2000.
27. Schmidt-Winkel, P., W.W. Lukens, Jr., D. Zhao, P. Yang, B.F. Chmelka, and G.D.Stucky, Mesocellular Siliceous Foams with Uniformly Sized Cells and Windows, J.Am. Chem. Soc., 121,254-255, 1999.
28. Shefelbine, T.A., M.E. VigUd, M.W. Matsen, D.A. Hajduk, M.A. Hillmyer, E.L.Cussler, and F.S. Bates, Core-Shell Gyroid Morphology in a Poly(isoprene-block-styrene-block-dimethylsiloxane) Triblock Copolymer, J. Am. Chem. Soc., 121, 8457-8465, 1999.
29. Goldacker, T. and V. Abetz, Core-Shell Cylinders and Core-Shell Gyroid
Morphologies via Blending of Lamellar ABC Triblock and BC Diblock Copolymers,Macromolecules, 32, 5165-5167, 1999.
30. Lettow, J.S., Y.J. Han, P. Schmidt-Winkel, P. Yang,, D. Zhao, G.D. Stucky, and
J.Y. Ying, Hexagonal to Mesocellular Foam Phase Transition in Polymer-TemplatedMesoporous Silicas, Langmuir, 16, 8291-8295, 2000.
31. Schmidt-Winkel, P., C.J. Glinka, and G.D. Stucky, Microemulsion Templates for
Mesoporous Silica, Langmuir, 16, 356-361,2000.
URC 80985 65

32. Zang, P., D. Zhao, D. Margolese, B.F. Chmelka, and G.D. Stucky, GeneralizedSytheses of Large-Pore Mesoporous Metal Oxides with SemicrystallineFrameworks, Nature, 396, 152-155, 1998.
33. Zhao, D., Q. Huo, J. Feng, B.F. Chmelka, and G.D. Stucky, Nonionic Triblock andStar Diblock Copolymer and Oligomeric Surfactant Syntheses of Highly Ordered,Hydrothermally Stable, Mesoporous Silica Structures, J. Am. Chem. Soc., 120,6024-6036, 1998.
34. Cotton, F.A. and G. Wilkerson, Advanced Inorganic Chemistry: A Comprehensive
Text, 4th Edition, John Wiley & Sons, New York, 1980.35. Press, W.H., Flannery, B.P., Teukolsky, S.A., and Vetteding, W.T., Numerical
Recipes: The Art of Scientific Computing, Cambridge, New York, 1986.36. Akse, J.R., Atwater, J.E., and Holtsnider, J.T., Development of a Microgravity-
Compatible Organic Acid and Alcohol Monitor (OOAM), Life Support & BiosphereScience, Vol. 8, pp. 55-63, 2001.
URC 80985 66

APPENDIX
PUBLICATIONIN LIFE SUPPORT& BIOSPHERE SCIENCE
ENTITLED
'DEVELOPMENT OF A MICROGRAVITY-COMPATIBLE REAGENTLESS ORGANIC
ACID AND ALCOHOL MONITOR (OAAM)"
URC 80985 67

Lzfe Support & Biosphere Science, Wol. 8 pp. 55--63
Printed in the USA. All rights reserved.
1069-9422/01 $20.00 + .00
Copyright © 2001 Cognizant Comm. Corp.
DEVELOPMENT OF A MICROGRAVITY-COMPATIBLE REAGENTLESS
ORGANIC ACID AND ALCOHOL MONITOR (OAAM)
JAMES R. AKSE, JAMES E. ATWATER, and JOHN T. HOLTSNIDER
UMPQUA Research Company, EO. Box 609, Myrtle Creek, OR 97457
The development of a microvavity-compatible analyzer capable of quantifying organic acids in water is described.
The analyzer employs "reagentless" solid phase acidification to convert organic acids to the volatile form followed
by membrane separation and specific conductance detection to determine organic acids at concentrations between
0.005 and 40 mg/L. In the future, this technology will be extended to the detection of alcohols, which will beoxidized to form the corresponding organic acid and then determined using the same processes. An immobilized
enzyme biocatalyst, alcohol oxidase, oxidizes alcohols to form an aldehyde. Oxidation to the corresponding organic
acid is then completed over a heterogeneous catalyst. The combined organic acid and alcohol monitor (OAAM) will
be utilized to determine levels of both analyte classes at various points within the water recovery system (WRS)
baselined for the International Space Station (ISS). These data will improve water quality through enhanced process
control, while allowing early diagnosis of potential problems.
Organic acids Analysis Alcohols Water recovery system
INTRODUCTION
The trace organic content of finished water aboardthe International Space Station (ISS) is an important
parameter that should be monitored to ensure crewhealth and to diagnose potential problems with the pri-
mary water recovery system (WRS). A significant frac-tion of the dissolved organic carbon in water produced
by current physicochemical water reclamation technol-
ogy consists of low molecular weight carboxylic acids,
including: formic acid, acetic acid, and propionic acid.
These low molecular weight organic acids occur in
humidity condensate, urine distillate, and composite
wastewaters aboard spacecraft (5,9,10,17 ). They are also
produced as by-products from partial oxidation ofmethanol, ethanol, propanol, and related contaminants
in the volatile removal assembly (VRA) catalytic oxi-
dizer, a WRS component baselined for use aboard the
ISS. The development of analytical instrumentation that
can determine organic acids and alcohols on-line in real
time will improve water quality through enhanced WRS
process control, allow early diagnosis of potential prob-
lems, and thereby ensure crew health. The development
of the organic acid component of a combined organic
acid and alcohol monitor (OAAM) is presented in this
article. Before describing the organic acid monitor de-
velopment, the current WRS will be summarized, in-
cluding potential areas of application of the OAAM.The WRS removes contaminants from wastewater
using the three primary physicochemical processes
Address correspondence to James R. Akse, Ph.D., UMPQUAResearch Company, EO. Box 609, Myrtle Creek, OR 97457. Tel: (541) 863-2653; Fax: (541) 863-7770; E-mail: [email protected]
55

56 AKSE,ATWATER,ANDHOLTSNIDER
showninFigure1(8,11).Ioniccontaminantssuchasorganicacidsandinorganicsaltsareremovedbyionexchange(IX),whilethemajorityof organicspeciesareremovedbyadsorptiononactivatedcarbon.Bothof thesefunctionsare performedwithin themultifiltration(MF)subsystem.Highlypolar,lowmo-lecularweightorganiccontaminantssuchasalcoholsarenotremovedbyMFandthereforemustbecatalyti-callyoxidizedintheVRA(1,2,6,7).Theoxidationofalcoholsproducesorganicacids,whichareremovedbyaposttreatmentIX bed.
Thecurrentplans for analytical instrumentation forthe WRS include an on-line process control water qual-
ity monitor (PCWQM) capable of determining pH and
specific conductance. Additional off-line analytical
capability is embodied in the crew health care system(CHeCS), which includes equipment and instruments
to be operated by crew members for determining other
water quality parameters, including total organic car-
bon (TOC). Under current operational strategy, a TOC
value that is greater than 500 lag/L would indicate in-
adequate WRS performance, but would add little diag-
nostic information to indicate which processes are out
of specification and require attention.This situation can be improved upon significantly
by the addition of the capability to detect and quantify
dissolved alcohols and organic acids. The concentra-
tions of organic acids and alcohols at the MF, VRA,
and posttreatment IX bed outlets indicate the effective-ness of each process at eliminating or chemically modi-
fying the contaminants. With reference to Figure 1, high
TOC values in finished water may be due to a variety
of circumstances. If the finished water's conductivity
and organic acid concentrations are also high, then the
MF beds have been exhausted. If conductivity is low,
but dissolved alcohols are high, then a problem with
VRA performance is suggested. If conductivity and
dissolved alcohols are low, but organic acids are high,
then exhaustion of the posttreatment IX bed is indi-
cated. The addition of dissolved alcohol and organic
acid monitoring capability provides an essential diag-nostic tool for rapid remediation of inadequacies in
water processor performance to ensure production of
potable water capable of sustaining crew health.
A schematic of the organic acid and alcohol monitor(OAAM) is shown in Figure 2 (19). Samples flow
through the OAAM by one of two flow paths, depend-
ing on whether alcohols or organic acids are being de-
termined. When organic acids are determined, the
sample flows directly into the solid phase acidification
(SPA) module (14-16). Flow through this module low-
ers the pH by controlled dissolution of a sparinglysoluble salt. pH control by this "reagentless" method-
ology is characterized by the dissolution kinetics and
the lowest attainable pH value. At pH values attainable
by flow through the SPA, the equilibrium speciation of
weak organic acids and carbon dioxide is shifted to their
undissociated volatile forms. Because CO 2 will inter-fere with the final determination of organic acid con-
centration, CO s is first selectively removed from the
Muitifittration (MF) Beds Containing [] = Conductivity Senso_Various IX and Sodoent Media
! Bl='- 7 - -- [ Degasser
II_., - -i:, : ; Posltreatment
l "VCD Urine Oislillate
HumidityCondensate
Potential Sites for OAAM Incorporatior': ,_..,(._, arK_.j
Figure I. International Space Station water recovery system (WRS) schematic.

MICROGRAVITY-COMPATIBLE ORGANIC ACID AND ALCOHOL MONITOR 57
Sample 0
t +Water
CO= Degassing
COzI.aden Module (CDM)PUqle Gas :"
I _ltal_lt Bed Compoelta 4 .. "" "
.__:___ Aadir,_'Uon / ..
F q \L
MediaTrlnsfer Module' - ................ i ..........
(OAT_
Detector
-L....._ Water RusOrganic Acids
Figure 2. Organic acid and alcohol monitor (OAAM)schematic.
sample by flow through the CO 2 degassing module(CDM). The CDM uses a semipermeable membrane
for CO z removal. The CO2-free sample then flowsthrough the organic acid transfer module (OATM). In
the OATM, volatile organic acids are transferred to an
analytical stream composed of deionized water. The
transfer is accomplished using a stopped flow protocol
that increases the concentration of organic acids in the
analytical stream. The organic acid level is then deter-
mined based on the change in specific conductance of
the stopped flow peak as it passes through the conduc-
tivity detector.When alcohols are determined, oxidation to the cor-
responding organic acid must occur by passage through
an ambient temperature oxidation reactor prior to en-try into the SPA. The reaction scheme is shown in Fig-
ure 3. The first oxidation step is accomplished by a bed
of immobilized alcohol oxidase, which catalyzes the
oxidation of primary alcohols to the corresponding al-
dehydes in the presence of oxygen (12,13,18). Alde-
hydes are then oxidized to form the corresponding or-
ganic acid over a heterogeneous catalyst. Following
completion of the two-step oxidation, alcohol concen-
trations are determined from the change in specific con-
ductances that arise from transport of the correspond-
ing organic acids into the analytical stream.
To date, a working stopped flow analyzer has been
constructed from optimized components that is capable
of reproducible quantitation of formic, acetic, and pro-pionic acids at concentrations between 0.005 and 40
m_JL. In the future, this technology will be miniatur-
ized and extended to the quantitation of methanol, etha-
nol, and n-propanol.
DEVELOPMENT OF THEORGANIC ACID ANALYZER
The combination of solid phase pH control, mem-
brane separation of volatile solution constituents, and
conductiometric detection was adapted from other in-
strument designs developed for the determination of
ammonia, nitrate, and urea in water (3,4). A first-gen-
eration OAAM was developed utilizing these compo-
nents with the addition of a membrane-based CO: re-
O= 1"120=H _ H=C\ / H
CH=--C--OH . CI _o=dm IIH 0
1/20= H=Cx /OH= C
.,_=,_¢m_ IIO
Figure 3. Oxidation of primary alcohols to form the correspondingorganicacid.
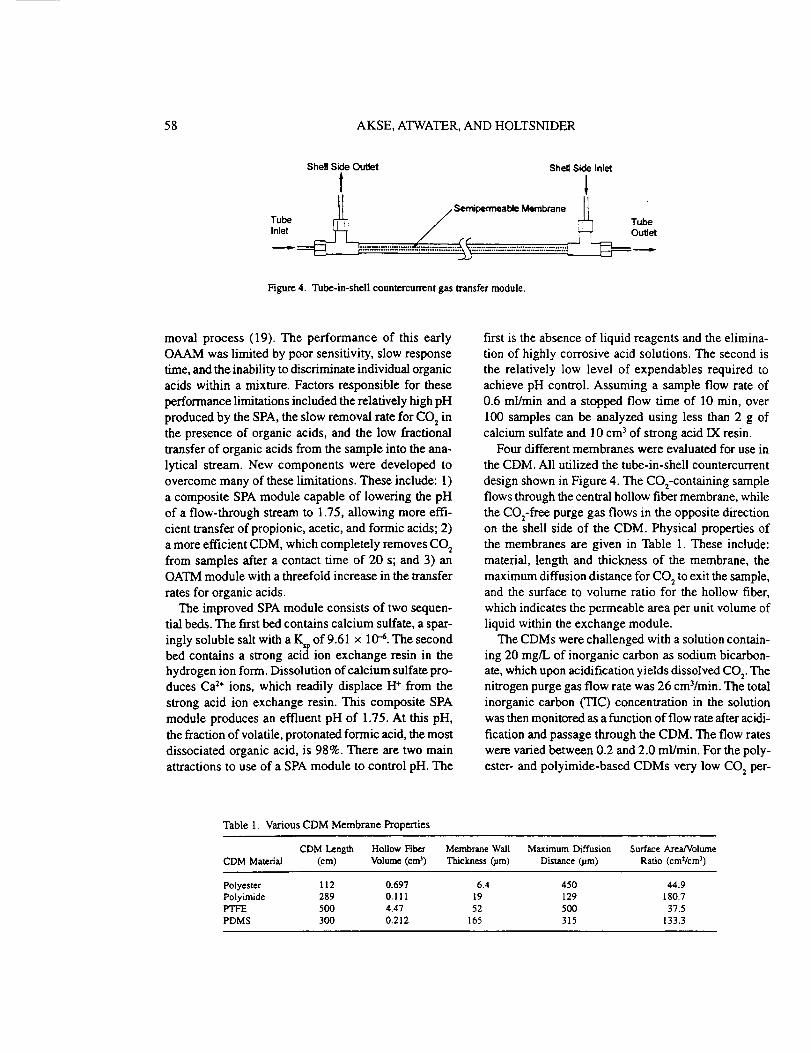
58 AKSE,ATWATER,ANDHOLTSNIDER
Shell Side Outlet Shell Side Inlet
Inlet _ / _J Outlet
Figure 4. Tube-in-shell countercurrent gas transfer module.
moral process (19). The performance of this early
OAAM was limited by poor sensitivity, slow response
time, and the inability to discriminate individual organicacids within a mixture. Factors responsible for these
performance limitations included the relatively high pH
produced by the SPA, the slow removal rate for CO 2in
the presence of organic acids, and the low fractionaltransfer of organic acids from the sample into the ana-
lytical stream. New components were developed to
overcome many of these limitations. These include: 1)
a composite SPA module capable of lowering the pH
of a flow-through stream to 1.75, allowing more effi-
cient transfer of propionic, acetic, and formic acids; 2)
a more efficient CDM, which completely removes CO 2from samples after a contact time of 20 s; and 3) anOATM module with a threefold increase in the transfer
rates for organic acids.
The improved SPA module consists of two sequen-
tial beds. The first bed contains calcium sulfate, a spar-
ingly soluble salt with a K=pof 9.61 x 10 -'6.The secondbed contains a strong acid ion exchange resin in thehydrogen ion form. Dissolution of calcium sulfate pro-
duces Ca 2+ ions, which readily displace El+ from the
strong acid ion exchange resin. This composite SPA
module produces an effluent pH of 1.75. At this pH,
the fraction of volatile, protonated formic acid, the most
dissociated organic acid, is 98%. There are two main
attractions to use of a SPA module to control pH. The
first is the absence of liquid reagents and the elimina-
tion of highly corrosive acid solutions. The second is
the relatively low level of expendables required to
achieve pH control. Assuming a sample flow rate of
0.6 ml/min and a stopped flow time of 10 rain, over
100 samples can be analyzed using less than 2 g ofcalcium sulfate and 10 cm 3 of strong acid IX resin.
Four different membranes were evaluated for use in
the CDM. All utilized the tube-in-shell countercurrent
design shown in Figure 4. The CO2-containing sampleflows through the central hollow fiber membrane, while
the CO:-free purge gas flows in the opposite directionon the shell side of the CDM. Physical properties of
the membranes are given in Table 1. These include:
material, length and thickness of the membrane, the
maximum diffusion distance for CO: to exit the sample,and the surface to volume ratio for the hollow fiber,
which indicates the permeable area per unit volume of
liquid within the exchange module.
The CDMs were challenged with a solution contain-
ing 20 mgJL of inorganic carbon as sodium bicarbon-
ate, which upon acidification yields dissolved CO 2.Thenitrogen purge gas flow rate was 26 cm3/min. The total
inorganic carbon (TIC) concentration in the solutionwas then monitored as a function of flow rate after acidi-
fication and passage through the CDM. The flow rates
were varied between 0.2 and 2.0 ml/min. For the poly-
ester- and polyimide-based CDMs very low CO 2 per-
Table 1. Various CDM Membrane Properties
CDM Length Hollow Fiber Membrane Wall Maximum Diffusion Surface Area/Volume
CDM Material (cm) Volume (cm 3) Thickness 0am) Distance (pro) Ratio (cm2tcm 3)
Polyester 112 0.697 6.4 450 44.9
Polyimide 289 0. I 11 19 129 180.7PTFE 500 4.47 52 500 37.5
PDMS 300 0.212 165 315 133.3
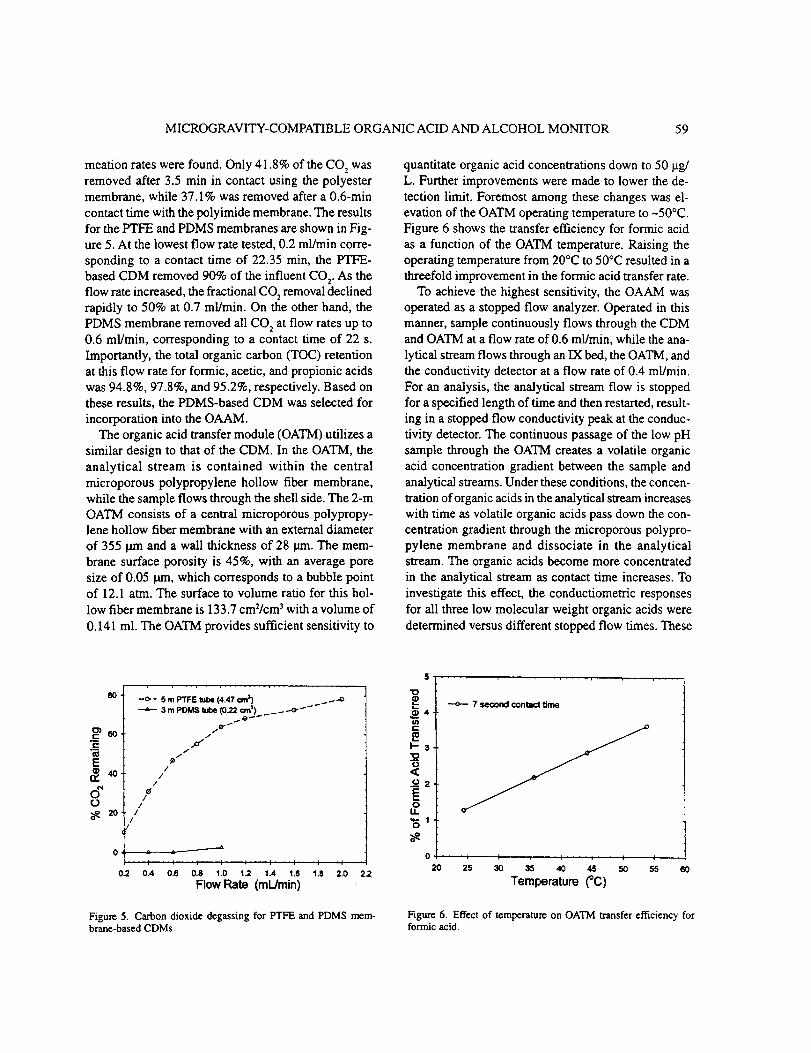
MICROGRAVITY-COMPATIBLE ORGANIC ACID AND ALCOHOL MONITOR 59
meation rates were found. Only 41.8% of the CO 2was
removed after 3.5 min in contact using the polyestermembrane, while 37.1% was removed after a 0.6-min
contact time with the polyimide membrane. The resultsfor the PTFE and PDMS membranes are shown in Fig-
ure 5. At the lowest flow rate tested, 0.2 ml/min corre-
sponding to a contact time of 22.35 min, the PTFE-
based CDM removed 90% of the in fluent CO 2. As the
flow rate increased, the fractional CO 2removal declinedrapidly to 50% at 0.7 ml/min. On the other hand, the
PDMS membrane removed all CO 2 at flow rates up to
0.6 ml/min, corresponding to a contact time of 22 s.
Importantly, the total organic carbon (TOC) retention
at this flow rate for formic, acetic, and propionic acids
was 94.8%, 97.8%, and 95.2%, respectively. Based onthese results, the PDMS-based CDM was selected for
incorporation into the OAAM.The organic acid transfer module (OATM) utilizes a
similar design to that of the CDM. In the OATM, the
analytical stream is contained within the central
microporous polypropylene hollow fiber membrane,
while the sample flows through the shell side. The 2-mOATM consists of a central microporous polypropy-lene hollow fiber membrane with an external diameter
of 355 _anaand a wall thickness of 28 lain. The mem-
brane surface porosity is 45%, with an average pore
size of 0.05 larn, which corresponds to a bubble pointof 12.1 atm. The surface to volume ratio for this hol-
low fiber membrane is 133.7 cmVcm 3with a volume of
0.141 ml. The OATM provides sufficient sensitivity to
quantitate organic acid concentrations down to 50 lag/
L. Further improvements were made to lower the de-
tection limit. Foremost among these changes was el-
evation of the OATM operating temperature to -50°C.
Figure 6 shows the transfer efficiency for formic acid
as a function of the OATM temperature. Raising theoperating temperature from 20°C to 50°C resulted in a
threefold improvement in the formic acid transfer rate.
To achieve the highest sensitivity, the OAAM was
operated as a stopped flow analyzer. Operated in this
manner, sample continuously flows through the CDMand OATM at a flow rate of 0.6 ml/min, while the ana-
lyrical stream flows through an IX bed, the OATM, and
the conductivity detector at a flow rate of 0.4 ml/min.
For an analysis, the analytical stream flow is stopped
for a specified length of time and then restarted, result-ing in a stopped flow conductivity peak at the conduc-
tivity detector. The continuous passage of the low pH
sample through the OATM creates a volatile organic
acid concentration gradient between the sample and
analytical streams. Under these conditions, the concen-
tration of organic acids in the analytical stream increases
with time as volatile organic acids pass down the con-
centration gradient through the microporous polypro-
pylene membrane and dissociate in the analytical
stream. The organic acids become more concentrated
in the analytical stream as contact time increases. To
investigate this effect, the conductiometric responses
for all three low molecular weight organic acids were
determined versus different stopped flow times. These
80
._ 6o
._c
E8,0ot..)
o_ 20
0
0.2 0.4
--e.- 5 m PTFE tube (4.47 an _) _.o
3 m PDMS tube (0.22 cm s) -- -- _ .-o- _
/
//
/
//
//
± _------'_
_, • _.. _ • .; • .:. : '. :
0.6 0.8 1.0 1.2 1.4 1.8 1.8 2.0
Flow Rate (mUmin)22
5 , , , • , • • , , . . ,
L..
e-
1'-3¸
o<o2
OU.
O
7 second conlact time
0 :
2O 25'1 ' 't''' I _' ''1' 'I' '
30 35 40 45 50 55 60
Ternl:_mtum (*C)
Figure 5. Carbon dioxide degassing for PTFE and PDMS mem- Figure 6. Effect of temperature on OATM transfer efficiency forbrahe-based CDMs. formic acid.

60 AKSE, ATWATER, AND HOLTSNIDER
results are shown in Figure 7. The conductiometric re-sponse for a given organic acid concentration increased
with stopped flow time asymptotically approaching alimiting value. Although running longer stopped flow
times results in great sensitivity, a stopped flow time of
l0 min provides both a rapid response and sensitivity.
Preliminary evaluation of detection limits using the
stopped flow configuration indicated that organic acids
were adsorbed by stainless steel surfaces on the shell
side of the OATM. This limited the sensitivity level to 20
lag/L. Evidently, the protective oxide layer on the stain-
less steel surface becomes positively charged at low pHand adsorbs negatively charged formate, acetate, and
propionate ions. To correct this problem, stainless steelwithin the OATM was replaced by poly ether ether ke-
tone (PEEK), resulting in a significant improvement in
the lower limits of detection for organic acids.
ANALYTICAL RESULTS
The OAAM performance was evaluated at the lower
pH levels made possible by the improved SPA module,and in combination with the PDMS-based CDM, the
PEEK housed OATM operated at 50°C and a 10-min
stopped flow time. The flow rates for the sample and
analytical streams were 0.6 and 0.4 mL/min, respec-
tively, and the sample pH was 1.75. The conductiometric
responses for formic, acetic, and propionic acid solu-
tions with concentrations between 0.1 and 40 mg/L were
determined. These results are shown in Figure 8. Anao
70.
E_eo.09::L
50_
tj
t_ 40 ¸
--I"0 30 ¸
t-
O
t.)o 2O
_. 10.
O,
_ P_Ac_ .., ..o .....
.o
s _0 is 20 =s 30 3s 4o
Concentration (mg/[.)
Figure 8. High-level organic acid calibration curves.
lyzer response for concentrations between 0.005 and
1.20 mg/L are shown in Figure 9. Each curve was fit to
a third-order polynomial, resulting in correlation coef-
ficients of 0.9993 or better. The nonlinear analytical
response occurs because only ionized organic acids are
sensed, and as concentration is raised, a decreasing frac-
tion of organic acids become ionized. The fraction ion-
ized after transfer to an essentially deionized water (i.e.,
the analytical stream) can be determined using the acid
dissociation constant, the total concentration of organic
acid that was transferred, and assuming that the pH is
controlled by the organic acid. Under these conditions,
70,
,,-, e0.
E
=L
t_(I) 20
I:L
10
- r i_....,_ ....
6-""
- loopgn. Fon_cAdd
o 1001_t. Ac_lcAcld
4.
:4 ........................... 0 ......................... Ca ..........
_.._._
0 5 10 15 20 25 30 35
Stopped Flow Time (minutes)
Figure 7. Conductiomctric response versus stopped flow time for
various organic acids.
10
O9
8t-
eO-i"10t.--O 4O
Oh=
0.
T - -
.... o'" Fomlic Acid
-*-- Acetic Ackl ..
Propionic Acid ...'
.o
..,0_
o 200 4oo eoo eoo lOOO _2oo _,_o
Concentration (p.g/L)
Figure 9. Low-level organic acid calibration curves.
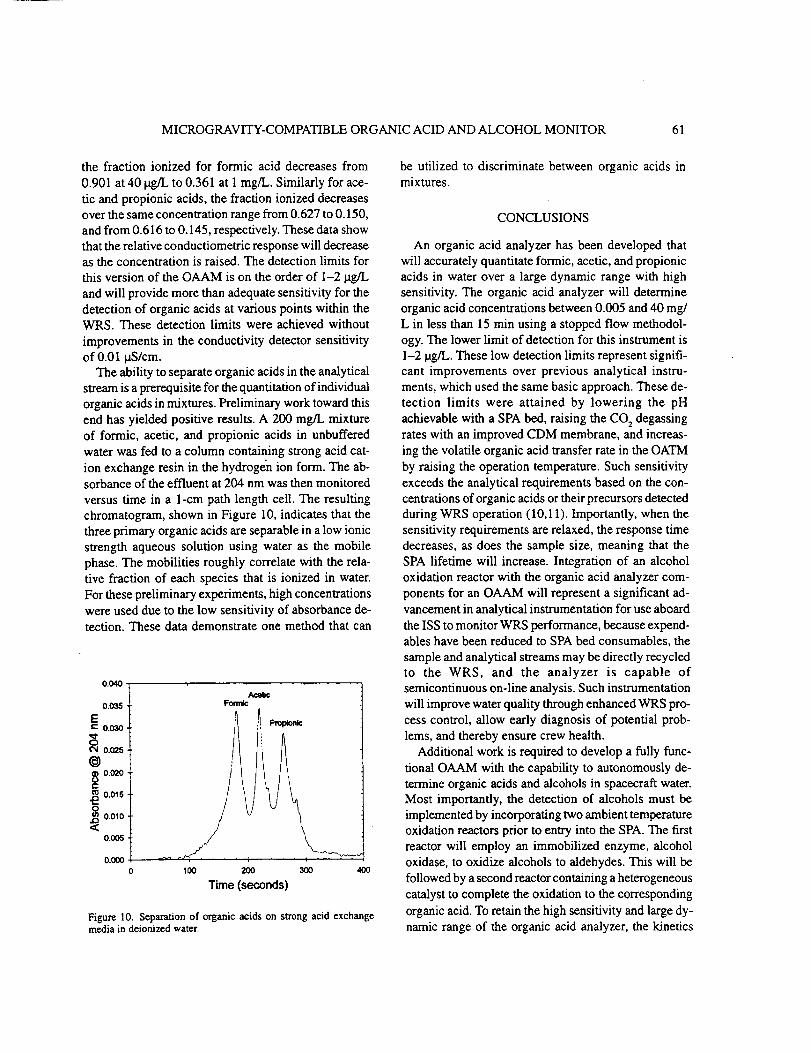
MICROGRAVITY-COMPATIBLE ORGANIC ACID AND ALCOHOL MONITOR 61
the fraction ionized for formic acid decreases from
0.901 at 40 pg/L to 0.361 at 1 mg/L. Similarly for ace-
tic and propionic acids, the fraction ionized decreases
over the same concentration range from 0.627 to 0.150,
and from 0.616 to 0.145, respectively. These data showthat the relative conductiometric response will decreaseas the concentration is raised. The detection limits for
this version of the OAAM is on the order of I-2 lag/L
and will provide more than adequate sensitivity for the
detection of organic acids at various points within theWRS. These detection limits were achieved without
improvements in the conductivity detector sensitivity
of 0.01 gS/cm.The ability to separate organic acids in the analytical
stream is a prerequisite for the quantitation of individual
organic acids in mixtures. Preliminary work toward this
end has yielded positive results. A 200 mg/L mixture
of formic, acetic, and propionic acids in unbuffered
water was fed to a column containing strong acid cat-
ion exchange resin in the hydrogen ion form. The ab-sorbance of the effluent at 204 nm was then monitored
versus time in a 1-cm path length cell. The resulting
chromatogram, shown in Figure 10, indicates that the
three primary organic acids are separable in a low ionic
strength aqueous solution using water as the mobile
phase. The mobilities roughly correlate with the rela-tive fraction of each species that is ionized in water.
For these preliminary experiments, high concentrations
were used due to the low sensitivity of absorbance de-
tection. These data demonstrate one method that can
0.040
0.035
E¢" O.030
(_1 0.(_5
@_ 0.020c
._ 0.0150
,_ 0.010
I0.000
0 100 200 300 400
Time (seconds)
Figure 10. Separation of organic acids on strong acid exchange
media in deionized water.
be utilized to discriminate between organic acids inmixtures.
CONCLUSIONS
An organic acid analyzer has been developed that
will accurately quantitate formic, acetic, and propionic
acids in water over a large dynamic range with highsensitivity. The organic acid analyzer will determine
organic acid concentrations between 0.005 and 40 m_L in less than 15 min using a stopped flow methodol-
ogy. The lower limit of detection for this instrument is
1-2 lag/L. These low detection limits represent signifi-
cant improvements over previous analytical instru-ments, which used the same basic approach. These de-
tection limits were attained by lowering the pH
achievable with a SPA bed, raising the CO 2degassingrates with an improved CDM membrane, and increas-
ing the volatile organic acid transfer rate in the OATM
by raising the operation temperature. Such sensitivity
exceeds the analytical requirements based on the con-
centrations of organic acids or their precursors detectedduring WRS operation (10,11). Importantly, when the
sensitivity requirements are relaxed, the response time
decreases, as does the sample size, meaning that the
SPA lifetime will increase. Integration of an alcohol
oxidation reactor with the organic acid analyzer com-
ponents for an OAAM will represent a significant ad-
vancement in analytical instrumentation for use aboard
the ISS to monitor WRS performance, because expend-ables have been reduced to SPA bed consumables, the
sample and analytical streams may be directly recycledto the WRS, and the analyzer is capable of
semicontinuous on-line analysis. Such instrumentation
will improve water quality through enhanced WRS pro-
cess control, allow early diagnosis of potential prob-
lems, and thereby ensure crew health.
Additional work is required to develop a fully func-
tional OAAM with the capability to autonomously de-
termine organic acids and alcohols in spacecraft water.
Most importantly, the detection of alcohols must be
implemented by incorporating two ambient temperatureoxidation reactors prior to entry into the SPA. The first
reactor will employ an immobilized enzyme, alcohol
oxidase, to oxidize alcohols to aldehydes. This will be
followed by a second reactor containing a heterogeneous
catalyst to complete the oxidation to the corresponding
organic acid. To retain the high sensitivity and large dy-
namic range of the organic acid analyzer, the kinetics

62 AKSE, ATWATER, AND HOLTSNIDER
for these oxidation reactions must be rapid, and fol-
lowing each conversion, the by-products must not be
retained on the biocatalyst or catalyst supports.
Other work must be accomplished to bring OAAM
concept to completion. First, a detection scheme for
the separation of organic acids (and alcohols) in a mixed
sample must be fully developed. This work has begun
with the chromatographic separation of organic acids
using water as the mobile phase. The OATM and CDM
must be miniaturized to reduce mass, volume, and
power, and improve performance. Miniaturized com-
ponents will improve performance primarily by reduc-
ing sample size and decreasing response time. These
components are well suited to microminiaturized lami-
nation fabrication technology in which channels and
reservoirs are produced using spin coating and photo-
resist technology, and membranes are applied as thin
sheets between layers.
ACKNOWLEDGMENTS
This work was funded by NASA Grant NAG9-1081
under the Advanced Environmental Monitoring and
Control (AEMC) program. The authors would like to
thank Dr. Darrell Jan for his support.
James R. Akse, Ph.D., currently serves as Vice President and
Director of Research and Development at UMPQUA Research
Company. Dr. Akse completed his doctoral work in physicalchemistry at Arizona State University, followed by postdoctoral
training at the University of Wisconsin, Madison. Prior to join-
ing UMPQUA, Dr. Akse was employed by North AmericanPhillips, with responsibility for the development of novel and
improved materials for electronics applications. During the past10 years, he has provided leadership in the development of novel
water reclamation systems using aqueous phase catalytic oxida-tion-reduction reactions, electrochemical methods, and has de-
veloped analytical instrumentation for ammonia and chlorinemonitoring.
James E. Atwater, President of UMPQUA Research Company,
is a Fellow of the American Institute of Chemists and the Royal
Society of Chemistry. He has more than 20 years of research
and development experience in the United States and Canada.His research interests include air purification, water reclama-
tion, solid waste treatment, disinfection, sterilization, and the
development of analytical instrumentation.
John T. Holtsnider is a senior research chemist who has worked
at UMPQUA Research Company since 1989. He received his
B.S. in Chemistry from the University of California at Santa
Barbara in 1981. John has worked on the Organic Acid and Al-
cohol Monitor project since 1999. His main research interestslie in microfluidic device fabrication for use in miniaturized
chemical systems.
REFERENCES
1. Akse, J. R.; Atwater, J. E. Advanced catalytic methods forthe destruction of environmental contaminants. Paper No.
95-LS-70, presented at AIAA Life Sciences and SpaceMedicine Conference '95, Houston, April 3-5, 1995.
2. Akse, J. R.; Jolly, C.D. Catalytic oxidation for treatment of
ECLSS & PMMS waste streams. SAE Technical Paper
Series No. 911539. Regenerative Life Support Systems &Processes, SP-873. Warendale, PA: SAE; 1991.
3. Akse, J. R.; Atwater, J. E.; Thompson, J. O.; Sauer, R. L.Reagentless flow injection determination of ammonia andurea using membrane separation and solid phase basifica-
tion. Microchem. J. 59:372-382; 1998.
4. Akse, J. R.; Atwater, J. E.; Thompson, J. O.; Sauer, R. L.
Ammonia monitor. U.S. Patent 5,882,937, 1999.
5. Atwater, J. E. Thermodynamics of the oxidation of dis-
solved organic contaminants in shuttle Orbiter humiditycondensates. J. Environ. Sci. Health A30(4):817-830; 1995.
6. Atwater, J. E.; Akse, J. R.; DeHart, J.; Wheeler, R. R., Jr.
Fiber-optic chemiluminescent biosensors for monitoring
aqueous alcohols and other water quality parameters. Fi-
nal Report NASA Contract NAS9-19021, 1994.7. Atwater, J. E.; Akse, J. R.; DeHart, J.; Wheeler, R. R., Jr.;
Verostko, C. E. Fiber-optic chemiluminescent biosensors
for monitoring aqueous alcohols and other water quality
parameters. U.S. Patent 5,792, 621, 1998.
8. Bagdigian, R.; Parker, D. S.; O'Connor, E. W. ISS waterreclamation system design. SAE Technical Paper Series
1999-01-1950, presented at the 29th International Confer-
ence on Environmental Systems, Denver, 1999.9. Carter, D. L.; Holder, D. W.; Alexandre, K.; Shaw, R. G.;
Hayase, J. K. Preliminary ECLSS waste water model. SAE
Technical Paper Series 951150, presented at the 21 st Inter-national Conference on Environmental Systems, San Fran-
cisco, 1991.
10. Carter, D. L.; Cole, H.; Habercom, M.; Grittith, G.; Slivon,
L. Determination of organic carbon and ionic accountabil-
ity of various waste and product water derived from ECLSS
water recovery tests and Spacelab humidity condensate.SAE Technical Paper Series 921313, presented at the 22nd
International Conference on Environmental Systems, Se-
attle, 1992.
11. Carter, D. L.; Bagdigian, R. M. Phase III inte_ated water
recovery testing at MSFC: Single loop test results and les-
sons learned. SAE Technical Paper Series 932048, pre-
sented at the 22rid International Conference on Environ-
mental Systems, Colorado Springs, ! 993.
12. Jolly, C. D.; Schussel, L. J.; Carter, L. Advanced develop-ment of immobilized enzyme reactors. In: Behrend, A. E;
MacElroy, R. D.; Reysa, R. P., eds. Regenerative life sup-
port: Systems & processes. Warrendale, PA: Society ofAutomotive Engineers; 1991.

MICROGRAVITY-COMPATIBLEORGANICACIDANDALCOHOLMONITOR 63
13.Jolly,C.D.; Schussel, L. J. Enzymatic catalytic beds foroxidation of alcohols. NASA Tech Briefs, May 1993.
14. Jolly, C. D. Solid phase calibration standards. U.S. Patent
5,559,035, 1996.
15. Jolly, C. D.; DeHart, J. A reagentless separator for removal
of inorganic carbon from solution. Final Report Contract
NAS8-38460, Marshall Space Flight Center, June 1990.
16. Jolly, C. D. Reagentless separator for removal of acid gases
and their hydrolysis products from solutions. U.S. Patent
5,244,478, September, 1993.
17. Sauer, R. L.; Pierre, L. M.; Schultz, J. R.; Sinyak, Y. E.;Skuratov, V. M.; Protasov, N. N.; Bobe, L. S. Chemical
18.
19.
analysis of potable water and humidity condensate: Phase
one final results and lessons learned. SAE Technical Paper
Series 1999-01-2028, presented at the 29th International
Conference on Environmental Systems, Denver, 1999.Schussel, L. J.; Atwater, J. E. A continuous alcohol oxi-
dase bioreactor for regenerative life support. Enzyme Mi-crobial Technol. 18:229-235; 1996.
Thompson, J. O.; Akse, J. R.; Wheeler, R. R., Jr.; Wisely,
M. T.; Atwater, J. E. Microgravity compatible reagentless
instrumentation for detection of dissolved organic acids inpotable water. Final Report, NASA Contract NAS9-97095,1997.