Embed Size (px)
Citation preview

1
MICROFINANCE SERVICES AND GROWTH OF SMALL AND MEDIUM
ENTERPRISES IN BUJUMBURA, BURUNDI
BY
KORICIZA BOLLAR
1164-05026-09501
A RESEARCH REPORT SUBMITTED TO THE COLLEGE OF ECONOMICS
AND MANAGEMENT IN PARTIAL FULFILLMENT OF THE REQUIREMENTS
FOR THE AWARD OF A MASTER’S DEGREE IN BUSINESS
ADMINISTRATION (FINANCE & ACCOUNTING)
OF KAMPALA INTERNATIONAL UNIVERSITY
MAY, 2019

i
DECLARATION
I do hereby declare that this research report is absolutely my original work and
has never been submitted to any university or institution of higher learning for
any award and that any ideas that are not mine but used in this research report
have been duly acknowledged.
Name: Koriciza Bollar Signature: ______________________________
Date: __________________________

ii
APPROVAL
I confirm that the work reported in this research was carried out by the
candidate under my supervision.
Name: Dr. Kibuuka Muhammad
Signature:____________________ Date:_____________________________

iii
DEDICATION
I dedicate this research work to my parents Bakanibona Pascal and Irakoze
Jacqueline, my brothers and sister Mukeze Sveta, Turashimye Bravoure, Nganji
Brunny- Tresor, Iratubona Andy Bethel, Irakoze Eloge and all the family members
for the impact they have contributed towards my education. Thank you, and May
the Almighty God bless you abundantly according to the riches of his glory in
Christ-Jesus.

iv
ACKNOWELDGEMENT First and fore most I would like to thank the almighty God for everything He has
done for me through his perfect love and grace, and I extent my sincere
appreciation to my family members, especially my parents Bakanibona Pascal and
Irakoze Jacqueline for financial support, care, love and spiritual encouragement
during my struggle to attain a Master’s in Business Administration at Kampala
International University, Uganda.
I cannot forget to extend my sincere appreciation to Dr. Kibuuka Muhammad, my
Supervisor, for the great efforts he put in while correcting me and giving me advices
for my research study. I also express my sincere thanks to all my professors at
Kampala International University for I have learnt so much from them during my
Master's degree fulfillment, and my special thanks go to the professor Assoc
Emenike Kalou .O who provided me with advice and criticism on selected parts of
the research work; I appreciate all the comments received and made good use of
them from him.
I cannot forget to thank the head of department of finance and accounting at
Kampala International University Dr. Kirabo Joseph who helped me a lot for the
advancement and the process of completing my Research work.

v
TABLE OF CONTENTS
DECLARATION ...................................................................................................... i
APPROVAL ........................................................................................................... ii
DEDICATION ...................................................................................................... iii
AKNOWELDGEMENT ........................................................................................... iv
TABLE OF CONTENTS .......................................................................................... v
LIST OF TABLES ................................................................................................ viii
LIST OF FIGURES ............................................................................................... ix
ABBREVIATIONS AND ACRONYMS ........................................................................ x
ABSTRACT .......................................................................................................... xi
CHAPTER ONE ..................................................................................................... 1
INTRODUCTION .................................................................................................. 1
1.0 Introduction ................................................................................................... 1
1.1 Background to the study ................................................................................. 1
1.1.1 Historical perspective ................................................................................... 1
1.1.2 Theoretical perspective ................................................................................ 5
1.1.3 Conceptual perspective ................................................................................ 6
1.2 Statement of the problem ............................................................................... 8
1.3 Purpose of the study .................................................................................... 10
1.4 objectives of the study ................................................................................. 10
1.5 Research questions ...................................................................................... 10
1.6 Hypothesis ................................................................................................... 10
1.7 Scope of the study ....................................................................................... 11
1.8 Geographical Scope ...................................................................................... 11
1.9 Significance of the study ............................................................................... 11
CHAPTER TWO .................................................................................................. 13
REVIEW OF LITERATURE ................................................................................... 13
2.0 Introduction ................................................................................................. 13
2.1 Theoretical review ........................................................................................ 13

vi
2.1.1 The pecking order theory ........................................................................... 13
2.3 Conceptual framework .................................................................................. 17
2.4.1 Loan provision and growth of Small medium enterprises .............................. 20
2.4.2 Savings mobilization and growth of small and medium enterprises ............... 22
2.3.3 Financial skills training and growth of small and medium enterprises ............ 25
2.5 Research gaps of the study ........................................................................... 28
CHAPTER THREE ............................................................................................... 29
METHODOLOGY ................................................................................................. 29
3.0 Introductions ............................................................................................... 29
3.1 Research Design .......................................................................................... 29
3.2 Target Population ......................................................................................... 29
3.3 Sample size.................................................................................................. 30
3.4 Sampling procedures .................................................................................... 30
3.5 Data collection instruments ........................................................................... 31
3.6 Validity and reliability of the research instruments .......................................... 31
3.6.1 Validity ..................................................................................................... 31
3.6.2 Reliability .................................................................................................. 32
3.7 Data collection procedures ............................................................................ 33
3.8 Data analysis ............................................................................................... 33
3.9 Ethical considerations ................................................................................... 35
CHAPTER FOUR ................................................................................................. 36
PRESENTATION, ANALYSIS AND INTERPRETATION OF RESULTS ......................... 36
4.0 Introduction ................................................................................................. 36
4.2 Profile of respondents ................................................................................... 37
4.2.1 Gender of respondents .............................................................................. 37
4.1.2 Age of respondents ................................................................................... 37
4.1.3 Education background of the respondents ................................................... 38
4.1.4 Marital status of respondents ..................................................................... 39
4.2 Description of effectiveness of Microfinance services in Small and Medium
Enterprises in Bujumbura ................................................................................... 39

vii
4.3 Correlation Analysis of Microfinance services and Growth of SMEs ................... 47
4.4 Testing of Hypotheses: Effect of Microfinances services and growth of small and
medium enterprises in Bujumbura, Burundi ......................................................... 49
4.5 Multiple Regression Analysis of Microfinance services and growth of Small and
medium enterprises ........................................................................................... 51
CHAPTER FIVE ................................................................................................... 53
DISCUSSIONS, CONCLUSION AND RECOMMENDATION ....................................... 53
5.0 Introduction ................................................................................................. 53
5.1 Discussion.................................................................................................... 53
5.1.1 Effect of Loan provision on the growth of Small and Medium scale Enterprise in
Bujumbura ........................................................................................................ 53
5.1.2 Effect of Savings Mobilizations and Growth of SMEs in Bujumbura ................ 54
5.1.3 Effect of financial skills training and growth of SMEs in Bujumbura, Burundi .. 55
5.2 Conclusions .................................................................................................. 56
5.4 Contribution to knowledge ............................................................................ 58
5.5 Suggested Area for further Research ............................................................. 58
5.6 Limitations of the study ................................................................................ 59
REFERENCES ..................................................................................................... 60
APPENDIX I: TRANSMITTAL LETTER ................................................................... 68
APPENDIX II: INTRODUCTION LETTER ............................................................... 69
APPENDIX III: INFORMED CONSENT .................................................................. 70
APPENDIX IV: RESEARCH INSTRUMENT: ............................................................ 71
QUESTIONNAIRE ............................................................................................... 71

viii
LIST OF TABLES
Table3.1: Sample Size ........................................................................................ 30
Table 3.2. Internal Consistence Results of Composite Reliability ............................ 32
Table 4.1: Response Rate of the Questionnaire .................................................... 36
Table4.2: Gender characteristics of Respondents ................................................. 37
Table 4.3: Age characteristics of Respondents ..................................................... 37
Table 4.4: Education characteristics of Respondents ............................................ 38
Table 4.5: marital status of respondents .............................................................. 39
Table 4.6: Mean and standard deviation showing Loan provision in the growth of
SMEs in Bujumbura ............................................................................................ 40
Table 4.7. Mean and standard deviation showing Savings Mobilizations in
Burundi’SMEs in Bujumbura ................................................................................ 41
Table 4.8. Mean and standard deviation showing Financial skills training in
BUJUMBURA’ SMEs. ........................................................................................... 43
Table 4.9. Mean and standard deviation showing Growth of SMEs in Bujumbura .... 45
Table 4.10. Pearson Correlation between Microfinance services Vs Growth of SMEs in
Bujumbura Burundi ............................................................................................ 48
Table4.11: Shows Regression Analysis on Loan Provision and Growth of SMEs ...... 49
Table 4.12: Shows Regression Analysis for Savings Mobilisations and Growth of SMEs
......................................................................................................................... 50
Table 4.13: Shows Regression Analysis for Financial Skills training and Growth of
SMEs ................................................................................................................. 50
Table 4.14: Results of multiple regression analysis ............................................... 51

ix
LIST OF FIGURES
Figure 1: Conceptual framework ......................................................................... 17

x
ABBREVIATIONS AND ACRONYMS
BNDE: Banque National de Développement Economique
MFI: Microfinance Institution
RIM: Réseau des institutions Microfinance
SME: Small and Medium Enterprise
DIFO: Development Inter-people Finance Operations
OECD: Organisation for Economic Co-operation and Development
ISTEEBU: Institut des Statistiques et Etudes Economiques du Burundi.
FORCE: Fonds pour la Relance les conseils et les echanges en Microfinance.
OBR: Office Burundais des Recettes
UGX : Uganda shilling
PLCC : Pearson linear correlation coefficient
CVI: content valid index

xi
ABSTRACT
This study investigated the effect of microfinance services on the growth of small and medium enterprises in Bujumbura, Burundi. The study was undertaken in Ngagara, Rohero and Buyenzi districts in Bujumbura. Loan Provision, Savings mobilisation and financial skills training were three services provided by Microfinance examined in this study. The objectives were to determine how Loan provisions affect the growth of SME, how the mobilisations of savings affect the growth of SMEs and how financial skills training affect the growth of SME. A sample of 173 owners of SME beneficiaries of Microfinance services located in Bujumbura were respondents to this study. The researcher made questionnaire which was used as the main instrument of data collection. Descriptive research design was used with a quantitative approach. The Pearson linear correlation coefficient, simple linear regression and multiple regression analysis were used to analyse data. The findings revealed that there was a significant positive linear relationship between loan provision and growth of SMEs, with a PLCC of 0.869 at p<0.05 level of significance. A strong positive relationship between mobilisation of savings and growth of SMEs was found with a PLCC of 0.846 (p<0.05) level of significance. Moreover, there was a significant positive linear relationship between financial skills training and growth of SMEs in Bujumbura, Burundi at a PLCC of 0.864(p<0.05). Loan provision affected growth of small and medium enterprises in Bujumbura by 75.2%; implying a very high effect. Savings mobilisation had a 71.4% effect on the growth of small and medium enterprises, thus a very high effect as well. The researcher concluded that credit finance delivered by Microfinance Institution to small and medium enterprises in Bujumbura positively affect the growth of small and medium enterprises. Access to loans through microfinance will help SMEs to get more income. The positive nature of the effect meant will strengthen savings by improving accessibility to the savings services and it will translate into a significant improvement in the business registered by the SMEs in terms of sales revenue, profitability, sales expansion and job creation. It is recommended that small financing institutions such as Microfinance Institutions to small and medium enterprises in Bujumbura should encourage the growth of small and medium enterprises by promoting soft loans to entrepreneurs. Contribution to knowledge of this study is the fact that it provided a better understanding of microfinance policies and how access to them can contribute to development of small and medium enterprises in Africa in general and particular to eastern countries. The study generated useful insights that can be used by the government and non-governmental organizations to promote the accessibility of credit to SMEs from MFIs and improving the microfinance policies focusing on financial growth in developing countries.

1
CHAPTER ONE
INTRODUCTION
1.0 Introduction
This part of the research work entails the background to the study, statement of
the problem, purpose of the study, objectives of the study, research questions,
and scope of the study, conceptual framework and significance of the study.
1.1 Background to the study
1.1.1 Historical perspective
The role played by microfinance has aroused a particular and considerable
interest in the communities of all over the world especially among the political
decision-makers, the researchers in the academic circles, etc. Microfinance
services have become significantly important globally and more preferably at
national levels in developing countries. Microfinance has evolved as an economic
development approach intended to benefit low income men and women (Ubom,
2003). According to Asiama (2007), Microfinance encompasses the provision of
financial services and the management of small amounts of money through a
range of products and a system of intermediary functions that are targeted at
low income clients. Across developing countries, small enterprises are turning to
Microfinance Institutions for an array of financial services (Ngugi & Kerongo,
2014). On the other hand, the services provided by nonfinancial MFIs are
marketing and technology services, business training, production training and
subsector analysis and interventions (Ledgerwood, 1999). From a historical point
of view, Microfinance was first trumpeted as a way to unleash the productive
capacities of poor people dependent on self-employment (Hulme and Mosley
1996). The idea on the role of microfinance was straightforward: microfinance
would transform customers’ businesses by providing capital; that would increase
borrowers’ earnings and ultimately eliminating poverty (Yunus, 2016).
The starting date of the global microfinance movement is debated. Some look to
antecedents in 19th century credit cooperatives (Banerjee, et al. 1994). Others
2
point to seeds in informal financial mechanisms like rotating saving and credit
institutions (Rutherford, 2009). But the modern microfinance movement dates to
Accion international in Latina America and to Muhammad Yunus’s early
microcredit experiments in 1976, in Bangladesh forty years ago. Those
experiments led to the establishment of Grameen Bank in Bangladesh under an
official ordinance in 1983, which in turn inspired the first global Microcredit
Summit Campaign, launched in February 1997 at a summit in Washington, DC,
attended by over 2,900 delegates from 137 countries (Robert and Johnathan,
2017). According to Idowu (2010), a major impediment to rapid development of
the small and micro enterprises sector is an absence of both debt and equity
financing. Accessing finance has been identified as a key element for small and
medium enterprises to thrive in their drive to build productive capacity, to
compete, to create jobs and to contribute to poverty alleviation in developing
countries (Hulme and Mosley, 1999).
SMEs play an important role in developing country to a higher level. According to
Schlogl (2004), he stated that small and medium-sized firms dominate our
economies in terms of employment and number of companies, yet their full
potential remains remarkably untapped. Although there is a broad assumption
stating that SMEs generally has positive effects on country economic growth, the
notion of economic imperatives for SMEs remains largely untested (Schlogl,
2004). Westhead and Storey (1996) noted the characteristics which distinguishes
small organizations form larger ones other than size itself is that of uncertainty.
For the small organization external uncertainty has affected the most such as
lack of power and influence in a market place, larger customer and vulnerability.
Snell and Lau (1994) found that more management competencies are required
for growth in small organization compared to larger organizations. In this
situation, small organization failed to develop skills, knowledge and competencies
among workers in the small organization. This is mainly because of financial
constraints and insufficient training. Small organization especially managers
required the most training, Therefore training is an essential tool for developing

3
employees and the organizations (Gupta and Cawthon, 1996). SMEs are
frequently at a disadvantage relative to their larger counterparts regarding their
abilities to attract, retain, and motivate the best human resources (Beaver and
Hutchings, 2005).
Africa’s microfinance industry has been growing. The continent’s asset increased
and has been in line with a worldwide trend of a growing industry (Thorsten and
Samuel, 2012). For a little more than a decade, in Africa as well as elsewhere in
the world, microfinance has attracted some attention to the advancement of
women (Beck et al, 2010). According to Beck et al (2012), one of the most
obvious reasons why microfinance has focused on women, especially in its
infancy, is the disproportionate effect of poverty on them. In Africa overall, the
median ratio of women to total borrowers has been constantly above 50 percent
and peaked around 78 percent, both in 2005 and in 2010 (World Bank, 2013). In
east Africa, professionalization of the microfinance sector, increased competition
in urban areas (also from commercial banks offering microfinance) and the
adoption of new technology are driving the outreach of savings and credit
services into rural areas (Ayele, 2015). SMES provide a wide range of financial
services to low-income clients, including self-employed and low earning
individuals who are working in informal sectors. The core objective of
microfinance is to create a favorable environment for the low income self-
employed and near-poor households in which they have permanent access to an
appropriate range of high quality financial services, including not just credit but
also savings, insurance, and general banking services. Microfinance provides a
comprehensive range of financial services to the "unbanked people" working in
informal sectors which best fits their needs and affordability (Stiglitz J., 2014).
However, the very remoteness of certain areas, the high costs of services,
financial illiteracy, and the unsuitability of financial products for agriculture
restrict the reach of microfinance to women (Bhutt and Tang, 2001). Moreover,
since the early 2000s, the governments of many East African states including
Kenya, the United Republic of Tanzania and Uganda have made microfinance a

4
pillar of their agricultural and rural development strategies (International Trade
Center, 2011).
In Burundi, Microfinance increased in popularity in 2015(Reseau des Institutions
Microfinances au Burundi, 2017). According to Reseau des Institutions
Microfinances in Burundi (2017), the number of low-income households,
individuals and entrepreneurs using responsive financial products and services is
growing dramatically. For Burundi, the figures were estimated at 1 million
customers for financial services in 2015(World Bank, 2017). Microfinance has
promoted an increase in per capital income and improved the schooling rate of
children in households. The percentage of women beneficiaries of MFI services
has increased, as has the penetration rate (Ndayishimiye, 2012). The products
offered by microfinance institutions have diversified and include in addition to
credit and savings services, life insurance, death insurance, health insurance
(Ngendahayo, 2012). The field of microfinance in Burundi brings together
stakeholders of various kinds, ranging from the informal sector to the formal
sector (Republique du Burundi Minnstere des Finances, 2015). At the level of the
informal sector, endogenous savings and credit practices exist in both rural and
urban areas. These practices exist mainly in the form of mutual aid, tontines and
usurious loans. These are generally promoted by individuals and interest rates
are very high, even up to 200% per year (Nkurunziza et al, 2012). In spite of the
increased influence of microfinance, the said institutions have problems to cope
with which are among others, Methods of evaluating loan applications,
monitoring loans to ensure immediate and regular recovery are aspects that are
not well understood (Mariama and Didier, 2017). Furthermore, according to
Mariama and Didier (2017), the material guarantee is practically non-existent
among the poor populations targeted by micro-credit. This situation poses a
significant risk for MFIs as it becomes difficult to protect depositors' savings and
MFI resources against defaulting debtors. For several reasons in Burundi, MFIs
felt the need to have a framework for reflection and consultation to discuss their
policy and intervention strategy (Banque de la Republique du Burundi, 2012).

5
This is why a group of initiatives has decided to form a "Network of Microfinance
Institutions" (RIM) to develop mechanisms for professionalizing the sector and
establishing a sustainable partnership system.
SMEs subsequently provide different services to a client, most commonly in the
form of a loan. These services lead to the client modifying her/his
microenterprise activities which in turn lead to increased or decreased
microenterprise income. The change in microenterprise income causes changes
in household income which in turn leads to greater or lesser household economic
security. The modified level of household economic security leads to changes in
the morbidity and mortality of household members, in educational and skill levels
and in future economic and social opportunities. Loans are delivered following
the minimalist approach where the requirements for loans are not often difficult
to meet by customers; little collateral, character and co-signing for loans
between members. These loans are usually loans within the savings of the
member (Schmidt, 2014).
In order for SMEs to remain afloat, they need to realign and reposition
themselves at the marketplace. MFIs must adopt and come up with varied
innovative market survival strategies to avoid being edged out by the big boys.
Therefore, SMEs should capitalize on the already existing competitive advantage
and long relationship they have had with the SMEs such as Small And Medium
Enterprises In Bujumbura, Burundi to have a cutting- edge over the other
financial institutions. All they need to do is streamline and improve on the speed
and quality of service delivery by providing demand-driven and market
responsive services and/or products.
1.1.2 Theoretical perspective
The study was mainly based on the pecking order theory advanced by Myers
(1984). Furthermore, in the context of this topic, the literature review includes
one more theory which is the Goal setting theory.

6
Pecking order theory (Myers, 1986) states that companies prioritize their sources
of financing according to the cost of financing. Hence, internal funds are used
first, and when that is depleted, debt is issued, and when it is not sensible to
issue any more debt, equity is issued. The pecking order theory has been judged
relevant to be used in this study by the researcher because it emphasizes the
reasons why economic agents use of microfinance services namely credit and
saving service. Indeed, companies’ recourse mainly on two sources of financing
in funding their business which are either internal or external financing funds.
The internal source of finance supposes the availability of retained earnings or
profit and imply the use of savings. On the other hand, external means of finance
imply contractions of credit for the SMEs so that by these credits SMEs can
finance the activities of their business.
Another theory has been used to justify and explain the need of an owner or
employee of a SME to resort to financial literacy or financial skills training. This
theory is the goal setting theory. Goal-setting theory refers to the effects of
setting goals on subsequent performance. Researcher Edwin Locke (1986) found
that individuals who set specific, difficult goals performed better than those who
set general, easy goals. Locke proposed five basic principles of goal-setting:
clarity, challenge, commitment, feedback, and task complexity.
1.1.3 Conceptual perspective
Microfinance is the provision of a broad range of financial services such as
deposits, loans, payment services, money transfers and insurance products to the
poor and low-income households, for their microenterprises and small
businesses, to enable them to raise their income levels and improve their living
standards. According to Robinson (2001), microfinance refers to small-scale
financial services–primarily credit and savings–provided to people who farm or
fish or herd; who operate small enterprises or microenterprises where goods are
produced, recycled, repaired, or sold; who provide services; who work for wages
or commissions; who gain income from renting out small amounts of land,

7
vehicles, draft animals, or machinery and tools; and to other individuals and
groups at the local levels of developing countries, both rural and urban.
Microfinance services: Microfinance is the supply of basic financial services to
poor and low-income households and their small enterprises (Srininvasan and
Sriram, 2012).
According to Robert and Johnathan (2017), Microfinance broadly refers to the
provision of small loans without collateral security, to the poor and low-income
households, whose access to the commercial bank is limited. According to those
authors, they hold that many are turning to broader notions like “financial
inclusion” that bring microfinance together with efforts to provide saving,
insurance, and payment services in under-served communities. This broadening
should also inspire an expanded vision for microfinance itself.
According to Srininvasan and Sriram (2012), Microfinance services comprises
several financial tools such as savings, credit, leasing, insurance and cash
transfers. These services are provided by a variety of institutions, which can be
broadly divided into banks, NGOs, credit and savings cooperatives and
associations, and non-financial and informal sources. These services provided by
MF can help build financial and business management capacity of rural
households, improve their technical skills and provide local support services for
enterprises. This research focused on three services provided by microfinance,
namely, provision of loans, savings mobilizations and financial skills training.
Small and medium enterprises (SMEs): According to the Organization for
Economic Cooperation and Development (2005), Small and medium-sized
enterprises (SMEs) are non-subsidiary, independent firms which employ fewer
than a given number of employees. This number varies across countries. The
most frequent upper limit designating an SME is 250 employees, as in the
European Union. However, some countries set the limit at 200 employees, while
the United States considers SMEs to include firms with fewer than 500
employees.

8
In Uganda according to Uganda Investment Authority (2015), a ‘Micro Enterprise’
is an enterprise employing up to four people, with an annual sales/revenue
turnover or total assets not exceeding Uganda shillings 10 million. On the other
hand Small Enterprises employ between 5 and 49 and have total assets between
UGX: 10 million but not exceeding 100 million. The Medium Enterprise therefore,
employs between 50 and 100 with total assets more than 100 million but not
exceeding 360 million (Uganda Investment Authority ).
Growth: the variable refers to the increase in the inflation-adjusted market
value of the goods and services produced by an enterprise over time. It is also a
process of overall business development (Johnson, 2008).
The researcher adopted three proxies of SMEs’ growth, which are increase in
productivity, employment creation, and sales growth.
1.1.4 Contextual perspective
The creation of two important organizations in Burundi, Reseau des institutions
Microfinances(RIM) et Fonds pour la relance les conseils et les echanges en
Microfinance(FORCE), created in 2006 and 2007 respectively, has positively
impacted the existence of microfinances in Burundi in that way that the two
institutions (RIM and FORCE) aim to promote strong microfinance institutions
that better meet the needs of low-income populations through the provision of
viable and efficient financial services to the low-income population(Banque de la
republique du Burundi’annauals,2010). In terms of indicators according to
Reseau des Institutions Microfinances au Burundi(2011), the data collected within
microfinance institutions showed that Over the 2006-2008 period, the increase in
outstanding loans was 100%, rising from FBu 14 173 075 189 to Fbu 28 740 431
405. The number of borrowers evolved almost in the same proportion during this
period, from 63,051 to 104,021 (RIM report, 2010).
The Institute of statistics and economics of Burundi ‘publications (2015) on Small
and Medium-sized Enterprises showed that there are 3016 SMEs registered by
the Burundian Revenue Authority (OBR) in the Whole country and 30% are

9
located in the urban capital of Bujumbura. Many of these SMEs are located in
districts such as quartier Ngagara, quartier Buyenzi, and quartier Rohero. Most
of those enterprises hold businesses such as food shop, pharmacy, construction
store. Small businesses are considered to be the driving force of economic
growth, job creation, and poverty reduction in developing countries. Thus this
research investigated on the companies established in Bujumbura in order to
establish the relationship of microfinance credit facilities and its impact on the
growth of small medium enterprises.
1.2 Statement of the problem
Microfinance has been created in response to the missing credit market to
support SMEs. In developing countries most recently for instance, governments
are also incorporating microfinance in their strategies towards achieving the
Millennium Goals that involves halving extreme poverty through the
implementation of SMEs by the target date, which is 2030 (Masudur & Laila,
2014). This policy seeks to make financial services available on a sustainable
basis to the economically active poor, low-income earners and Micro, Small
and Medium enterprises (MSMEs) through privately owned banks.
Despite the implementation of the above policy and the fact that many
Burundians are exposed to many entrepreneurial skills and information to
promote their business and projects through MFs, many SMEs in Burundi have a
problem of producing a sustainable growth for their business. The major causes
of failure to growth of SMEs in Burundi is lack of capital and lack of other
financial services because many people do not have access to financial services
offered by commercial banks. The low level of education and access to higher
education of the Burundian population also hinder the growth of SMEs. This is in
line with Yasin (2013) who argued that several factors account for failure of
SMEs to grow. The evidences of the failure to growth of SMEs in Burundi is that
many SMEs in Burundi usually experience stagnated development (World Bank,
2016), very few of them have expanded sales, profits or opening up branches

10
and few transformed to medium enterprises. Furthermore, inadequate finances
and access to financial services reach the business owners of SMEs in Burundi,
hence the need for this study to assess whether access to microfinance services
through loan provision, savings mobilisations and financial skills training have an
impact on the growth of small and medium enterprises in Burundi.
1.3 Purpose of the study
The purpose of this research was to establish the effect of microfinance services
on the growth of small and medium enterprises in Burundi.
1.4 objectives of the study
i) To determine the effect of loan provision on the growth of small and medium
enterprises in Bujumbura.
ii) To assess the effect of savings mobilisation by MFIs on the growth of small
and medium enterprises in Bujumbura.
iii) To establish the effect of financial skill training on the growth of small and
medium enterprises in Bujumbura.
1.5 Research questions
i) Does provision of loan significantly affect the growth of small and medium
enterprises in Bujumbura, Burundi?
ii) Does savings significantly affect growth of small and medium enterprises in
Bujumbura, Burundi?
iii) Does provision of financial skills training significantly affect the growth of
small and medium enterprises in Bujumbura, Burundi?
1.6 Hypothesis
Ho1: Loan provision in Burundi has no significant effect on growth of small and
medium enterprises.
Ho2: Saving mobilisation in Burundi has no significant effect on growth of small
and medium enterprises.

11
Ho3: Provision of financial skill training in Burundi does not significantly affect the
growth of small and medium enterprises.
1.7 Scope of the study
1.7.1 Subject scope
The subject of this study dwelled on effect of Microfinance services on the
growth of small and medium enterprises. The study was based on the services
provided to small enterprises namely loans provisions, savings mobilisations and
financial training and the way they affect growth of SMEs in Bujumbura, Burundi.
1.8 Geographical Scope
This research has been conducted in Bujumbura, Burundi. Therefore, the
research consisted in identifying and locating the owners of SMEs who run their
business in Bujumbura in order to administrate them questionnaires that have
been used in this research. According to the Institute of statistics and economics
of Burundi yearbooks (2015), many SMEs are located in Rohero district, Buyenzi
district and Ngagara district. Thus the research concentrated in those districts
because this is where several kind of business are presented and located.
Furthermore, in those districts area, are enterprises that either doing well or
companies that are struggling to survive and producing growth.
According to the institute of statistic and economics of Burundi ‘annuals(2015),
most of the SMEs which are concentrated in Bujumbura are primarily office,
printing, catering, patisserie, retail and specialized store, pharmacy, photographic
activities, accommodation enterprises.
1.9 Significance of the study
The findings of the study is going to enable micro finance institutions to better
understand their role in the growth of SMEs in Burundi, in order to implement
better and effective programs. In fact, the research provided information to the
MFIs in Burundi. This might act as a basis upon which they would know the
extent to which their services impact on the financial performance of Small and

12
Enterprises. MFIs would therefore be in a position to provide the services in a
way that might improve the financial performance of SMEs.
The recommendations that were made, are addressed to the MFI industry in
Burundi but would also inspire other MFIs established elsewhere than in that
country. The study might assist small and medium enterprises by opening their
eyes to alternative sources of finance and probably giving them a better chance
of survival, growth and success in the global competitive corporate setting. The
findings of this research are of importance to the government of Burundi as well.
The findings of the study provide information that the government mght utilize in
analysing services offered by the micro financial sector to small medium
enterprises. The government of Burundi could be using this research paper in
setting up specific management policies that enhance effectiveness and
sustainability of SMEs in Burundi. The study is also of significance to scholars in
understanding the level of Small and scale enterprises development in Burundi.
In addition, interested academicians especially in entrepreneurship can use the
findings to understand the issues raised on the role of MFIs and use them as
reference material or basis for further research in relation to this study.
Furthermore, this research has given to the researcher an opportunity to
contribute to the existing knowledge in the domain of microfinance institution.
13
CHAPTER TWO
REVIEW OF LITERATURE
2.0 Introduction
This chapter reviews existing literature that is related either directly or indirectly
to the study on microfinance services and growth of Micro small and medium
scale enterprises.
2.1 Theoretical review
Two theories were noted to be essential in explaining the relationship between
microfinance services and SME growth and why firms considered using credit and
savings. The theories include pecking order theory and the Goal setting theory.
2.1.1 The pecking order theory
When analysing the literature review in this research, the researcher found it
better to take the pecking order model as one of the pillars on which we would
base our study because it seems to better reflect the reasons for which
individuals come on to solicit micro-credit services such as credit services (Loan)
and savings services from MFIs or other financial institutions such as banks and
others.
The pecking Order theory was developed by Myers C.S (1984). It sheds light on
the incentives that drive SMEs capital structure decisions. This theory proposes
that firms prefer to use internal sources of capital first and resorted to external
sources only if internal sources are inadequate. One of the aspects of pecking
order theory implies that when it comes to profitable firms, they would always
prefer internal financing rather than taking up new debts or equity. However,
more often than not, internal financing is usually not adequate unlike in older
firms which by definition have had more opportunities to accumulate retained
earnings than younger companies and thus more funds are available to finance
operational growth. Pecking order theory suggests that those funds should be
used before external capital sources are tapped. Holmes and Kent (1991) found
that small businesses experience are a more intense version of pecking order in

14
their decisions because access to appropriate external sources of capital is
limited. It has been noted that small businesses’ differ in their capital structure
but their intense reliance on pecking order is only one of the variables that make
small businesses financing decision unique.
Hence, pecking order theory has two important empirical implications. First, it
predicts that internal cash should be the primary source of funds for firms.
Second, debt should be more common as an external financing choice than new
equity, which should be used only after all other sources have been exhausted.
This theory of Pecking Order posits that management prefers to finance first
from retained earnings, then with debt, followed by hybrid forms of finance such
as convertible loans, and last of all, by using externally issued equity; with
bankruptcy costs, agency costs, and information asymmetries playing little role in
affecting the enterprise’s capital structure policy (Whonderr-Arthur, 2009). This
theory was adopted because many researches indicated that most of the SMEs
make financial structure decisions following its rationale (Wilson, Larson, &
Jacobson, 2014). Most SMEs’ financing structure follows this theory because its
rationale is consistent with the fact that they are mostly managed by their
owners who do not want to dilute their ownership by rushing into using sources
of finance that reduce this ownership. Owner-managed businesses usually prefer
retained profits because they want to maintain the control of assets and
operations (Makhbul, 2011). Preferring to use retained profits alludes to the fact
that the owners of these businesses want to use savings; for savings are what
essentially constitutes retained profits that is, money that remains after a
business has cleared all its expenses, including payments to its operators and
employees (Fabayo, 2009). Savings services generate equity funds that not only
boost the capital base of the SMEs but also maintain high levels of leverage that
give owners’ enough clout over their business assets and decisions (Whonderr-
Arthur, 2009).
According to Pecking Order Framework, SMEs’ managers’ preference for savings
is hinged not only on the fear to lose some control over business assets and

15
operations. It is also based on the fact that using savings services is the best
way of avoiding the cost of capital associated with other types of financing,
which many SMEs not only find too difficult to afford but also adverse to the
attainment of their business goals as desired (Whonderr-Arthur, 2009). With
savings services, capital is accumulated without incurring interest expenses and
loan repayments based on strict schedules that tend to weigh the SMEs down,
thereby making them fail to realize their business goals (Söhnke, Gregory &
Waller, 2013). The accessibility of savings services is therefore envisaged to
have a favorable effect on the realization of desired business goals.
When lending to small businesses, most financial institutions require the owners
of the small businesses to personally guarantee the loan. These personal
guarantees allow the institution recourse against the personal wealth of the small
businesses owner in the event of default (Berger and Udell, 1998). These
restrictions on the type of finance available to SMEs coupled with the small firm‘s
insistence on first using internal sources of capital (Holmes and Kent, 1991),
creates a unique structure for small business. Romano, et al., (2001) describe the
situation as a complex array of factors that influence small to medium size
enterprises (SME) owner-manager‘s financing decisions. This is supported by Hall
et al. (2000) who found that firm‘s size is positively related to long-term debt and
negatively related to short-term debt. In further support, Chittenden et al. (1996)
suggest that a firm‘s size is correlated with the firm‘s reliance on pecking order
theory in capital structure decisions. Thus, smaller firms are more likely to rely on
internal funds. Romano et al. (2001) found a significant relationship between the
size of the firm and the use of debt. Again, these results are consistent with
pecking order theory and the Berger and Udell (1998) model.
Thus, with the theory of pecking order model, we can understand and predict the
behavior of SMEs in accessing to Microfinance services such as Credit and saving
services. Indeed most of SMEs’ owners sought to use their own means of
financing which are internal to the company such as retained earnings (implying
the use of saving services), and as these means of internal financing are

16
sometimes very minimal and inadequate, SMEs sought to find another means of
financing that would be external to the enterprise via debt which is in some cases
provided by MFIs in form of loan.
2.1.2 Goal Setting Theory
Goal setting theory (Locke & Latham, 199O) is based on the simplest of
introspective observations, namely, that conscious human behavior is purposeful.
It is regulated by the individual’s goals. Goal directedness, however,
characterizes the actions of all living organisms including those of plants. Thus
the principle of goal-directed action is not restricted to conscious action.
Goal setting theory is grounded in the belief that conscious goals and intentions
drive results. Based on the goal setting theory of motivation, Locke (1986) and
Locke and Latham (1990) find that individual goals are likely to determine how
well they perform to related tasks. Specifically, clearly defined and more
challenging goals yield higher performance than vague, easy or do-your -best
goals. To be effective, goal setting theory assumes that individuals must be
committed to the goal, must get feedback and must have the ability to perform
the task. This means that financial literacy training programs should be more
effective when they are motivated by perceptions and concerns about financial
well-being later in life.
The domain of goal setting theory lies within the domain of purposefully directed
action. The theory focuses on the question of why some people perform better
on work tasks than others. If they are equal in ability and knowledge, then the
cause must be motivational. Goal setting theory approaches the issue of
motivation from a first-level perspective; its emphasis is on an immediate
level of explanation of individual differences in task performance (Ryan,
1970). The theory states that the simplest and most direct motivational
explanation of why some people perform better than others is because they
have different performance goals.

17
Motivational and goal seting theory suggest that measures of financial literacy
should be related to financial behavior that is in the consumers‟ best interests.
Hilgert, Hogarth and Beverly (2003) formed a Financial Practices Index based
upon (self-benefiting) behavior in cash flow management, credit management,
saving and investment practices. When they compared the results of this index
with scores on financial literacy quiz, they found a positive correlation between
financial literacy scores and Financial Practices Index Scores. Their results
suggest that financial knowledge is related to financial practices.
2.3 Conceptual framework
The conceptual framework in this study shows the logical sense of how the
independent and dependent variables are connected and emphasizes the
different factors involved in the relationship between Dependent Variable and
Independent Variable. The independent variables were defined on the concepts
of loan provision, savings mobilization and financial training while the variable
dependent is defined on the concepts of profitability, customer satisfaction and
economic empowerment and livelihood to conceptualize the growth small
medium and scale of enterprises.
Independent variable Dependent Variable
Figure 1: Conceptual framework
Source: Conceptualised based on Microfinance and Economic development
(Robert and Johnattan, 2017).
Loan provision: it is defined in finance as the lending of money from one
individual, organization or entity to another individual, organization or entity.
Microfinance Services
Loan provision
Savings mobilization
Financial skills
training.
Growth of small medium
enterprises
Profitability
Increased in sales
Employment creation

18
According to Thembi (2012), loan is a financial transaction in which one party
(the lender) agrees to give another party (the borrower) a certain amount of
money with the total expectation of repayment agreed upon by both parties.
Usually there’s a predetermined time for repaying a loan with conditions attached
to it. According to Signoriello and Vincent (1991), a loan entails the reallocation
of the subject assets for a period of time, between the lender and the borrower).
This variable provided quantitative data that shows the effect of loans provided
by MFIs on the growth of small and scale enterprises.
Savings mobilisations: Within personal finance, the act of saving corresponds
to nominal preservation of money for future use. A deposit account paying
interest is typically used by entrepreneurs to hold money for future need
(Modigliani and Franco, 1988). This variable is expected to provide quantitative
data on the amounts of savings that MFIs accumulate from Small-scale enterprise
and the impact of their livelihood.
Financial Skills Training: this variable is used to designate the set of skills and
knowledge that allows an individual to make informed and effective decisions
when conducting their business. The variable is expected to produce quantitative
data that analyses financial training acquired by entrepreneurs from MFIs and its
effect on the growth of small-medium enterprise.
SME Growth: SME growth: According to the influential theory of Churchill and
Lewis (1983), growth is part of the natural evolution of a firm. The author
identifies five stages of growth: existence, survival, success, and take off and
resource maturity. In each stage of development a different set of factors is
critical to the firm’s survival and success. Growth thresholds may exist as
obstacles to the transition from one stage to another.
Profitability: according to Cohen (1993), profitability is one of the most
common indicators of business development. The more profits a business
realizes, the more it is assumed to be growing and vice versa. A growing
company tends to have very profitable reinvestment opportunities for its own

19
retained earnings. Business development is also defined as the level and extent
to which the venture meets the objectives of the owner and expectations of the
society of operation.
Employment creation: A literature review by Basnett and Sen (2013) identifies
an extensive body of evidence which suggest that growth in manufacturing and
services have particulary positive impact on employment.
Small medium enterprises indisputably create new jobs, but they can also
destroy jobs through higher failure rates. In this research, employment creation
by SMEs was also held as an indicator of growth for the fact that the more
growth there is in an economy, the more job creation there is.
While employment creation in developing countries is high on the agenda of most
donor agencies, there are different views on how to achieve it. Labour-intensive
light manufacturing industries, supported by SMEs can deliver productive jobs for
low-skilled workers at scale (Wilson and Jacobson, 2014). SMEs contribute a
large share of employment in developing countries; however, as many fail, their
net job creation rate is likely similar to large firms. Development agencies
focused on job creation through SMEs should therefore target small firms that
grow and this can increase the development of SMEs.
Increased sales: Sales growth targets play a major role in the perceptions of
top managers. Using surveys, Hubbard and Bromiley (1994) find sales is the
most common objective mentioned by senior managers. In a journal study of
Thomas, Bromiley and Hendrickx (2000), the findings showed the straightforward
result that cash flow increases sales growth, and sales growth increases
performance of firms. It is for this reason that this variable was used as an
indicator of performance (growth) of SMEs.
If the product or service is price sensitive, pay special attention to SMEs pricing
strategies (Yasin (2013). We should find out what the competition is charging
and raise or lower microfinances’ prices based on the organizational goals.
Lowering the prices can increase revenues to make up for lower margins. Raising

20
the prices can create a higher perceived value in the minds of consumers and
increase the margins. Raising the prices can also increase the revenues without
increasing sales (Wilson and Jacobson, 2014).
An obvious way to increase sales is to boost the marketing. Quantity doesn’t
necessarily mean quality, so one should be careful planning, test-marketing and
monitoring the results maximizes the sales. Conduct marketplace research to
learn which messages speak to the target audience. Incorporate some way to
monitor marketing communications, such as using coupons, electronic codes or
website traffic statistics can increase the growth of SMEs.
2.4 Related literature review
2.4.1 Loan provision and growth of Small medium enterprises
Availability of finance determines the capacity of an enterprise in a number of
ways, especially in choice of technology, access to markets, and access to
essential resources which in turn greatly influence the viability and success of a
business (Wole, 2009). Wole further states that securing capital for business
start-up or business operation is one of the major obstacles every entrepreneur
faces particularly those in the SMEs sector. Within the SMEs sectors lack of
access to credit is one of the major factors accountable for hindering the
emergence and growth of their businesses.
A study by Carpenter and Peterson (2002) found that firms whose financial needs
exceed their internal resources may be constrained to pursue potential
opportunities for growth. The insufficient internally generated liquidity is
therefore one of the factors which are frequently cited as the causes of Small and
Medium failure in developing economies. It is from this perspective, the
Microfinance Institutions are considered to be an appropriate solution to the
small and medium enterprises in availing the loans.
Banerjee and Duflo (2004) studied detailed loan information on 253 small and
medium –size borrowers from a bank in India both before and after they became
newly eligible for the program. Specifically the size definition of the program was

21
changed in 1998 which enabled a new group of medium-size firms to obtain
loans at subsidized interest rates. Naturally these firms began to borrow under
this favoured program, but instead of simply substituting subsidized credit for
more costly finance, they expanded their sales proportionately to the additional
loan sources which suggest that these firms must have previously been credit
constrained.
Copstake et al (2000) did a study on the impact of microcredit on poverty in
Zambia. The programme was not directed towards the poorest business
operators but one third of the clients were below national poverty line. Those
who graduated from their first to a second loan on average experienced
significantly higher growth in their profits and household income, as compared
with otherwise similar business operators. The borrowers also diversified their
business activities more rapidly. However some borrowers were worse off
particularly among the 50% or so who left the programme after receiving only
one loan.
Major findings by Chimucheka and Rungani (2011) in South Africa found that
majority of the SME who did not apply for a loan did not know the procedures
(53% of the sample) .Another 23% said they lacked knowledge on the sources of
finance available at banks. The study however had limitations since it was carried
out in one area there is no guarantee that the results could be generalized to
other areas of South Africa. There was also no stratification to check whether
there were any significant differences in different business sectors. Studies by
Suberu et al (2011) also found that access to loans was a major problem facing
small enterprises in Nigeria. The studies however did not find out whether the
applications procedures had any impact on the businesses applying for loans.
Pollinger et al, (2007) approached application procedures from the aspect of the
microfinance organization and found that the application process if well done
would lead to fewer losses in the future. Deakins et al, (2008) found that
manufacturing SME’s in particular had problems related to application procedures
when applying for a loan. The study also found that the age of the business also

22
impacted on the application procedures while none of the other studies had this
as a variable. This creates a gap in the study and the age of the business looked
at as a variable in the study.
These studies mentioned above constitute a basis for analyzing the effect of the
credits granted by the MFs to the development of SMEs, but they do not clearly
answer in an accurate manner the expectations that are created by the object of
our study, namely, deduce by in-depth analysis the impact of loans on SMEs
performance. Therefore it is up to the researcher to push through a much deeper
analysis the effects of the provision of loans by MFIs on their clients in Burundi,
which is the primary objective of this research
2.4.2 Savings mobilization and growth of small and medium enterprises
Savings is defined as the action of putting aside a part of current income, in
order to consume or invest it later on. The money saved can be kept at home,
deposited in a savings account or invested in different types of capital. Savings is
a critical service for entrepreneurs who want secure and convenient deposit
services that allow for small transactions and offer easy access to their funds
(Gardial, 2004).
According to Kalala and Ouedraogo (2001), the saving services that microfinance
institutions provide include a range of savings products that they offer to their
clients. These researchers noted that these products span over a wide spectrum
that includes profits savings, entrepreneur savings; current savings services;
demand savings or demand deposits; special regime demand savings; term
savings/deposit; linked, blocked or joint savings; voluntary blocked savings with
a preferential rate; deposit savings; high-yield savings; mandatory savings;
forced savings with loan; and other products. The same researchers warned
however, that these products are appreciated as services to clients only when the
clients can access them-that is, when the clients can effectively use them to their
business. Kalala and Ouedraogo went further on to explain that profit savings are
a product that focuses on term savings ranging from 6-36 months, with interest
rates that are higher than current savings accounts. The scholars noted further

23
that it is the client who determines the term and the amount of savings deposit
as long as it over and above the set minimum deposit. Profit savings services are
provided to clients aiming at expanding their businesses or establishing future
projects (Kapoor, 2009). They maximize the yield on the savings by attracting
returns at a given rate per annum. This makes it possible to build capital
(Kapoor, 2009). These savings may also be used as collateral to obtain a loan.
The entrepreneur savings service involves securing a loan using savings made
during the life of the loan (Graham & Marguerite, 2009).
In the United Kingdom a study by Gray, Saunders and Goregaokar (2012) found
the main sources of finance used by SMEs to fund their businesses were
reinvesting profits (68%), Personal/ family savings (39%) and bank loan (29%).
This indicates the importance of saving in funding business growth at 39%.
Similarly the Important of savings to SMEs is emphasized by Citi’s “susu” in
Ghana where 200 to 800 members save between US dollars 40,000 and 800,000
per cycle with the accumulated savings being paid out to the members over a
100 week cycle for each week’s collection (Bass and Henderson, 2014).
Another study according to Mwajuma (2012), access to safe and flexible savings
services can play a critical role in poor people's strategies for minimizing risks,
mitigating income fluctuations, facing unexpected expenditures and emergencies,
and building a small asset base over time. In particular, the very poor living in
rural areas, who may lack investment opportunities and safe ways of keeping
their savings, greatly value access to safe savings services. Most poor families do
save and often in a non-financial form, for example, small gold items or
stockpiling goods, because they frequently lack access to good formal savings
facilities. In-kind savings are suboptimal options, because they are subject to
fluctuations in commodity prices, and destruction by pests, fire and theft. While
microfinance institutions offer both good loan services and good voluntary
savings services, worldwide experience shows that there is usually more demand
for savings than for loans.

24
However, Krassowska, (2004), indicates that mobilizing the savings of small-scale
enterprises implies risk, and microfinance institutions to allow to do so should
clearly show their capacity to mobilize savings safely. Accordingly, they should
demonstrate strong governance and professional management, strength and
reliability, adequate internal controls, financial management and information
systems, the guarantee that deposits and savings are not used to cover their
operating expenses and records of strong loan portfolio quality management.
According to Quartey (2000), the savings facilities provided by microfinance
institutions enable microenterprises to invest their surplus funds, while obtaining
a return on their investments. This enables them to better manage liquidity and
could increase their levels of self-financed investment. Furthermore, the use of
savings facilities by low-income households enables them to store funds for
future use and build credit history. This is of particular importance as many low-
income households lack the types of collateral acceptable by commercial banks
that are required to access loans from this source of finance. The flexible and
convenient credit facilities provided by microfinance institutions enables low-
income households to borrow funds to cover emergencies that they cannot meet
from their levels of current savings. This can reduce the poverty gap and poverty
headcount, even though real income may not increase (Robinson, 2003).
It can be argued that savings mobilization is costly and risky relative to other
sources of financing and also that it would be better if entrepreneurs were
helped to build assets through saving rather than to take on debt. A study by
Bateman and Chang critically examined evidence on saving with microfinance
institutions in Croatia and found that savings were only useful in maximization of
profits for MFI managers and external shareholders. The study further argues
that poverty reduction can only be done through a range of state coordinated
policy interventions as happened in Malaysia, China, Taiwan, South Korea and
India. It would be important to establish the role of savings on SMEs asset
building with a view on possible solutions to any imperfections.

25
2.3.3 Financial skills training and growth of small and medium
enterprises
Fiddler and Webster (1996) advocate that in many cases, basic business skill
training should accompany the provision of micro loans to improve the capacity
of the poor to use funds. Micro enterprise investment training mainly addresses
capital investment decisions, general business management and risk
management. Capital investment decisions include allocation of the
microenterprise limited capital funds most effectively in order to ensure the best
return possible. Therefore, a wrong decision can have long lasting effect not only
on the profits but on very survival of the enterprise.
Bowen et al. (2009) researched on Management of business challenges among
small and micro enterprises in Nairobi Kenya. The findings of the research
indicated that over 50% of SSEs continue to have a deteriorating performance
with 3 in every 5 SSEs failing within months of establishment. Only 2.5%
respondents saying their businesses were very successful. The results also
showed that 49.5% of those who had received training in their areas of business
reported that their businesses were doing well hence the conclusion that relevant
training or education is positively related to business success and
recommendation that of the need for SSEs owners to get trained in an area that
is relevant to the business carried.
Simeyo et al (2011) in their study of the effect of provision of micro finance on
the performance of youth micro enterprises under Kenya Rural Enterprise
Program (KREP)in Kisii County using a sample of 86 youth micro enterprises
established that training in micro enterprise investment had a significant positive
impact on the performance of the microenterprises with a standardized beta
coefficient of 0.281 which indicated that a unit increase in the provision of
training to SSEs resulted to a 28.1% increase in performance. The study further
established that majority of the respondents were very satisfied with the
provision of capital investment and basic business skills training in micro
enterprise investment. This suggests that the business skill training
26
accompanying the provision of micro loans most likely improves the capacity of
the entrepreneurs to use funds and hence impacts on business performance. In
terms of business risk management, the results showed that respondents were
moderately satisfied in terms of achievement of business risk management skills.
With the implication that the youth micro entrepreneurs were inadequately
equipped with knowledge and skills of business risk management hence are
unable to adequately deal with business risks and therefore in the event that
such risks occur, their microenterprises are significantly affected.
Alarape (2007) did a study to examine the impact of owners/managers of small
business participating in entrepreneurship programs on operational efficiency and
growth of small enterprises in Nigeria. The study was a cross-sectional analysis of
impact of exposure of owners managers of small businesses on their
performance of operational efficiency and growth rate. The data was collected
from primary and secondary sources. Both descriptive and inferential statistics
were employed for the analysis. The findings were that small business whose
owners, managers had experience of participating in entrepreneurship programs
exhibited superior managerial practice, had higher gross margin rate of growth
than small businesses whose owner managers did not have superior
experimental learning. This had a practical implication that there is need to
improve managerial practice of small businesses through exposure of
owners/managers to entrepreneurship programs in order to enhance their
performance and transition to medium and large business.
In a study to investigate the effect of business development services on the
performance of Small Scale enterprises in Kisii Town Osinde et al (2013) found
out that the entrepreneurs who received business development services recorded
an improvement in the growth of sales and growth in market shares on the
various businesses they were operating. The study further established that those
who attended the training services recorded an improvement in their businesses
in terms of growth in sales and profits with 83.3% of the respondents who

27
always attended training reporting to have good growth in profits as opposed to
only 41.2% of those who never attended training.
For Bruhn and Zia (2011), in their study on the Impact of Business and Financial
Literacy for Young SMEs in Bosnia and Herzegovina found that business
outcomes and practices is the difference in effects of the training on individuals
with below and above median financial literacy at baseline. They also found that
both entrepreneurs with below and above median financial literacy changed
some of their business practices, such as separating personal accounts from
business, and making investments in their business; however, only entrepreneurs
with above median financial literacy at baseline reported increases in sales and
profits as a result of the training. These findings suggest that baseline knowledge
and information conveyed in the financial training act as complements in
increasing the productivity and sales of a business.
They also found out those SMEs with relatively high ex‐ante financial literacy
exhibit improvements in sales due to the training program. While business
training does not impact the extensive margin, it has significant effects on
existing entrepreneurs, and on specific aspects of their businesses. Teaching
entrepreneurs the value of capital investment indeed encourages them to change
business practices that allow for greater innovation, for instance by implementing
new production processes and making personal investments in the business.
Since the study findings have shown that business development services have an
influence on business performance the study recommends that the Kenyan
government through the Ministry of Trade should provide training programs for
the owner-managers and managers of SSEs so as to help polish their knowledge
in financial management and other managerial skills. Field officers should be
recruited to coordinate and monitor the provision of training, advice, counsel and
provide other non-financial services to these small business operators.

28
2.5 Research gaps of the study
The study developed by the researcher was titled and concerned the effect of
microfinance services on small and medium enterprises in Bujumbura, Burundi.
Most of the studies related to microfinance services on the growth of SMEs were
conducted in other geographical areas rather than in Burundi. Therefore, among
the studies done by other researchers, we can cite Godwin Owusu (2012) who
conducted a research to examine the impact of Microfinance institutions on the
development of small and scale enterprises in Ghana, Gladys Nanyama (2014)
developed a research on the influence of Microfinance institutions on the growth
of small and scale enterprises in Kenya. Nilsson (2010) adapted a study to
investigate the impact of microfinance institutions (MFIs) on the development of
small and medium size businesses (SMEs) in Cameroon. Bran and Woller (2010)
carried out a study to establish the effects of microfinance in India. These
mentioned researches, in addition of containing a geographical gap, they also
present another gap because the independent variables were not necessarily
focused on the loan provision, savings and financials skills training.

29
CHAPTER THREE
METHODOLOGY
3.0 Introductions
This chapter presents the overall procedure and methodology, which was
followed during the process of carrying out the research. It describes the manner
in which data were collected and analysed, presented and interpreted. It shows
the research design, target population, sample size, sampling techniques, data
collection instruments, validity and reliability of the instruments, data collection
procedures and data analysis, ethical considerations and limitations of the study.
3.1 Research Design
This study employed a descriptive research design, whereby quantitative
research approaches were used to gain insight about the effect of microfinance
services in the growth of SME. descriptive research was used in this study to
describe the characteristics of respondents, microfinance services and growth of
SME in Bujumbura, Burundi. The correlational design were used to determine if
there is significant relationship between microfinance services and growth of SME
in Burundi. In the last place, linear and multiple regression analysis was used to
ascertain the effect.
3.2 Target Population
The target population in this study was owners of Small and Medium Enterprises
located in the Rohero, Ngagara and Buyenzi Districts in Bujumbura registered at
Burundi Autority Revenue (OBR) as stated by the Institute of statistics and
Economic in Burundi ‘annual (2015). These districts were selected because this is
where the majority of SMEs are located in Bujumbura (ISTEEBU annual, 2015).
According to institute of statistics and economics of Burundi, there are 306 SMEs
located in those Districts and registered in Burundi Authority Revenue.

30
3.3 Sample size
A sample size of 173 owners of SME respondents was selected from the
population of 306 SMEs located in the Buyenzi, Ngagara and Rohero Districts
registered at Burundi revenue authority (OBR). That sample was computed using
Slovene’s formula as shown below;
n= 𝑵
𝟏+𝑵 ( 𝒆𝟐) where: n= Sample size
N= entire population
e= level of significance 0.05
n=306
1+306(0.052)
n=306
1+306(0.0025)
n=306
1+0.765
n= 306/1.765
n=173.37
n=173 respondents
Table3.1: Sample Size
Districts Population Sample Sample technique
Buyenzi 63 36 Simple Random
Sampling Ngagara 84 47
Rohero 159 90
Total 306 173
Source: the researcher’ computation from survey data, 2018
3.4 Sampling procedures
The researcher used Simple random Sampling Technique. It enabled the
researcher to give equal opportunity to all eligible respondents. It is in this way

31
that any form of biasness was avoided. After assigning a sequential number at
each SME of the targeted population, the researcher used a random number
generator of the sample size.
3.5 Data collection instruments
In this study, the researcher focused on primary data where the tool for data
collection was the questionnaire. The questionnaire was developed in line with
the study objective and was pre-tested for validity and reliability. The
questionnaire was organized into sections. Section A collected the background
information of respondents and section B collected data on the effect of
microfinance services on the growth of the SMEs in Bujumbura, Burundi.
3.6 Validity and reliability of the research instruments
3.6.1 Validity
Validity refers to the appropriateness, meaningfulness and usefulness of the
specific inferences researchers make based on the data collected. According to
Mugenda and Mugenda (1999), Validity is the accuracy and meaningfulness of
inferences, which are based on the research results. Validity deals with the
adequacy of the instruments for example, the researcher needs to have adequate
questions in the written task in order to collect the required data for analysis that
can be used to draw conclusions. Fraenekel (1993) suggests that the individual
who is supposed to render an intelligent judgment about the adequacy of the
instruments should be given the instruments before the actual research is carried
out. Copies of questionnaire were given to two lecturers (experts) to judge the
validity of the questions according to the objectives. After the assessment of the
questionnaires, necessary adjustments were made. At the end, the content
validity index (CVI) formula was applied to test the validity of the instruments.
The decision rule was to declare the instruments valid if the CVI is greater or
equal to 0.7.
CVI=𝑁𝑜 𝑜𝑓 𝑞𝑢𝑒𝑠𝑡𝑖𝑜𝑛𝑛𝑎𝑖𝑟𝑒𝑠 𝑑𝑒𝑐𝑙𝑎𝑟𝑒𝑑 𝑣𝑎𝑙𝑖𝑑
𝑡𝑜𝑡𝑎𝑙 𝑛𝑢𝑚𝑏𝑒𝑟 𝑜𝑓 𝑞𝑢𝑒𝑠𝑡𝑖𝑜𝑛𝑠 𝑖𝑛 𝑡ℎ𝑒 𝑞𝑢𝑒𝑠𝑡𝑖𝑜𝑛𝑛𝑎𝑖𝑟𝑒
CVI=26
30

32
CVI=0.866
Since CVI>0.7, the questionnaire used in this research was accepted as valid.
3.6.2 Reliability
Reliability refers to a measurement that supplies consistent results with equal
values (Blumberg et al., 2005). It measures consistency, precision, repeatability,
and trustworthiness of a research (Chakrabartty, 2013). The better reliability is
performed, the more accurate the results; which increases the chance of making
correct decision in research.
In this research, the reliability of the survey instruments (questionnaire) was
tested using Cronbach Alpha Coefficient. The Cronbach Alpha Coefficient is
usually interpreted as the mean of all possible split half coefficients. It typically
varies between 0 and 1, where 0 indicates no relationship among the items on a
given scale, and 1 indicates absolute internal consistency (Tavakol & Dennick
2011). Alpha values above 0.7 are generally considered acceptable and
satisfactory, above 0.8 are usually considered quite good, and above 0.9 are
considered to reflect exceptional internal consistency (Cronbach, 1951). In the
social sciences, acceptable range of alpha value from 0.7 to 0.8 (Nunnally &
Bernstein, 1994).
Table3.1. Internal Consistence Results of Composite Reliability
Constructs No. of
questions
Cronbach’s
alpha Statistic
Internal Reliability
Loan Provision 5 .794 Satisfactory
Savings mobilisation 6 .819 Good
Financial skills Training 6 .859 Good
Growth of SMEs 9 .884 Good
Total 26 .839 Exceptional
Source: Researcher’s Computation from survey data (2018)

33
3.7 Data collection procedures
Before the administration of questionnaires
a) An introduction letter was obtained from the department of CEM for the
researcher to get an approval to conduct the study from respondents selected.
b) In order to ensure anonymity, names were put in rotary and selected
randomly using the simple random sampling technique.
c) Respondents were briefly explained about the study before filling the
questionnaire.
During the administration of the questionnaires
a) Respondents were asked to answer completely and not to leave any part
of questionnaires unanswered.
b) The researcher and assistant emphasized the retrieval of questionnaires
within one week from the day of distribution.
c) All returned questionnaires were checked whether they were all answered.
After the administration of the questionnaires
The data gathered was prepared to be coded into the computer in order to
analyse it statically.
3.8 Data analysis
The data collected were entered into statistical package for social scientists
(SPSS) coded and all the errors were removed, and the results attained on mean
and standard deviations. The frequency counts and percentage distributions were
used to determine the characteristics of the respondents and means were used
to describe microfinance services effectiveness and the growth of SME in
Burundi. The interpretations for the data for both the independent and
dependent variables have been interpreted using the following means range:

34
Table 3: Mean range
Mean Range Response Mode Interpretation
3.26 - 4.00 strongly agree Very High
2.51 – 3.25 Agree High
1.76 – 2.50 Disagree Low
1.00 – 1.75 strongly disagree Very Low
The Pearson linear correlation co-efficient was used to determine the relationship
between microfinance services and growth of SMEs. At the end, simple linear
regression and multiple regression analyses was also used to test the effect of
the dependent variables on the independent variables.
Thus the regression equation took the following form:
Y = F (X1, X2………..Xn)………….. 3.1
Where:
Y= Dependent Variable (growth of small medium enterprises)
X1…….Xn = Independent variable (microfinance services)
et= Random variable or error term
From equation 1, the econometrical equation formed thus:
SMEG=Bo + B1 LP + B2 SM + B3 FST + et………………… 3.2
Where:
SMEG= Small Medium Enterprise Growth
LP= Loan Provision
SM= Savings Mobilisations

35
FST= Financial Skills Trainings
Bo = the constant or the level of at microfinance services are not in existence
et = error term
3.9 Ethical considerations
This study have been conducted within the strict respect of ethical code guiding
researches. During the development of the proposal, plagiarism was avoided as
much as possible by citing relevant sources. The data obtained from the small
and medium enterprises registered in selected districts in Bujumbura Burundi
kept confidential for the sole purpose of the research. No data transfer to any
other third party was done during the course and after the research.

36
CHAPTER FOUR
PRESENTATION, ANALYSIS AND INTERPRETATION OF RESULTS
4.0 Introduction
This chapter presents, analyzes, and interprets the results of data collected from
the field survey. The Data analysis and interpretation was based on the research
objectives. Below are the data presentations and analysis of research findings.
4.1 Respondent Rate
The researcher administered a total of 185 copies of questionnaire to the owners
and managers of SMEs in Bujumbura Burundi, but only 176 were retrieved from
the respondents given a total of 95.13% rate. Therefore, if the questionnaire
retrieval rate is greater than 70% it is enough to consider the data obtain in a
research study (Amin, 2005).
Table 4.1: Response Rate of the Questionnaire
Response Frequency/Rate
No. of distributed copies of questionnaire 185
Minimum study sample size 173
Returned copies of questionnaire 176
Response rate as per the sample size 101.73%
Returned and usable copies of questionnaire 176
Copies of questionnaire not returned or not
usable
9
Valid response rate as per the sample size 101.73%
Source: Computation from survey data (2018)
As indicated from table 4.1, slightly more than 100% of minimum sample size
was retrieved, this was because the researcher distributed more than the
minimum sample in an effort to meet the targeted minimum sample size.

37
4.2 Profile of respondents
The section provides data on background information of respondents who
participated in the study. The purpose of this background information was to
identify the characteristics of respondents and to show the distribution of
respondents in the study in terms of gender, age, educational qualifications and
social status. The results are presented in table 5-8.
4.2.1 Gender of respondents
Table 4.2: Gender characteristics of Respondents
Gender of
respondents
Frequency count Percentage (%)
Male 126 72.8
Female 47 27.2
Total 173 100
Source: Computation from survey data (2018
Regarding respondents gender, Table 4.2 revealed that 126 respondents
representing 72.8% of the sample size are male and 47 representing 27.2% are
female. This is an indication that both genders were well involved in SMEs in
Bujumbura, although there are considerably more male entrepreneurs than
female.
4.1.2 Age of respondents
Table 4.3: Age characteristics of Respondents
Age Bracket Frequency count Percentage (%)
20 – 30 26 15
31 – 40 70 40.5
41 – 50 44 25.4
50 and above 33 19.1
Total 173 100.0
Source: Computation from survey data (2018)

38
The results in table 4.3 show the age distribution of the respondents: 26
respondents representing 15% are aged between 20 and 30 years, 70
representing 40.5% of the total of respondents are aged between 31 and 40
years, 44 respondents representing 25.4% are aged between 41 and 50 years
and 33 respondents representing 19.1% are aged above 50 years old. This
implied that most of the respondents in the study are adult aged between 31 and
40 years old. In addition, the findings imply that the study was taken from
mature respondents and therefore the information obtained can be based on for
decision-making.
4.1.3 Education background of the respondents
Table4.4: Education characteristics of Respondents
Level of Education Frequency count Percentage (%)
Primary education 20 11.6
Secondary education 47 27.2
Tertiary education 106 61.3
Total 173 100.0
Source: Computation from survey data (2018)
From Table 4.4, it indicates that tertiary education is the level of education with
the highest response rate. From the table, 61.3% of the respondents indicated
their highest education level as tertiary education with a university background.
This is followed by secondary education, with 27.2% of the respondents each.
Those with a primary level of education represented 15.8% of the respondents.
This is an indication that majority (61.3%) of the SMEs operators sampled in this
study has a university background education.

39
4.1.4 Marital status of respondents
Table 4.5: marital status of respondents
Marital status Frequency count Percentage (%)
Married 95 54.9
Single 49 28.3
Others 29 16.8
Total 173 100
Source: Computation from survey data (2018
Table 4.5 revealed that 95 respondents representing 54.9 % were married, while
49 respondents representing 28.3% were single and 29 respondents
representing 16.8% had another marital status else than married or single
status. This showed that the majority of respondents in this survey were married.
4.2 Description of effectiveness of Microfinance services in Small and
Medium Enterprises in Bujumbura
The study sought to establish the level at which respondents agreed or disagreed
with the Microfinance services to Small and Medium Enterprises’ growth in
Bujumbura Burundi. The researcher concentrated on three constructs of MFI’s
services, which are loan provision, savings mobilizations, and financial training
skills.
The respondents were asked to indicate the extent to which they agree or
disagree with each question, and their responses were analyzed using mean and
standard deviation in SPSS. The rating scales were as follows: 1 = Strong
disagree (SD); 2 = Disagree (D); 3 = Agree (A) with some doubt; 4 = Strong
agree (SA). The responses were summarized using means and standard
deviations, as indicated in table 9.

40
Table 4.6: Mean and standard deviation showing Loan provision in the
growth of SMEs in Bujumbura
Item/Questions MEAN STD Mean
interpretation
Rank
A. Loan Provision
Loans applications and approval
process at microfinance institutions
are fast enough to my satisfaction
3.50 0.66 Very high 3
interest charged by MFIs are
relatively affordable for timely
repayment
3.67 0.55 Very high 2
I always attain capital for business
re-engineering from the microfinance
3.36 0.80 Very high 5
The loan provided is adequate to
meet my needs of business
operations
3.49 0.69 Very high 4
There is no collateral security
required for the attainment of seed
capital
3.69 0.58 Very high 1
Average Mean 3.54 0.66 Very high
Source: Researcher Computation from survey data, 2018
According to the findings in table 4.6, Loans applications and approval process at
microfinance institutions are fast enough to the respondents had a mean of 3.50
and standard deviation of 0.66 interpreted as very high, implying that
respondents were favored in the application process for credit in microfinance
since MFs were putting the process to the credit application in a relatively short
time. Interest charged by MFIs are relatively affordable for timely repayment had
a mean of 3.67 and standard deviation of 0.55 interpreted as very high as well,

41
which implies that the respondents were favored by the fact that the MFs gave
them sufficient time to be able to repay their debt and interest..
I always attain capital for business re-engineering from the microfinance had a
mean of 3.36 and standard deviation of 0.80 interpreted as very high, which
implies that the respondents were receiving capital for business re-engineering
from the MFIs. The loan provided is adequate to meet my needs of business
operations had a mean of 3.49 and standard deviation of 0.69 interpreted as very
high, which implies that the respondents received sufficient and adequate credit
for the financing of their business.
There is no collateral security required for the attainment of seed capital had a
mean of 3.69 and standard deviation of 0.58 interpreted as very high which
means that the MFIs did not ask for a guarantee from the respondents for them
to be able to obtain a loan .
Table 9 also Indicate that the construct Loan provision has an overall average
mean 3.54 and average standard deviation of 0.66 which was rated Very high,
implying that majority of the respondents owners of SMEs respondents generally
strongly agreed that loan provision by MFI’s is very profitable to small and
medium enterprises activities in Bujumbura, Burundi.
Table 4.7. Mean and standard deviation showing Savings Mobilizations
in Burundi’SMEs in Bujumbura
Item/Questions: Savings
Mobilizations
MEAN STD Mean
interpretation
Rank
The microfinance
organizations enable us in
saving our money
3.75 0.51 Very high 1
. The microfinance
institutions enable us to
easily access the savings
3.67 0.52 Very high 2
There is mobilization of
group savings by the
microfinance organization
3.67 0.61 Very high 2

42
We attain interest on the
savings made by the
microfinance institution
3.55 0.74 Very high 5
There is adequate storage
of the savings made by the
microfinance institution
3.34 0.86 Very high 6
There is assurance that the
savings made by MFIs are
safe
3.75 0.53 Very high 1
Average mean 3.62 0.63 Very high
Source: Researcher Computation from survey data, 2018
The above table puts in evidence that majority of the respondents generally
strongly agreed that provision savings account by MFIs boosts SMEs growth in
Bujumbura Burundi.
Table 4.7 presents that the microfinance organizations enable us in saving our
money had a mean of 3.75 and a standard deviation of 0.51 was interpreted as
very high, which implies that indeed the respondents were saving money in the
MFIs. The microfinance institutions enable us to easily access the savings had a
mean of 3.67 and a standard deviation of 0.52 and was interpreted as very high,
meaning that respondents were in support that microfinance enabled them to
access easily to savings.
There is mobilization of group savings by the microfinance organization had a
mean of 3.67 and a standard deviation of 0.61 was interpreted as very high,
meaning that MFIs encouraged clients who save their money in group within the
MFIs . We attain interest on the savings made by the microfinance institution had
a mean of 3.55 and a standard deviation of 0.74 and interpreted as very high.
There is adequate storage of the savings made by the microfinance institution a
mean of 3.34 and a standard deviation of 0.86 was interpreted as very high,
implying that the respondents were in support that the savings made within MFIs
are kept in adequate storage. There is assurance that the savings made by MFIs
are safe had a mean of 3.75 and a standard deviation of 0.53 and interpreted as

43
very high, meaning that according to the respondents there is assurance that the
savings made within MFIs are safe.
Table 4.8: Mean and standard deviation showing Financial skills
training in BUJUMBURA’ SMEs.
Item/Questions:
Financial Skills
Training
MEAN STD Mean
interpretation
Rank
Microfinance provide
saving and deposit
facilities training
3.72 0.49 Very high 1
There is provision of loan
facilities acquisition
training
3.62 0.64 Very High 4
Microfinance provide
repayments and
consequences of defaults
3.02 1.19 High 6
Microfinance provide
business initiation skills
3.58 0.70 Very high 5
There is provision of
business administration
skills by the MFIs
3.68 0.55 Very high 3
There is Group
mobilisation formation
skills in organisation skills
in organisation
3.72 0.60 Very high 1
Average mean 3.56 0.69 Very high
Source: Researcher Computation from survey data, 2018
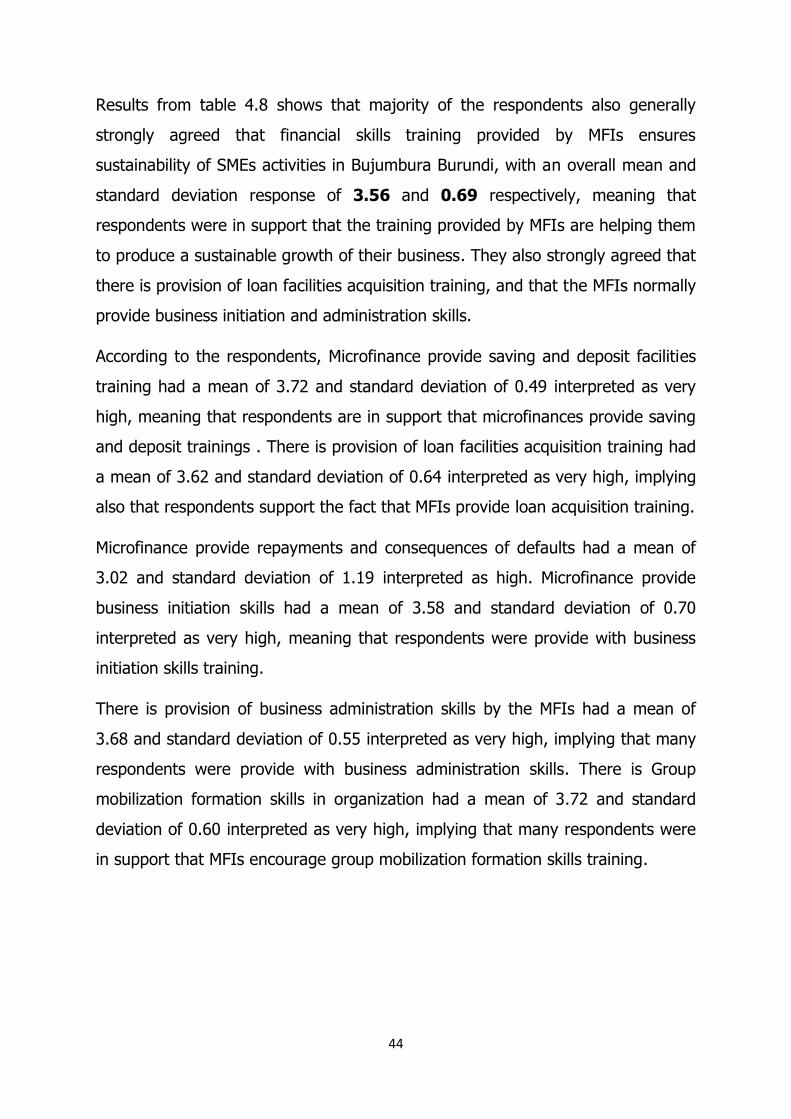
44
Results from table 4.8 shows that majority of the respondents also generally
strongly agreed that financial skills training provided by MFIs ensures
sustainability of SMEs activities in Bujumbura Burundi, with an overall mean and
standard deviation response of 3.56 and 0.69 respectively, meaning that
respondents were in support that the training provided by MFIs are helping them
to produce a sustainable growth of their business. They also strongly agreed that
there is provision of loan facilities acquisition training, and that the MFIs normally
provide business initiation and administration skills.
According to the respondents, Microfinance provide saving and deposit facilities
training had a mean of 3.72 and standard deviation of 0.49 interpreted as very
high, meaning that respondents are in support that microfinances provide saving
and deposit trainings . There is provision of loan facilities acquisition training had
a mean of 3.62 and standard deviation of 0.64 interpreted as very high, implying
also that respondents support the fact that MFIs provide loan acquisition training.
Microfinance provide repayments and consequences of defaults had a mean of
3.02 and standard deviation of 1.19 interpreted as high. Microfinance provide
business initiation skills had a mean of 3.58 and standard deviation of 0.70
interpreted as very high, meaning that respondents were provide with business
initiation skills training.
There is provision of business administration skills by the MFIs had a mean of
3.68 and standard deviation of 0.55 interpreted as very high, implying that many
respondents were provide with business administration skills. There is Group
mobilization formation skills in organization had a mean of 3.72 and standard
deviation of 0.60 interpreted as very high, implying that many respondents were
in support that MFIs encourage group mobilization formation skills training.

45
Table 4.9: Mean and standard deviation showing Growth of SMEs in Bujumbura
Item/Questions MEAN STD Mean interpreta
tion
Rank
Profitability
MFIs have contributed to cost reduction in the way I run my business as SME owner
3.71 .52 Very high 1
The supports of MFIs have made it possible for me as SME owner to minimize wastage and
spoilage of stock operation as I focus on key business activities.
3.60 .61 Very high 2
Through the supports of MFIs I am able to fully train my employee(s) to run daily operation as I
focus on key business activities.
3.60 .59 Very high 2
Average Mean of Profitability 3.64 .57 Very high
Sales Growth
MFIs training have contributed to improved marketing skills like pricing for my products for
me as SMEs owner
3.50 .67 Very high 5
MFIs have contributed to customer creation skills
in the way I run my business as small and medium enterprise in Bujumbura.
3.41 .83 Very high 9
MFIs have contributed to improved level of my business revenue as small and medium
enterprise.
3.44 0.75 Very high 7
Average Mean of Sales Growth 3.45 0.69 Very high
Employment creation
My business SME has become an important actor
in employment creation among the local community and as a SME owner i am able to
meet my social responsibilities.
3.57 0.68 Very high 4
my small and medium enterprise has contributed
to improved standard of living for me as SME owner
3.47 0.74 Very high 6
my small and medium enterprise has contributed to increase level of income for me as SME owner
and others
3.43 0.76 Very high 8
Average mean of Employment creation 3.49 0.73 Very high
Source: Researcher Computation from survey data, 2018

46
From the results in table 4.9, it indicated that Growth of SMEs was rated very
high, that is because majority of the respondents generally strongly agreed that
Microfinance services have increased their profitability, growth in sales and
employment creation in Bujumbura Burundi. This is evident in the overall mean
response of profitability of SMEs in Bujumbura which is 3.64 and with an overall
standard deviation of 0.57 interpreted as very high. The growth of SMEs in
Bujumbura is evidenced to be high through the mean and the standard deviation
of Growth Sales as well which are respectively of 3.45 and .69. The rate of
growth of SMEs in Bujumbura is as well high in regard to the overall mean and
standard deviation of Employment creation which are respectively of 3.49 and
0.73.
According to the table, MFIs have contributed to cost reduction in the way I run
my business as SME owner has a mean of 3.71 and a standard deviation of .52
rated as very high, meaning that respondents are I support that through
microfinance services, there has been a cost reduction in their business.
The supports of MFIs have made it possible for me as SME owner to minimize
wastage and spoilage of stock operation as I focus on key business activities has
a mean 3.60 of and a standard deviation of .61, implying that respondents are in
support that microfinance services helped them to minimize wastage of their
stock operation. Through the supports of MFIs I am able to fully train my
employee(s) to run daily operation as I focus on key business activities has a
mean of 3.60 and standard deviation of .59 rated as very high, meaning that
microfinance services enable respondents to train their employees on how run
daily operation.
MFIs training have contributed to improved marketing skills like pricing for my
products for me as SMEs owner has a mean of 3.50 and a standard deviation of
.67 rated as very high, implying that respondents are in support that through
microfinance services, respondents improved the pricing of their products. MFIs
have contributed to customer creation skills in the way I run my business as
small and medium enterprise in Bujumbura has a mean of 3.41 and standard

47
deviation of .83 rated as very high, implying that there has been an improvement
for respondents in the way their attract customers in their business. MFIs have
contributed to improved level of my business revenue as small and medium
enterprise has a mean of 3.44 and standard deviation of .75 rated as very high,
meaning that respondents are in support that there has been an increase in
revenue due to microfinance services.
My business SME has become an important actor in employment creation among
the local community and as a SME owner i am able to meet my social
responsibilities has a mean of 3.57 and standard deviation of 0.68 rated as very
high, meaning that many respondents are being tangible actors whereby new
jobs are created among the local community where they are located. My small
and medium enterprise has contributed to improved standard of living for me as
SME owner has a mean of 3.47 and standard deviation of .74 rated as very high.
My small and medium enterprise has contributed to increase level of income for
me as SME owner and others has a mean of 3.43 and a standard deviation of .76
rated as very high, implying that respondents are in support through
microfinance services, they contribute to the improvement of the welfare of the
population where their business are located
4.3 Correlation Analysis of Microfinance services and Growth of SMEs
To establish whether Microfinance services were significantly related with growth
of SMEs, in Bujumbura, Burundi; the independent variables (Microfinance
services) were broken into three components based on the services usually
provided by microfinance institutions and each was correlated with the
dependent variable (growth of SMEs). The results of the correlation analysis are
presented us in table 13.

48
Table 4.10: Pearson Correlation between Microfinance services Vs
Growth of SMEs in Bujumbura Burundi
Variables correlated Coefficient Sig Interpretation
Loan Provision Vs
Growth of SMEs.
0.868
1
0.000 Positive Significant Correlation
Savings Mobilizations Vs
Growth of SMEs
0.846
1
0.000 Positive Significant Correlation
Financial Training skills Vs
Growth of SMEs
0.862
1
0.000 Positive Significant Correlation
Source: Researchers’ computation table, 2018 (Correlation is significant at the
0.005 level (1-tailed)
The Pearson’s linear correlation coefficient (PLCC) results in table 4.10 indicated that Loan Provision, Savings Mobilizations and financial skills training are significantly correlated with Growth of SMEs.
Observation from the results of the Pearson’s linear correlation coefficient (PLCC)
between loan provision and growth of SMEs in Bujumbura Burundi showed that
there is a strong significant positive linear relationship between loan provision
and growth of SMEs in Bujumbura, Burundi. This is evident in the correlation
coefficient of 0.869. This result suggests that an increase in loan provision by
MFIs is likely to increase SMEs growth in Bujumbura, Burundi. This finding is
statistically significant since the p-value (0.000) of the PLCC is less than the
significance level (0.05).
The finding for the correlation between Savings Mobilizations and Growth of
SMEs shows also a significant relationship for the reason that the p-value (0.000)
of the PLCC of the relationship between provision of savings account by MFIs and
growth of SMEs in Bujumbura Burundi is less than the significance level (0.05).
This positive linear correlation between Savings Mobilizations and Growth of
SMEs is evident by the correlation coefficient of 0.846. We can also see from
Table 4.10 that a strong positive linear relationship exists between financial skills
training provision by MFIs and growth of SMEs in Bujumbura, Burundi. This is
evident in the computed correlation coefficient of 0.862. This result suggests that

49
an increase in provision managerial skills by MFIs is likely to increase SMEs
growth in Bujumbura, Burundi. This finding is equally significant since the p-value
(0.000) of the PLCC is less than the significance level (0.05). Hence, there is
significant positive linear relationship between managerial skill provision by MFIs
and SMEs growth in Bujumbura, Burundi.
4.4 Testing of Hypotheses: Effect of Microfinances services and growth
of small and medium enterprises in Bujumbura, Burundi
To test the effect of services provided by microfinance institutions on the growth
of SMEs, a simple linear regression was used in order to confirm or reject the null
hypotheses which were established in chapter 1.
Table 4.11: Shows Regression Analysis on Loan Provision and Growth of SMEs
Loan provision on
Growth of SMEs
Standardized
coefficients
Beta(β)
Significance
(p)
Decision on
HO1
Adjusted R-
square=0.752
F-statistic=521.31
p=0.000
t-test=22.832
0.868 0.000 Rejected
Source: Researcher’s Computation from survey data (2018)
The first null hypothesis was “There is no significant effect of Loan Provision on
the growth of SMEs in Bujumbura, Burundi.” This null hypothesis was tested
using the result of the simple linear regression and thus Loan provision was
regressed with Growth of SMEs. The results of linear regression showed that F –
statistic = 521.310 and t - test = 22.832 and significant at P < 0.000. Regarding
to the results, a positive significant linear regression has been found and the null
hypothesis was rejected because the sig value is below the threshold of its
acceptance level (0.05).

50
Table 4.12: Shows Regression Analysis for Savings Mobilisations and
Growth of SMEs
Savings mobilisation on
Growth of SMEs
Standardized
coefficients
Beta(β)
Significance
(p)
Decision on
HO1
Adjusted R-square=0.714
F-statistic=430.09
p=0.000
t-test=20.739
0.846 0.000 Rejected
Source: Researcher’s Computation from table (2018)
The second null hypothesis was “There is no significant effect between Savings
Mobilizations and Growth of SMEs in Bujumbura Burundi. This null hypothesis
was tested using the results of the simple linear regression and thus Savings
Mobilizations was regressed with Growth of SMEs. The results of linear regression
showed that F – statistic = 430.092 and t - test = 20.739 and significant at P <
0.000. By this result the null hypothesis is rejected because the sig value is
below the threshold of its acceptance level (0.05).
Table 4.13: Shows Regression Analysis for Financial Skills training and Growth of SMEs
Financial skills training
on Growth of SMEs
Standardized
coefficients
Beta(β)
Significance
(p)
Decision on
HO1
Adjusted R-square=0.742
F-statistic=496.66
p=0.000
t-test=22.286
0.862 0.000 Rejected
Source: Researcher’s Computation from table (2018)
The third null hypothesis “There is no significant effect between financial skills
Training and Growth of SMEs in Bujumbura.” This null hypothesis was tested

51
using the results of the simple linear regression as well and thus Financial Skills
Training was regressed with Growth of SMEs. The result of linear regression
showed that F – statistic = 496.669 and t - test = 22.286 and significant at P <
0.000. By this result the effect of financial training on the growth of SMEs in
Bujumbura was found positively significant and the null was rejected because the
sig value was below the threshold of its acceptance level (0.05).
4.5 Multiple Regression Analysis of Microfinance services and growth of
Small and medium enterprises
Table 4.14: Results of multiple regression analysis Microfinance services on Growth of SMEs
Standardized coefficients
Significance (P) Decision
Loan provision 0.317 0.000 Rejected
Savings mobilizations 0.317 0.000 rejected
Financial skills training 0.314 0.000 Rejected
Adjusted R-square=0.805 F-statistic=237.528 p=0.000
Source: Researcher’s Computation (2018)
The result of multiple regressions in Table 4.14 has also shown that Loan
provision is positively related to Growth of SMEs since the combine Regression
results gives a R of 0.899, R-square of 0.808 and a R adjusted of 0.805 with a P-
Value of 0.000 thus still significantly related, therefore the null hypothesis still
rejected.
Thus, the multiple regression analysis yielded the following model: Growth of
SMEs = Bo + B1 (LP) + B2 (SM) + B3 (FST) + Err0 ……………2
Where, Bo is constant or the level when Growth of SMEs is taken to be zero. B1,
B2 and B3 are the regression parameters measuring the strength of the
independent variables on Growth of SMEs. Thus B1 was the parameter
measuring the control power of Loan Provision (LP) on the Growth of SMEs. B2
was the parameter measuring the strength power of Savings Mobilizations(SM)

52
on the growth of SMEs and B3 was the parameter measuring the strength power
of Financial Skills Training (FST) on Growth of SMEs.
Thus, the multiple regression analysis yielded the following model: Growth of
SMEs = 0.156 + 0.317 LP +0.317 SM +0.314 FST+ (0.134). (0.087). (0.076).
(0.74)
With the R-Square of 0.808 and the adjusted R-Square of .805 means that the
variables Loan provision, Savings Mobilization and Financial training skills explains
at least 95% of the growth of small and medium enterprises in the Bujumbura,
Burundi.
The constant of 0.156 showed that if Loan provision, savings mobilisation and
financial skills training provided by MFIs were rated as zero, the growth of SME in
Bujumbura Burundi would be 0.156. The coefficient 0.317 on loan provision,
showed that one unit change in Loan provision results in 0.317 units increase in
growth of SME. Also, the result of multiple regression of 0.317 showed that one
unit change in mobilisation of savings results in 0.317 units increase in growth of
SME. Lastly, 0.314, showed that one unit change in training provided by MFIs
results in 0.314 units in growth of SME in Burundi.

53
CHAPTER FIVE
DISCUSSIONS, CONCLUSION AND RECOMMENDATION
5.0 Introduction
This chapter focused on the findings, conclusions and recommendations of the
study presented in Chapter Four. In the first place, it examined the main finding
expressed in objectives, research question. Secondary, the conclusions of the
study were drawn and finally recommendations were formulated and additional
research areas were defined.
5.1 Discussion
In this section, the findings of the study were examined in light of the purpose of
the research and the conclusions of the previous researchers. Subheadings are
organized for discussion according to the objectives of the research.
The purpose of this study was to determine the effects of Microfinance services
on the Growth of Small and Medium Enterprises in Bujumbura Burundi.
5.1.1 Effect of Loan provision on the growth of Small and Medium scale
Enterprise in Bujumbura
The research question that guided this objective was does Provision of Loan by
Microfinance affect the growth of small and medium enterprises in Bujumbura?
And in attempt to get answer for the question a null hypothesis was formulated
thus: ‘Ho1 There is no significant effect of loan provision and growth of Small
and Medium Enterprises in Bujumbura’. The effect was found significant though
the findings revealed that loan provision provided a high contribution to Small
and medium enterprises growth in Bujumbura. In the first instance the
descriptive statistics shows that Loan provision is very high. The Pearson’s linear
correlation coefficient (PLCC) findings of this study indicated that Loan provision
had a very strong significant relationship with the Growth of SMEs in Bujumbura
Burundi as well. Similarly the results of the linear and multiple regression also
showed that Loan provision is significantly and positively related with growth of
SMEs in Bujumbura.

54
The finding was in line with the findings of Abio and Emenike (2017) who
maintained that loan provision has a significant positive impact on SMEs growth
in Nimule South Sudan. The results of this research support in some way the
pecking order theory( Myers,1986), by the fact that this theory expresses that
owners of the companies make use of the credits to finance their activities in
order to be able to both record profits and to produce a financial growth while
remaining the sovereigns and ultimate leaders of their businesses.
The result was consistent with other previous empirical studies namely Gabre
(2014) who found that access to credit facilities namely loan provision positively
impacts on the growth of the top 100 small and medium enterprises in Kenya.
5.1.2 Effect of Savings Mobilizations and Growth of SMEs in Bujumbura
The research question that guided this objective was ‘How does savings affects
growth of small and medium enterprises in Bujumbura?’, and in attempt to get
answer for the question a null hypothesis was formulated thus: ‘Ho2 There is no
significant effect of mobilizations of savings on the growth of SMEs in Bujumbura.
The results revealed that mobilizations of savings had a positive significant effect
on growth of small medium enterprises in Bujumbura, Burundi. In the first
instance the descriptive statistics shows that savings mobilizations is very high.
The Pearson’s linear correlation coefficient (PLCC) findings of this study indicated
that Mobilizations of savings had a very strong significant effect on the growth of
SMEs in Bujumbura. Similarly the results of the linear and multiple regression
also showed that Savings mobilizations is significantly and positively related with
growth of SMEs in Bujumbura.
The results of this research are also in agreement with the theory of pecking
order by the fact that this theory clarifies that profits or return earnings of
enterprises are kept in the form of savings, which savings will produce interest
and be used thereafter to finance business activities.
The finding was in line with the findings of Mulungi and Kwagala (2015) who
concluded that the level of accessibility of the savings services had a positively

55
significant relationship with the business growth that the selected Small and
Scale Enterprises in Uganda attained in terms of sales revenue, profits, business
expansion, and product range.
5.1.3 Effect of financial skills training and growth of SMEs in
Bujumbura, Burundi
The research question that guided this objective was ‘What is the impact of
financial skill training on the growth of small and medium enterprise in
Bujumbura? ’ And in attempt to get answer for the question a null hypothesis
was formulated thus: ‘H03 There is no significant effect of financial skill training
on the growth of small and medium enterprises.
The findings for this objective were that financial skills training affects
significantly and positively growth of small and medium enterprises. In the first
instance the descriptive statistics shows that financial skills training is very
strong. The Pearson’s linear correlation coefficient (PLCC) findings of this study
indicated that financial skills training had very strong and positive significant
relationship with growth of SMEs in Bujumbura. Similarly the results of the linear
regression also showed that financial skills training has a significant and positive
effect on the growth of SMEs in Bujumbura.
The results of this research support the theory of goal setting theory(Locke and
Latham, 1990).in fact, the more individuals are motivated to complete something
while having a perfect knowledge of the objectives to reach them and means
whereby they achieve them, the more individuals will complete great
performance(Locke and Latham,1986).
The finding was in line with the findings of Innocent and Wallace (2016) who
studied and found that training offered by MFIs to its clients in Kisii town in
Kenya, are most effective and therefore the training programmes which were
offered by microfinance institutions in the town majorly facilitates the increase in
profitability of small and medium enterprises in the town of Kisii.

56
5.2 Conclusions
Based on the findings of the study the following conclusions were drawn. The
purpose of this study was to evaluate the effect of microfinances services on the
growth of SMEs in Burundi in a survey conducted in three districts in
Bujumbura(Buyenzi, Rohero and Ngagara) by analysing the responses obtained
through questionnaires using descriptive analysis, Pearson’s linear correlation
coefficient (PLCC), regression analysis and multiple regressions analysis.
The effect of Loan Provision in the growth of Small and Medium
Enterprises in Bujumbura, Burundi
On the first objective based on the findings, the researcher concluded that Loan
Provision has a very high capability of contributing in the Growth of SMEs in
Bujumbura, Burundi. This is due in some point to the rates of interest charged by
microfinance institutions on the loans received which are relatively affordable for
timely repayment in Bujumbura. Thus, providing access to loans through
microfinance helps small and medium enterprises having an income-generating
activities for their business.
The effect of Savings Mobilizations on the Growth of SMEs in
Bujumbura, Burundi
On the second research objective, the researcher concluded that Savings
Mobilization has a high capability of contributing positively in the performance of
SMEs in Bujumbura in Burundi. The positive nature of the effect of savings on
growth of SMEs meant that strengthening savings by improving accessibility to
the savings services would translate into a significant improvement in the
business growth of SMEs in terms of sales revenue, profitability, sales expansion,
and creation of job.
57
The effect of financial skill training on the growth of small and medium
enterprises in Bujumbura, Burundi
The researcher on the third objective concluded based on the findings that
financial skills training affects considerably the growth of SMEs in Bujumbura
Burundi, this may be explained by the argument that financial literacy helps in
empowering and educating investors so that they are knowledgeable about
finance in a way that is relevant to their business and enables them to use this
knowledge to evaluate products and make informed decisions for the
performance of their enterprises.
5.3. Recommendations
Based on the findings and conclusions of the study, the researcher made
the following recommendations
1. Small financing institutions such as Microfinance Institutions should
encourage the growth of small and medium enterprises by promoting soft
loans to entrepreneurs in Bujumbura, Burundi. Furthermore, the
researcher recommends that SMEs should establish a good credit history
with credit institutions in order to easily access the loan finance. In the
perspective of a Government efforts to build a healthier and more inclusive
financial system, the government should create or improve the existing
framework of policies, regulations, institutions and initiatives aimed at
covering their population financial needs, especially through microfinance
credit provision.
2. Based on the finding of the second objective of the study, the research
recommends that the government should also intervene to ensure that
MFIs set savings interest rates that attract individuals to save.
3. On the third research objective, the researcher recommends that
additional training should be provided by microfinance institutions to small
and medium enterprises. Furthermore, the study recommends that owners
or staff of SMEs should consider enrolling in a financial education program

58
or any other related program to improve their capacity to perform in term
of managing loan finance and how strategically save their funds.
5.4 Contribution to knowledge
It is acknowledged in this research study to provide more light as to why there is
a need for putting up proper policy on serving services and loans in a business
regardless its environment of operations. It enabled entrepreneurs investing in
small scale businesses to improve the management purposely to attain the
business objectives or targets. Moreover, this research study provided a better
understanding of microfinance policies and how access to them can contribute to
the development of small and medium enterprises in Africa in general and
particularly to eastern countries. This generated useful insights that can be used
by the government and Non-governmental organizations to promote the
accessibility of credit to the small and medium enterprise from microfinance
institutions and to ensure that policies are implemented to facilitate easy access
of loans by SMEs from MFIs by improving the microfinances’ policies focusing on
financial growth in developing countries. Therefore, policy makers, educators,
shareholders, borrowers, scholars, investors, public and private organizations in
the global arena are called to adopt proper techniques of credit controls for small
scale businesses will generate a back borne to the development if taken into
consideration.
5.5 Suggested Area for further Research
1. Further research can be undertaken on the effect of financial training literacy
on the growth of SMEs, the results can be compared with the results of this
study.
2. Further research can be undertaken on the effect of Loan provision on the
growth of small and medium enterprises.
3. Further research can be undertaken on the Role of Micro-finance institution in
Funding Small and Medium Enterprises

59
5.6 Limitations of the study
The study was faced by a number of limitations relating to the scope.
First, the study only concentrated on SMEs in Bujumbura's informal settlements.
These firms cannot be a representative of all SMEs in Burundi or other localities.
Secondly, questionnaires were translated into another language which is different
from the language of its initial elaboration. Indeed, the various instruments of
gathering data and other relevant information of the study have been translated
into French to facilitate reading and comprehension to the respondents in
Burundi who are French speakers.
The scores given in response to the statements used for examining microfinance
services were mainly based on the respondents’ feel and intuition rather than
being calculated directly from audited financial statements.

60
REFERENCES
Abio and Emenike (2017). Microfinance Institutions ‘support and growth of small and
medium enterprises. Department of Accounting and Finance, College of Economics
and Management, Kampala International University Uganda. KINERJA
Adongo and Stork (2005). Factors Influencing the Financial Sustainability of Selected
Microfinance Institutions in Namibia. NEPRU Research Report No. 39
Alarape (2007). Entrepreneurship programs, operational efficiency and growth of small
businesses. Journal of Enterpris Commun: People Places Global Econ.
Amin (2005). Social Sciences Research Conception: Methodology and Analysis. Makerere:
Makerere University Printery.
Armendàriz (2000). “Microfinance Beyond Group Lending.” Economics of Transition 2000.
Microfinance Beyond Group Lending. Economics of Transition 8: 401-420.
Asiama (2007). "Microfinance In Ghana: An Overview". Department of Research, Bank of
Ghana. pp1-15
Ayele (2015).Microfinance Institution in Ethiopia , Kenya and Uganda: Loan outreach to the
poor and the quest for financial viability. Africa review, 27(2), 117- 129.
http://doi.org/10.1111/1467-8268.12128
Banerjee and Jonathan (2015). Six Randomized Evaluations of Microcredit: Introduction and
Further Steps.” American Economic Journal: Applied Economics 7(1): 1–21.
Banque de la Republique du Burundi. (2012). Enquête National sur l’Inclusion Financière au
Burundi.
Beaver (2005). Training and developing an age diverse workforce in SMEs: The need for a
strategic approach. Education & Training, Vol. 47, No. 8/9, pp.592
Beck (2012).Financial sector Development in Africa: Opportunities and challenges.
Directors in development. Washington D.C: World Bank.
Beck and Uy (2009).Finance in Africa: Achievements and Challenges. In the Africa
competiveness Report 2009. Geneva: World economic Forum.
Berger (1998). The economics of small business finance: the roles of private equity and
debt markets in the financial growth circle. Journal of Banking and Finance, 9 No. 22,
pp. 873-897

61
Bett (2014). Influence Of Microfinance Institutions Services On Growth Of Women
Owned Small And Micro Enterprises In Ainabkoi Sub-County, Uasin-Gishu County,
Kenya. A Masters of Arts Degree project in Project Planning and Management of the
University of Nairobi.
Bhutt and Tang (2001). Delivering Microfinance in developping country: Contreversy and
policies perspectives. Policies studies journal, 29(2), 319-322. http//
doi.org/10.1111/j.1541-0072.2001.tb02095.x
Blumberg and Pamela (2011). Business Research Methods .Schindler-Paperback
International Edition.
Bruhn (2011). Stimulating managerial capital in emerging markets. The impact of business
and financial literacy for young entrepreneurs. Policy research working paper.
business owners. Journal of Small business management, 22(6-7): 565-86.
Carpenter(2002). Is the Growth of Small Firms Constrained by Internal Finance?-The
Review of Economics and Statistics.
Chakrabartty (2013). Best Split-Half and Maximum Reliability. Journal of Research &
Method in Education (IOSR-JRME). E-ISSN: 2320–7388, p-ISSN: 2320–737X Volume
3, Issue, PP 01-08
Chimucheka (2011). The impact of inaccessibility to bank finance and lack of financial
management knowledge to small, medium and micro enterprises in Buffalo City
Municipality. South Africa African Journal of Business Management Vol. 5(14), pp.
5509-5517,
Chowdhury (2008). Infrared spectroscopic characterization of chitosan extracted from the
exoskeleton of Scylla serrata. Primeasia studies.
Churchill and Lewis (1983). Growth Issues for Small Businesses. Cliffs, NJ, US; Prentice-Hall,
Inc.
Cohen (1993). The Portable MBA in Management. Insights from Experts at the Best
Business Schools; Skills and Strategies for Leading any Organisation to Success.
John Willey & Sons Inc. New York.
Conning (2011). “Microfinance and Social Investment.” Annual Review of Financial
Economics, vol. 3, ed. Robert Merton and Andrew Lo. 2

62
Copestake (2014). “Assessing the impact of microcredit: A Zambia Case Study”,
Journal of Development Studies, 37(4), 81-100, Entrepreneurship Theory and
practice, 24(4): 79-80.
Fabayo (2009). Small and medium enterprises development strategy: A critical
option for sustainable long–term economic development in Nigeria. A paper
presented at the first Annual International Conference; Abraham Adesanya
Polytechnic, Ijebu-Ode held from 25-27 August.
Fiddler (1996). informal sector and microfinance institutions in West Africa World
Bank Regional and sectors studies. Washington D.C
Gardial (2004). Mobilizing savings key issues and good practices in savings promotion.
Sweden: Swiss Agency for Development and Cooperation.
Graham (2009). Mobilizing savings. In MicroSave (ed). Savings: An essential service for the
poor.
Gupta (1996). Managerial implication of flexible manufacturing for small/medium
enterprises. TheInternational Journal of Technological Innovation, Entrepreneurships
and Technology Development, Vol. 16, No. 2, pp. 77-83.
Hermes (2014). Does microfinance affect income inequality? Applied Economics, 46(9),
Hisrich (2000). Entrepreneurial dimensions: the relationship of individual venture,
Hogarth and Hilgert (2002), Financial knowledge, experience and learning
Holmes (1991). An Empirical Analysis of the Financial Structure of Small and Large
Australian Manufacturing Enterprises. Journal of Small Business Finance, 1(2) 141-
154.
Hossain (2014). Credit for the alleviation of rural poverty: The Grameen Bank in
Bangladesh. IFPRI Research Report, 65 International Journal of
Entrepreneurship and Small Business, 7 (3), 285-311.
Hulme (1998). Microenterprise finance: is there a conflict between growth and poverty
alleviation? World dev 26(5): 783-790
Hulme (1996). Finance Against Poverty, Vol. 1, London: Routledge.

63
Idowu (2010). An empirical Investigation of Small and Medium Enterprises access to Bank
finance: Case study of emerging economy. Proceedings of ASBBS. interests annual,
48, 1-7.
International Trade Center, (2011).Microfinance in East Africa: Schemes for women in the
coffee sector.Geneva.Doc.no.SC-11-195.E.
Johnson (2008). Social Capability and Economic Growth. The Quarterly Journal of
Economics, Vol. 113, No. 3 (Aug., 1998), pp. 965-990
Kalala (2001). Savings products and services in the informal sector and microfinance
institutions in West Africa: The case of Mali and Benin. MicroSave– Market-led
solutions for financial services.
Karim (2015).The impact of Microfinance on the growth of Micro and small enterprises in
Tanzania: case study of Mwanza City.
Katine (2008) the guardian Retrivied at
https://www.theguardian.com/katine/2008/jun/03/livelihoods.projectgoals1
Kessy (2006). The Contribution of Microfinance Institutions to Poverty Reduction in
Tanzania, Research Report No. 06.3 – REPOA, Mkuki na Nyota Publishers, Dar es
Salaam.
Kotey and Meredith (1997). The benefits of micro finance institutions (mfis)
Laetitia and Luvanda (2015). Microfinance and business growth of women small and
medium enterprises in Rwanda: A case of selected women small and medium
enterprises in Kicukiro district. European Journal of Accounting, Auditing and
Finance Research, 3(11), pp. 26-39.
Ledgerwood (1999). the role of Microfinance service in the growth of small and medium
enterprise.
Locke (1990). A theory of goal setting and task performance. Englewood
Luk (1996). Success in Hong Kong: Factors self-reported by successful small medium
enterprises.
Makhbul (2011). Entrepreneurial success: An exploratory study among entrepreneurs.
International Journal of Business Management, 1(6):1-10
Mariama (2007).Microfinance au Burundi .Women’s World Bank.

64
Masudur and Laila (2014). Implementing financial service policies
Modigliani (1988). "The Role of Intergenerational Transfers and the Life-cycle saving in the
Accumulation of Wealth", Journal of Economic Perspectives, n. 2, 1988
Mosley (1999). Microfinance and poverty: Bolivia case study. Draft University of reading,
England.
Mugenda and Mugenda (2003). Research methods: Quantitative and qualitative
approaches. Nairobi Kenya: African Centre for Technology Studies
Mulungi and Kwagala (2015). Accessibility of microfinance savings services and its
effect on business growth of small enterprises in Uganda: A case of pride
microfinance branches and their small scale enterprise clients in Kampala. Research
Journal’s journal of management, 3(5), pp. 1-20
Mutua (2017). Effect of microfinance services on poverty reduction in Makueni County.
Unpublished Master of Business Administration Thesis, South Eastern Kenya
University.
Myers (1984). Capital Structure Puzzle. NBER Working Paper No. w1393. Consultative
Group to Assist the Poor (CGAP).
Myers (1984). "Corporate financing and investment decisions when firms have
information that investors do not have". Journal of Financial Economics. 13 (2): 187–
221. Doi: 10.1016/0304-405X (84)90023-0.
Ndayishimiye (2008). Le sector de la micro finance au Burundi: presentation during a
workshop on exchange of experiences and good practices in microfinance. Orphan’s
Aid Centre, Bujumbura, p.3-5
Ngendahayo (2006). Micro finance au Burundi: Une analyse du texte de réglementation”
Zamuka n°3, RIM, Bujumbura, p.3-5
Ngugi and Kerongo (2014). Effects of Micro-Financing on Growth of Small and Micro
Enterprises in Mombasa County. International Journal of Scientific Engineering and
Research (IJSER) Volume 2 Issue 4, April 2014 Nigeria. American Journal of
Contemporary research, 4 (6).
Nkurunziza and Nyamoya (2012). The financial Sector in Burundi, Working Paper 18289,
National Bureau of Economic Research ,Massachussetss, August.

65
Osinde (2013). Effect of business development services on the performance of small
scale entrepreneurs in Kenya. A survey of small scale enterprises in kisii
municipality.
Pollinger (2007), the Question of Sustainability for Microfinance Institutions. Journal of
Small business Management pp. 23-41. preferences: Preliminary results from a new
survey on financial literacy.
Republique du Burundi Ministere des Finances. (2015). Diagnostic du secteur de la
Microfinance au Burundi. Bujumbura.
Robert (2017). Microfinance and Economic Development. New York University.
Robinson (1998). The Paradigm Shift From credit Delivery to Sustainable Financial
Intermediation
Robinson (2001).The Microfinance revolution. Sustainable finance for the poor: The
International Bank for Reconstruction and Development, The World Bank,
Washington DC,
Romano (2001). Capital Structure Decision Making: A Model for Family Business. Journal of
Business Venturing, 16(3). 285 – 310.
Saunders (2012). SME innovation and learning: the role of network and crisis events.
European journal of training and development
Schlogl (2004). Small and medium enterprises: Seizing the potential. Organizational for
Economic Cooperation and Development, No. 243, pp. 46-48.
Schmidt (2014), Critical issues in micro business finance and the role of donors (pp.
105-113). Germany: Interdisciplinary Project Consult GmbH.
Sievers (2004). Synergies through Linkages: Who Benefits from Linking Micro-Finance and
Business Development Services?’ World Development, Vol. 35, No. 8, 1341-1358
Signoriello (1991), Commercial Loan Practices and Operations, ISBN 978-1-55520-
134-0
Simeyo et al (2012).Effect of provision of microfinance on the performance of micro
enterprise: a study of youth micro enterprises under Kenya rural enterprise
program, Kisii county ,Kenya. African journal of Business management vol. 5(20)

66
Snell and Lau (1994). Exploring Local Competencies salient for expanding small
businesses. Journal of Management Development, Vol. 13, No. 4, pp. 4-15
Söhnke and Waller (2013). How important is financial risk? Journal of Financial and
Quantitative Analysis (JFQA). [Online]. Available:
http://papers.ssrn.com/sol3/papers.cfm?abstract_id=2307939 [July 22, 2014]
Stiglitz (2014). Peer monitoring and Credit Markets (pp.4,351-366). Washington D.C.:
World Bank
Suberu (2011). The impact of microfinance institutions on the development of small
scale enterprises in Nigeria. Journal of Research in International-Business
Management (ISSN: 2251-0028) Vol. 1(8) pp. 251-257
Tavakol (2011). Making sense of Cronbach’s alpha. International Journal of Medical
Education International
Thorsten and Samuel (2012). Financial Sector Development in Africa Opportunities and
Challenges.
Ubom. (2003). Microfinance and entrepreneurship in Nigeria.University of New York
Press. 50-88,
Westhead and Storey (1996). Management training and small firm performance:
why is the link so weak? International Small Business Journal, Vol. 14, No.
4, pp.13-24.
Whonderr (2009). Modern financial management theories & small businesses. [Online].
Available:http://ezinearticles.com/?Modern-Financial-Management-Theories-and-
Small-Businesses&id=2298837 .
Wilson and Jacobson (2014). Financing small business enterprises: Sources of information.
[Online]. Available: http://www.loc.gov/rr/business/guide/guide3/.
World Bank (1999). Burundi: Poverty Note. Prospects for social protection in a crisis
economy. Report No. 17909-BU. Washington, DC.
World Bank. (2010). World Development Indicators, online access.
World Bank. 2013. World development report 2013. The state in a changing World. New
York. Oxford University Press.

67
Yasin (2013). “The Accessibility of Microfinance for Small Businesses in Kampala,
Uganda”. International Journal of Humanities and Social Science. 11(3); 172-
173
Yates et al (2008). The Practice of Statistics, 3rd Ed. Freeman. ISBN 978-0-7167-7309-2
Yunus (2008). Creating a World without Poverty: Social Business and the Future of
Capitalism. New York: Public Affairs.
Yunus (2006). Expanding Microcredit Outreach to Reach the Millennium Development
Goals. International Seminar on Attacking Poverty with Microcredit, Dhaka,
Bangladesh.
Yusuf (2014). Effect of microfinance on small scale enterprise in Osun State,

68
APPENDIX I: TRANSMITTAL LETTER

69
APPENDIX II: INTRODUCTION LETTER

70
APPENDIX III: INFORMED CONSENT

71
APPENDIX IV: RESEARCH INSTRUMENT:
QUESTIONNAIRE
Dear respondent,
I am Koriciza Bollar, a student of Kampala International University.as part of my
requirement to the award of a Master in Business Administration, I am
administering this questionnaire to collect the information in regard to my survey
on the effect of Microfinance services on the growth of small and medium
enterprises in Burundi. The researcher has identified you as one of the
respondents, so kindly spare some minutes of your precious time and respond to
these questions as correctly as you can. This research is for academic purposes
and your answers to the questions was treated with confidentiality.
INSTRUCTIONS
1. Do not sign your name anywhere on this questionnaire
2. Tick or fill appropriately
SECTION A:
Background information
1. Gender
Male female
2. Age group
20-30 31-40 41-50 above 50
3. Level of education
Primary secondary Tertiary
4. Marital status
Married single other (s) specify ………..

72
SECTION B: Microfinance services in small-scale enterprises
Respond to the following statements by selecting the option which best describes
how you assess the statement
1: Strongly Disagree 2: Disagree 3: Agree 4:
Strongly Agree
I. LOAN PROVISION IN SMALL-SCALE ENTERPRISES
N Questions items 1 2 3 4
1 Loans applications and approval process at microfinance
institutions are fast enough to my satisfaction.
2 interest charged by MFIs are relatively affordable for
timely repayment
3 I always attain capital for business re-engineering from
the microfinance
4 The loan provided is adequate to meet my needs of
business operations
5 There is no collateral security required for the
attainment of seed capital
II. MOBILISATIONS AND SAVINGS IN SMALL AND SCALE
ENTERPRISES.
N Questions items 1 2 3 4
1 The microfinance organisations enable us in saving
our money
2 The microfinance institutions enable us to easily
access the savings

73
3 There is mobilisation of group savings by the
microfinance organisation
4 We attain interest on the savings made by the
microfinance institution
5 There is adequate storage of the savings made by the
microfinance institution
6 There is assurance that the savings made by MFIs are
safe
III. FINANCIAL SKILLS TRAINING IN SMALL AND SCALE
ENTERPRISES.
N Questions items 1 2 3 4
1 Microfinance provide saving and deposit facilities
training
2 There is provision of loan facilities acquisition
training
3 Microfinance provide repayments and
consequences of defaults
4 Microfinance provide business initiation skills
5 There is provision of business administration skills
by the MFIs
6 Group mobilisation formation skills in organisation
skills in organisation

74
SECTION C: GROWTH OF SMALL SCALE ENTERPRISES
N Questions items 1 2 3 4
Profitability
1 MFIs have contributed to cost reduction in the way I run my
business as SME owner.
2 The supports of MFIs have made it possible for me as SME
owner to minimize wastage and spoilage of stock.
3 through the supports of MFIs I am able to fully train my
employee(s) to run daily operation as I focus on key
business activities
Growth in sales
4 MFIs training have contributed to improved marketing skills
like pricing for my products for me as SMEs owner.
5 MFIs have contributed to customer creation skills in the way
I run my business as small and medium enter
prise in Bujumbura.
6 MFIs have contributed to improved level of my business
revenue as small and medium enterprise.
Employment creation
7 My business SME has become an important actor in
employment creation among the local community and as a
SME owner i am able to meet my social responsibilities.
8 my small and medium enterprise has contributed to
improved standard of living for me as SME owner
9 my small and medium enterprise has contributed to
increase level of income for me as SME owner and others

1
APPENDIX V: SPSS OUTPUT
Model Summaryb
Model R R Square
Adjusted R
Square
Std. Error of the
Estimate
Change Statistics
Durbin-Watson R Square Change F Change df1 df2 Sig. F Change
1 .868a .753 .752 .24610 .753 521.310 1 171 .000 1.781
a. Predictors: (Constant), loan provision index
b. Dependent Variable: growth index
Coefficientsa
Model
Unstandardized Coefficients
Standardized
Coefficients
t Sig.
Collinearity Statistics
B Std. Error Beta Tolerance VIF
1 (Constant) .442 .137 3.233 .001
loan provision index .871 .038 .868 22.832 .000 1.000 1.000
a. Dependent Variable: growth index
Model Summaryb
Model R R Square
Adjusted R
Square
Std. Error of the
Estimate
Change Statistics
Durbin-Watson R Square Change F Change df1 df2 Sig. F Change
1 .846a .716 .714 .26411 .716 430.092 1 171 .000 1.317
a. Predictors: (Constant), savings index

2
Model Summaryb
Model R R Square
Adjusted R
Square
Std. Error of the
Estimate
Change Statistics
Durbin-Watson R Square Change F Change df1 df2 Sig. F Change
1 .846a .716 .714 .26411 .716 430.092 1 171 .000 1.317
b. Dependent Variable: growth index
Coefficientsa
Model
Unstandardized Coefficients
Standardized
Coefficients
t Sig.
Collinearity Statistics
B Std. Error Beta Tolerance VIF
1 (Constant) .215 .161 1.337 .183
savings index .915 .044 .846 20.739 .000 1.000 1.000
a. Dependent Variable: growth index
Model Summaryb
Model R R Square
Adjusted R
Square
Std. Error of the
Estimate
Change Statistics
Durbin-Watson R Square Change F Change df1 df2 Sig. F Change
1 .862a .744 .742 .25060 .744 496.669 1 171 .000 1.663
a. Predictors: (Constant), training index
b. Dependent Variable: growth index

3
Coefficientsa
Model
Unstandardized Coefficients
Standardized
Coefficients
t Sig.
Collinearity Statistics
B Std. Error Beta Tolerance VIF
1 (Constant) .666 .130 5.129 .000
training index .804 .036 .862 22.286 .000 1.000 1.000
a. Dependent Variable: growth index
Model Summaryb
Model R R Square
Adjusted R
Square
Std. Error of the
Estimate
Change Statistics
Durbin-Watson R Square Change F Change df1 df2 Sig. F Change
1 .899a .808 .805 .21808 .808 237.528 3 169 .000 1.711
a. Predictors: (Constant), training index, savings index, loan provision index
b. Dependent Variable: growth index

4
Coefficientsa
Model
Unstandardized Coefficients
Standardized
Coefficients
t Sig.
Collinearity Statistics
B Std. Error Beta Tolerance VIF
1 (Constant) .156 .134 1.170 .244
loan provision index .312 .087 .311 3.583 .000 .150 6.654
savings index .317 .076 .293 4.152 .000 .228 4.383
training index .314 .074 .337 4.220 .000 .178 5.615
a. Dependent Variable: growth index