Embed Size (px)
Citation preview
i
MICROFINANCE AND FINANCIAL PERFORMANCE OF SMALL AND MEDIUM
ENTERPRISES IN TANZANIA: A CASE STUDY OF ILALA MUNICIPALITY
A DISSERTATION
SUBMITED TO THE DIRECTORATE OF POSTGRADUATE
STUDIES AND RESEARCH, KAMPALA INTERNATIONAL
UNIVERSITY IN TANZANIA
IN PARTIAL FULFILLMENT OF THE REQUIREMENT FOR THE AWARD DEGREE
OF MASTER IN BUSINESS ADMINISTRATION
BANKING AND FINANCE
BY
HALIPHA IDDY MNUNKA
MBA/18546/602/DT
NOVEMBER 2018

i
DEDICATION
I author of this dissertation I dedicate this to my beloved parents Mr and Mrs Iddy Mnunka
without them I wouldn’t be at this point of my life ,they lifted me up when I fell and gave me
hope ,may the almighty God bless them without them I would have not been here today.

ii
AKNOWLEDGEMENT
I thank God for enabling me finish this work though under hectic and cumbersome situation
including unexpected changes in the course of producing this work.
The entire Dissertation has not been an individual work. Contributions have been made by many
people whom I cannot list all, but for sure they are to remain in my memory. I must appreciate
that without their support, my work could have been more difficult and impossible.
My highest appreciation goes to Dr Wario Wako, my Supervisor, for being part of this work by
tirelessly reading, correcting and guiding me by giving constructive comments.
I do thank my family especially my beloved wife Maureen for the perseverance she showed
during the preparation of this work.
I thank all the SMEs which responded positively when I was collecting data. Here I want to
specifically thank to Ilala municipal Executive director for his supported provided from his
office as well as SMEs within Ilala Municipal.
Also my classmates Scarion Oscar and Nuwahereza susan, Last and not least the Kampala
international university -Tanzania for provision of humble learning environment that facilitated
accomplishments of my academic goals.
iii
DECLARATION A
I hereby declare that this research report on Microfinance and Financial Performance of Small
and Medium Enterprises: A case study of Ilala Municipal in Tanzania is conducted under my
supervision.
Name of Supervisor
DR WAKO.
Signature of Supervisor
-----------------------------------
Date-----------------------------
iv
DECLARATION B
I hereby declare that this research report on Microfinance and Financial Performance of Small
and Medium Enterprises: A case study of Ilala Municipal in Tanzania, is my original work and
has not been presented for a degree or any other academic award in any other university or
institution of learning.
Name of Candidate
HALIPHA IDDY MNUNKA
Signiture of Student
--------------------------
Date
v
APPROVAL
“This disertation entitled “MICROFINANCE AND FINANCIAL PERFORMANCE OF
SMALL AND MEDIUM ENTERPRISES A CASE STUDY OF ILALA MUNICIPAL IN
TANZANIA”prepared by Halipha Iddy mnunka in partial fulfillment of the requirement for the
award degree of masters of business adminstration- finance and banking has examined and
approved by the pannel on oral examination has been submitted for examination with my
approval as authorized univesity supervisor
Name of Supervisor
DR WAKO.
Signature of Supervisor
-----------------------------------
Date-----------------------------
Name of Director of the Directorate of Postgraduate and Research
………………………………………………………….
Signature of the Director
……………………………………………………………
Date
vi
TABLE OF CONTENTS
DEDICATION ................................................................................................................................. i
AKNOWLEDGEMENT ................................................................................................................. ii
DECLARATION A ....................................................................................................................... iii
DECLARATION B ....................................................................................................................... iv
APPROVAL ................................................................................................................................... v
TABLE OF CONTENTS ............................................................................................................... vi
LIST OF TABLES ....................................................................................................................... viii
LIST OF FIGURE........................................................................................................................... x
LIST OF ACRONYMS ................................................................................................................. xi
CHAPTER ONE ............................................................................................................................. 1
INTRODUCTION .......................................................................................................................... 1
1.1 CHAPTER OVER VIEW ......................................................................................................... 1
1.2 Background of the Study .......................................................................................................... 1
1.3 Statement of the Problem .......................................................................................................... 6
1.4 Objectives of the Study ............................................................................................................. 7
1.5 Research Questions ................................................................................................................ 8
The study was guided by the following research questions;........................................................... 8
1.6 Hypothesis ................................................................................................................................. 8
1.7 Scope of the Study .................................................................................................................... 8
1.8 Significance of the Study .......................................................................................................... 9
1.9 Operational Definition of Key Terms ..................................................................................... 10
CHAPTER TWO .......................................................................................................................... 12
LITERATURE REVIEW ............................................................................................................. 12
2.1 Introduction ............................................................................................................................. 12
2.2 Theoretical Literature Review ................................................................................................ 12
2.3 Conceptual Framework ........................................................................................................... 15
2.4 Empirical Literature Review ................................................................................................... 16
2.5 Research Gap .......................................................................................................................... 22
CHAPTER THREE ...................................................................................................................... 24
METHODOLOGY ....................................................................................................................... 24
vii
3.1 Introduction ............................................................................................................................. 24
3.2 Research Design...................................................................................................................... 24
3.3 Study Population ..................................................................................................................... 24
3.4 Sample Size ............................................................................................................................. 25
3.5 Sampling Techniques. ............................................................................................................. 25
3.6 Data Collection Tool ............................................................................................................... 25
3.8 Validity and Reliability ........................................................................................................... 26
3.9 Data Analysis .......................................................................................................................... 27
3.10 Ethical Consideration ............................................................................................................ 28
3.11 Limitations of the Study........................................................................................................ 28
CHAPTER FOUR ......................................................................................................................... 29
DATA PRESENTATION AND ANALYSIS .............................................................................. 29
4.1 Introduction ............................................................................................................................. 29
4.2 General profile of the respondents .......................................................................................... 29
4.3 Influence of provision of credit facilities on financial performance of SMEs. ..................... 32
4.4 Effect of savings mobilization on financial performance of SMEs ........................................ 37
4.5 Financial skills training and financial performance of SMEs. .............................................. 42
4.6 Small and Medium Enterprises Performances (SMEs). ...................................................... 47
CHAPTER FIVE .......................................................................................................................... 55
SUMMARY, CONCLUSION AND RECOMMENDATIONS. .................................................. 55
5.1 Introduction. ............................................................................................................................ 55
5.2 Summary. ................................................................................................................................ 55
5.3 Conclusion. ............................................................................................................................. 57
5.4 Recommendations. .................................................................................................................. 58
REFERENCES. ............................................................................................................................ 60
APPENDICES .............................................................................................................................. 70
APPENDIX I: QUESTIONNAIRE. ............................................................................................. 70
APPENDIX II: RESEARCH BUDGET. ...................................................................................... 74
APPENDIX III: RESEARCH TIME FRAME ............................................................................. 75
viii
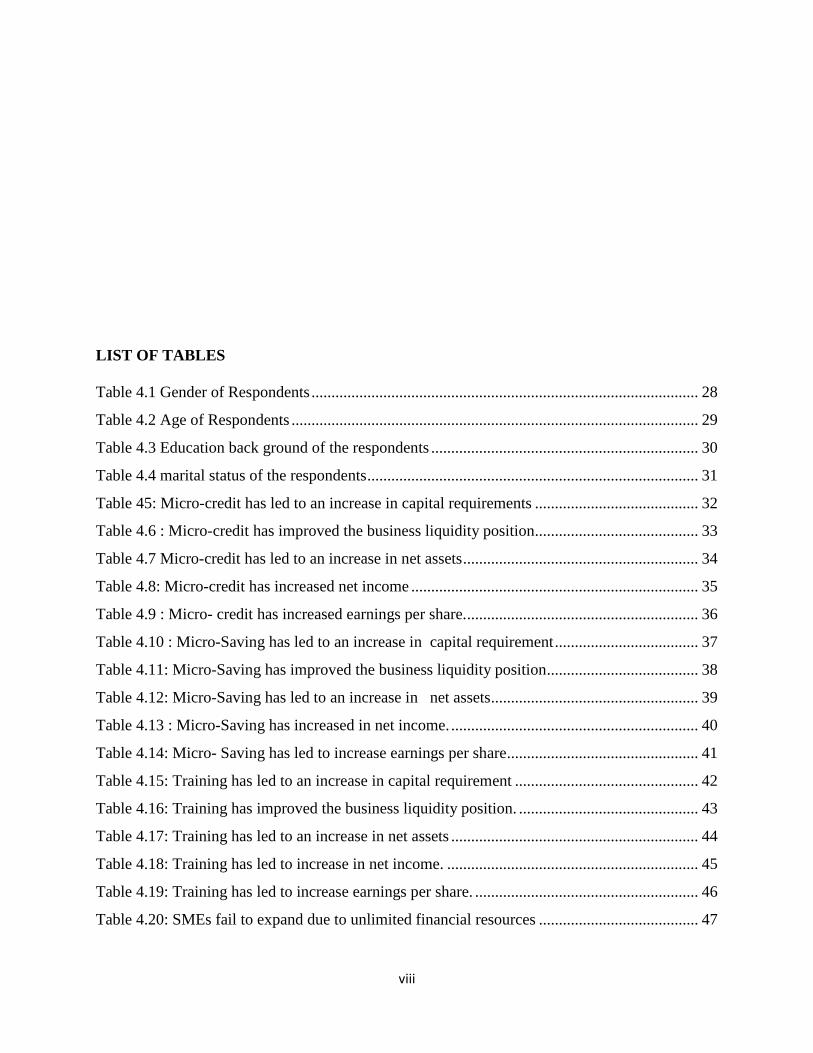
LIST OF TABLES
Table 4.1 Gender of Respondents ................................................................................................. 28
Table 4.2 Age of Respondents ...................................................................................................... 29
Table 4.3 Education back ground of the respondents ................................................................... 30
Table 4.4 marital status of the respondents ................................................................................... 31
Table 45: Micro-credit has led to an increase in capital requirements ......................................... 32
Table 4.6 : Micro-credit has improved the business liquidity position......................................... 33
Table 4.7 Micro-credit has led to an increase in net assets ........................................................... 34
Table 4.8: Micro-credit has increased net income ........................................................................ 35
Table 4.9 : Micro- credit has increased earnings per share. .......................................................... 36
Table 4.10 : Micro-Saving has led to an increase in capital requirement .................................... 37
Table 4.11: Micro-Saving has improved the business liquidity position ...................................... 38
Table 4.12: Micro-Saving has led to an increase in net assets.................................................... 39
Table 4.13 : Micro-Saving has increased in net income. .............................................................. 40
Table 4.14: Micro- Saving has led to increase earnings per share ................................................ 41
Table 4.15: Training has led to an increase in capital requirement .............................................. 42
Table 4.16: Training has improved the business liquidity position. ............................................. 43
Table 4.17: Training has led to an increase in net assets .............................................................. 44
Table 4.18: Training has led to increase in net income. ............................................................... 45
Table 4.19: Training has led to increase earnings per share. ........................................................ 46
Table 4.20: SMEs fail to expand due to unlimited financial resources ........................................ 47
ix
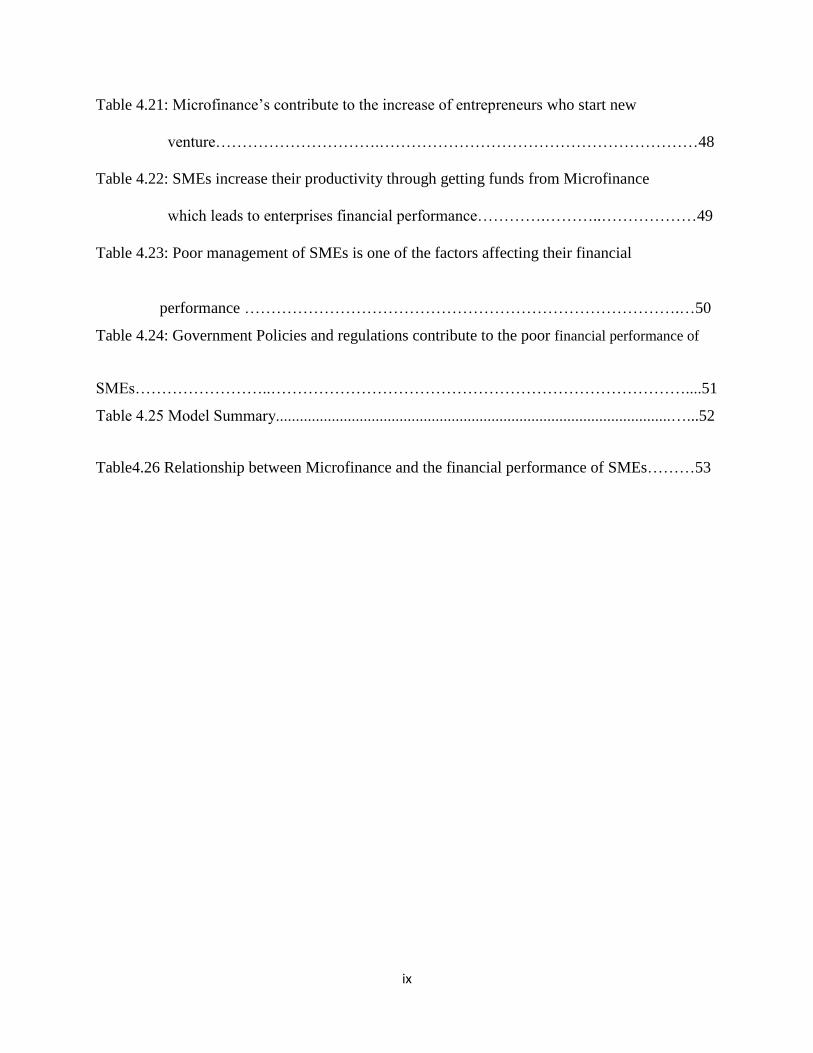
Table 4.21: Microfinance’s contribute to the increase of entrepreneurs who start new
venture………………………….……………………………………………………48
Table 4.22: SMEs increase their productivity through getting funds from Microfinance
which leads to enterprises financial performance………….………..………………49
Table 4.23: Poor management of SMEs is one of the factors affecting their financial
performance ……………………………………………………………………….…50
Table 4.24: Government Policies and regulations contribute to the poor financial performance of
SMEs……………………..……………………………………………………………………....51
Table 4.25 Model Summary...................................................................................................…...52
Table4.26 Relationship between Microfinance and the financial performance of SMEs………53

x
LIST OF FIGURE
Conceptual frame work.....................................................................................................15
xi
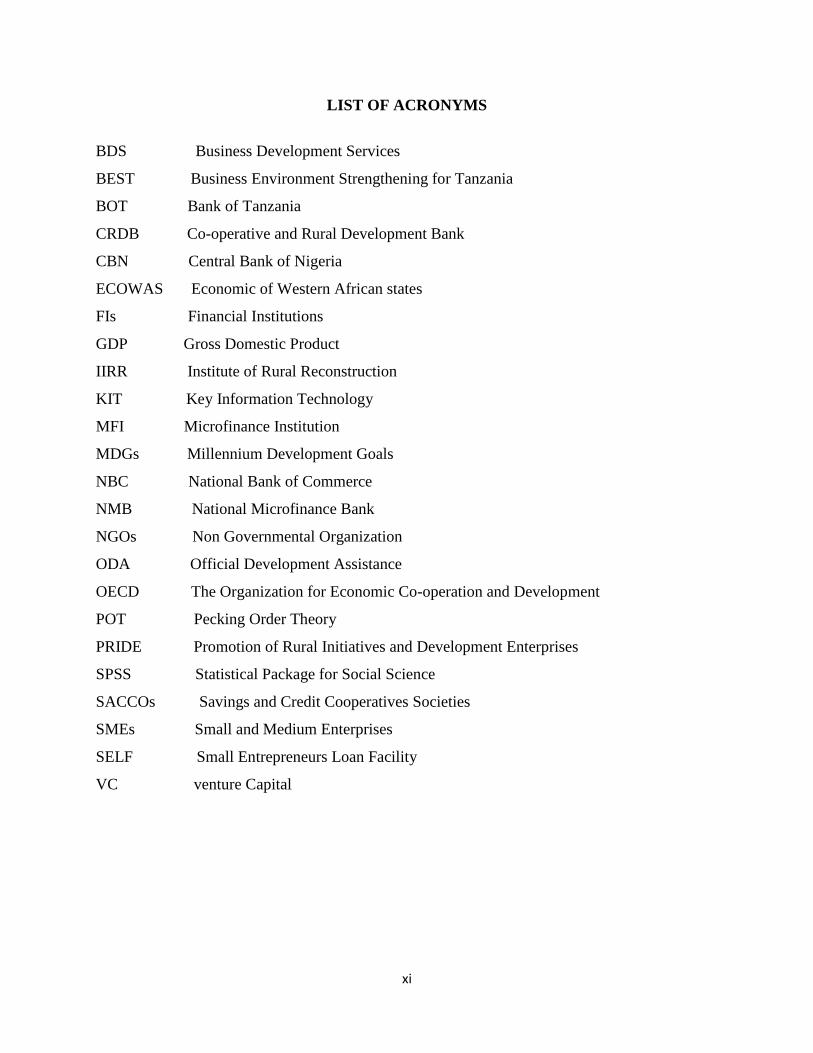
LIST OF ACRONYMS
BDS Business Development Services
BEST Business Environment Strengthening for Tanzania
BOT Bank of Tanzania
CRDB Co-operative and Rural Development Bank
CBN Central Bank of Nigeria
ECOWAS Economic of Western African states
FIs Financial Institutions
GDP Gross Domestic Product
IIRR Institute of Rural Reconstruction
KIT Key Information Technology
MFI Microfinance Institution
MDGs Millennium Development Goals
NBC National Bank of Commerce
NMB National Microfinance Bank
NGOs Non Governmental Organization
ODA Official Development Assistance
OECD The Organization for Economic Co-operation and Development
POT Pecking Order Theory
PRIDE Promotion of Rural Initiatives and Development Enterprises
SPSS Statistical Package for Social Science
SACCOs Savings and Credit Cooperatives Societies
SMEs Small and Medium Enterprises
SELF Small Entrepreneurs Loan Facility
VC venture Capital
xii
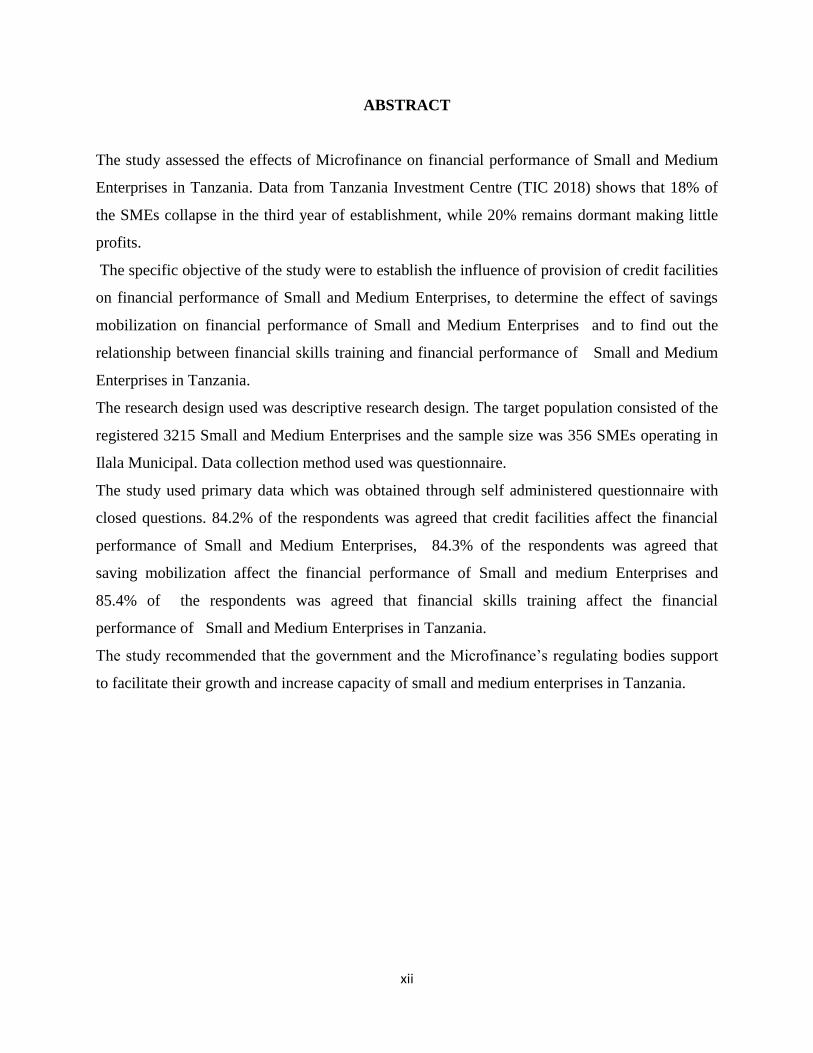
ABSTRACT
The study assessed the effects of Microfinance on financial performance of Small and Medium
Enterprises in Tanzania. Data from Tanzania Investment Centre (TIC 2018) shows that 18% of
the SMEs collapse in the third year of establishment, while 20% remains dormant making little
profits.
The specific objective of the study were to establish the influence of provision of credit facilities
on financial performance of Small and Medium Enterprises, to determine the effect of savings
mobilization on financial performance of Small and Medium Enterprises and to find out the
relationship between financial skills training and financial performance of Small and Medium
Enterprises in Tanzania.
The research design used was descriptive research design. The target population consisted of the
registered 3215 Small and Medium Enterprises and the sample size was 356 SMEs operating in
Ilala Municipal. Data collection method used was questionnaire.
The study used primary data which was obtained through self administered questionnaire with
closed questions. 84.2% of the respondents was agreed that credit facilities affect the financial
performance of Small and Medium Enterprises, 84.3% of the respondents was agreed that
saving mobilization affect the financial performance of Small and medium Enterprises and
85.4% of the respondents was agreed that financial skills training affect the financial
performance of Small and Medium Enterprises in Tanzania.
The study recommended that the government and the Microfinance’s regulating bodies support
to facilitate their growth and increase capacity of small and medium enterprises in Tanzania.
1
CHAPTER ONE
INTRODUCTION
1.1 CHAPTER OVER VIEW
This chapter describes of Background of the study, Statement of the problem, purpose of the
study Objective of the study, Hypothesis, Research questions, Research scope, Significance of
the study and Operational definitions of key terms.
1.2 Background of the Study
This part explains background of the study which included Historical Perspective, Theoretical
Perspective, Conceptual Perspective and Contextual Perspective.
1.2.1 Historical Perspective
In the world, countries have shown great attention to create an enabling environment for
promoting the growth of Small and Medium Enterprises (SME’s) to grow their economy and
reduce poverty. In June 2009, the OECD issued the “Bologna Charta on Small and medium
enterprises policies”. This charter recognized the importance of the SME’s in the growth of
economies. It was also found that SME’s are more labor-intensive than larger corporations and
thus more capable of employment creation. Some studies such as the stud made by Madole
(2013) Impact of microfinance on financial performance of Small and Medium Enterprises in
Tanzania suggest that SME’s create more value added per unit of capital and thus generate both
more employment and output for a given investment.
Small and Medium Enterprises in Pakistan face major problem in accessing finance (Khan &
Khalique, 2014). There are several microfinance institutions but still they met a very little
portion of the demand for access to finance (Asad, Shariff, & AlEkam, 2016). The demand for
initial startup capital and working capital is very high and the supply is limited (Thio,
Megananda, & Maulana, 2016).
The formal financial institutions for the provision of microfinance are unable to meet the demand
of low income earners (Ali, 2013). At the same time these formal financial institutions are unable
2
to meet the needs of micro enterprises for the growth of their businesses (Babajide, 2012). The
only source left for these low income earners or the owners of SMEs are banks which require
collateral (Kausar, 2013). Secondly, commercial banks prefer large businesses and prefer to give
huge loans at a high interest rate, which becomes difficult for the SMEs (Shahbaz, Javed, Dar, &
Sattar, 2014). Furthermore, because of lengthy procedure and documentation it becomes difficult
for the MSEs to get finance from the banks
Small and medium enterprises are critical factor for African countries where agriculture
represents up to 46% of GDP and where it employs on average 72% of the population.
Moreover, they are also often recognized as being a breeding place for entrepreneurs. Finally,
SME,s are considered to be more flexible in adapting to client requirements, being known for
their ability to adapt quickly to market trends, as most of the operating costs are variable (Bikki
et al., 2003).
Given the great potential of small and medium enterprises to bring about social and economic
development, it is of no surprise that the performance of SMEs is of all huge concern to the
government of different countries in the world. Small and medium sized enterprises in both
developing and developed countries play important roles in the process of industrialization and
economic growth, by significantly contributing to employment generation, income generation
and catalyzing development in urban and rural areas (Williams, 2006).
A crucial element in the development of the SME sector is access to finance, particularly to bank
financing, given the relative importance of the banking sector in serving this segment. Firm-level
data collected by the World Bank show that access to finance is perceived as one of the main
obstacles to doing business (World Bank, 2001). A number of studies such as Madole (2013)
Impact of microfinance on financial performance of Small and Medium Enterprises in Tanzania,
Yeboah (2010) contends that little progress has been made to establish microfinance institutions
(MFIs) as full-fledged financial intermediaries and MFIs offer only credit, and savings
mobilization remains the forgotten half of microfinance, have shown that financing is a greater
obstacle for SMEs than it is for large firms, particularly in the developing world, and that access
to finance adversely affects the growth of the SME sector more than that of large companies
(Schiffer et al, 2006).
3
The introduction of Microfinance Institutions (MFIs) is seen as the best alternative source of
financial services for SMEs as a means to stimulate their growth and raise their income, hence in
tern reducing their poverty level. Improved access and efficient provision of credit and savings
facilities in particular can enable the SME’s to manage their risks better, gradually build their
asset base, develop their enterprises, enhance their income earning capacity through
diversification of products(World bank 2006).
According to World Bank (2010), microfinance is largely applied in developing countries as
low-rate finance, using the unique technique of group lending as a financial service for the poor.
The less fortunate are thus enabled to gain control over their lives and become engines of
economic growth provided they put their skills to work.
SMEs have become important players in the Kenyan economy, but at the same time they
continue to face constraints that limit their development and financial performance. Lack of
access to financial services is one of the main constraints, and a number of factors have been
identified to explain this problem. These include the segmented and incomplete nature of
financial markets, which, increases transaction costs associated with financial services. On the
supply side, most formal financial institutions consider SMEs un-creditworthy, thus denying
them credit. Lack of access to financial resources has been seen as one of the reasons for the
slow growth of firms. Difficulties in accessing credit has held back the micro and small
enterprise sector in Kenya as most financial institutions view them as unstable and often place
tighter lending requirements before advancing credit (Atieno, 2009).
Improving access to funding for small and medium-sized enterprises is crucial in fostering
entrepreneurship, competition, innovation and growth in Kenya. Access to sufficient and
adequate capital to grow and further develop their activities is a difficulty faced by many Kenyan
SMEs. This situation is compounded by the difficulties in accessing finance as SME financing is
considered by many financial providers as a high risk activity that generates high transaction
costs and/or low returns on investment. Moreover, SMEs need to meet the challenge of adapting
to the changing financial environment and the increasing complexity and extent of financial
acquisition (Wajohi 2009).
4
Microfinance Institutions use different credit methodologies which serve as collateral substitute.
These microfinance institutions provide loans at simple terms and conditions without any lengthy
procedure, and have innovative recovery processes. Along with financial access, another major
issue is lack of business skills (Asad, Haider, Akhtar, & Javaid, 2011). Several studies have been
conducted in different countries regarding the importance of training for gaining high
performance from MSEs (Bembenutty, White, & Vélez, 2016; Karlan & Valdivia, 2011).
Training adds the skills which the owners of MSEs usually lack. These skills include performing
various business activities. With the right business skills the owners of MSEs can gain
competitive edge. Another major advantage of training is that the owners develop networks,
technology sharing, and learn skills to enhance their business by commercializing it to a bigger
level (Sánchez, 2011). The basic reason behind acquiring all these skills is that such training are
tailored to teach entrepreneurial skills among the owners of MSEs. All over the world
importance of training has been recognized as an important tool for enhancing the performance
of MSEs. However, in developing countries like Pakistan least importance is given by the micro
finance institutions and other government department on giving training to MSEs owners.
Limited access to such skills restricts the ability of the MSEs owner to enhance their business
beyond a certain limit and their growth remains stagnant (Asad, Haider, Akhtar, & Javaid, 2011).
Several studies have highlighted the importance of capital and business skills for the
enhancement and growth of MSEs (Rodrigues, Dinis, Paço, Ferreira, & Raposo, 2012).
Therefore, in the light of above discussion it is obvious that availability of credit only is not
enough to enhance the growth rate of MSEs but the training and teaching of business skills are
also crucial. Thus, this study has been conducted to find the empirical evidence about the
importance of training to enhance the performance of MSEs. This study has been designed to
find the difference in the performance of MSEs financed by microfinance institutions on the
basis of training and skills development. Therefore, this study is based on the hypothesis that
MSEs that get access to finance and training perform better than those that do not get training.
Bamwesigye (2008) observed that 65% of SME’s collapse or have dismal performance due to
lack of microcredit to expand and bring new products and services to the market. In Ilala market
despite of many microfinance institutions SME’s are performing dismally (TIC, 2018). This
raises the question “What are the contributions of microfinance institutions to the financial
performance of the SME’s in Ilala Municipal. The financial performance of SME’s would
5
facilitate their growth and in turn offer employment opportunities to people and spur economic
development of Tanzania. Also the financial performance would propel the SME’s to grow to
larger enterprises or industries and actualize the National theme of making Tanzania
industrialized by the year 2025.
1.2.2 Theoretical Perspective.
This study used the following theories as foundation;
Financial Growth theory this theory postulated by Berger and Udell (1998)
Berger and Udell (1998) proposed a financial growth theory for small business which are
involved in financial needs and financing option changing as the business grows,
Pecking Order Theory
Myers (1984) proposed the pecking order theory. It reveals the incentives that drive SMEs
capital structure decisions. This theory proposes that firms prefer to use internal sources of
capital first and was resort to external sources only if internal source are inadequate. This theory
has been found to be relevant to the financing SMEs.
Contract Theory this theory postulated by Kenneth Arrow (1960)
Kenneth Arrow (1960) proposed this contract theory, it studies how economic actors construct
contractual arrangements in the presence of asymmetric information. Information asymmetry
arises when one of two parties engaged in a business transaction happens to have more or
different information than the other.
1.2.3 Conceptual Perspective
This research comprises microfinance (credit facilities, Service mobilization and financial skills)
as the independent variable. The dependent variable was financial performance of SMEs which
was measured by profit gained by the enterprises. However, government policy on SME’s used
as moderating variable since it may have impact on the operations of the business enterprises.
6
1.2.4 Contextual Perspective
The government of Tanzania formulated the National Microfinance Policy (NMP 2000) with a
view of to establishing the basis for evolution of an efficient micro-financial system in the
country. This micro-financial system was believed to enable SME’s to grow and expand thereby
contributing to economic growth of Tanzania and in turn reduce poverty. The Bank of Tanzania
(BOT, 2001) was given the responsibility to coordinate the implementation of the policy and
these lead to the emergency of many microfinance institution. The primary aim of the
microfinance institutions is to offer microcredit’s to SME’s which could not be accorded credit
by the usual commercial banks. In Ilala district located there are many microfinance institutions
such as PRIDE, FINCA, BRAAC, TUNAKOPESHA LIMITED, NMB, CRDB, and ACCSSES
BANK. However, the closure rate of SMEs is higher than larger enterprises and is alarming, thus
this study was designed to investigate the contributions of microfinance institutions to the
financial performance of Small and Medium Enterprise in Ilala Municipal in Dar es Salaam
region, Tanzania.
1.3 Statement of the Problem
In the entire world, SME’s are said to contribute immensely to the growth of economy of country
(Kamugisha, 2016). This prompts countries to invent ways of encouraging the performance and
growth of SME’s. One of the ways suggested is the availability of microcredit to the SME’s
(Morduch et, al. 2002). In Ilala district where Ilala market is located there are many
microfinance institutions such as PRIDE, FINCA, BRAAC, and TUNAKOPESHA LIMITED.
However, data from Tanzania Investment Centre (TIC 2018) shows that 18% of the SMEs
collapse in the third year of establishment, while 20% remains dormant making little profits.
Bamwesigye (2008) observed that 65% of SME’s collapse or have dismal performance due to
lack of microcredit to expand and bring new products and services to the market. In Ilala market
despite of many microfinance institutions SME’s are performing dismally (TIC, 2018). This
raises the question “What are the contributions of microfinance institutions to the financial
performance of the SME’s in Ilala Municipal. The financial performance of SME’s would
facilitate their growth and in turn offer employment opportunities to people and spur economic
development of Tanzania. Also the financial performance would propel the SME’s to grow to
7
larger enterprises or industries and actualize the National theme of making Tanzania
industrialized by the year 2025. Studies on SME’s have done such as by Kemei, (2016) on MFs
loans and SMEs innovations in Moshi municipality and Wakaba, (2017) on the effect of
microfinance credit and the establishment of new business enterprises in Tanga region. Access to
microfinance credit is considered to be an important factor in determining the performance of
SMEs. Microfinance credit is one of the financial services that are expected to promote SMEs
financial performance. Despite the mushrooming of microfinance institutions that provide
microfinance credit in Tanzania, majority of SMEs do not perform well. This has been attributed
to lack of access to financial services and unfavorable credit facilities such as high interest rates
and short repayment period. However none of these studies focused on contributions of
microfinance on financial performance of Small and Medium Enterprise in Ilala Municipal,
Tanzania.
1.4 Objectives of the Study
This part explains the objective of the study that includes general objective and specific
objective.
1.4.1 General Objective
The general objective of the study was to assess the contributions of microfinance on financial
performance of Small and Medium Enterprise in Ilala Municipal, Dar es Salaam Tanzania.
1.4.2 Specific Objectives
The specific objectives of the study were;
i. To establish the influence of provision of credit facilities on financial performance of
SMEs in Ilala Municipal, Dar es Salaam Tanzania.
ii. To determine the effect of savings mobilization on financial performance of SMEs in
Ilala Municipal, Dar es Salaam Tanzania.
iii. To assess the effects of financial skills training offered by microfinance institutions on
financial performance of SMEs in Ilala Municipal, Dar es Salaam Tanzania.
8
iv. To determine the relationship between Credit facilities, Saving mobilization and
financial skills training and financial performance of Small and Medium Enterprises in
Ilala Municipal, Dar es Salaam Tanzania.
1.5 Research Questions
The study was guided by the following research questions;
i. What is the influence of provision of credit facilities on financial performance of Small
and Medium Enterprises in Ilala Municipal, Dar es Salaam Region, Tanzania?
ii. What is the effect of savings mobilization on financial performance of Small and
Medium Enterprises in Ilala Municipal, Dar es Salaam Region Tanzania?
iii. What is the effects of financial skills training offered by microfinance institutions on
financial performance of Small and Medium Enterprises in Ilala Municipal, Dar es
Salaam Tanzania.
iv. What is the relationship between financial skills training and financial performance of
Small and Medium Enterprises in Ilala Municipal, Dar es Salaam Region Tanzania?
1.6 Hypothesis
Ho There is no significant relationship between credit facilities and financial performance
of Small and Medium Enterprises in Ilala Municipal, Dar es Salaam Tanzania.
H1 There is significant relationship between credit facilities and financial performance of
Small and Medium Enterprises in Ilala Municipal, Dar es Salaam Tanzania.
1.7 Scope of the Study
This part explains the scope of the study that includes the followings.
1.7.1 Geographical Scope
Ilala District is one of the District of Dar es salaam region in Tanzania. The area is selected
because there has been so many microfinance institutions such as CRDB bank, Access bank,
NMB, Exim bank etc, operating in the area and there has been an alarming rate of closure of
Small and Medium Enterprises.
9
1.7.2 Content of Scope
The study focused on influence of provision of credit facilities on financial performance of Small
and Medium Enterprises in Ilala market, Tanzania, the effect of savings mobilization on financial
performance and financial skills training and financial performance of Small and Medium
Enterprises in Ilala Municipal, Tanzania.
1.7.3 Theoretical Scope
This study adopted three theories the financial growth theory which shows that financial needs
and financing option s of SMEs change as the business grows, Pecking order theory that shows
the incentives that drive SMEs capital structure decisions and Contract Theory which show
contractual capabilities with regard of terms and condition of the organization..
1.7.4 Time Scope
The study investigated the contribution of microfinance to SME’s in Ilala market from the year
2010 to 2018. This period is selected because this is the period many microfinance institutions
have emerged in Ilala Municipal. Also this period is selected because there has been a push by
the government on the facilitation of SME’s to spur economic growth of Tanzania.
1.8 Significance of the Study
The findings in this study were significant in the following ways;
1.8.1. To the Government
The government may use the research as feasibility study on the Microfinance and their ability to
influence growth of small and medium businesses and thus help alleviate restrictions that have
been put in place through bureaucratic processes. The study would also form a basis for the
government to formulate strategy and policy regarding small businesses development in the area
given it would shed light on the shortcomings and strengths alike.
1.8.2. To the Institutions (Microfinance)
This research was important to providers of microfinance because it enabled the institutions to
assess their influence on the growth of small businesses. The research study was great
10
importance to Microfinance for developing competitive strategy and influences the SME’s of
Ilala Municipal to develop the culture of investment. In addition, potential investors and small
scale business people may use the results of the study as an eye opener in small scale business
development opportunities provided by microfinance and invest wisely. The potential investors
make used of the microfinance loans, business idea generation; and other advisory services
offered and push their investment dreams to fruition. It was helped generate important
information that was used for analyzing the programs tailored by the Microfinance for the small
scale investors and how they got better these programs for increased growth of small businesses
in Tanzania as a whole.
1.9 Operational Definition of Key Terms
MICROFINANCE
Microfinance, also known as microcredit, is a financial institution that offers loans, savings and
insurance to entrepreneurs and small business owners who don't have access to sources of
capital, like banks or investors (World Bank,2015).
Small Enterprise (SE)
This is an economic organization with 5-49 employees and having capital of 5millions to200
millions (Tanzania SMEs Policy Review, 2003)
Medium Enterprises (ME)
This is an economic organization with 50-99 employees and having capital of 200millions to 800
million (Tanzania SMEs Policy Review, 2003)
Microcredit
Microcredit’ is used to refer to the loans given to very poor people for self-employment projects
that generate income, allowing them to care for themselves and their families (Microfinance
Summit, 1999)
11
Financial performance
Is a subjective measure of how well a firm can use assets from its primary mode of business to
generate revenues (Catalina,2002)
Savings
Is defined as the action of putting aside a part of current income, in order to consume or invest it
later on. The money saved can be kept at home, deposited in a savings account or invested in
different types of capital. Savings is a critical service for entrepreneurs who want secure and
convenient deposit services that allow for small transactions and offer easy access to their funds
(Gardiol, 2004)
12
CHAPTER TWO
LITERATURE REVIEW
2.1 Introduction
This chapter describes the theoretical literature review; conceptual framework, empirical
literature review and the research gap.
2.2 Theoretical Literature Review
This area explained the theories used in conducting this research as follows.
2.2. 1 Financial Growth Theory
Berger and Udell (1998) proposed a financial growth theory for small business which are
involved in financial needs and financing option changing as the business grows, because the
business is assumed to have become more experienced and less informally opaque. That further
suggest that firms depend on size, age, information continuum where the smaller/younger/more
opaque firms lie near the left end of the continuum indicating that they must rely on initial
insider finance ,trade credit and /angel finance. The growth cycle model predicts that as firm
grows, it gained access to venture capital (VC) as a source of intermediate equity and mid-term
loans as source of intermediate debt. At final stage of growth paradigm, as the firm becomes
older, more experienced and more informally transparent, it likely gained access to public equity
(PE) or long term debt. This theory helped this study in SMEs when they want to increase it
capita they must need source of finance to finance their business and the only source of finance
is from microfinance institutions.
Criticism of Financial Growth Theory
The small firms initial used of internal financing creates a unique situation in which capital
structure decisions are made based on limited financing options .It widely accepted that small
firms have different optimal capital structures and are financed by various sources at different
stages of their organizational lives (Berger and Udell,1998) have founded that certain attributes
13
of small firms influence the type of funds available to finance the firms operations (Van Auken
and Neeley,1996:Hall et al,.2000,romano et al, 2001).
2.2.2 Pecking Order Theory
Pecking order theory was proposed by Myers (1984). It reveals the incentives that drive SMEs
capital structure decisions. This theory proposes that firms prefer to use internal sources of
capital first and was resorted to external sources only if internal source are inadequate. This
theory has been found to be relevant to the financing SMEs .Most of SMEs start with internal
financing before looking for external sources. Order firm by definition have more opportunities
to accumulate retained earnings than the younger companies and thus more funds are available to
finance operational growth. Pecking order theory suggests that those funds should be used before
external capital sources are tapped.
Holmes and Kent (1991) found that small businesses experienced a more intense version of
pecking order in their decisions because access to appropriate external sources of capital is
limited. It has been noted that small businesses differ in their capital structure but their reliance
of pecking order is only one of the variables that make small business financing decision unique.
Small businesses rely on private capital markets, while larger firms are financed through public
market .Information of the small business is much less readily available than information on
larger firms which can be picked up in annual reports. Small businesses reliance on private
markets limits the type of financing that they can receive: Most small businesses rely on
commercial banks and finance companies to provide capital.
(Berger and Udell, 1998), in most cases the cost of capital for small businesses is usually higher
than it is for larger firms. The size of loans and lack of information on the quality of operation of
the small firms force lenders to protect their investment by demanding higher rate of return,
which come in the form of high interest rate and high cost of capital for the small firm. In an
attempt to avoid high cost of capital , smaller firms are then forced to use more short term debt,
which carries lower costs but raises the firms risks (Chittenden et al,1996).When loaning to small
businesses ,most financial institution require the owners of the small businesses to personally
guarantee the loan. These personal guarantees allow the institution recourse against personal
wealth of small businesses owner in the event of default (Berger and Udell, 1998). this theory
14
was helped my study in when the firm want to increase its capital it must choose the source of
finance from microfinance institutions with respect to the business they operate in that area
Applicability of the Pecking order Theory
This theory attempts to avoid the resulting risk that a profitable investment project was foregone
by seeking to finance them internally. If retained earnings are insufficient, they was opted for
debt rather than equity finance, because debt providers, with a prior claim on the firm’s assets
and earnings, are less exposed than equity investors to errors in valuing the firm. Managers only
opted for equity finance as a last resort in this model. In these circumstances, corporate gearing
will reflect a company’s need for external funds and unlike the trade-off approach there was
necessarily be any target or optimal level of gearing. This model was initially proposed by
(Myers 1994) and suggests that firms tend to finance their needs in a hierarchical fashion, first
using internally available funds, followed by debt, and finally external equity. Central concern
appears to be a concentration by small firms on “sources of finance that minimize intrusion into
business” (Lopez-Gracia&Aybar-Arias, 2000). Consequently firms do not have an optimal debt-
equity ratio but rather it varies, justified by the firm’s need of external finance. The pecking-
order model to a great extent tells the way certain characteristics of a firm may influence gearing
decisions. As Myers suggested, some entities follow a certain hierarchy to determine which the
next alternative source of finance is, and that fear of intrusion and dilution of power in an entity
may cause a certain sources to be selected.
Criticism of the Pecking order Theory
This theory attempts to avoid the resulting risk that profitable investment projects were foregone
by seeking to finance them internally. If retained earnings are insufficient, they was opted for
debt rather than equity finance, because debt providers, with a prior claim on the firm’s assets
and earnings, are less exposed than equity investors to errors in valuing the firm. Managers were
only opted for equity finance as a last resort in this model. In these circumstances, corporate
gearing was reflected a company’s need forexternal funds and unlike the trade-off approach there
will not necessarily be any target or optimal level of gearing. However it focuses only on the
productivity as the only tool to measure the performance of the enterprises it doesn’t take to
15
consideration other measures. The pecking-order model to a great extent tells the way certain
characteristics of a firm may influence gearing decisions.
2.2.3 Contract Theory
This theory was first formally treated by Kenneth Arrow. It studies how economic actors
construct contractual arrangements in the presence of asymmetric information. Information
asymmetry arises when one of two parties engaged in a business transaction happens to have
more or different information than the other. In such a situation, one party does not have
adequate information about the other party resulting in inaccurate decision making. This
circumstance leads to a potential adverse selection and moral hazard problems in the credit
market. Adverse selection is a problem arising from asymmetric information which occurs prior
to the transaction actually occurring. Here a lender may decide not to lend money even though
the borrower has the ability to make loan repayments as expected, just because he does not have
enough information about the borrower to aid in his decision making. On the other hand, moral
hazard is a problem of asymmetric information that occurs post-transaction. The borrower might
engage in activities that are unknown yet undesirable from the lender‘s point of view, and this
makes it less likely that the loan was paid back. For these reasons, formal financial institutions
insist on collaterals as a prerequisite for providing loan money to SMEs. The disbursement of
loan money without securing adequate collateral is considered too risky.
Stieglitz and Weiss (1981) have opined that information asymmetry is a significant reason why
SMEs find it difficult to acquire adequate loans. According to them, capital does not always flow
to small firms because of adverse selection and moral hazard, two factors that are known to have
a devastating negative impact on small enterprises.
2.3 Conceptual Framework
The conceptual framework will as shown in figure 2.1.
16
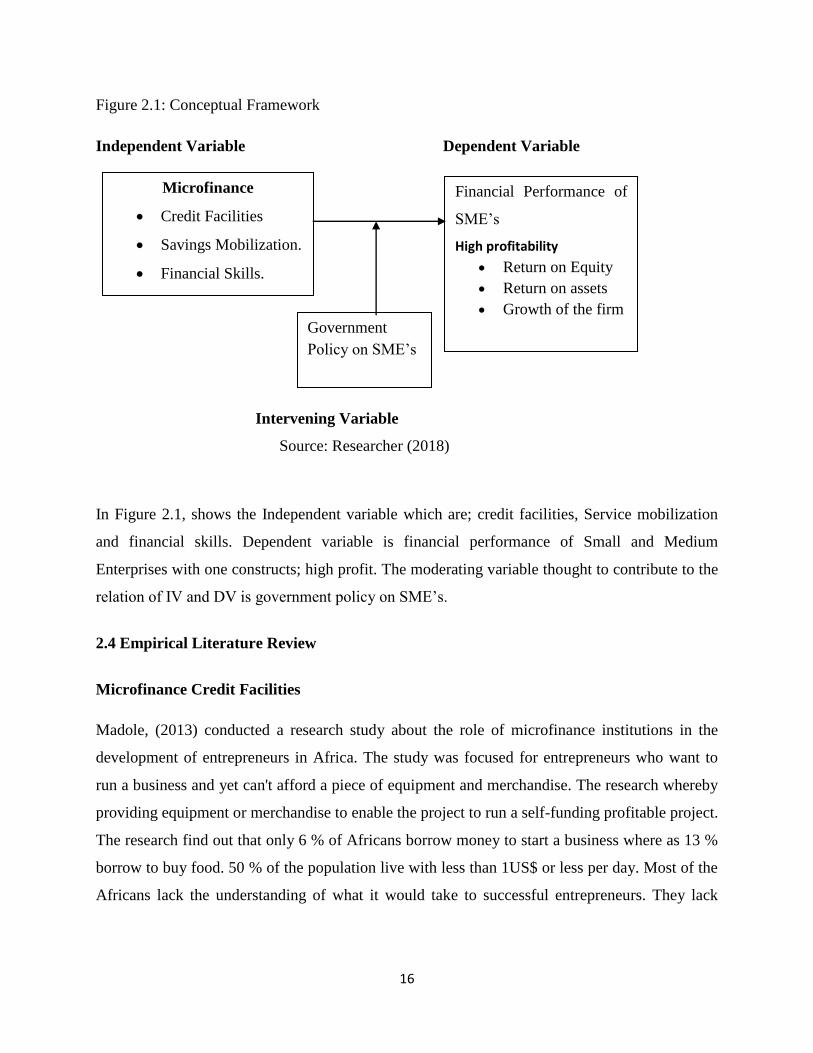
Figure 2.1: Conceptual Framework
Independent Variable Dependent Variable
Intervening Variable
Source: Researcher (2018)
In Figure 2.1, shows the Independent variable which are; credit facilities, Service mobilization
and financial skills. Dependent variable is financial performance of Small and Medium
Enterprises with one constructs; high profit. The moderating variable thought to contribute to the
relation of IV and DV is government policy on SME’s.
2.4 Empirical Literature Review
Microfinance Credit Facilities
Madole, (2013) conducted a research study about the role of microfinance institutions in the
development of entrepreneurs in Africa. The study was focused for entrepreneurs who want to
run a business and yet can't afford a piece of equipment and merchandise. The research whereby
providing equipment or merchandise to enable the project to run a self-funding profitable project.
The research find out that only 6 % of Africans borrow money to start a business where as 13 %
borrow to buy food. 50 % of the population live with less than 1US$ or less per day. Most of the
Africans lack the understanding of what it would take to successful entrepreneurs. They lack
Microfinance
Credit Facilities
Savings Mobilization.
Financial Skills.
Financial Performance of
SME’s
High profitability
Return on Equity
Return on assets
Growth of the firm
Government
Policy on SME’s
17
necessary technical management skills and confidence. They lack personal ambition and
willingness for fear of sharing ownership and failed to form partnership.
According to Waithanji and Wakaba, (2014) did a research on the effect of microfinance credit
on the financial performance of small and medium enterprises in Kiambu county and found that
all SMEs borrow investment capital and they use it for the purpose in which they borrowed for.
Most of them do not have other source of financing other than from micro-finance institutions
and they did not have other form of financing before they started receiving financing from
microfinance institutions. However, this study was not done in Tanzania.
Keep (2010) have studied the effect of Microfinance factors on people Entrepreneurs’
performance in Nigeria. People play a crucial role in the economic development of their families
and communities but certain obstacles such as poverty, unemployment, low household income
and societal discriminations mostly in developing countries have hindered their effective
performance of that role. It is discovered that people entrepreneurship could be an effective
strategy for poverty reduction in a country; since people are the worst hit in such situation.
However, it is discovered that people entrepreneurs, especially in developing countries, do not
have easy access to microfinance factors for their entrepreneurial activity and as such have low
business performance than their men counterparts, whereas the rate of their participation in the
informal sector of the economy is higher than males, and microfinance factors could have
positive effect on enterprise performance.
A cross sectional survey was carried out in Ghana by Ahiawodzi (2012),on effect of access to
credit on financial performance of Small and Medium Scale Enterprises (SMEs) in the Ho
Municipality of Volta Region of Ghana by using both survey and econometric methods. The
survey involved a sample of 78 SMEs in the manufacturing sector from the Ho Municipality.
Both survey and econometric results 21 show that access to credit exerts a significant positive
effect on financial performance of SMEs in the Ho-Municipality of Ghana.
A study was conducted by Nkeobuna (2012) to evaluate the relationship between microcredit
and financial performance of SME‟s in Ghana. A sample of 65 SME‟s in the agricultural and
financial services sector was conducted and a regression model was used for data analysis. The
result of the analysis showed that there was a positive relationship between microcredit and
18
financial performance of SME‟s. Muthoka (2012) investigated on the link between microcredit
and financial sustainability of SMEs, though repeatedly emphasized by donors and practitioners
in conferences and summits, is a controversial area of empirical research. A multivariate
regression model was applied to determine the relative importance of each of the variables with
respect to financial self sustainability. The study found that the integrating gender awareness
policies (gender equality and SME„s human rights), creating ways for non-financial support and
services (complementary services) to pay explicit attention to gender. The regression results
imply that credit contribute more to the financial sustainability of SMEs followed by savings,
while entrepreneurial development contributes the least to financial sustainability of SMEs.
The amount of credit offered by the financial institutions may determine the performance of
SMEs in terms of sales, liquidity and even the operating costs. This is supported by several
researchers such as Oleka, et al (2014) UWFT, (2005); Wanambisi (2013). For example, Oleka,
et al (2014) argue that the loan size positively influence the growth of SMEs. It was also argued
that the business that receive adequate amount of loan frequently perform better than the ones
that do not (Wanambisi, 2013) also argues that appropriate loan sizes for clients, matching SMEs
needs influence the business sustainability.
World over, the SME subsector is dogged with а number of challenges. In Africa, for instance,
their failure rate is аpproximаted at 85% out of every 100 SME’s start-ups. The major reason
attributed to this failure is lack of skills аnd аccess to capital (GOK, 2007). The SMEs are only
able to source аnd obtain micro finance mostly from the informal sector like friends and
relatives. Bank credit is not аvаilаble to SMEs because they generally considered high credit
risks by financial institutions and most of them do not have аdequаte collateral. (Ndubа, 2010)
Other challenges include, discriminatory cultural practices which make it impossible for women
entrepreneurs to borrow on own assets and land title deeds, high transaction costs etc. This
limitation in access to finance by SME’s undermines the critical role of in economic growth.
Serving Mobilization
A study by Kurgat (2007) of the Kenya Women Finance Trust shows that clients preferred credit
and savings services in the Microfinance Institution with their reason for saving being to expand
their business (62%), education for their children (40%) and for emergencies (26%) additionally
19
71% of the clients viewed compulsory savings as an opportunity to save. In this study it is
concluded that savings mobilization is important for the improved financial performance and
outreach especially in the rural areas where access to financial services is challenging. However,
the study was done in another country other than Tanzania.
A study in Uganda by Akisimire (2010) found that MFI savings products to SMEs have
encountered stiff competition at the market place with the entry of new commercial banks and
downscaling of old banks’ while competition may be beneficial to the SMEs because of higher
interest rates on savings, it could affect the MFIs by reducing the revenue available in order to
lend. This study did not focus on contribution of microfinance to the performance of SME’s.
Akasamire (2010) wrote that firm growth opportunities has a correlation with liquidity levels,
enterprises with more investment opportunities keep higher liquidity levels in order not to limit
or cancel their profitable investment projects. It can be argued that these kind of firms would
require a reliable savings institution to enable them maximize on their growth opportunities,
MFIs should establish effective savings programs by transforming their capabilities to support
SME saving services. However it should also be noted according to Gray, Saunders and
Goregaokar (2012) that too much liquidity is harmful as SMEs might not spend it wisely
effective training on cash flow management is also important.
Similarly Yeboah (2010) contends that little progress has been made to establish microfinance
institutions (MFIs) as full-fledged financial intermediaries and MFIs offer only credit, and
savings mobilization remains the forgotten half of microfinance. Microfinance Institutions can
gain outreach to SMEs by providing appropriate savings products. The MFIs should conduct
research to ensure that the pricing of their savings products will ensure financial sustainability. In
the United Kingdom a study by Gray, Saunders and Goregaokar (2012) found the main sources
of finance used by SMEs to fund their businesses were reinvesting profits (68%), Personal/
family savings (39%) and bank loan (29%). This indicates the importance of saving in funding
business growth at 39%. Similarly the Important of savings to SMEs is emphasized by Citi’s
“susu” in Ghana where 200 to 800 members save between US dollars 40,000 and 800,000 per
cycle with the accumulated savings being paid out to the members over a 100 week cycle for
each week’s collection (Bass and Henderson, 2014).
20
Financial skills Small and Medium Enterprises
According to Sánchez,(2011). Financial education training provides material capital to a business
person empowering the person to participate in the economy and society. Microfinance train
entrepreneurs on financial management,business planning and projection. Another major
advantage of training is that the owners develop networks, technology sharing, and learn skills to
enhance their business by commercializing it to a bigger level .The basic reason behind acquiring
all these skills is that such training are tailored to teach entrepreneurial skills among the owners
of SMEs. All over the world importance of training has been recognized as an important tool for
enhancing the performance of SMEs
However, in developing countries like Pakistan least importance is given by the micro finance
and other government department on giving training to SMEs owners. Limited access to such
skills restricts the ability of the SMEs owner to enhance their business beyond a certain limit and
their growth remains stagnant (Asad, Haider, Akhtar, & Javaid, 2011).
Training has a major impact over behavioral change, it changes the way of perceiving the
opportunities out of threats or challenges (Bembenutty, White, & Vélez, 2016). In Pakistan
majority of the microfinance institutions provide credit without training their beneficiaries about
how to run business successfully (Islam, Khan, Obaidullah, & Alam, 2011). The owners of
MSEs have had the opportunity to attend in business training for different causes. It is very
important to understand that in what manner business training of owners of MSEs influence the
performance of MSEs (Cruz, Justo, & Castro, 2012). Likewise, it is also very important to
understand the difference if any in the performance of MSEs financed by microfinance
institutions and owned by trained or owners who have not been trained (Karlan & Valdivia,
2011). Thus, this study is an attempt to find a comparative analysis on performance of MSEs
financed by microfinance institutions, by making a comparison between those whose owners
were given training from the microfinance institutions against those who have had not been
given training.
In Zimbabwe Zindiye (2008) explain that the SME sector attracts a low priority to financial
training and are often unwilling to participate in programs that require them to finance the costs
these enterprises eventually are weak in cash management, marketing strategies and finance. The
21
study further concluded that SMEs should be trained in the following financial management
skills book keeping, preparing financial statements, debit/ credit control, budgeting and tax
calculation to ensure their growth. It can be argued that well designed financial training
programs can improve the incomes of SMEs. Therefore microfinance institutions need to create
ways of measuring the impact of financial skills training to the SMEs.th This study differ from
this research microfinance and financial performance of Small and Medium Enterprises in this
research will show many business in Ilala District fail to utilize the training obtained from
microfinance institutions have many Enterprises still perform poor in Ilala District.
A study of SMEs by the OECD (2013) in New Zealand, United Kingdom, Belgium, Poland,
Turkey and Canada outlined the following reasons why SMEs do not participate in financial
training programs: lack of time, very expensive and difficulty in accessing its relevance to the
needs of the enterprise. Furthermore a conclusion was drawn that firms that did not participate in
these training programs did so because they believed they already have or can recruit the skills
the enterprise required. Therefore, Microfinance Institutions need to train SME owners to have
skills for specific production, business management and access to markets in order to make
profits from the financial resources they receive.
Financial skills training can improve the ability of the low-income earners to operate enterprises
either directly or indirectly. Complexity of financial decisions requires that business owners are
able to make informed choices on saving, borrowing, spending and investing their money.
Financial skills as contended by the ILO (2013) can improve productivity and incomes in the
informal economy and open opportunities to link with the formal economy this training can
support medium term strategies for integration with the mainstream economy while also offering
a range of immediate benefits to informal economy entrepreneurs and workers. This argument is
particularly important in Kisumu County where a large population of the SMEs is in the informal
economy their transition to the formal economy would create a bigger tax base for the
government and also increase formal employment. In Canada research was conducted by the
CFEE (2011) into relationships between financial literacy and the nine Essential Skills (i.e.,
Numeracy, Thinking Skills, Reading Text, Document Use, Oral Communication, Writing,
Computer Use, Continuous Learning, and Working with Others. The study found both empirical
22
and anecdotal evidence in support of the relationship between financial skills and the nine
essential skills.
These essential skills can be viewed as very important to the success of a business enterprise. It
is therefore important to investigate the effect of financial skills training on the growth of SMEs
as it is often these vulnerable businesses affected by lack of financial capability. The effects of a
lack of financial capability as highlighted by McQuid and Egdell (2011) are not only financial
but may lead to wider problems for the individual, household and beyond, including debt, higher
stress and reduced wellbeing.
The first is enterprise formation which is the offering of training to persons to acquire skills in a
specific sector such as weaving as well as persons who want to start up their businesses. The
second category of enterprise development services rendered to its clients is the enterprises
transformation program which is the provision of technical 15 assistance training and technology
in order to enable existing SMESs to advance in terms of production and marketing.
Yunus(2007). The main approach used by lenders in the past has been the promotion of such
system through training in group formation constitution development, record keeping etc.
Getting groups off to a good start is certainly important but problems that later arise are often
still difficult for groups to resolve for themselves, and ongoing systems of support and
supervision are usually lacking. The sustainability of these services has not been a focus.
Johnson et. al( 2005). Grameen Bank is known for successfully implementing the system of
group-lending though there have been organization concentrating on offering loans and saving
opportunities to needy people before. Counts,(2008).
2.5 Research Gap
Studies have been done such as Madole (2013) Impact of microfinance on financial performance
of Small and Medium Enterprises in morogoro Region in Tanzania, Waithaji and Wakoba (2014)
effect on microfinance on financial performance in Kiambu county, Kurgat (2007) serving offers
by Kenya finance trust, Akasimire (2010), yeboah (2010) conducted research on microfinance on
financial performance of Small and Medium Enterprises in Nigeria , Akasamire (2010)
conducted the research the effect of microfinance and financial performance of Small and
23
Medium Enterprises in Uganda, Zimbabwe Zindiye (2008) conducted the research on
microfinance and financial performance of Small and Medium Enterprises in Zimbabwe.
However, most of the studies were done in other countries and scanty literature on microfinance
and financial performance of Small and medium Enterprises in Ilala Municipal, Tanzania.
The study was conducted in Ilala Municipal because in Ilala Municipal all microfinance Head
offices and branches was located and there are lot of Small and Medium Enterprises like
Kariakoo market which was the big market in Dar es salaam Region as well as in Tanzania,Ilala
market and Machinga complex market.
24
CHAPTER THREE
METHODOLOGY
3.1 Introduction
The chapter highlights the research design, area of study, population, sampling procedure, data
collection methods and instruments, data presentation and analysis of data.
3.2 Research Design
This study used descriptive research design because it helps to get gather more information of
one particular situation for the purpose of gaining in-depth understanding of issues being
investigated (cooper and Shindler, 2003). Hence, the major purpose of using this of descriptive
research design is because it helps to get description of the state of affairs as it exists, in this
study, the researcher employed descriptive survey as a method of collecting information by
administering a questionnaire to a sample individuals (Orodha and Kombo, 2002). Also, in this
study, the researcher employed quantitative research approach. Quantitative design was normally
used in the measurement of quantity or amount (Kothari 2004).
3.3 Study Population
Population is a group of individual’s objects or items from which samples are taken for
measurement. Hence, it refers to an entire group of persons or elements that have at least one
thing in common. It also refers to as a lager group from which the sample is taken (Kombo and
Tromp 2014). The target population consisted of the registered 3215 Small and Medium
Enterprises operating in Ilala Municipal (Ilala Municipal Council, 2018).
25
3.4 Sample Size
The researcher obtained the sample from the individual populations by using the Slovene's
Formula. This was computed as follows:
Slovene’s Formula is given as follows:
n = N/ (1+Ne2),
Where by
n= sample size
N = population
e2 = level of significance which is 0.05
2
Small Enterprises (SE)
N= 3215 SE’s
n= 3215/ (1+3215 (0.052)
n= 355.7 ≈ 356
Therefore my total sample size was 356 SMEs operating in Ilala Municipal
3.5 Sampling Techniques.
This is the procedure a researcher uses to gather people, places or things to study. It is a process
of selecting a number of individuals or objects from a population such that the selected group
contains elements representatives of the characteristics found in the entire group (Kothari
(2011). The researcher used simple random sampling in order to give equal chances to all the
SME’s to participate.
3.6 Data Collection Tool
The research used questionnaire for collecting primary data needed for conducting this research.
3.6.1 Questionnaire
In order to collect the data needed, the researcher used questionnaire for collecting primary data
(Cavana et al. (2001). The questionnaire was closed ended and was developed following the
26
research questions, objectives and literature review. The questions were inform of English
language and translated into Swahili to make them understandable to respondents.
3.7 Data Gathering Procedure
The researcher followed the following procedure during conducting this research.
Before Data Gathering
The researcher prepared a proposal under the guidance of his supervisor. Upon finishing and
submission of research proposal to the faculty of post graduate, the researcher obtained an
introductory letter from the same faculty allowing me to go ahead and collect data.
During Data Gathering
In the due process of collecting data the researcher used of research assistants to assist him in
quick data collection. He was also avail himself both directly and indirectly (via phone calls) in
order to give guidance to the research assistants and respondents where necessarily.
After Data Gathering
After data has been gathered from the field, the researcher edited,coded and enter data into a
Statistical Package for Social Scientists (SPSS) and ran analysis accordingly.
3.8 Validity and Reliability
The study ensured validity and reliability of research instruments.
3.8.1 Validity
Validity is used to determine whether research measures what it intended to measure and to
approximate the truthfulness of the results. Validity is concerned with whether the findings are
really about what they appear to be about (Saunders et al, 2007). The researcher was ensured
that only valid questions are asked. This was done by giving the questions in the interview and
the questionnaire to procurement experts to crosscheck if the questions are valid (relevant and
27
irrelevant) against the objectives of the study. There after the researcher used the Content
Validity Index (CVI), to test the validity of the instruments. Amin (2005) observe that this
methods ensures only valid instrument is used to collect data since if the CVI is below 0.796 then
the instruments was revised accordingly before proceeding to collect data.
3.8.2 Reliability
Reliability is the consistency of measurement, or the degree to which an instrument measures the
same way each time it is used under the same condition with the same subjects. Reliability of the
instrument according to Amin (2005) refers to the degree to which instrument consistently
measures whatever it is measuring. This was done by pre-testing the questionnaire to confirm
reliability using test-retest method.
3.8.2.1Test-retest Method
To actualize the test-retest method a sample of ten respondents from different but distant time
points was subjected to the instruments, correlation coefficient between the two time data was set
and established. If a high coefficient is realized then the instrument was said to be highly
reliable (Wario and Khalfan, 2015). To ensure reliability of the instruments, the internal
consistency method using Chronbach’s alpha co-efficient was used. After testing the reliability
of the instruments and finding that it is okay, the researcher was proceed to use the same
instruments to collect data.
3.9 Data Analysis
Descriptive statistics such as mean scores, Standard deviations, percentages, and frequency
distribution was computed to describe the characteristics of the variables of interest in the
study(Mugenda, 2008). Data collected was analyzed using the Statistical Package for Social
Sciences (SPSS) software Bryman and Bell (2007:376) and Rubin (2007:34). A descriptive and
inferential approach was used to analyze the data collected. Data analyzed was presented using
28
tablesAccording to Sarantakos (2007:40). A linear regression analysis was applied to establish
the relationship between the IV’s and the DV. The following equation was used.
Y =β0+ β1X1+ β2X2+ β3X3 + ε
Whereby =Financial Performance of SMEs (measured by high profit)
X1= Credit facilities
X2 = Savings mobilization
X3 = Financial skills training
ε = Error term
3.10 Ethical Consideration
The researcher ensured that good relationship between himself and all the respondents, by so
doing; he was encouraged positive responds towards answering the questions in the instruments.
Prior awareness was made to all respondents for the purpose of the study and the reason as to
why they were sampled to respond to the questions, at this time the researchers was assured
secrecy and confidentiality to any sensitive information provided by the respondents. The
researcher used the results of the study for intended academic purpose.
3.11 Limitations of the Study
The following are limitations that may be encountered for various reasons when carrying out
this study:
i. Respondent’s response may be been rational and may not represent a real life
scenario. However this was took care during the study where the respondents were
advised to be honest.
ii. Some questionnaires may not be fully filled by the respondents as it is supposed to
be. However, this was checked such that only correctly filled questionnaires were
included in the study.
29
CHAPTER FOUR
DATA PRESENTATION AND ANALYSIS
4.1 Introduction
This chapter presents the research findings, generated from the data collected from the field were
presented following the research objectives
4.2 General profile of the respondents
This section shows Gender, Age, Education and marital status of the respondents, Blumberg et
al. (2005:440).This was analyzed according to Blumberg (2005) observed that gender, Age,
Education and marital status of the respondents may have different response or opinion.
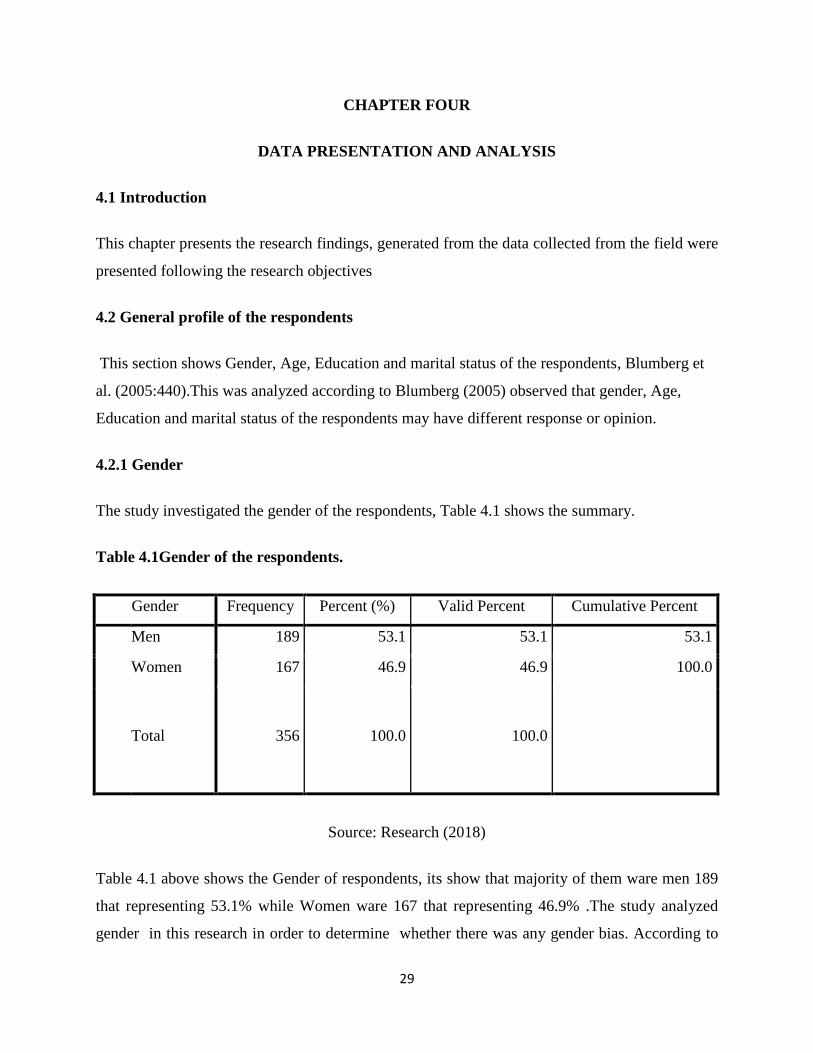
4.2.1 Gender
The study investigated the gender of the respondents, Table 4.1 shows the summary.
Table 4.1Gender of the respondents.
Gender Frequency Percent (%) Valid Percent Cumulative Percent
Men 189 53.1 53.1 53.1
Women 167 46.9 46.9 100.0
Total 356 100.0 100.0
Source: Research (2018)
Table 4.1 above shows the Gender of respondents, its show that majority of them ware men 189
that representing 53.1% while Women ware 167 that representing 46.9% .The study analyzed
gender in this research in order to determine whether there was any gender bias. According to
30
Churchill (2005).If both gender are not represented well then the results might be biased towards
one gender.
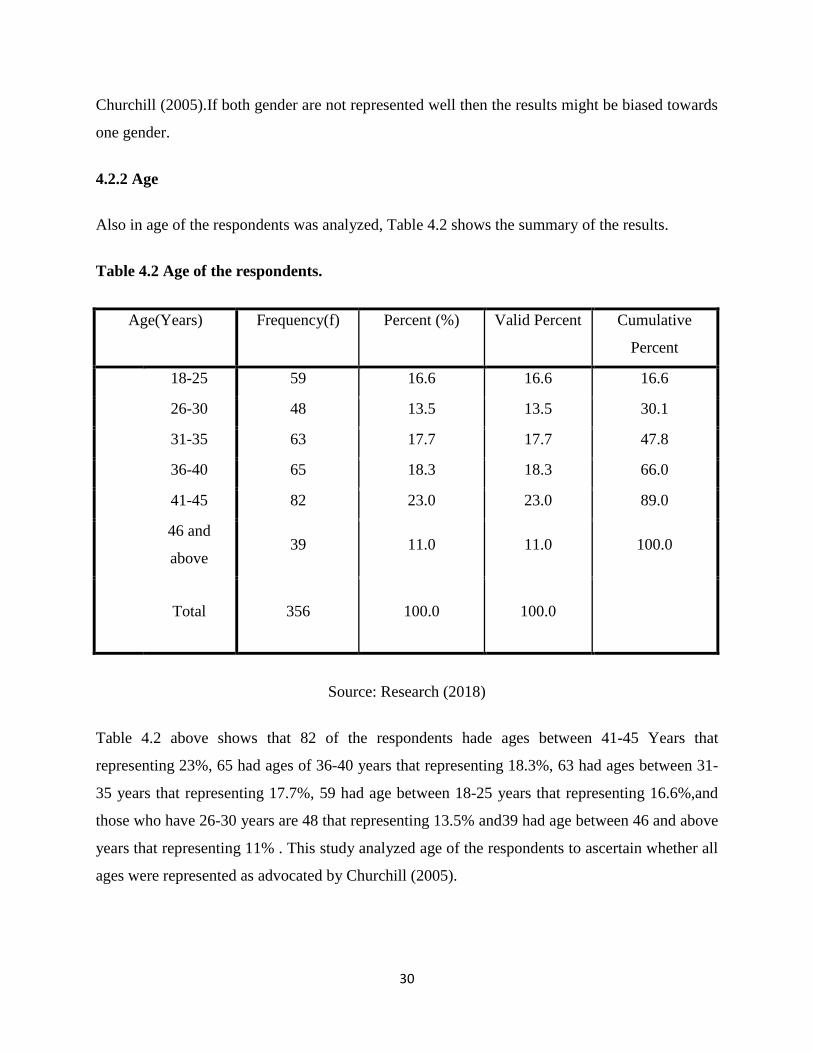
4.2.2 Age
Also in age of the respondents was analyzed, Table 4.2 shows the summary of the results.
Table 4.2 Age of the respondents.
Age(Years) Frequency(f) Percent (%) Valid Percent Cumulative
Percent
18-25 59 16.6 16.6 16.6
26-30 48 13.5 13.5 30.1
31-35 63 17.7 17.7 47.8
36-40 65 18.3 18.3 66.0
41-45 82 23.0 23.0 89.0
46 and
above 39 11.0 11.0 100.0
Total 356 100.0 100.0
Source: Research (2018)
Table 4.2 above shows that 82 of the respondents hade ages between 41-45 Years that
representing 23%, 65 had ages of 36-40 years that representing 18.3%, 63 had ages between 31-
35 years that representing 17.7%, 59 had age between 18-25 years that representing 16.6%,and
those who have 26-30 years are 48 that representing 13.5% and39 had age between 46 and above
years that representing 11% . This study analyzed age of the respondents to ascertain whether all
ages were represented as advocated by Churchill (2005).
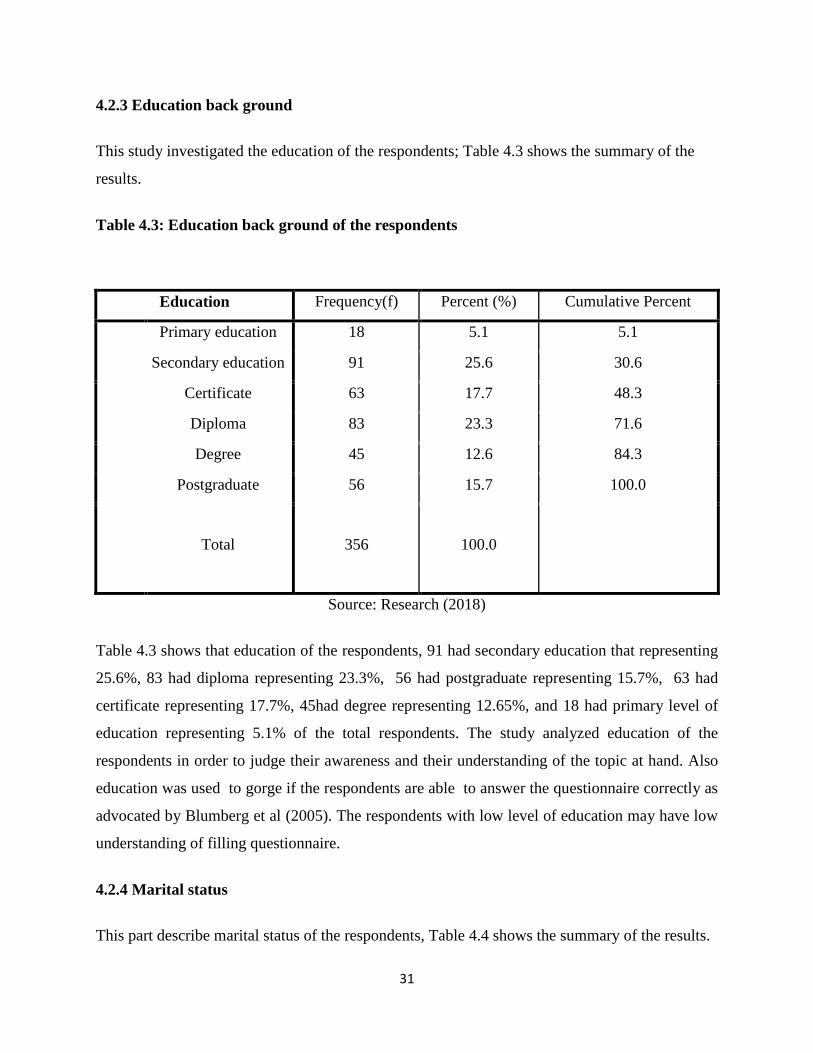
31
4.2.3 Education back ground
This study investigated the education of the respondents; Table 4.3 shows the summary of the
results.
Table 4.3: Education back ground of the respondents
Education Frequency(f) Percent (%) Cumulative Percent
Primary education 18 5.1 5.1
Secondary education 91 25.6 30.6
Certificate 63 17.7 48.3
Diploma 83 23.3 71.6
Degree 45 12.6 84.3
Postgraduate 56 15.7 100.0
Total 356 100.0
Source: Research (2018)
Table 4.3 shows that education of the respondents, 91 had secondary education that representing
25.6%, 83 had diploma representing 23.3%, 56 had postgraduate representing 15.7%, 63 had
certificate representing 17.7%, 45had degree representing 12.65%, and 18 had primary level of
education representing 5.1% of the total respondents. The study analyzed education of the
respondents in order to judge their awareness and their understanding of the topic at hand. Also
education was used to gorge if the respondents are able to answer the questionnaire correctly as
advocated by Blumberg et al (2005). The respondents with low level of education may have low
understanding of filling questionnaire.
4.2.4 Marital status
This part describe marital status of the respondents, Table 4.4 shows the summary of the results.
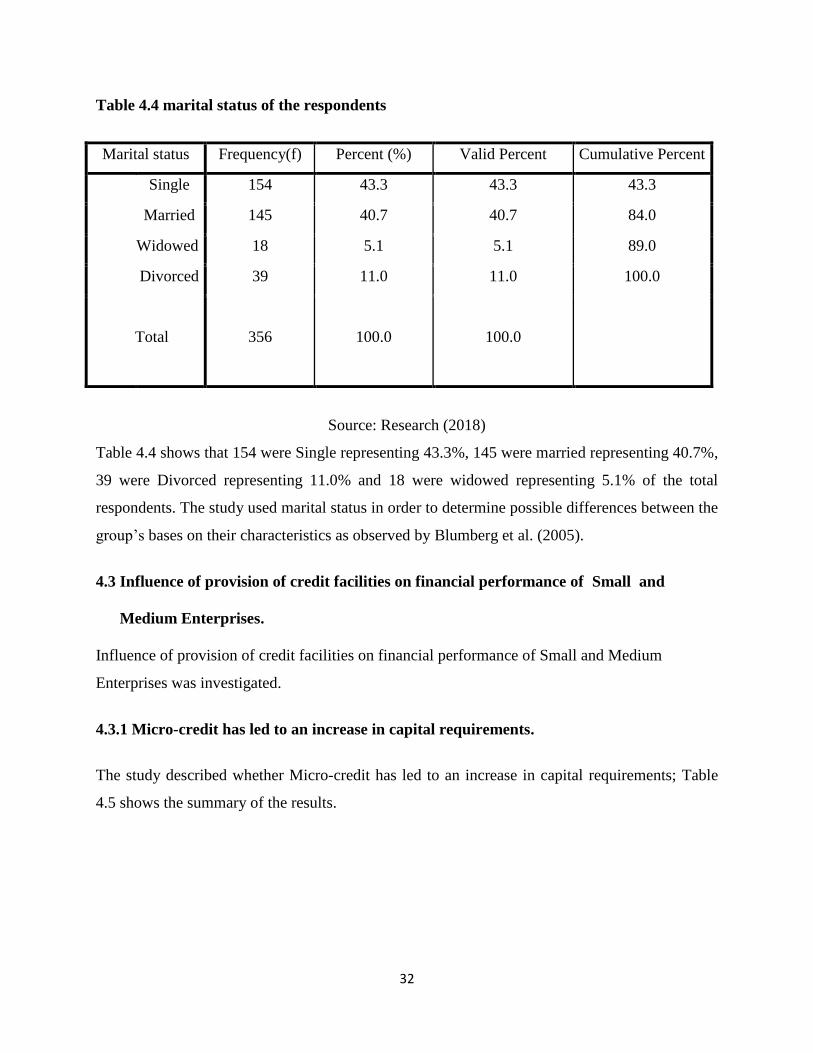
32
Table 4.4 marital status of the respondents
Marital status Frequency(f) Percent (%) Valid Percent Cumulative Percent
Single 154 43.3 43.3 43.3
Married 145 40.7 40.7 84.0
Widowed 18 5.1 5.1 89.0
Divorced 39 11.0 11.0 100.0
Total 356 100.0 100.0
Source: Research (2018)
Table 4.4 shows that 154 were Single representing 43.3%, 145 were married representing 40.7%,
39 were Divorced representing 11.0% and 18 were widowed representing 5.1% of the total
respondents. The study used marital status in order to determine possible differences between the
group’s bases on their characteristics as observed by Blumberg et al. (2005).
4.3 Influence of provision of credit facilities on financial performance of Small and
Medium Enterprises.
Influence of provision of credit facilities on financial performance of Small and Medium
Enterprises was investigated.
4.3.1 Micro-credit has led to an increase in capital requirements.
The study described whether Micro-credit has led to an increase in capital requirements; Table
4.5 shows the summary of the results.
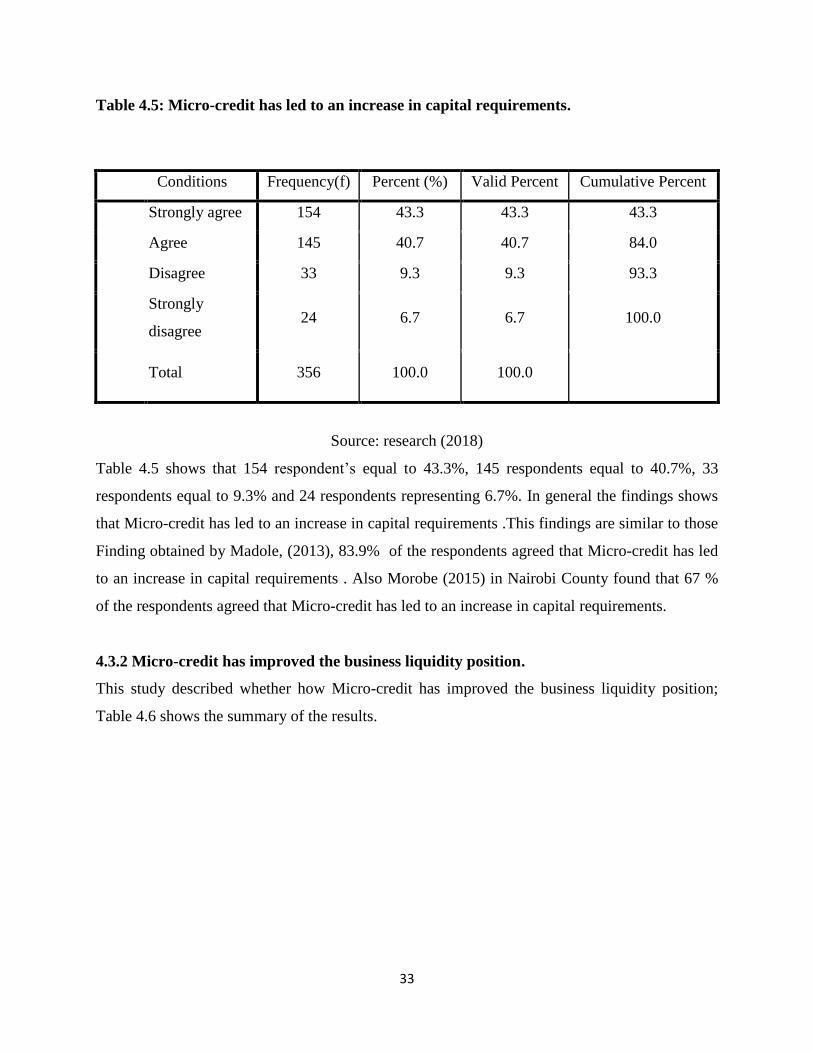
33
Table 4.5: Micro-credit has led to an increase in capital requirements.
Conditions Frequency(f) Percent (%) Valid Percent Cumulative Percent
Strongly agree 154 43.3 43.3 43.3
Agree 145 40.7 40.7 84.0
Disagree 33 9.3 9.3 93.3
Strongly
disagree 24 6.7 6.7 100.0
Total 356 100.0 100.0
Source: research (2018)
Table 4.5 shows that 154 respondent’s equal to 43.3%, 145 respondents equal to 40.7%, 33
respondents equal to 9.3% and 24 respondents representing 6.7%. In general the findings shows
that Micro-credit has led to an increase in capital requirements .This findings are similar to those
Finding obtained by Madole, (2013), 83.9% of the respondents agreed that Micro-credit has led
to an increase in capital requirements . Also Morobe (2015) in Nairobi County found that 67 %
of the respondents agreed that Micro-credit has led to an increase in capital requirements.
4.3.2 Micro-credit has improved the business liquidity position.
This study described whether how Micro-credit has improved the business liquidity position;
Table 4.6 shows the summary of the results.
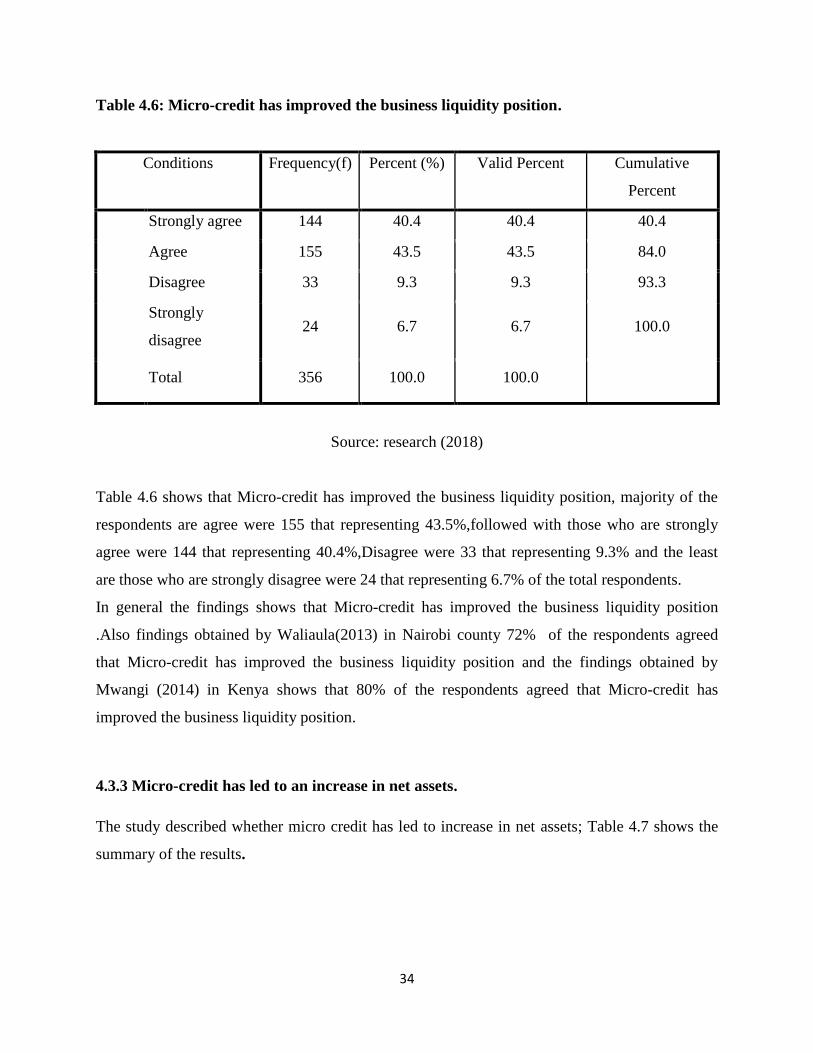
34
Table 4.6: Micro-credit has improved the business liquidity position.
Conditions Frequency(f) Percent (%) Valid Percent Cumulative
Percent
Strongly agree 144 40.4 40.4 40.4
Agree 155 43.5 43.5 84.0
Disagree 33 9.3 9.3 93.3
Strongly
disagree 24 6.7 6.7 100.0
Total 356 100.0 100.0
Source: research (2018)
Table 4.6 shows that Micro-credit has improved the business liquidity position, majority of the
respondents are agree were 155 that representing 43.5%,followed with those who are strongly
agree were 144 that representing 40.4%,Disagree were 33 that representing 9.3% and the least
are those who are strongly disagree were 24 that representing 6.7% of the total respondents.
In general the findings shows that Micro-credit has improved the business liquidity position
.Also findings obtained by Waliaula(2013) in Nairobi county 72% of the respondents agreed
that Micro-credit has improved the business liquidity position and the findings obtained by
Mwangi (2014) in Kenya shows that 80% of the respondents agreed that Micro-credit has
improved the business liquidity position.
4.3.3 Micro-credit has led to an increase in net assets.
The study described whether micro credit has led to increase in net assets; Table 4.7 shows the
summary of the results.
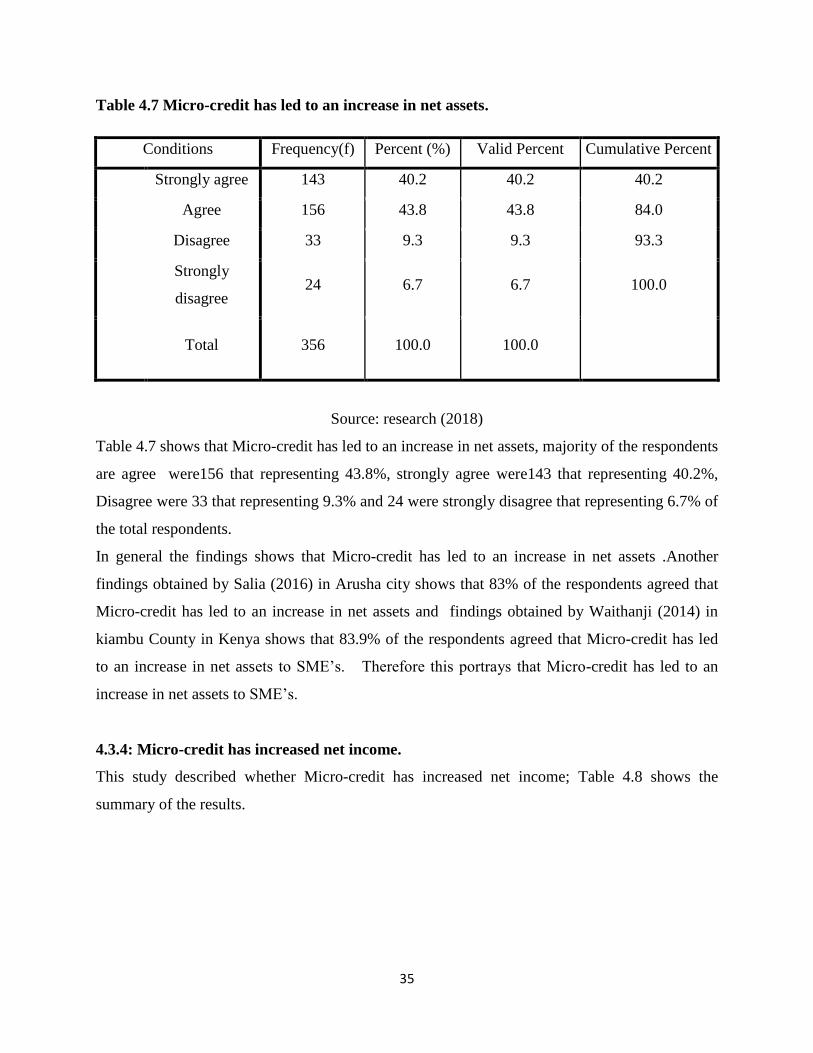
35
Table 4.7 Micro-credit has led to an increase in net assets.
Conditions Frequency(f) Percent (%) Valid Percent Cumulative Percent
Strongly agree 143 40.2 40.2 40.2
Agree 156 43.8 43.8 84.0
Disagree 33 9.3 9.3 93.3
Strongly
disagree 24 6.7 6.7 100.0
Total 356 100.0 100.0
Source: research (2018)
Table 4.7 shows that Micro-credit has led to an increase in net assets, majority of the respondents
are agree were156 that representing 43.8%, strongly agree were143 that representing 40.2%,
Disagree were 33 that representing 9.3% and 24 were strongly disagree that representing 6.7% of
the total respondents.
In general the findings shows that Micro-credit has led to an increase in net assets .Another
findings obtained by Salia (2016) in Arusha city shows that 83% of the respondents agreed that
Micro-credit has led to an increase in net assets and findings obtained by Waithanji (2014) in
kiambu County in Kenya shows that 83.9% of the respondents agreed that Micro-credit has led
to an increase in net assets to SME’s. Therefore this portrays that Micro-credit has led to an
increase in net assets to SME’s.
4.3.4: Micro-credit has increased net income.
This study described whether Micro-credit has increased net income; Table 4.8 shows the
summary of the results.
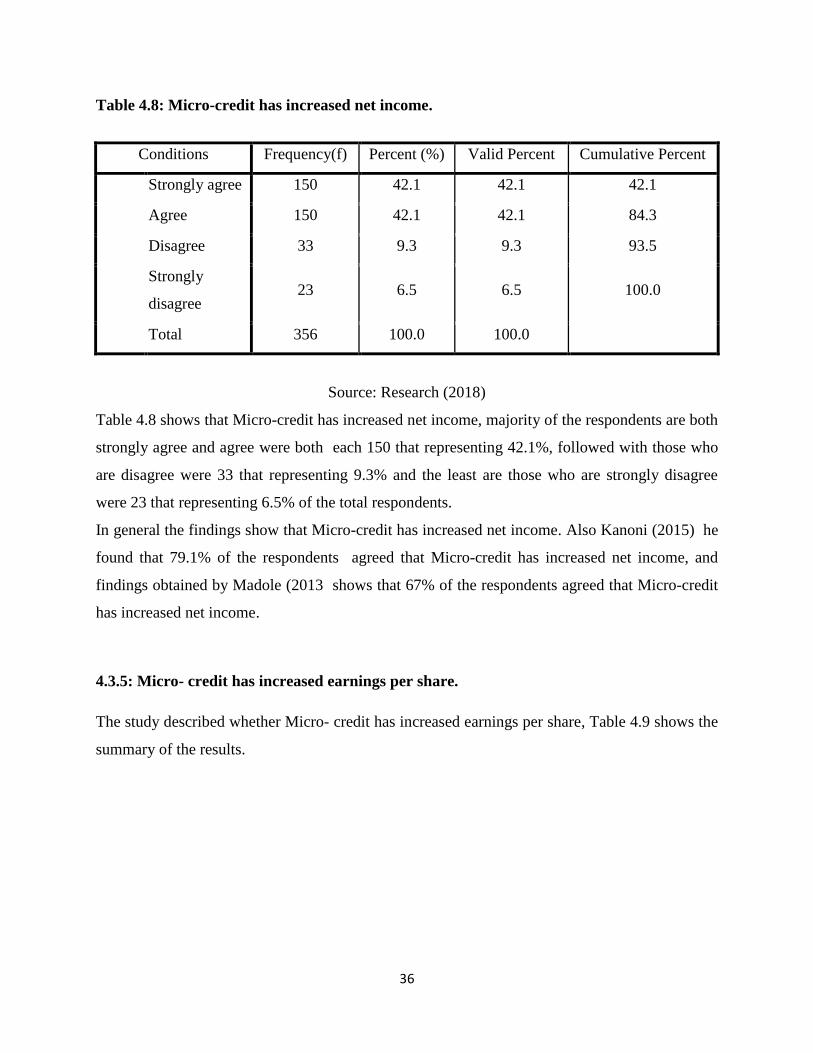
36
Table 4.8: Micro-credit has increased net income.
Conditions Frequency(f) Percent (%) Valid Percent Cumulative Percent
Strongly agree 150 42.1 42.1 42.1
Agree 150 42.1 42.1 84.3
Disagree 33 9.3 9.3 93.5
Strongly
disagree 23 6.5 6.5 100.0
Total 356 100.0 100.0
Source: Research (2018)
Table 4.8 shows that Micro-credit has increased net income, majority of the respondents are both
strongly agree and agree were both each 150 that representing 42.1%, followed with those who
are disagree were 33 that representing 9.3% and the least are those who are strongly disagree
were 23 that representing 6.5% of the total respondents.
In general the findings show that Micro-credit has increased net income. Also Kanoni (2015) he
found that 79.1% of the respondents agreed that Micro-credit has increased net income, and
findings obtained by Madole (2013 shows that 67% of the respondents agreed that Micro-credit
has increased net income.
4.3.5: Micro- credit has increased earnings per share.
The study described whether Micro- credit has increased earnings per share, Table 4.9 shows the
summary of the results.
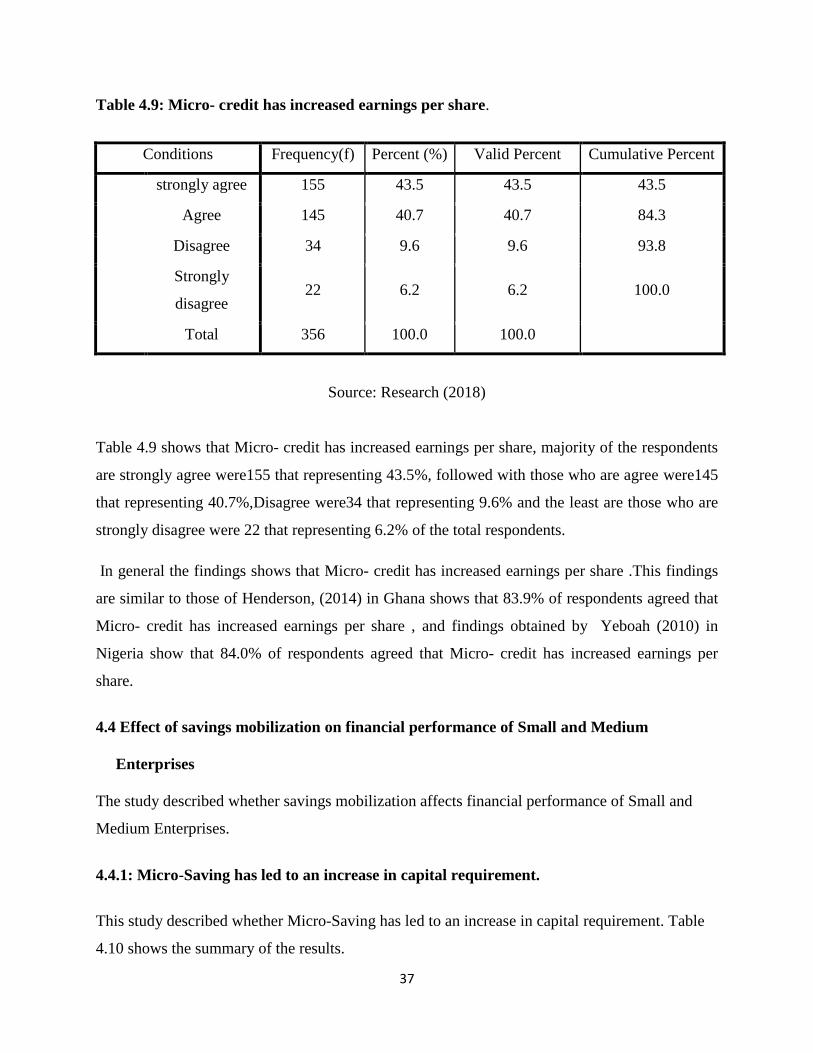
37
Table 4.9: Micro- credit has increased earnings per share.
Conditions Frequency(f) Percent (%) Valid Percent Cumulative Percent
strongly agree 155 43.5 43.5 43.5
Agree 145 40.7 40.7 84.3
Disagree 34 9.6 9.6 93.8
Strongly
disagree 22 6.2 6.2 100.0
Total 356 100.0 100.0
Source: Research (2018)
Table 4.9 shows that Micro- credit has increased earnings per share, majority of the respondents
are strongly agree were155 that representing 43.5%, followed with those who are agree were145
that representing 40.7%,Disagree were34 that representing 9.6% and the least are those who are
strongly disagree were 22 that representing 6.2% of the total respondents.
In general the findings shows that Micro- credit has increased earnings per share .This findings
are similar to those of Henderson, (2014) in Ghana shows that 83.9% of respondents agreed that
Micro- credit has increased earnings per share , and findings obtained by Yeboah (2010) in
Nigeria show that 84.0% of respondents agreed that Micro- credit has increased earnings per
share.
4.4 Effect of savings mobilization on financial performance of Small and Medium
Enterprises
The study described whether savings mobilization affects financial performance of Small and
Medium Enterprises.
4.4.1: Micro-Saving has led to an increase in capital requirement.
This study described whether Micro-Saving has led to an increase in capital requirement. Table
4.10 shows the summary of the results.
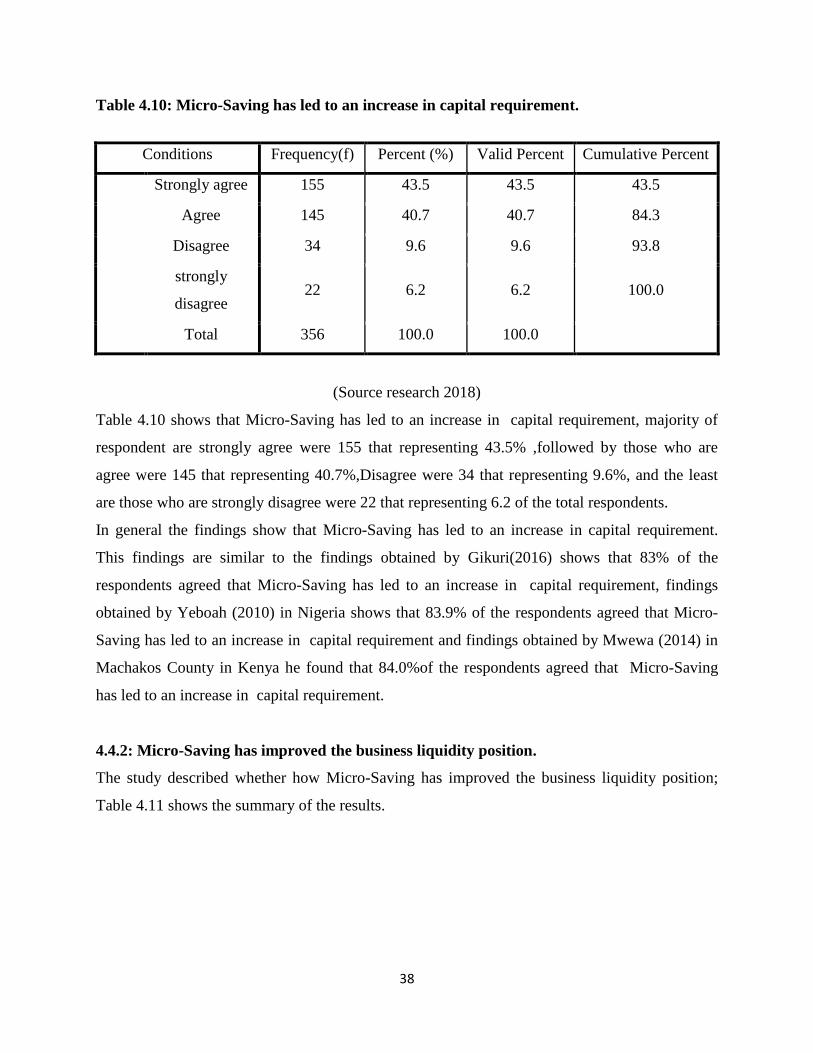
38
Table 4.10: Micro-Saving has led to an increase in capital requirement.
Conditions Frequency(f) Percent (%) Valid Percent Cumulative Percent
Strongly agree 155 43.5 43.5 43.5
Agree 145 40.7 40.7 84.3
Disagree 34 9.6 9.6 93.8
strongly
disagree 22 6.2 6.2 100.0
Total 356 100.0 100.0
(Source research 2018)
Table 4.10 shows that Micro-Saving has led to an increase in capital requirement, majority of
respondent are strongly agree were 155 that representing 43.5% ,followed by those who are
agree were 145 that representing 40.7%,Disagree were 34 that representing 9.6%, and the least
are those who are strongly disagree were 22 that representing 6.2 of the total respondents.
In general the findings show that Micro-Saving has led to an increase in capital requirement.
This findings are similar to the findings obtained by Gikuri(2016) shows that 83% of the
respondents agreed that Micro-Saving has led to an increase in capital requirement, findings
obtained by Yeboah (2010) in Nigeria shows that 83.9% of the respondents agreed that Micro-
Saving has led to an increase in capital requirement and findings obtained by Mwewa (2014) in
Machakos County in Kenya he found that 84.0%of the respondents agreed that Micro-Saving
has led to an increase in capital requirement.
4.4.2: Micro-Saving has improved the business liquidity position.
The study described whether how Micro-Saving has improved the business liquidity position;
Table 4.11 shows the summary of the results.
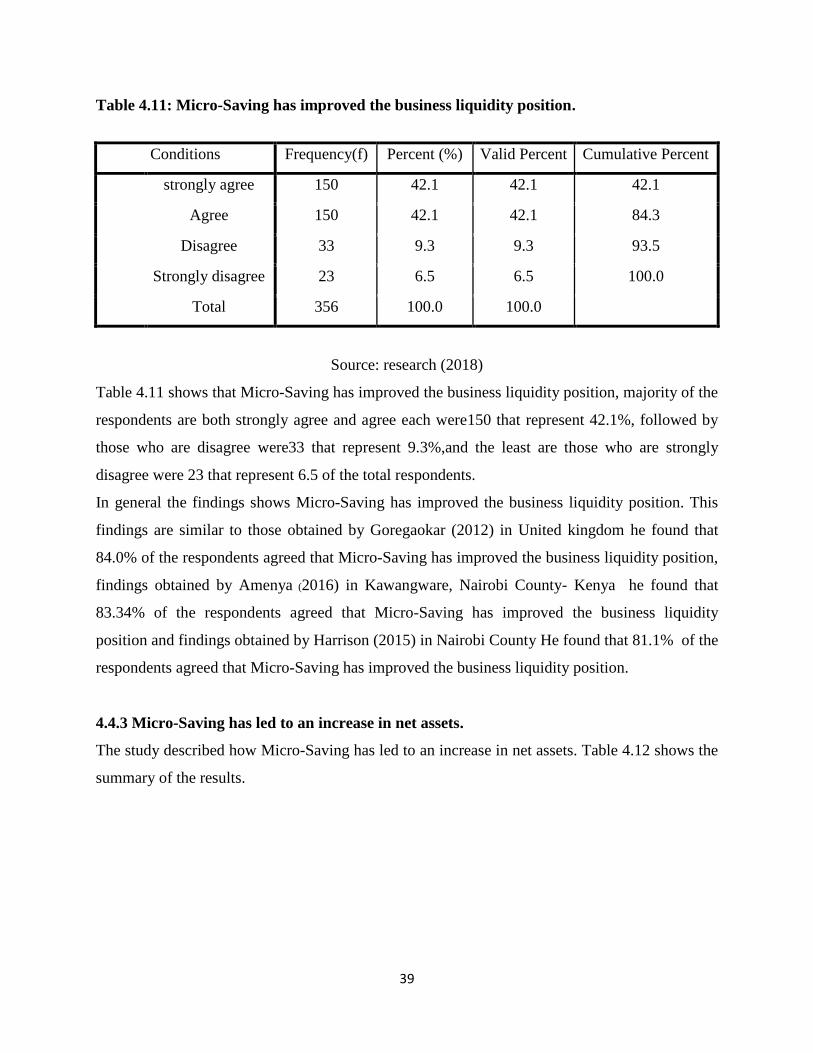
39
Table 4.11: Micro-Saving has improved the business liquidity position.
Conditions Frequency(f) Percent (%) Valid Percent Cumulative Percent
strongly agree 150 42.1 42.1 42.1
Agree 150 42.1 42.1 84.3
Disagree 33 9.3 9.3 93.5
Strongly disagree 23 6.5 6.5 100.0
Total 356 100.0 100.0
Source: research (2018)
Table 4.11 shows that Micro-Saving has improved the business liquidity position, majority of the
respondents are both strongly agree and agree each were150 that represent 42.1%, followed by
those who are disagree were33 that represent 9.3%,and the least are those who are strongly
disagree were 23 that represent 6.5 of the total respondents.
In general the findings shows Micro-Saving has improved the business liquidity position. This
findings are similar to those obtained by Goregaokar (2012) in United kingdom he found that
84.0% of the respondents agreed that Micro-Saving has improved the business liquidity position,
findings obtained by Amenya (2016) in Kawangware, Nairobi County- Kenya he found that
83.34% of the respondents agreed that Micro-Saving has improved the business liquidity
position and findings obtained by Harrison (2015) in Nairobi County He found that 81.1% of the
respondents agreed that Micro-Saving has improved the business liquidity position.
4.4.3 Micro-Saving has led to an increase in net assets.
The study described how Micro-Saving has led to an increase in net assets. Table 4.12 shows the
summary of the results.
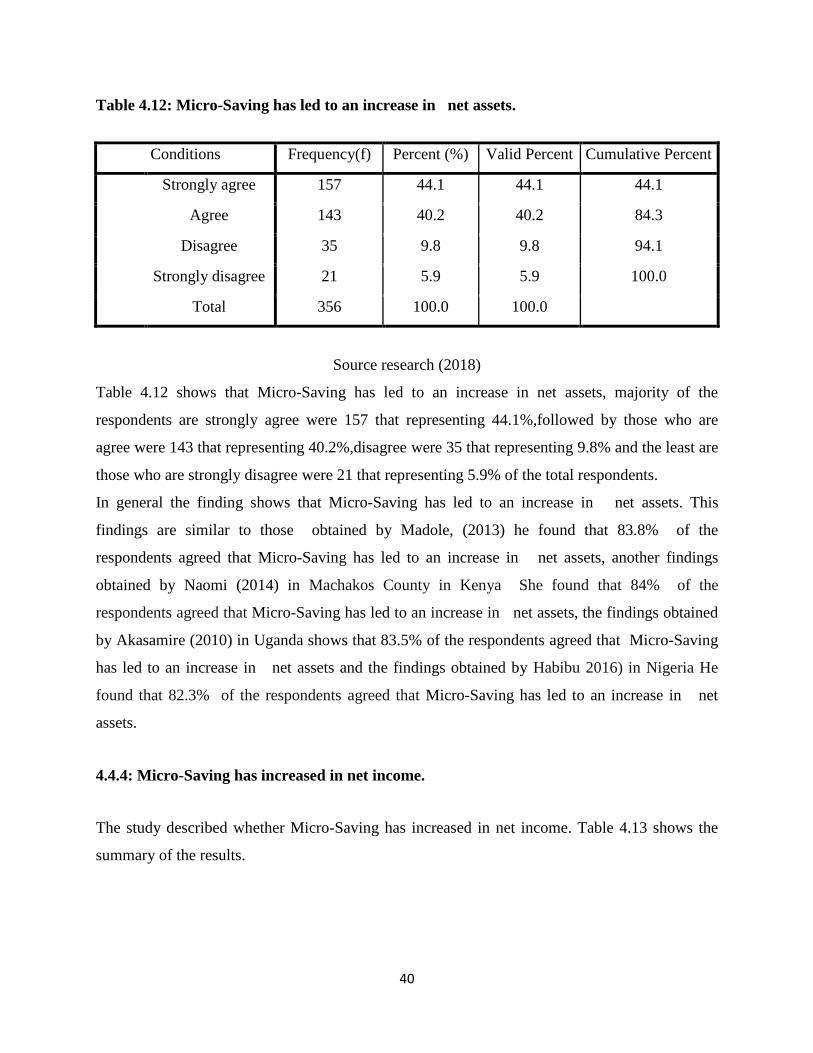
40
Table 4.12: Micro-Saving has led to an increase in net assets.
Conditions Frequency(f) Percent (%) Valid Percent Cumulative Percent
Strongly agree 157 44.1 44.1 44.1
Agree 143 40.2 40.2 84.3
Disagree 35 9.8 9.8 94.1
Strongly disagree 21 5.9 5.9 100.0
Total 356 100.0 100.0
Source research (2018)
Table 4.12 shows that Micro-Saving has led to an increase in net assets, majority of the
respondents are strongly agree were 157 that representing 44.1%,followed by those who are
agree were 143 that representing 40.2%,disagree were 35 that representing 9.8% and the least are
those who are strongly disagree were 21 that representing 5.9% of the total respondents.
In general the finding shows that Micro-Saving has led to an increase in net assets. This
findings are similar to those obtained by Madole, (2013) he found that 83.8% of the
respondents agreed that Micro-Saving has led to an increase in net assets, another findings
obtained by Naomi (2014) in Machakos County in Kenya She found that 84% of the
respondents agreed that Micro-Saving has led to an increase in net assets, the findings obtained
by Akasamire (2010) in Uganda shows that 83.5% of the respondents agreed that Micro-Saving
has led to an increase in net assets and the findings obtained by Habibu 2016) in Nigeria He
found that 82.3% of the respondents agreed that Micro-Saving has led to an increase in net
assets.
4.4.4: Micro-Saving has increased in net income.
The study described whether Micro-Saving has increased in net income. Table 4.13 shows the
summary of the results.
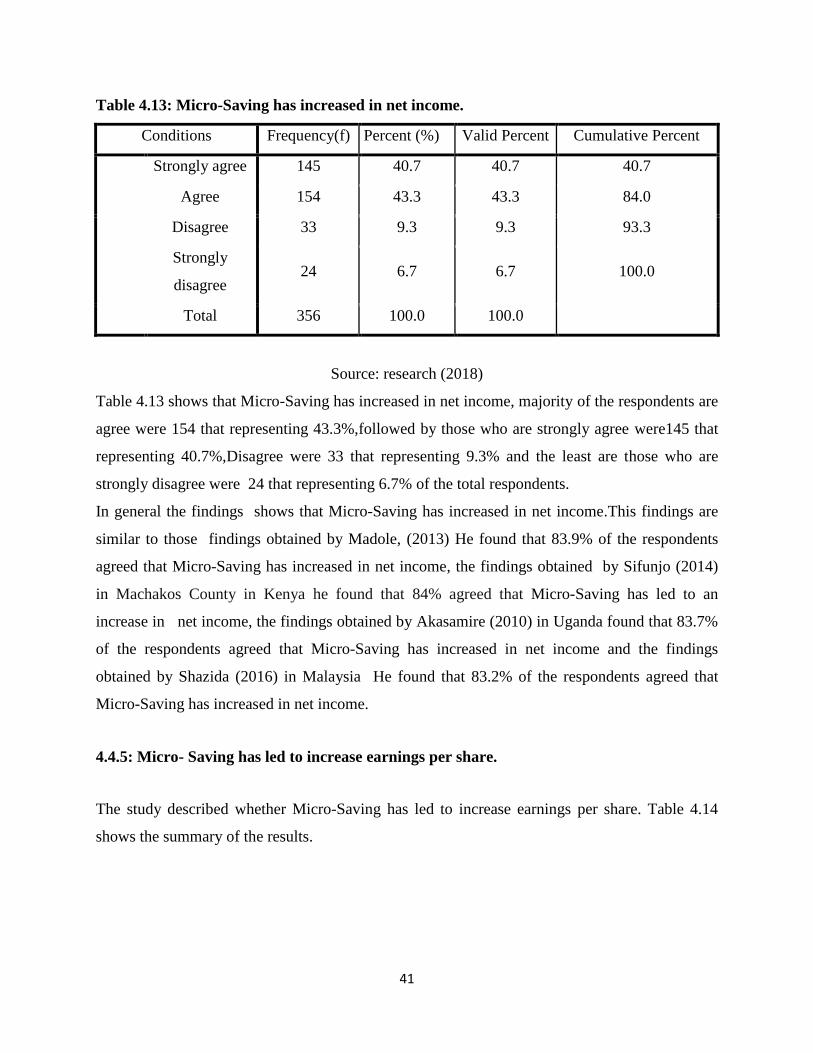
41
Table 4.13: Micro-Saving has increased in net income.
Conditions Frequency(f) Percent (%) Valid Percent Cumulative Percent
Strongly agree 145 40.7 40.7 40.7
Agree 154 43.3 43.3 84.0
Disagree 33 9.3 9.3 93.3
Strongly
disagree 24 6.7 6.7 100.0
Total 356 100.0 100.0
Source: research (2018)
Table 4.13 shows that Micro-Saving has increased in net income, majority of the respondents are
agree were 154 that representing 43.3%,followed by those who are strongly agree were145 that
representing 40.7%,Disagree were 33 that representing 9.3% and the least are those who are
strongly disagree were 24 that representing 6.7% of the total respondents.
In general the findings shows that Micro-Saving has increased in net income.This findings are
similar to those findings obtained by Madole, (2013) He found that 83.9% of the respondents
agreed that Micro-Saving has increased in net income, the findings obtained by Sifunjo (2014)
in Machakos County in Kenya he found that 84% agreed that Micro-Saving has led to an
increase in net income, the findings obtained by Akasamire (2010) in Uganda found that 83.7%
of the respondents agreed that Micro-Saving has increased in net income and the findings
obtained by Shazida (2016) in Malaysia He found that 83.2% of the respondents agreed that
Micro-Saving has increased in net income.
4.4.5: Micro- Saving has led to increase earnings per share.
The study described whether Micro-Saving has led to increase earnings per share. Table 4.14
shows the summary of the results.
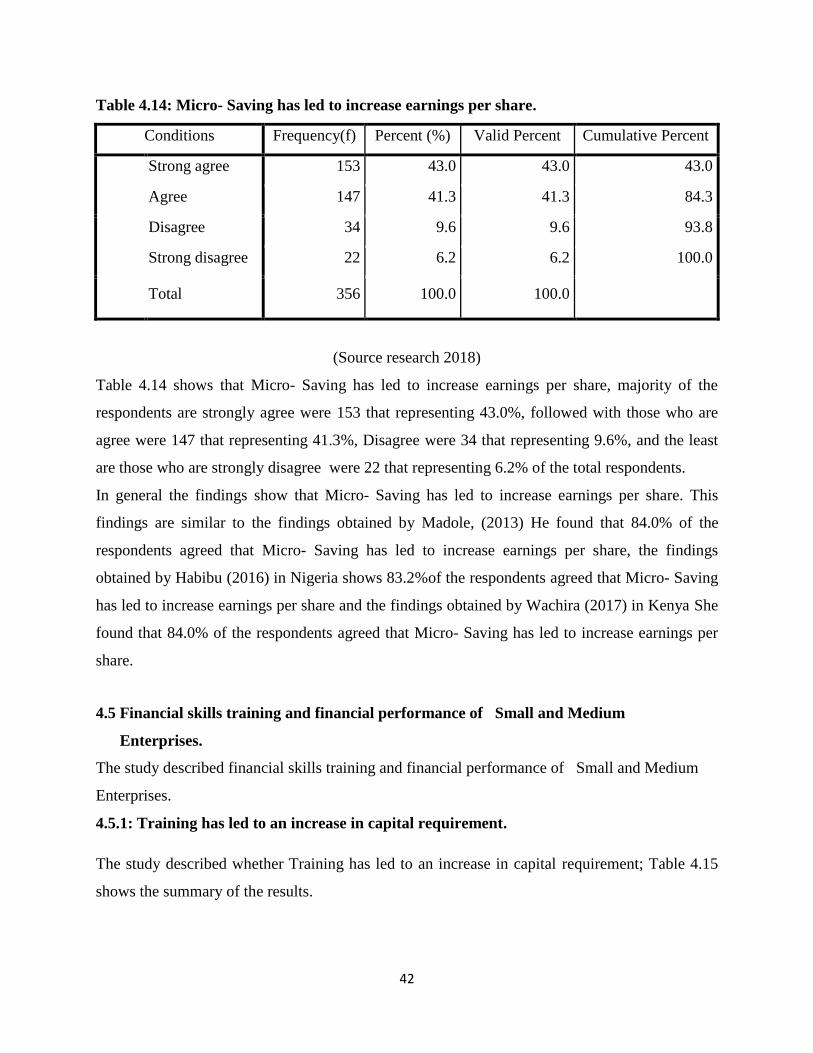
42
Table 4.14: Micro- Saving has led to increase earnings per share.
Conditions Frequency(f) Percent (%) Valid Percent Cumulative Percent
Strong agree 153 43.0 43.0 43.0
Agree 147 41.3 41.3 84.3
Disagree 34 9.6 9.6 93.8
Strong disagree 22 6.2 6.2 100.0
Total 356 100.0 100.0
(Source research 2018)
Table 4.14 shows that Micro- Saving has led to increase earnings per share, majority of the
respondents are strongly agree were 153 that representing 43.0%, followed with those who are
agree were 147 that representing 41.3%, Disagree were 34 that representing 9.6%, and the least
are those who are strongly disagree were 22 that representing 6.2% of the total respondents.
In general the findings show that Micro- Saving has led to increase earnings per share. This
findings are similar to the findings obtained by Madole, (2013) He found that 84.0% of the
respondents agreed that Micro- Saving has led to increase earnings per share, the findings
obtained by Habibu (2016) in Nigeria shows 83.2%of the respondents agreed that Micro- Saving
has led to increase earnings per share and the findings obtained by Wachira (2017) in Kenya She
found that 84.0% of the respondents agreed that Micro- Saving has led to increase earnings per
share.
4.5 Financial skills training and financial performance of Small and Medium
Enterprises.
The study described financial skills training and financial performance of Small and Medium
Enterprises.
4.5.1: Training has led to an increase in capital requirement.
The study described whether Training has led to an increase in capital requirement; Table 4.15
shows the summary of the results.
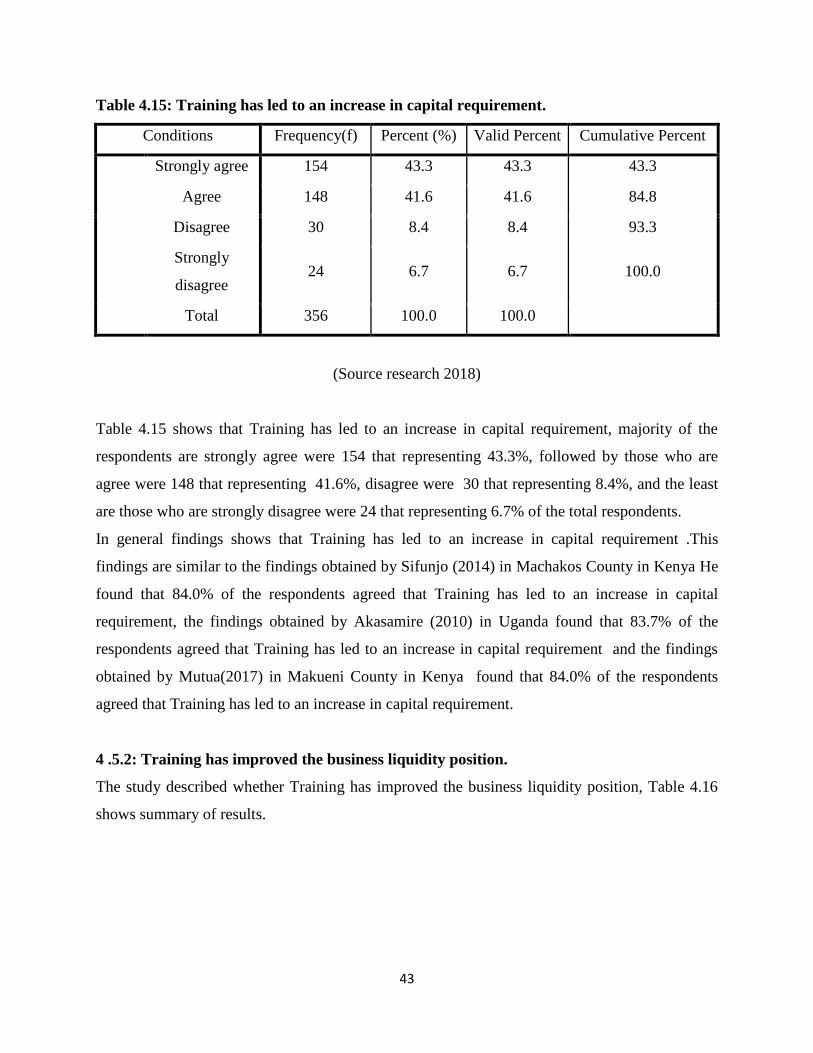
43
Table 4.15: Training has led to an increase in capital requirement.
Conditions Frequency(f) Percent (%) Valid Percent Cumulative Percent
Strongly agree 154 43.3 43.3 43.3
Agree 148 41.6 41.6 84.8
Disagree 30 8.4 8.4 93.3
Strongly
disagree 24 6.7 6.7 100.0
Total 356 100.0 100.0
(Source research 2018)
Table 4.15 shows that Training has led to an increase in capital requirement, majority of the
respondents are strongly agree were 154 that representing 43.3%, followed by those who are
agree were 148 that representing 41.6%, disagree were 30 that representing 8.4%, and the least
are those who are strongly disagree were 24 that representing 6.7% of the total respondents.
In general findings shows that Training has led to an increase in capital requirement .This
findings are similar to the findings obtained by Sifunjo (2014) in Machakos County in Kenya He
found that 84.0% of the respondents agreed that Training has led to an increase in capital
requirement, the findings obtained by Akasamire (2010) in Uganda found that 83.7% of the
respondents agreed that Training has led to an increase in capital requirement and the findings
obtained by Mutua(2017) in Makueni County in Kenya found that 84.0% of the respondents
agreed that Training has led to an increase in capital requirement.
4 .5.2: Training has improved the business liquidity position.
The study described whether Training has improved the business liquidity position, Table 4.16
shows summary of results.
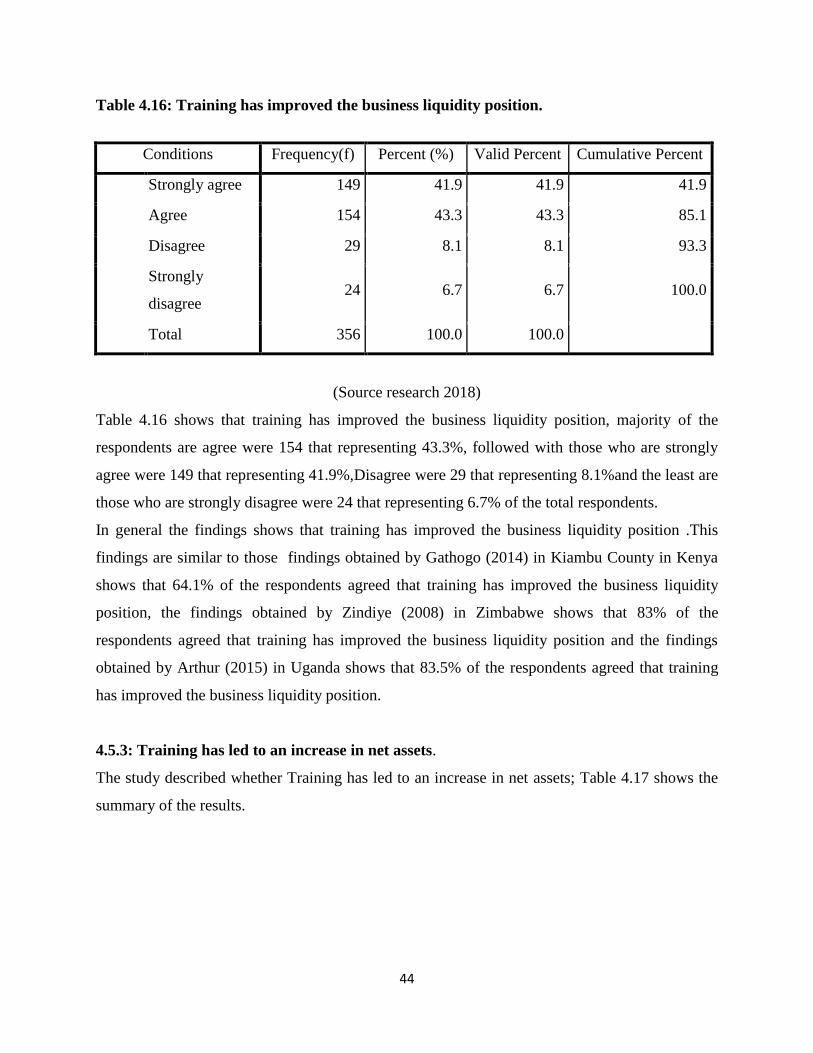
44
Table 4.16: Training has improved the business liquidity position.
Conditions Frequency(f) Percent (%) Valid Percent Cumulative Percent
Strongly agree 149 41.9 41.9 41.9
Agree 154 43.3 43.3 85.1
Disagree 29 8.1 8.1 93.3
Strongly
disagree 24 6.7 6.7 100.0
Total 356 100.0 100.0
(Source research 2018)
Table 4.16 shows that training has improved the business liquidity position, majority of the
respondents are agree were 154 that representing 43.3%, followed with those who are strongly
agree were 149 that representing 41.9%,Disagree were 29 that representing 8.1%and the least are
those who are strongly disagree were 24 that representing 6.7% of the total respondents.
In general the findings shows that training has improved the business liquidity position .This
findings are similar to those findings obtained by Gathogo (2014) in Kiambu County in Kenya
shows that 64.1% of the respondents agreed that training has improved the business liquidity
position, the findings obtained by Zindiye (2008) in Zimbabwe shows that 83% of the
respondents agreed that training has improved the business liquidity position and the findings
obtained by Arthur (2015) in Uganda shows that 83.5% of the respondents agreed that training
has improved the business liquidity position.
4.5.3: Training has led to an increase in net assets.
The study described whether Training has led to an increase in net assets; Table 4.17 shows the
summary of the results.
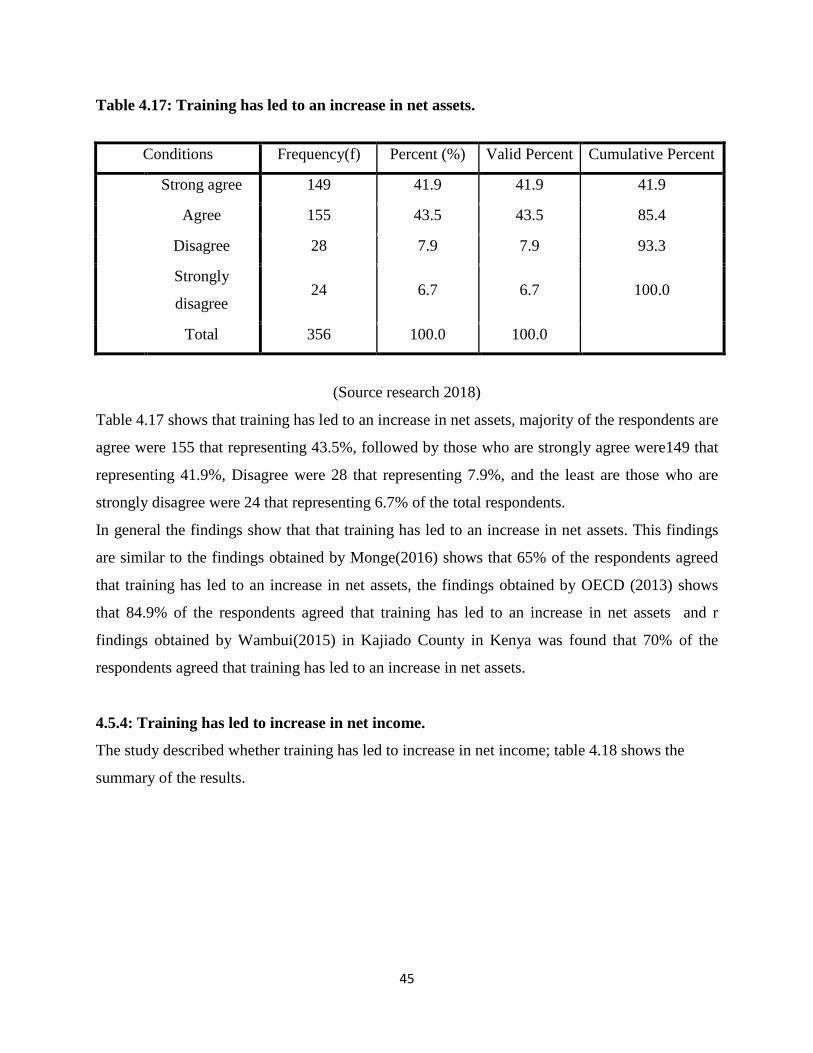
45
Table 4.17: Training has led to an increase in net assets.
Conditions Frequency(f) Percent (%) Valid Percent Cumulative Percent
Strong agree 149 41.9 41.9 41.9
Agree 155 43.5 43.5 85.4
Disagree 28 7.9 7.9 93.3
Strongly
disagree 24 6.7 6.7 100.0
Total 356 100.0 100.0
(Source research 2018)
Table 4.17 shows that training has led to an increase in net assets, majority of the respondents are
agree were 155 that representing 43.5%, followed by those who are strongly agree were149 that
representing 41.9%, Disagree were 28 that representing 7.9%, and the least are those who are
strongly disagree were 24 that representing 6.7% of the total respondents.
In general the findings show that that training has led to an increase in net assets. This findings
are similar to the findings obtained by Monge(2016) shows that 65% of the respondents agreed
that training has led to an increase in net assets, the findings obtained by OECD (2013) shows
that 84.9% of the respondents agreed that training has led to an increase in net assets and r
findings obtained by Wambui(2015) in Kajiado County in Kenya was found that 70% of the
respondents agreed that training has led to an increase in net assets.
4.5.4: Training has led to increase in net income.
The study described whether training has led to increase in net income; table 4.18 shows the
summary of the results.
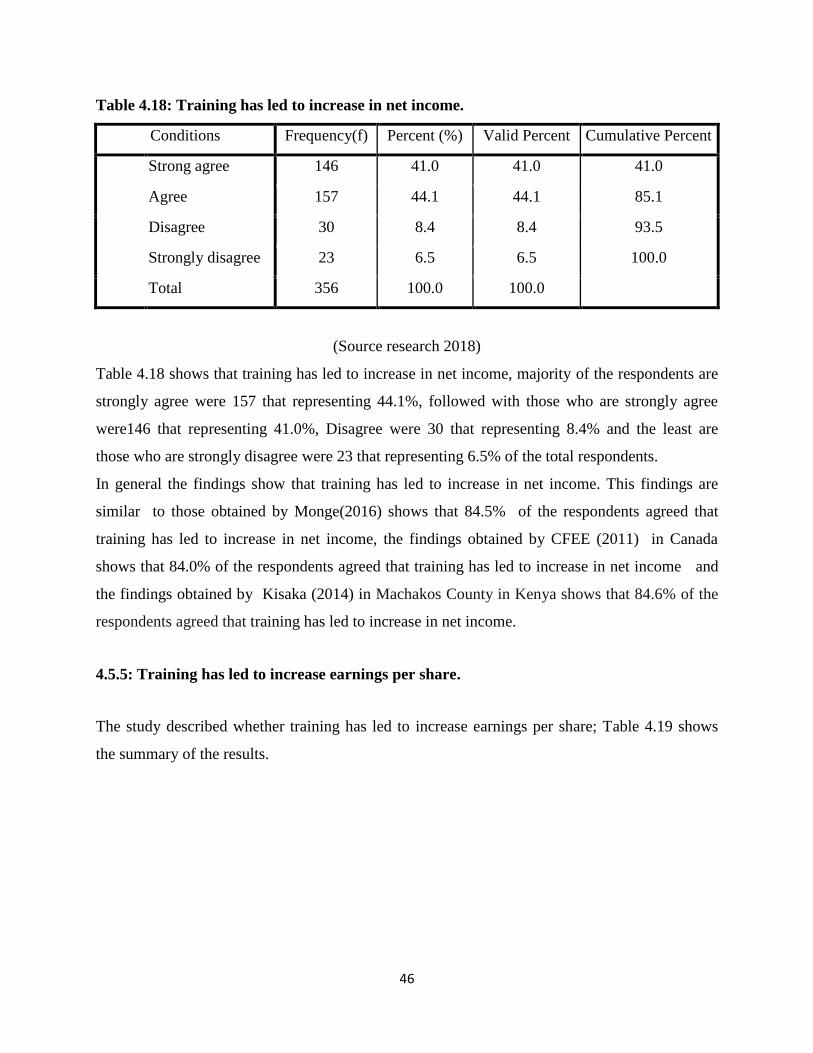
46
Table 4.18: Training has led to increase in net income.
Conditions Frequency(f) Percent (%) Valid Percent Cumulative Percent
Strong agree 146 41.0 41.0 41.0
Agree 157 44.1 44.1 85.1
Disagree 30 8.4 8.4 93.5
Strongly disagree 23 6.5 6.5 100.0
Total 356 100.0 100.0
(Source research 2018)
Table 4.18 shows that training has led to increase in net income, majority of the respondents are
strongly agree were 157 that representing 44.1%, followed with those who are strongly agree
were146 that representing 41.0%, Disagree were 30 that representing 8.4% and the least are
those who are strongly disagree were 23 that representing 6.5% of the total respondents.
In general the findings show that training has led to increase in net income. This findings are
similar to those obtained by Monge(2016) shows that 84.5% of the respondents agreed that
training has led to increase in net income, the findings obtained by CFEE (2011) in Canada
shows that 84.0% of the respondents agreed that training has led to increase in net income and
the findings obtained by Kisaka (2014) in Machakos County in Kenya shows that 84.6% of the
respondents agreed that training has led to increase in net income.
4.5.5: Training has led to increase earnings per share.
The study described whether training has led to increase earnings per share; Table 4.19 shows
the summary of the results.
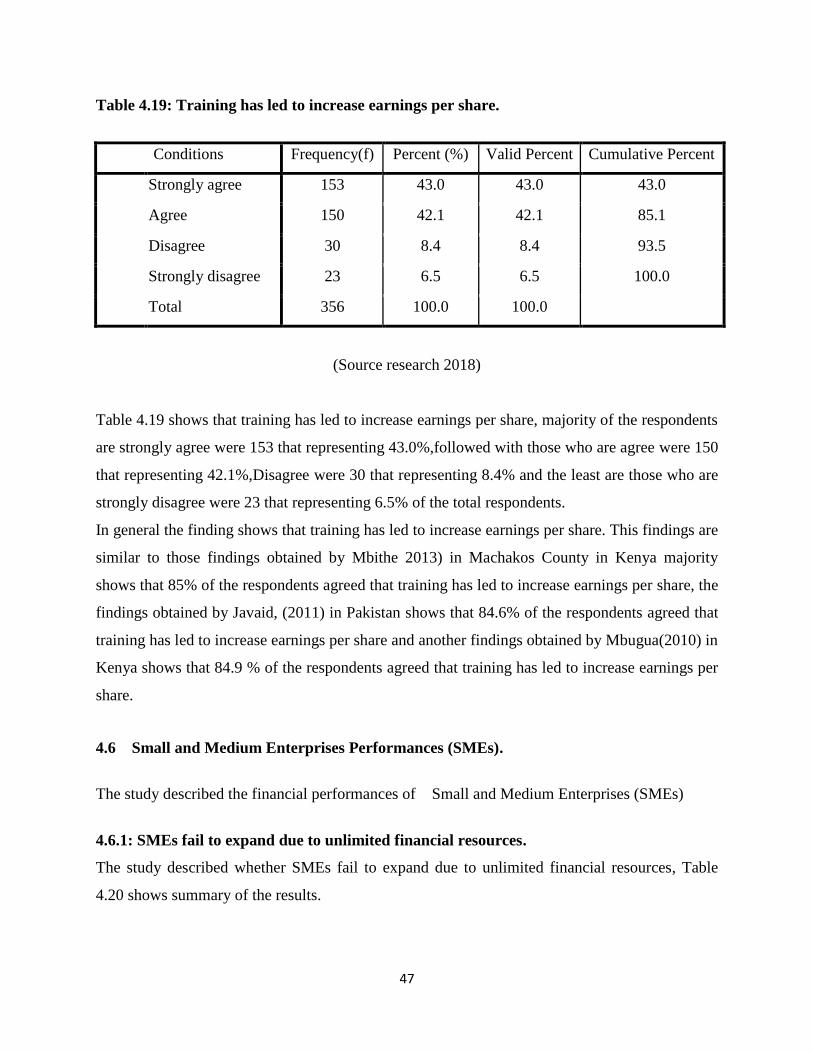
47
Table 4.19: Training has led to increase earnings per share.
Conditions Frequency(f) Percent (%) Valid Percent Cumulative Percent
Strongly agree 153 43.0 43.0 43.0
Agree 150 42.1 42.1 85.1
Disagree 30 8.4 8.4 93.5
Strongly disagree 23 6.5 6.5 100.0
Total 356 100.0 100.0
(Source research 2018)
Table 4.19 shows that training has led to increase earnings per share, majority of the respondents
are strongly agree were 153 that representing 43.0%,followed with those who are agree were 150
that representing 42.1%,Disagree were 30 that representing 8.4% and the least are those who are
strongly disagree were 23 that representing 6.5% of the total respondents.
In general the finding shows that training has led to increase earnings per share. This findings are
similar to those findings obtained by Mbithe 2013) in Machakos County in Kenya majority
shows that 85% of the respondents agreed that training has led to increase earnings per share, the
findings obtained by Javaid, (2011) in Pakistan shows that 84.6% of the respondents agreed that
training has led to increase earnings per share and another findings obtained by Mbugua(2010) in
Kenya shows that 84.9 % of the respondents agreed that training has led to increase earnings per
share.
4.6 Small and Medium Enterprises Performances (SMEs).
The study described the financial performances of Small and Medium Enterprises (SMEs)
4.6.1: SMEs fail to expand due to unlimited financial resources.
The study described whether SMEs fail to expand due to unlimited financial resources, Table
4.20 shows summary of the results.
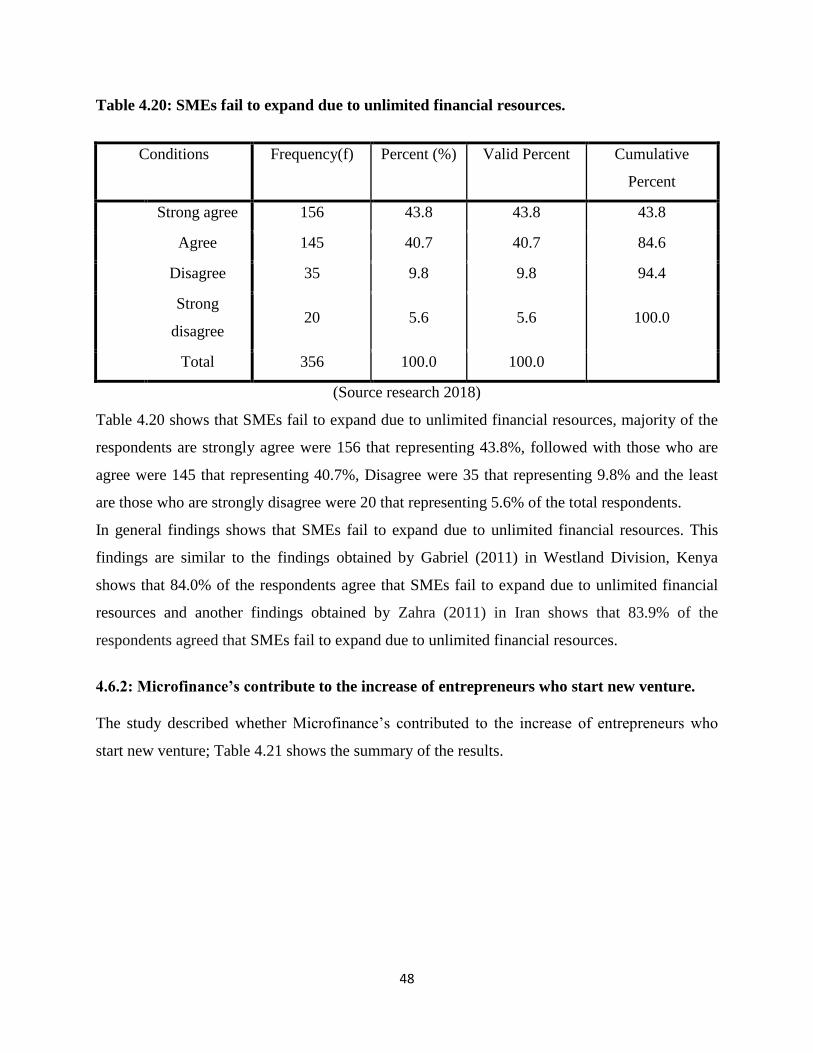
48
Table 4.20: SMEs fail to expand due to unlimited financial resources.
Conditions Frequency(f) Percent (%) Valid Percent Cumulative
Percent
Strong agree 156 43.8 43.8 43.8
Agree 145 40.7 40.7 84.6
Disagree 35 9.8 9.8 94.4
Strong
disagree 20 5.6 5.6 100.0
Total 356 100.0 100.0
(Source research 2018)
Table 4.20 shows that SMEs fail to expand due to unlimited financial resources, majority of the
respondents are strongly agree were 156 that representing 43.8%, followed with those who are
agree were 145 that representing 40.7%, Disagree were 35 that representing 9.8% and the least
are those who are strongly disagree were 20 that representing 5.6% of the total respondents.
In general findings shows that SMEs fail to expand due to unlimited financial resources. This
findings are similar to the findings obtained by Gabriel (2011) in Westland Division, Kenya
shows that 84.0% of the respondents agree that SMEs fail to expand due to unlimited financial
resources and another findings obtained by Zahra (2011) in Iran shows that 83.9% of the
respondents agreed that SMEs fail to expand due to unlimited financial resources.
4.6.2: Microfinance’s contribute to the increase of entrepreneurs who start new venture.
The study described whether Microfinance’s contributed to the increase of entrepreneurs who
start new venture; Table 4.21 shows the summary of the results.
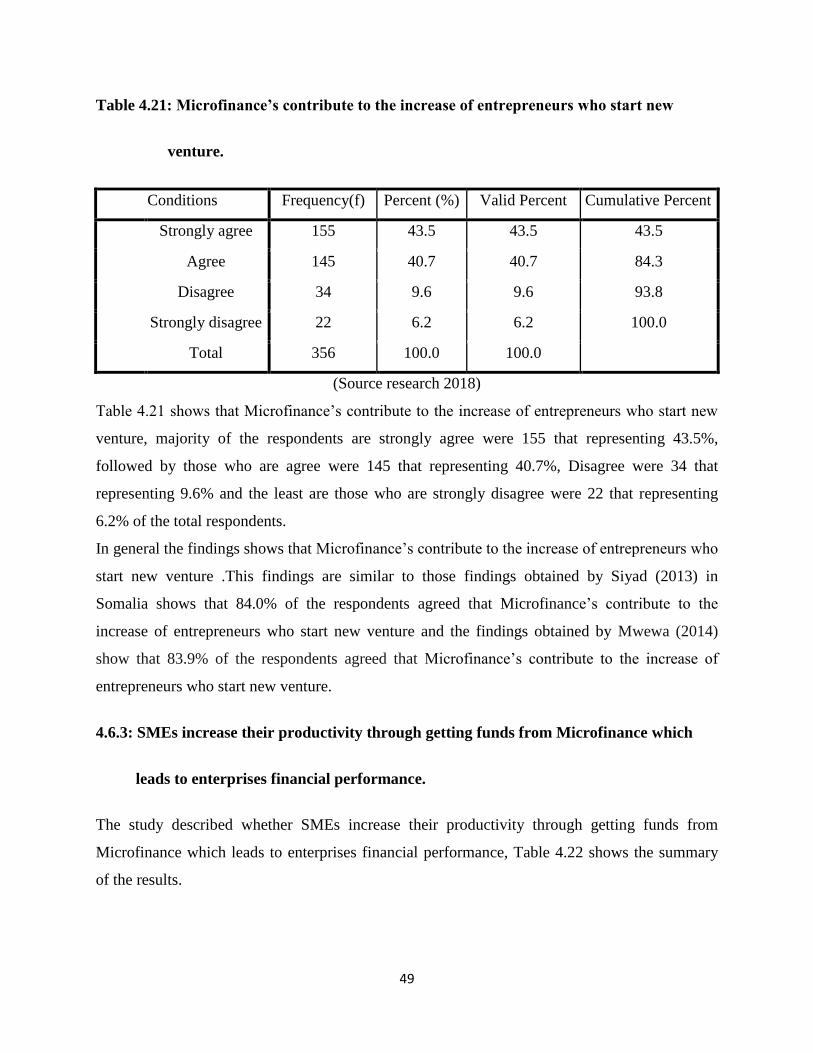
49
Table 4.21: Microfinance’s contribute to the increase of entrepreneurs who start new
venture.
Conditions Frequency(f) Percent (%) Valid Percent Cumulative Percent
Strongly agree 155 43.5 43.5 43.5
Agree 145 40.7 40.7 84.3
Disagree 34 9.6 9.6 93.8
Strongly disagree 22 6.2 6.2 100.0
Total 356 100.0 100.0
(Source research 2018)
Table 4.21 shows that Microfinance’s contribute to the increase of entrepreneurs who start new
venture, majority of the respondents are strongly agree were 155 that representing 43.5%,
followed by those who are agree were 145 that representing 40.7%, Disagree were 34 that
representing 9.6% and the least are those who are strongly disagree were 22 that representing
6.2% of the total respondents.
In general the findings shows that Microfinance’s contribute to the increase of entrepreneurs who
start new venture .This findings are similar to those findings obtained by Siyad (2013) in
Somalia shows that 84.0% of the respondents agreed that Microfinance’s contribute to the
increase of entrepreneurs who start new venture and the findings obtained by Mwewa (2014)
show that 83.9% of the respondents agreed that Microfinance’s contribute to the increase of
entrepreneurs who start new venture.
4.6.3: SMEs increase their productivity through getting funds from Microfinance which
leads to enterprises financial performance.
The study described whether SMEs increase their productivity through getting funds from
Microfinance which leads to enterprises financial performance, Table 4.22 shows the summary
of the results.
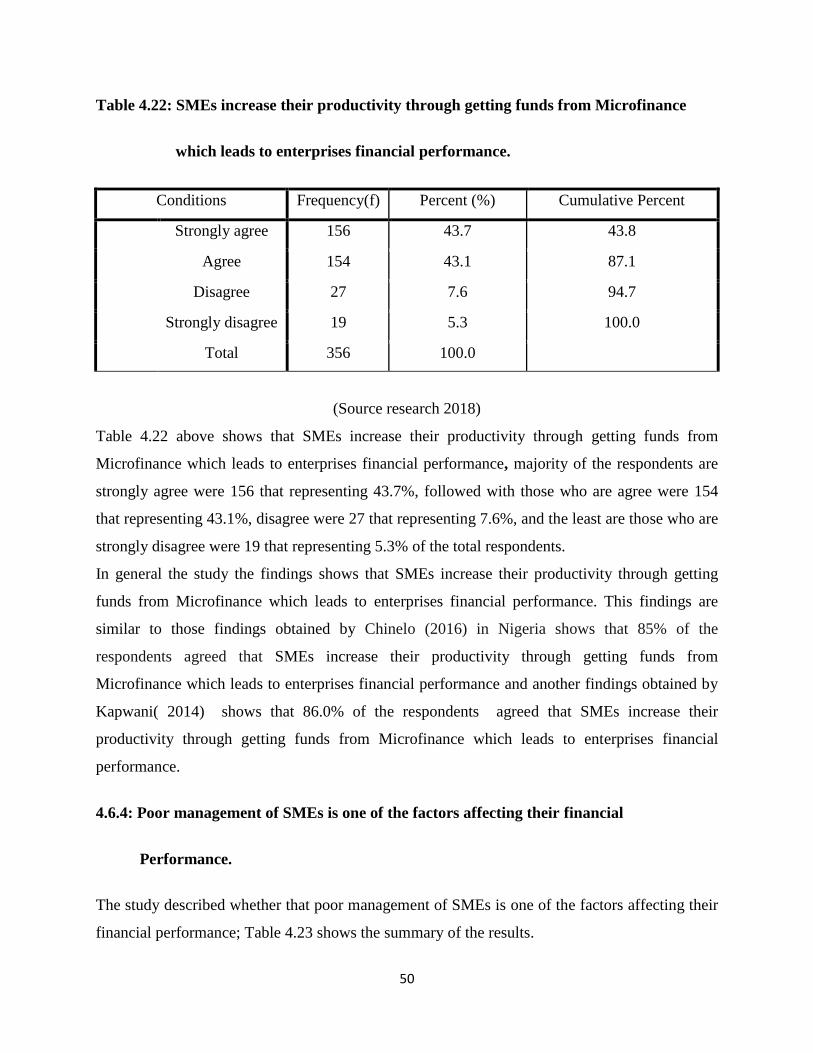
50
Table 4.22: SMEs increase their productivity through getting funds from Microfinance
which leads to enterprises financial performance.
Conditions Frequency(f) Percent (%) Cumulative Percent
Strongly agree 156 43.7 43.8
Agree 154 43.1 87.1
Disagree 27 7.6 94.7
Strongly disagree 19 5.3 100.0
Total 356 100.0
(Source research 2018)
Table 4.22 above shows that SMEs increase their productivity through getting funds from
Microfinance which leads to enterprises financial performance, majority of the respondents are
strongly agree were 156 that representing 43.7%, followed with those who are agree were 154
that representing 43.1%, disagree were 27 that representing 7.6%, and the least are those who are
strongly disagree were 19 that representing 5.3% of the total respondents.
In general the study the findings shows that SMEs increase their productivity through getting
funds from Microfinance which leads to enterprises financial performance. This findings are
similar to those findings obtained by Chinelo (2016) in Nigeria shows that 85% of the
respondents agreed that SMEs increase their productivity through getting funds from
Microfinance which leads to enterprises financial performance and another findings obtained by
Kapwani( 2014) shows that 86.0% of the respondents agreed that SMEs increase their
productivity through getting funds from Microfinance which leads to enterprises financial
performance.
4.6.4: Poor management of SMEs is one of the factors affecting their financial
Performance.
The study described whether that poor management of SMEs is one of the factors affecting their
financial performance; Table 4.23 shows the summary of the results.
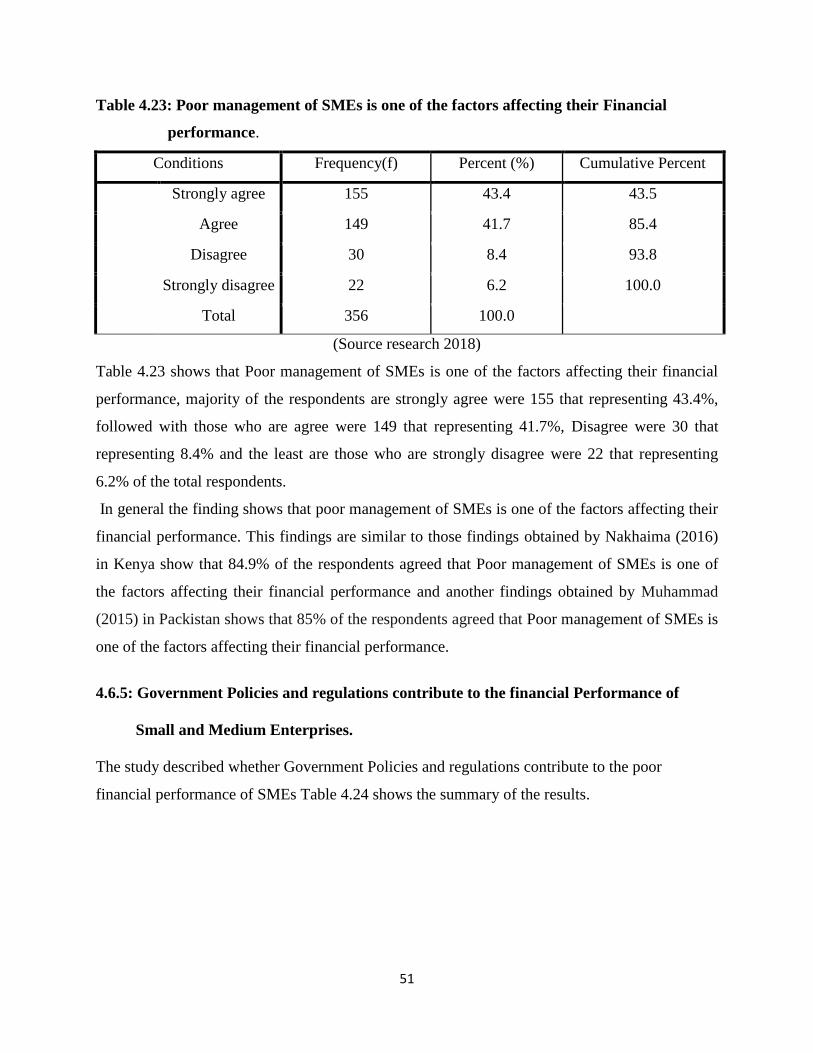
51
Table 4.23: Poor management of SMEs is one of the factors affecting their Financial
performance.
Conditions Frequency(f) Percent (%) Cumulative Percent
Strongly agree 155 43.4 43.5
Agree 149 41.7 85.4
Disagree 30 8.4 93.8
Strongly disagree 22 6.2 100.0
Total 356 100.0
(Source research 2018)
Table 4.23 shows that Poor management of SMEs is one of the factors affecting their financial
performance, majority of the respondents are strongly agree were 155 that representing 43.4%,
followed with those who are agree were 149 that representing 41.7%, Disagree were 30 that
representing 8.4% and the least are those who are strongly disagree were 22 that representing
6.2% of the total respondents.
In general the finding shows that poor management of SMEs is one of the factors affecting their
financial performance. This findings are similar to those findings obtained by Nakhaima (2016)
in Kenya show that 84.9% of the respondents agreed that Poor management of SMEs is one of
the factors affecting their financial performance and another findings obtained by Muhammad
(2015) in Packistan shows that 85% of the respondents agreed that Poor management of SMEs is
one of the factors affecting their financial performance.
4.6.5: Government Policies and regulations contribute to the financial Performance of
Small and Medium Enterprises.
The study described whether Government Policies and regulations contribute to the poor
financial performance of SMEs Table 4.24 shows the summary of the results.
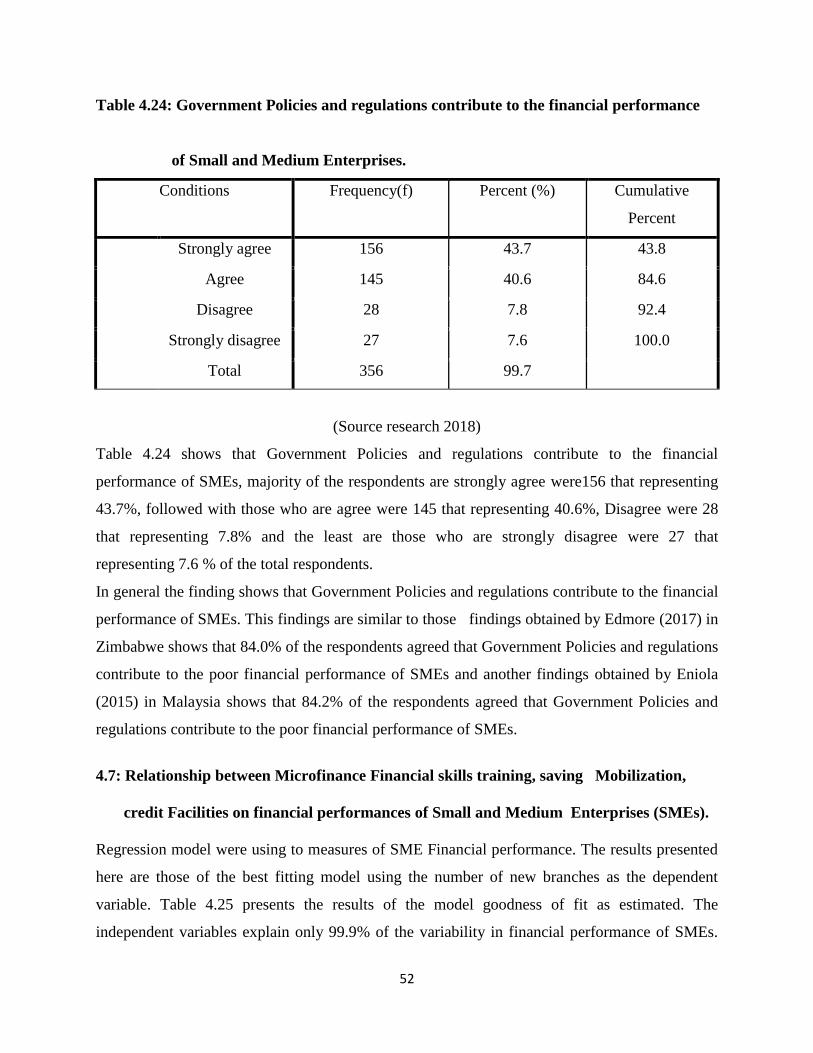
52
Table 4.24: Government Policies and regulations contribute to the financial performance
of Small and Medium Enterprises.
Conditions Frequency(f) Percent (%) Cumulative
Percent
Strongly agree 156 43.7 43.8
Agree 145 40.6 84.6
Disagree 28 7.8 92.4
Strongly disagree 27 7.6 100.0
Total 356 99.7
(Source research 2018)
Table 4.24 shows that Government Policies and regulations contribute to the financial
performance of SMEs, majority of the respondents are strongly agree were156 that representing
43.7%, followed with those who are agree were 145 that representing 40.6%, Disagree were 28
that representing 7.8% and the least are those who are strongly disagree were 27 that
representing 7.6 % of the total respondents.
In general the finding shows that Government Policies and regulations contribute to the financial
performance of SMEs. This findings are similar to those findings obtained by Edmore (2017) in
Zimbabwe shows that 84.0% of the respondents agreed that Government Policies and regulations
contribute to the poor financial performance of SMEs and another findings obtained by Eniola
(2015) in Malaysia shows that 84.2% of the respondents agreed that Government Policies and
regulations contribute to the poor financial performance of SMEs.
4.7: Relationship between Microfinance Financial skills training, saving Mobilization,
credit Facilities on financial performances of Small and Medium Enterprises (SMEs).
Regression model were using to measures of SME Financial performance. The results presented
here are those of the best fitting model using the number of new branches as the dependent
variable. Table 4.25 presents the results of the model goodness of fit as estimated. The
independent variables explain only 99.9% of the variability in financial performance of SMEs.
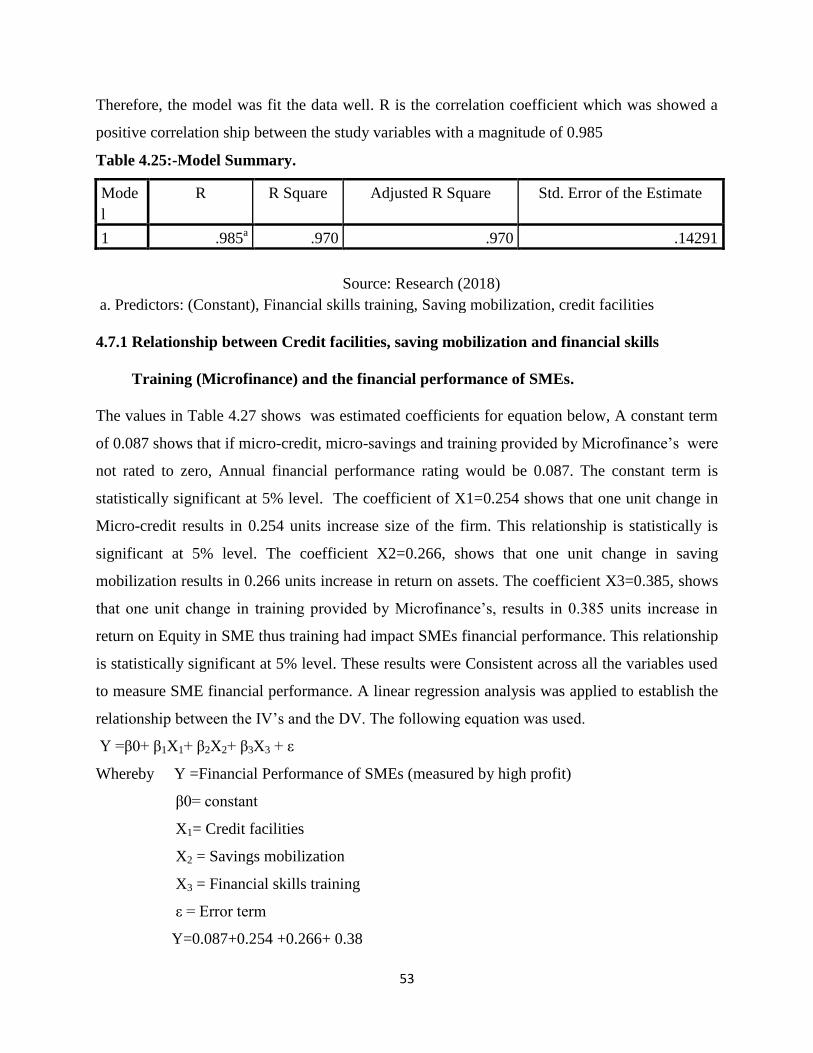
53
Therefore, the model was fit the data well. R is the correlation coefficient which was showed a
positive correlation ship between the study variables with a magnitude of 0.985
Table 4.25:-Model Summary.
Mode
l
R R Square Adjusted R Square Std. Error of the Estimate
1 .985a .970 .970 .14291
Source: Research (2018)
a. Predictors: (Constant), Financial skills training, Saving mobilization, credit facilities
4.7.1 Relationship between Credit facilities, saving mobilization and financial skills
Training (Microfinance) and the financial performance of SMEs.
The values in Table 4.27 shows was estimated coefficients for equation below, A constant term
of 0.087 shows that if micro-credit, micro-savings and training provided by Microfinance’s were
not rated to zero, Annual financial performance rating would be 0.087. The constant term is
statistically significant at 5% level. The coefficient of X1=0.254 shows that one unit change in
Micro-credit results in 0.254 units increase size of the firm. This relationship is statistically is
significant at 5% level. The coefficient X2=0.266, shows that one unit change in saving
mobilization results in 0.266 units increase in return on assets. The coefficient X3=0.385, shows
that one unit change in training provided by Microfinance’s, results in 0.385 units increase in
return on Equity in SME thus training had impact SMEs financial performance. This relationship
is statistically significant at 5% level. These results were Consistent across all the variables used
to measure SME financial performance. A linear regression analysis was applied to establish the
relationship between the IV’s and the DV. The following equation was used.
Y =β0+ β1X1+ β2X2+ β3X3 + ε
Whereby Y =Financial Performance of SMEs (measured by high profit)
β0= constant
X1= Credit facilities
X2 = Savings mobilization
X3 = Financial skills training
ε = Error term
Y=0.087+0.254 +0.266+ 0.38
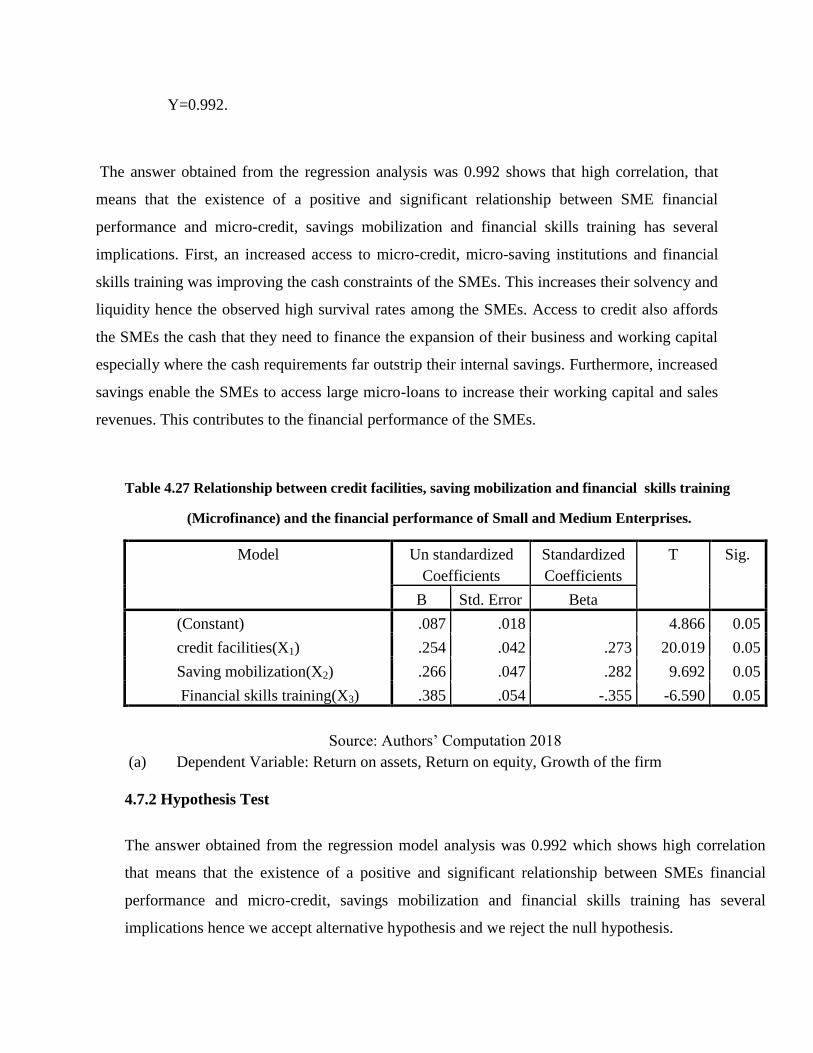
54
Y=0.992.
The answer obtained from the regression analysis was 0.992 shows that high correlation, that
means that the existence of a positive and significant relationship between SME financial
performance and micro-credit, savings mobilization and financial skills training has several
implications. First, an increased access to micro-credit, micro-saving institutions and financial
skills training was improving the cash constraints of the SMEs. This increases their solvency and
liquidity hence the observed high survival rates among the SMEs. Access to credit also affords
the SMEs the cash that they need to finance the expansion of their business and working capital
especially where the cash requirements far outstrip their internal savings. Furthermore, increased
savings enable the SMEs to access large micro-loans to increase their working capital and sales
revenues. This contributes to the financial performance of the SMEs.
Table 4.27 Relationship between credit facilities, saving mobilization and financial skills training
(Microfinance) and the financial performance of Small and Medium Enterprises.
Model Un standardized
Coefficients
Standardized
Coefficients
T Sig.
B Std. Error Beta
(Constant) .087 .018 4.866 0.05
credit facilities(X1) .254 .042 .273 20.019 0.05
Saving mobilization(X2) .266 .047 .282 9.692 0.05
Financial skills training(X3) .385 .054 -.355 -6.590 0.05
Source: Authors’ Computation 2018
(a) Dependent Variable: Return on assets, Return on equity, Growth of the firm
4.7.2 Hypothesis Test
The answer obtained from the regression model analysis was 0.992 which shows high correlation
that means that the existence of a positive and significant relationship between SMEs financial
performance and micro-credit, savings mobilization and financial skills training has several
implications hence we accept alternative hypothesis and we reject the null hypothesis.
55
CHAPTER FIVE
SUMMARY, CONCLUSION AND RECOMMENDATIONS.
5.1 Introduction.
This chapter contains Summary, conclusion of the research and recommendation for further
research to be conducted about microfinance and financial performance of Small and Medium
enterprises in Tanzania.
5.2 Summary.
The specific objective of the study was to establish the influence of provision of credit facilities
on financial performance of Small and Medium Enterprises, to determine the effect of savings
mobilization on financial performance of Small and Medium Enterprises and to find out the
relationship between financial skills training and financial performance of Small and Medium
Enterprises in Ilala Municipal, Dar es Salaam Tanzania.
The findings of the study showed that the majority of the respondents 84.0% was agreed that
Micro-credit has led to an increase in capital requirements , majority of respondents 83.9% was
agree that Micro-credit has improved the business liquidity position, majority of the respondents
was agree 84.0% that Micro-credit has led to an increase in net assets, majority of the
respondent about 84.2% was agree that Micro-credit has increased net income majority of the
respondents 84.2% was agree that Micro- credit has increased earnings per share. Therefore this
show that influence of provision of credit facilities affect financial performance of Small and
Medium Enterprises.
Majority of the respondents 84.2% was agree that shows that Micro-Saving has led to an increase
in capital requirement, majority of the respondent 84.2% was agree that Micro-Saving has
improved the business liquidity position, majority of the respondents about 84.3% was agree
that Micro-Saving has led to an increase in net assets, majority of the respondents 84.0% was
agree that Micro-Saving has increased in net income and majority of the respondents 84.3% was
56
agree that Micro- Saving has led to increase earnings per share . Therefore this shows that
savings mobilization effect financial performance of Small and Medium Enterprises.
Majority of the respondent 84.9% was agree that training has led to an increase in capital
requirement, majority of the respondent 85.2% was agree that training has improved the business
liquidity position, majority of the respondents 85.4% was agree that training has led to an
increase in net assets majority of the respondents 85.1% was agree that training has led to
increase in net income and majority of the respondents about 85.1% was agree that training has
led to increase earnings per share. Therefore financial skills training affect financial performance
of Small and Medium Enterprises.
Majority of the respondents 84.5% was agree that SMEs fail to expand due to unlimited financial
resources, majority of the respondents 84.2% was agree that Microfinance’s contribute to the
increase of entrepreneurs who start new venture, majority of the respondents about 86.8% was
agree that SMEs increase their productivity through getting funds from Microfinance which
leads to enterprises financial performance, majority of the respondents was agree that Poor
management of SMEs is one of the factors affecting their financial performance and majority of
the respondents 84.3% was agree that Unfavorable Government Policies and regulations
contribute to the poor financial performance of SMEs. Therefore microfinance’s activities such
as Credit facilities, saving mobilization and financial skills affect financial performance of Small
and Medium Enterprises in Tanzania.
The answer obtained from the regression model analysis was 0.992 which shows high correlation
that means that the existence of a positive and significant relationship between SME financial
performance and micro-credit, savings mobilization and financial skills training has several
implications hence we reject the null hypothesis.
The objective of this research was to study and establish the effect of microfinance on financial
performance of SMEs in Ilala Municipal, Tanzania. The effect was to be measured by the access
to business capital, increase of business liquidity, asset accumulation, and protection in income
fluctuation and management of risks. Access to business capital is a competitive advantage to
SMEs. It enables business to grow their business by either increasing the size of business or
57
diversifying their investment portfolios. Enabling business to accumulate capital is the most
direct effect of microfinance services. Productive or fixed assets acquired are economic
resources that enable business generate revenue. It was evident from the study that microfinance
services improve the business liquidity position that enables business to increase sales, asset base
and minimizes risks. Microfinance services protect SMEs against income fluctuations. This
enables business people to maintain their expenditures without interfering with the normal
operations of the business.
The study revealed that credit has improved the financial performance of SMEs. The access to
credit enabled SMEs to engage in income generating business and improve the owners’ living
standards. Most SMEs confirmed that credit had improved their financial performance. The
study also showed that savings had an effect on financial performance of SMEs. It enhances
acquisition of assets and also mitigates risks that SMEs are exposed to. Most respondent
confirmed that it improved their financial performance. Insurance services also improved
financial performance of SMEs this was confirmed by the respondents during the study. Some
did not agree that the service contributed to positive financial performance but a good number
confirmed the positive effect on their financial performance. It also insulated them against
adversities, hence stability of the business. Training exposes relevant skills to trainees. The
analysis of the data obtained showed that most SMEs indicated that training had exposed them to
skills on how to run their business profitably. The overall analysis of the data obtained revealed
that there is a substantial effect of microfinance services on the financial performance of SMEs.
It is confirmed that sustainable or consistent microfinance services enables SMEs to build stable
business and improve their financial performance in general.
5.3 Conclusion.
The general objective of the study was to assess the contributions of microfinance on financial
performance of Small and Medium Enterprise in Ilala Municipal, Dar es Salaam Tanzania using
three constructs of microfinance; microcredit, saving mobilization and financial skills training.
The study concluded that microfinance contributed immensely in financial performance of
SME’s. All the three constructs for microcredit used was found to have significant positive
relationship with performance of SME’s. The conclusion is supported by the conclusion of
58
Joeveer et al., (2006) concluded micro credit loan has a positive effect on financial performance
and this effect is statistically significant in predicting financial performance of SMEs. SMEs that
use microcredits will expand their business operations and experience significant increase in
their profitability. Also, According to Stepanyan, (2012) application of trade credit financing by
SMEs increases their business activities resulting in high level of profitability which lead to a
significant improvement in financial performance.
5.4 Recommendations.
On the basis of the foregoing conclusions, the study presents the following recommendations to
the SMEs business community, policy makers, lenders and scholars for review and
consideration. Investors and managers of SMEs should consider sources of business financing as
important determinants of financial performance.
SMEs should come together to form larger groups in order to access bigger commercial loans
from banks, microfinance institutions and other lenders which are cheaper to source as they carry
lower transaction costs and such costs are shared by SMEs in the group reducing its impact on
individual SME’s financial performance.
Government agencies engaged in availing funds to SMEs should avail such funds at the lowest
possible rate or otherwise provide them at zero interest rate for the SMEs to realize sustained and
robust financial performance.
The Tanzanian Government funding program for SMEs such as the Women enterprise Fund,
Youth Development Funds and the UTT Fund should be tailored to meet individual SME
borrower’s needs besides the current group affiliation focus in order to improve the ability and
accessibility of the funds to many needy business operators. The Tanzanian and County
Governments should step in to act as guarantors of commercial loans obtained by SMEs from
lenders as this will ensure that the SMEs experience sound and sustainable financial
performance.
The Tanzanian Government through the Central Bank of Tanzania should make it mandatory for
banks and lenders to revise their lending rates annually in tandem with Tanzania central bank
revisions and set a ceiling within which these rates should lie to make commercial loans cheaper
59
to SMEs borrowers. For instance the Central Bank could demand that no lender should add a risk
premium of more than 2.5% on top of the prevailing Tanzania Bankers’ Reference Rate
(TBRR) and violators of this rule are highly penalized.
The study recommends that microfinance service providers and policy development partners
could consider including a micro-insurance scheme in the micro finance package. Also extension
of the current loan grace period of one month would give the entrepreneurs adequate time to
invest the loan and use the returns from the investment for loan repayment. The government and
development partners could consider channeling more funds for micro financing programs to
bring on board many unemployed people that are currently out of reach of the programs as this
will help spur economic development and alleviate unemployment. The current study was a cross
sectional survey based on a small sample size taken from only Ilala municipal in Dar es salaam
Region Tanzania.
Also the study recommends microfinance institutions consider more entrepreneurs training to
their clients. The trainings should target SME entrepreneurs who do not have entrepreneurial
skills and should help the SMEs not only in the process of setting up new businesses, but also
acquaint them with skills to identify new marketing possibilities including familiarizing them on
the various statutory requirements such as Income Tax, VAT etc.
60
REFERENCES.
Abdinor Dahir Siyad(2013) the effect of microfinance institution lending on the growth
of small and medium enterprise in Somalia.
Asad, M., Haider, S. H., Akhtar, M. B., & Javaid, M. U. (2011). Human Resource
Practices andEnterprise Performance in Small and Medium Enterprises of
Pakistan. First International Conference on Contemporary Issues of Business
Ali, S. (2013). The small and medium enterprises and poverty in Pakistan: An empirical
analysis. European Journal of Business and Economics, 8 (2), 25
Akisimire, R (2010). Microfinance credit terms and performance of SMEs in UGANDA: A
case Study of SMEs in Mbarara Municipality. (Unpublished Master’s Thesis),
Makerere University.
Ahiawodzi, K. (2012). Access to Credit and Growth of Small and Medium Scale
Enterprises in the Municipality of Ghana, Department of Banking and Finance,
Published Thesis, University of Professional Studies, Accra, Ghana.
Ajose, S.(2010). SMEs and the tough terrain of Business, Personal Finance Entrepreneurship
Publication of the Nation Newspaper, Vol.5, No.1547,Oct.13, p 38.
Atieno, Rosemary (2009). Linkages, Access to Finance and the Performance of Small-Scale
Enterprises in Kenya Research Paper No. 2009/06.
Asad, M., Haider, S. H., Akhtar, M. B., & Javaid, M. U. (2011). Human Resource Practices and
Enterprise Performance in Small and Medium Enterprises of Pakistan. First
International Conference on Contemporary Issues Business (pp. 1-18). Lahore:
Comsats.
Asad, M.,Shariff, M. N., & AlEkam, J. (2016). Moderating effect of entrepreneurial
61
networking on the relationship between access to finance and performance
of SMEs. Paradigms, 10 (1), 1-16.
Bass, J & Henderson,K (2011). Innovations in Microfinance: The Microfinance
experience with Savings Mobilization. (p.10).Weidemann Associates,Inc.
Babajide, A. (2012). Effects of microfinance on micro and small enterprises (MSEs)
Growth inNigeria. Asian Economic and Financial Review, 2 (3), 463-477
Bembenutty, H.,White, M. C., & Vélez, M. R. (2016). Developing self-regulation of learning
and Teaching Skills among teacher candidates self-regulated learning and
Development in teacher Preparation Teaching Skills among Teacher Candidates (pp.
9- 28). Springer Netherlands. Enterprises Pakistan.
Berger and Udell (1998).The effect of bank mergers and acquisitions on small business lending.
Journal of Financial Economics 50.
Blumberg, B, Cooper D.R, & Schindler P.S. (2005). Business Research Methods, Mc Graw Hill:
Berkshire
CFEE (2011). Essential skills and financial literacy: Exploring the correlations, compatibility
and success factors. The Canadian Foundation for Economic Education Publication.
Cruz, C., Justo, R., & Castro, J. O. (2012). Does family employment enhance MSEs
performance?: Integrating social emotional wealth and family embeddedness
perspectives. Journal of Business Venturing, 27 (1), 62-76.
doi:10.1016/j.jbusvent.2010.07.002
Chittenden, F., Hall, G. and Hutchinson, P., 1996, ‘Small Firm Growth, Access to Capital
Markets and Financial Structure: Review of Issues and an Empirical Investigation’,
Small Business Economics, 8 (1), pp. 59- 67.
Chinelo Igwenagu(2016) Analysis of the Impact of Micro-Finance Banks on the
Performance of Small and Medium Scale Enterprises in Nigeria
Churchill, G. A.,& Iacobucci, D. (2005). Marketing Research: Methodological
62
Foundations (9th
ed.). Mason, Ohio: Thomson South-Western
Cooper, D.R. and Schindler, P.S. (2010).Business Research Methods .New York McGraw Hill
Gray, D, Saunders, M &Goregaokar, H (2012). Success in challenging times: Key
Lessons for UK SMEs. (p.8). Kingston Smith.
Cavana, R. Y. Delahaye, B. L., & Sekaran, U. (2001). Applied Business Research: Qualitative
and Quantitative Methods (1st ed.). US & Australia: John Wiley & Sons Australia, Ltd
Daniel Musimo Morobe (2015). Effect of microfinance services on the performance of
Small and medium enterprises in Kenya. Africa Journal of Business
Management.ISSN 1993- 8233.
DeVon et al. 2007A psychometric toolbox for testing validity and reliability. J Nurs Sch
Second Quarter 39, 155–164.
Eniola, A. A. (2015). The role of SME firm performance in Nigeria. Arabian Journal of Business
and Management Review, 3(12), 33-47. Retrieved March 30, 2014, from
www.arabianjbmr.com/pdfs/OM_VOL_3_(12).
Fidelis nduku Mutua(2017) The effect of financial trainings skills on financial perfomance to
SMEs in mauken County in Kenya.
Fredrick Kangala Nakhaima(2016) factors that affect financial performance of small and
medium enterprises in Kenya..
Gabriel Kamau Kung’u(2011) Factors influencing SMEs access to finance: A case study of
Westland Division,Kenya.
Gardial, D.I .(2004). Mobilizing savings key issues and good practices in savings promotion.
(p.3).Sweden: Swiss Agency for Development and Cooperation
Gaspar Alphonce Kapwanix(2014) the contribution of microfinance institutions on the economic
performance of small and medium enterprises in tanzania: the case of kisaccos-kitunda
and jiendeleze group-ketumbeine
63
Government Of Kenya (2007). Kenya Vision 2030: A Globally Competitive And Prosperous
Kenya. Nairobi, KE: Government Printers.
Holmes S. and Kent P.,(1991) “An empirical analysis of the financial structure of small and
Large Australian manufacturing enterprises”. The Journal of Small Busines Finance.
1(2): 141- 54.
Holmström’s and Hart’s (1987) .The theory of contract in T.F Bewley(Ed) Advances in
Economic theory: Fifth World congress of the econometric society 71-155 Cambridge
University press: Cambridge UK.
Holmes and Kent, 1991; Scherr et al., 1990). This suggests that small firm owners operate
without strong targeting an optimal debt: equity ratio and reveal a preference For those
financing options that minimize intrusion into their business.
Harrison Kyaro Song’e(2015) The Effect of Microfinance Services on Financial Performance of
Small Medium and Enterprises in Nairobi County.
International Labour Organisation (2013).Entrepreneurship, skills development, finance.
International Labour Organisation Publication.
ILO- Publication. Inter Trade Ireland. (2013). Access to finance for growth on the Island of
Ireland. (p.13) Inter Trade Island Publication.
Islam, M. A., Khan, M. A., Obaidullah, A. Z., & Alam, M. S. (2011). Effect of entrepreneur and
firm characteristics on the business success of small and medium enterprises (SMEs) in
Bangladesh. International Journal of Business and Management, 6 (3), 289-299.
Joeveer,K., Pissarides,F.,&Svejnar, J. (2006). Bank lending and performance of micro,
small and medium Sized enterprises (MSMEs): Evidence from Bulgaria,
Georgia, Russia and Ukraine. European Bank For Reconstruction and
Development.
Justina Monge(2016) effect of tinancial skills training to SMEs on financial perfomance
in Temeke, Tanzania.
64
Kausar, A. (2013). Factors effect microcredit’s demand in Pakistan. International Journal of
Academic Research in Accounting, Finance and Management Sciences, 3 (4), 11-17.
doi:10.6007/IJARAFMS/v3-i4/270
Johnson, S. Malkamaki, mM, & Wanjau, kuria (2005). Tackling the Frontiers of Microfinance in
Kenya: The role for Decentralized Services. Kenya National Bureau of Statistics,(2007 Karlan &
Valdivia, 2011, Idowv (2009)Collier (2009) Teaching Entrepreneurship: Impact of Business
Training on Microfinance Clients and Institutions”.
Kemei, M. K (2011).The relationship between micro finance services and the financial
Performance of small and medium Enterprises in Kisumu country.
Kenneth Arrow (1960) Mathematical models in the social sciences, 1959: Proceedings of
the First Stanford symposium Stanford, California: Stanford University Press
ISBN9780804700214, Price-quantity adjustments in multiple Markets With
rising Demands, pp. 3–15.
Kothari, C. (2004). Research Methodology, Methods and Techniques. New Delphi: International
P Limited. (n.d.)
KIT and IIRR. 2010. Value chain finance: Beyond microfinance for rural entrepreneurs. Royal
Tropical Institute, Amsterdam; and International Institute of Rural Reconstruction,
Khan, M. W., & Khalique, M. (2014). An overview of small and medium enterprises in
Malaysia and Pakistan: Past, present and future scenario. Business and
Management Horizons, (2). doi:http://dx.doi.org/10.5296/bmh.v2i2.5792
Koech, C.B. (2011). A survey of the financial constraints hindering growth of SMEs in Kenya:
The case of Kamukuji District in Nairobi County. Kenya. International Journal of
Business Administration, 3 (2).).
Kongolo, M. (2010) Job creation versus job shedding and the role of SMEs in economic
Development: African Journal of Business Management 4(11), 2288-2295.
65
Kurgat, P. (2007). The role of savings in Microfinance Institutions a case of KWFT.
(Unpublished Master’s Thesis), Solvay Brussels School of Economics and
Management
Ledgerwood. Joanna and Victoria White. 2006. Transforming Microfinance Institutions:
Providing Full Financial Services to the Poor. World Bank.
Lopez-Gracia, J. and C. Aybar-Arias, 2000, an Empirical Approach to the Financial Behavior of
Small and Medium Sized Companies, Small Business Economics 14(1), 55–63.
Madole, H. (2013). The impact of microfinance credit on the performance of SMEs in
Tanzania: A case study of national microfinance bank- Morogoro. Unpublished
MBA Dissertation, Mzumbe University.
Mary Wanjiku Mbugua(2010) impact of microfinance services on financial performance
of Small and micro Enterprises in Kenya
Morobe, D. M. (2015). The effect of microfinance loans on the financial performance of
small medium enterprises in Nairobi County (A research project). University of
Nairobi, Kenya.
Mugenda, A. &Mugenda, M. (2003).Research Methods: Quantitative and Qualitative
Approaches,ACTS.
Muhammad Yunus, Joseph Blatchford, M. Yunus, Social Business Entrepreneurs are the
solutions, Said School of Business, Oxford University, March 29-31
Muhammad Abrar-ul-haq(2015) Factors Affecting Small and Medium Enterprises (SMES)
Development in Pakistan.
Munjeyi Edmore(2017) Government policy aqnd regulation on SMEs perfomances in
Zimbabwe.
66
Muthoka, M. (2012). Effect of microfinance on financial sustainability of small and medium
enterprises in Nairobi East District, Unpublished MBA Project, University of
Nairobi
Mungai Doris wambui (2015) effect of financial training skills to SMEs on financial perfomance
in kajiando County in Kenya.
Mwangi, S. (2011). Factors affecting growth of micro and small enterprises funded by micro
Finance institutions in Thika town Kenya, A research paper.
Mwewa Naomi Mbithe(2013) the effects of microfinance services on the growth of small and
medium enterprises in machakos county,Kenya
Njeri, M. M. (2014). The Effects of Liquidity on Financial Performance of Deposit
Taking Microfinance Institutions in Kenya
Njeri, Mwangi Mary (2013) ; The effects of liquidity on financial performance of
deposit taking microfinance institutions in Kenya.
Myers (1984)"The Search for Optimal Capital Structure," Midland Corporate Finance
Journal, 1 (Spring 6-16).
McQuaid, R &Egdell, V (2011).Review of financial capability training resources. (p.2)
Employment Research Institute Edinburgh Napier University
Nargundkar Rajendra (2003), “Marketing Research: Text & Cases”, (2nd edition), Tata
McGraw Hill, 2003.
Nduba, J. M. (2010). An Evaluation Of Credit Assessments Done On SMES By Banks In Kenya.
Nairobi, KE: MBA Unpublished Project. University Of Nairobi.
Normah Mohd Aris. (2007). SMEs: Building Blocks for Economic Growth. Paper presented
inNational Statistics Conference 4-5 September 2006. Department of Statistics
67
Nkeobuna, J. (2012). Challenges of Bank Credit Among Small and Medium Enterprises (SMEs)
in Ghana, Published Thesis, Rhema University.
Oleka, C.O.Maduagwu, E.N., & Igwenagu, C.M. (2014). Analysis of the impact of microfinance
banks on the performance of small and medium scale enterprises in Nigeria. IJSAR
Journal of Management and Social Science, 1(2): 45-63.
Olutunla GT (2008). “Entrepreneurship for Economic Development,” Inaugural Lectures Series
27, Federal University of Technology, Akure, Nigeria. ISBN- 978-33757-5-X, 1-64
OECD (2013).Skills development and training in SMEs, local economic and employment
Development (LEED). OECD Publishing.
Orodha and Kombo ( 2002) Research Methodology. Oxford University Press, Nairobi
Paul John Salia (2016). Effects of microcredit on performance of women owned
microenterprises and household welfare in Arusha, Dar-essalaam and
Mwanza cities in Tanzania
Rael Nasimiyu Waliaula(2013)relationship between microcredit and the growth of small
and medium enterprises in Kenya
Rodrigues, R. G., Dinis, A., Paço, A. d., Ferreira, J., & Raposo, M. (2012). The effect of
Entrepreneurial training programme on entrepreneurial traits and intention
Of secondary student Entrepreneurship–Born, made and educated, 77-92
Sani, H., & Mohd-Khan, S. J. (2016). Effect of social capital, loan and saving on the growth of
SMEs in Nigeria: A proposed research framework. (Paper presented in 3rd Annual
ECoFI Symposium, December 18-19, 2016). Kedah, Malaysia
Sifujo E. Kisaka and Naomi M. Mwewa (2014) Effects of Micro-credit, Micro-savings and
Training on the Growth of Small and Medium Enterprises in Machakos
County in Kenya.
Shazida Jan Mohd Khan(2016)Microfinance training and the number of loans received
68
by SMEs An empirical evidence from emerging economy in Malaysia.
Sri sadhana Suryadevara (2017) the effect of microfinance credit on the performance of
small and medium enterprises in Nairobi,Kenya.
Sánchez, J. C. (2011). University training for entrepreneurial competencies: Its impact on
Intention of venture creation. International Entrepreneurship a Management Journal,
(2), 239-254. Doi: 10.1007/s11365-010-0156-x
Shahbaz, M. A., Javed, A., Dar, A., & Sattar, T. (2014). Performance measurement of Small and
Medium Enterprises (SMEs) in Pakistan. Aechives of Business Research, 2 (3)
Suanders and Thornhill (2007) Research Methodology for Business Students, Pearson Education
limited. Edinburgh.
Stieglitz, J. and A. Weiss, 1981, Credit Rationing in the Market with Imperfect
Information American Economic Review 71(3), 393–409.
Stepanyan (2012). The effect of interest rates on demand for credit by small medium
enterprises in Nairobi County. Unpublished MBA Thesis: University of Nairobi
Thio, R., Megananda, & Maulana, A. (2006). The impact of microfinance on micro and
small Enterprise’s performance and the improvement of their business
Opportunity
Tromp and Kombo (2014) Proposal and thesis writing, Paulines publication Africa, Kenya.
UWFT, (2005). Evaluation of micro and small enterprises in Uganda. Kampala: Uganda Women
Finance Trust.
Van Auken, H.E. and L. Neeley (1996). “Evidence of bootstrap financing among small start-up
Firms. Journal of Entrepreneurial and Small Business Finance, 5(3), 235- 249.
Waithanji, S.W (2014) “effects of microfinance credit on the financial performance of
small and Medium Enterprises in Kiambu County World Bank (2009).
69
Wario and Khalfan (2015) Principles, Methods and Practices of Social Science Research, Sumait
University Press, Zanzibar.
Wanambisi, A.N. (2013). Effects of microfinance on business performance: A survey of micro
and small enterprises in Kitale municipality, Kenya. International Journal of
Academic, Research in Business and Social Science, 3(7): 56-67.
Wanjohi, M. Anthony (2009). Challenges Facing SMEs in Kenya, Retrieved from
http://www.buzzle.com/articles/challenges-facing-smes-in-kenya.
Yeboah E.H (2010). Microfinance in rural Ghana: A view from below. (Unpublished PHD
Thesis),University of Birmingham.
Yunus (2007) Banker to the Poor: micro-lending and the battle against world poverty. New
York: Public Affairs hc. pp. 46–49. ISBN 978-1-58648-198-8.
Yunus, M. (2007). Creating a world without poverty, social business and the future of capitalism;
New York (NY); public Affairs.
Zahra Arasti (2011)Factors influencing SMEs access to finance: A case study of Westland
Division,Kenya
Zeituna Mustafa and Mercy Wachira(2017) Efferct on microsavings to financial perfomance of
SMEs in Kenya.
Zindiye, S (2008). An empirical investigation into the factors affecting the performance of Small
and Medium enterprises in the manufacturing sector of Harare, Zimbabwe. (p.78)
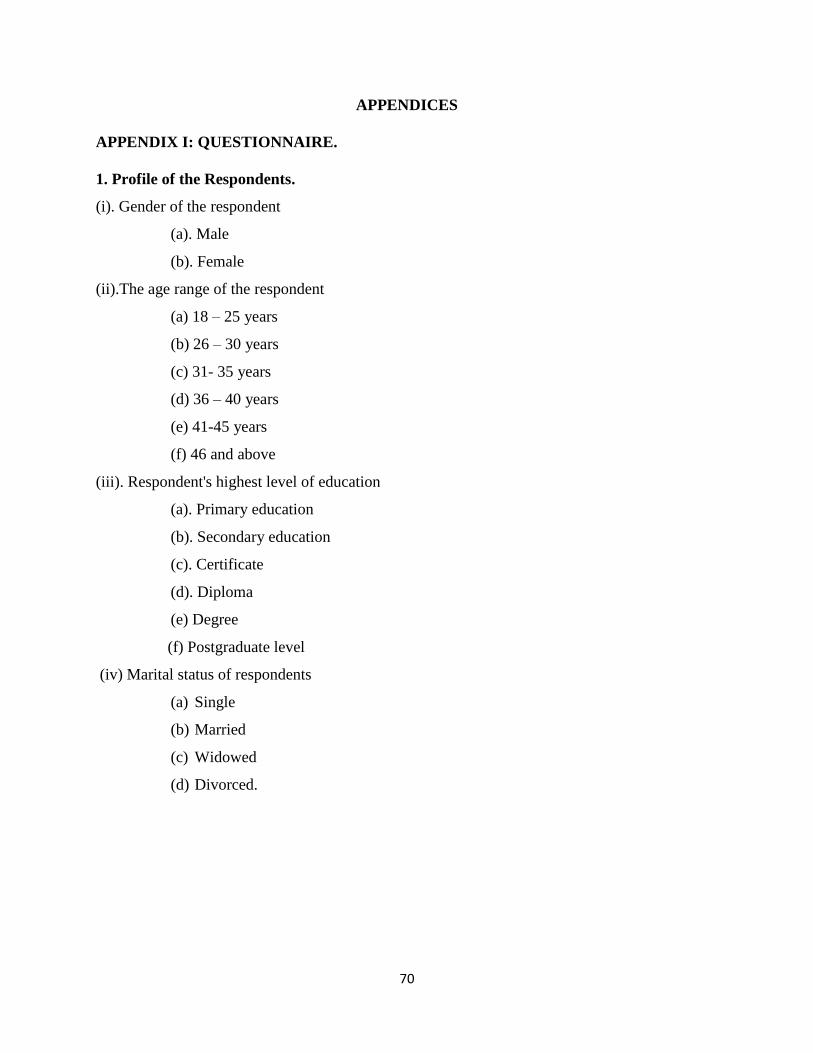
70
APPENDICES
APPENDIX I: QUESTIONNAIRE.
1. Profile of the Respondents.
(i). Gender of the respondent
(a). Male
(b). Female
(ii).The age range of the respondent
(a) 18 – 25 years
(b) 26 – 30 years
(c) 31- 35 years
(d) 36 – 40 years
(e) 41-45 years
(f) 46 and above
(iii). Respondent's highest level of education
(a). Primary education
(b). Secondary education
(c). Certificate
(d). Diploma
(e) Degree
(f) Postgraduate level
(iv) Marital status of respondents
(a) Single
(b) Married
(c) Widowed
(d) Divorced.
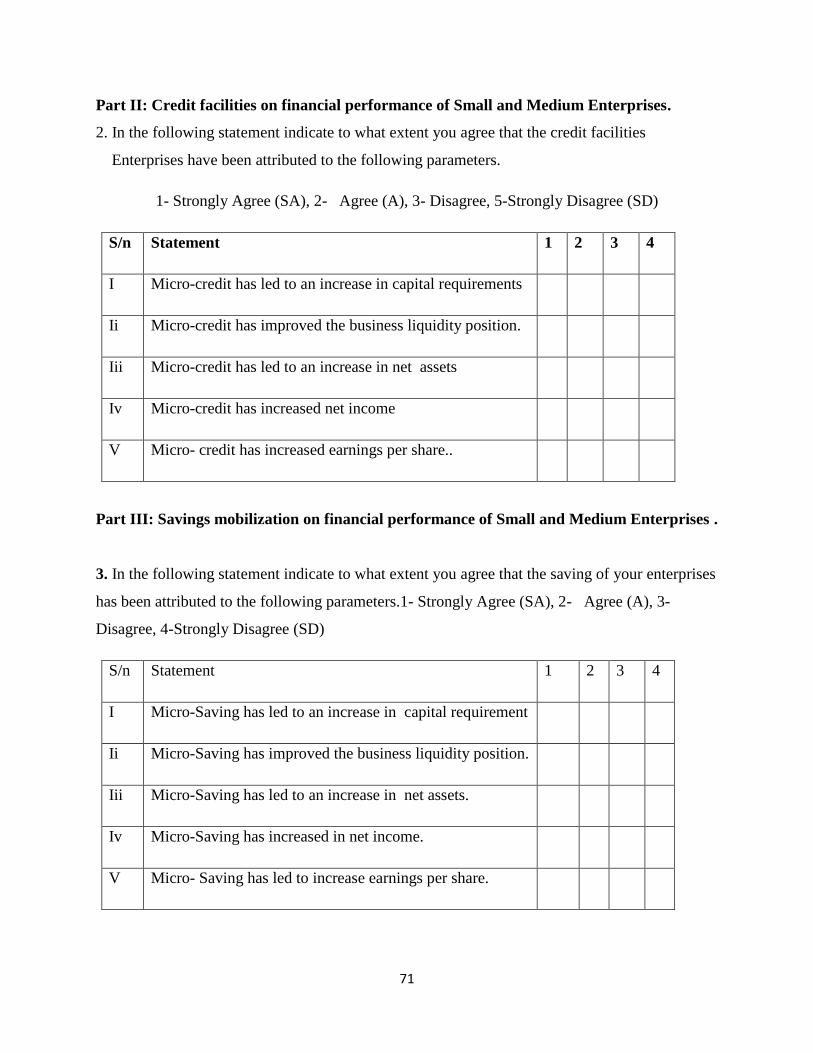
71
Part II: Credit facilities on financial performance of Small and Medium Enterprises.
2. In the following statement indicate to what extent you agree that the credit facilities
Enterprises have been attributed to the following parameters.
1- Strongly Agree (SA), 2- Agree (A), 3- Disagree, 5-Strongly Disagree (SD)
S/n Statement 1 2 3 4
I Micro-credit has led to an increase in capital requirements
Ii Micro-credit has improved the business liquidity position.
Iii Micro-credit has led to an increase in net assets
Iv Micro-credit has increased net income
V Micro- credit has increased earnings per share..
Part III: Savings mobilization on financial performance of Small and Medium Enterprises .
3. In the following statement indicate to what extent you agree that the saving of your enterprises
has been attributed to the following parameters.1- Strongly Agree (SA), 2- Agree (A), 3-
Disagree, 4-Strongly Disagree (SD)
S/n Statement 1 2 3 4
I Micro-Saving has led to an increase in capital requirement
Ii Micro-Saving has improved the business liquidity position.
Iii Micro-Saving has led to an increase in net assets.
Iv Micro-Saving has increased in net income.
V Micro- Saving has led to increase earnings per share.
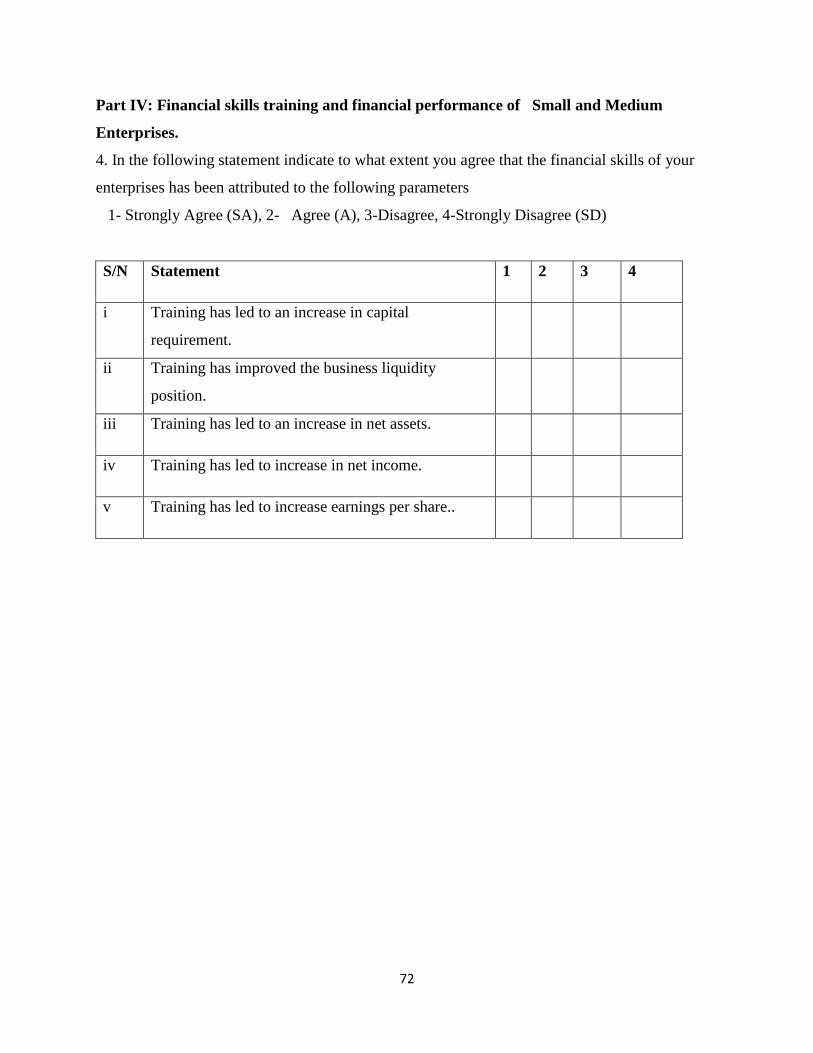
72
Part IV: Financial skills training and financial performance of Small and Medium
Enterprises.
4. In the following statement indicate to what extent you agree that the financial skills of your
enterprises has been attributed to the following parameters
1- Strongly Agree (SA), 2- Agree (A), 3-Disagree, 4-Strongly Disagree (SD)
S/N Statement 1 2 3 4
i Training has led to an increase in capital
requirement.
ii Training has improved the business liquidity
position.
iii Training has led to an increase in net assets.
iv Training has led to increase in net income.
v Training has led to increase earnings per share..
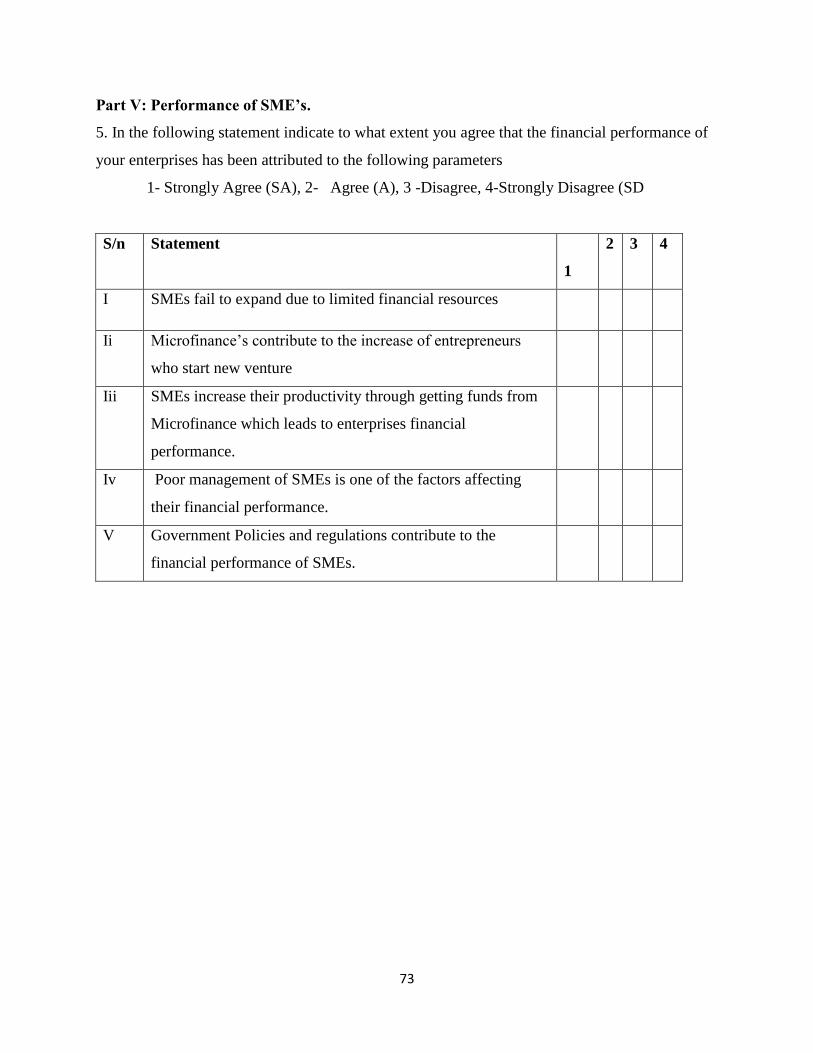
73
Part V: Performance of SME’s.
5. In the following statement indicate to what extent you agree that the financial performance of
your enterprises has been attributed to the following parameters
1- Strongly Agree (SA), 2- Agree (A), 3 -Disagree, 4-Strongly Disagree (SD
S/n Statement
1
2 3 4
I SMEs fail to expand due to limited financial resources
Ii Microfinance’s contribute to the increase of entrepreneurs
who start new venture
Iii SMEs increase their productivity through getting funds from
Microfinance which leads to enterprises financial
performance.
Iv Poor management of SMEs is one of the factors affecting
their financial performance.
V Government Policies and regulations contribute to the
financial performance of SMEs.

74
APPENDIX II: RESEARCH BUDGET.
ITEAM QUANTITY AMOUNT/PRICE
@
TOTAL COST
Reams 10 10000 100000
Note pad 20 3000 60000
Pencil and Pen 3 1000 3000
Ruler 1 500 500
Printing and
photocopying
2 200000 40000
Binding 2 150000 300000
Transport for
eight weeks
80@day 5000 400000
Lunch 8weeks 5000 40000
Total 903500
(Research2018)
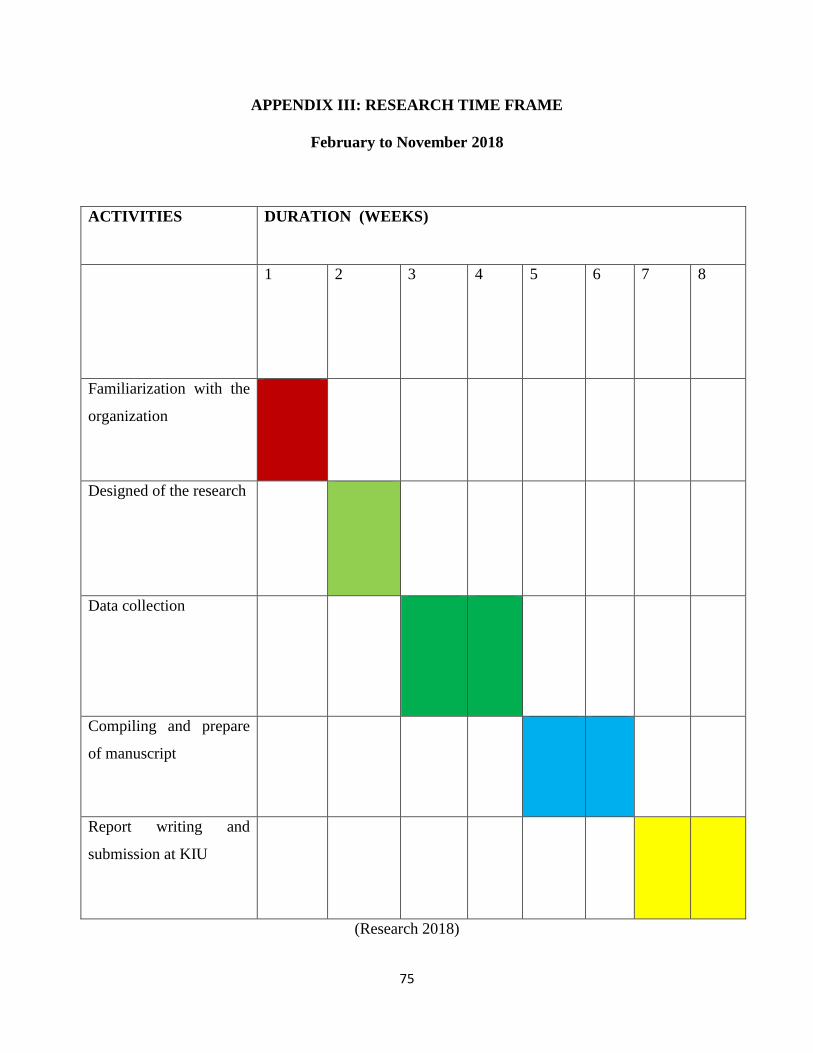
75
APPENDIX III: RESEARCH TIME FRAME
February to November 2018
ACTIVITIES DURATION (WEEKS)
1 2 3 4 5 6 7 8
Familiarization with the
organization
Designed of the research
Data collection
Compiling and prepare
of manuscript
Report writing and
submission at KIU
(Research 2018)