Embed Size (px)
Citation preview

T E C H N I C A L R E P O R T 0 2 2
2 0 0 5
Ministry of Forests Forest Science Program
Microclimate Studies in Silvicultural Systemson the Chilcotin Plateau of British Columbia The Itcha–Ilgachuz Project (1997–2003)

Ministry of Forests Forest Science Program
Robert M. Sagar, Michaela J. Waterhouse, and
Bill Chapman
Microclimate Studies in Silvicultural Systems
on the Chilcotin Plateau of British Columbia
The Itcha–Ilgachuz Project (1997–2003)
The use of trade, firm, or corporation names in this publication is for the information andconvenience of the reader. Such use does not constitute an official endorsement orapproval by the Government of British Columbia of any product or service to the exclusionof any others that may also be suitable. Contents of this report are presented for discussionpurposes only. Funding assistance does not imply endorsement of any statements or informationcontained herein by the Government of British Columbia.
CitationSagar, R.M., M.J. Waterhouse, and B. Chapman. 2005. Microclimate studies insilvicultural systems on the Chilcotin Plateau of British Columbia: the Itcha - Ilgachuzproject (1997-2003). B.C. Min. For., Res. Br., Victoria, B.C. Tech. Rep. 022.<http://www.for.gov.bc.ca/hfd/pubs/Docs/Tr/Tr022.htm>
Prepared byRobert M. Sagar, Biometeorology ConsultantBox 25, Tatlayoko Lake, BC
andMichaela J. WaterhouseB.C. Ministry of Forests, 200-640 Borland St., Williams Lake, BC
[email protected] (corresponding author)and Bill ChapmanB.C. Ministry of Forests, 200–640 Borland St., Williams Lake, BC
© 2005 Province of British Columbia
Copies of this report may be obtained, depending upon supply, from:Crown Publications521 Fort Street, Victoria, BC
(250) 386-4636http://www.crownpub.bc.ca
For more information on Forest Science Program publications, visit our Web site at:http://www.for.gov.bc.ca/hfd/pubs/index.htm.
Library and Archives Canada Cataloguing in Publication DataSagar, Robert M. (Robert Matthew), 1963-
Microclimate studies in silvicultural systems on the Chilcotin Plateau of BritishColumbia : the Itcha-Ilgachuz Project (1997-2003)
(Technical report ; 022)
Includes bibliographical references: p. 0-7726-5319-4
1. Forest microclimatology - British Columbia - Chilcotin Plateau. 2. Bioclimatology - British Columbia - Chilcotin Plateau. I. Waterhouse, M. J. II. Chapman, Bill, 1955- . II. British Columbia. Forest Science Program. III. Title. IV. Series: Technical report (British Columbia. Forest Science Program) ; 022.
390.6.3S27 2005 577.2'2'0971175 2005-960065-9

ABSTRACT
Group selection and irregular group shelterwood silvicultural systems are beingtested as options to conserve woodland caribou (Rangifer tarandus caribou)habitat. If successful, the systems will be applied within the very dry, cold Sub-Boreal Pine–Spruce (SBPSxc) and very dry, very cold Montane Spruce(MSxv) biogeoclimatic subzones, located on the high-elevation ChilcotinPlateau of west-central British Columbia. In these harsh growing environ-ments, partial cutting strongly influences the microclimate in terms of airand soil temperature, frost events, and snow-free dates.
To examine the magnitude of this influence, three pairs of climate stationswere set up in partial cuts and clearcuts, across a range of elevations, to com-pare microclimate conditions. Over the 7-year sample period, all blocks hadfrequent and sometimes severe (air temperature <-4°C) frosts throughoutthe growing season. As many as 58 frosts (<0°C) out of 76 nights during theperiod 1 June–15 August were recorded at one block. Minimum air tempera-tures of -12.4°C in June and -10.5°C in July were recorded. Partial cutssubstantially reduced the number and severity of frosts over clearcuts; how-ever, soil temperature and soil temperature index () were lower in partialcuts than the nearby clearcuts. Mean growing-season (15 cm) soil tempera-tures were less than 10°C at all locations, with clearcuts being 1.5–1.9°Cwarmer than nearby partial cuts. Snow-free dates were approximately 1month later at the highest-elevation site (1620 m) in comparison to the low-est site (1290 m). This lowered soil temperatures and shortened growingseasons at the highest site. Heavier snowpacks virtually eliminated soil freez-ing at the highest site.
The study also compared north edge, centre, and south edge microsites with-in one 30-m opening on each of three partial cuts. The north edge (southaspect) was the most favourable microsite for seedling growth in the partialcuts, with the highest soil temperatures, earlier snow-free dates, and moresolar irradiance. Low soil temperatures and light levels made the south edge(north aspect) the least favourable microsite.
Group selection and irregular shelterwoods may be applied to 181 000 haof northern caribou habitat. Results of this microclimate study show thatpartial cutting clearly modifies the growing environment for lichen, tree regeneration, mushrooms, and others species. The proposed systems showpromise in their ability to maintain caribou habitat and allow for some tim-ber harvesting.
iii

ACKNOWLEDGEMENTS
We would like to thank Bob Stathers, who did the original weather stationinstallations, and the subsequent maintenance and data reporting from 1997to 2000. We also acknowledge Teresa Newsome, who provided advice on theclimate station installation and summarization of the data, and Harold Arm-leder, who was instrumental in developing the harvesting systems and researchtrial.
The innovative timber harvesting tested in this study was made possiblethrough the support and co-operation of Riverside Forest Products Limited,B.C. Ministry of Forests—Chilcotin Forest District, and Clusko Logging En-terprises Limited. This project has been funded through Forest Renewal BC,and the B.C. Ministry of Forests under Experimental Project 1208. It is cur-rently funded through the B.C. Ministry of Forests Forest InnovationAccount ().
iv
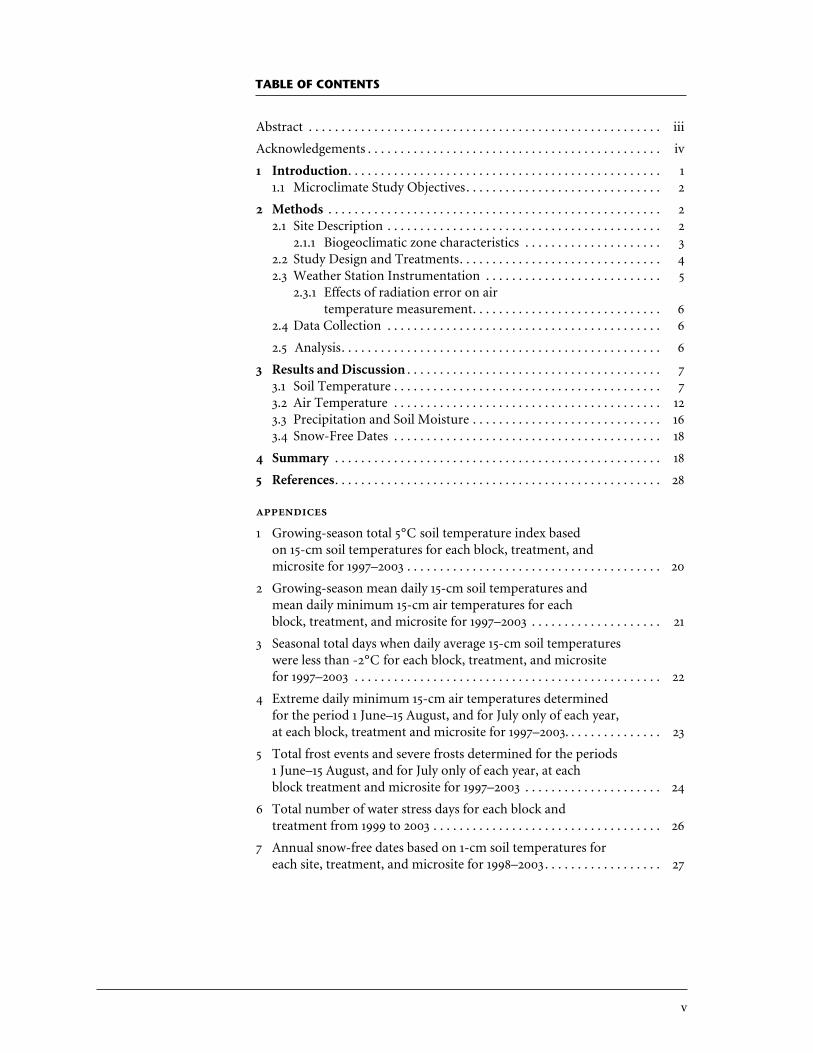
TABLE OF CONTENTS
v
Abstract . . . . . . . . . . . . . . . . . . . . . . . . . . . . . . . . . . . . . . . . . . . . . . . . . . . . . . iii
Acknowledgements . . . . . . . . . . . . . . . . . . . . . . . . . . . . . . . . . . . . . . . . . . . . . iv
1 Introduction. . . . . . . . . . . . . . . . . . . . . . . . . . . . . . . . . . . . . . . . . . . . . . . . 11.1 Microclimate Study Objectives. . . . . . . . . . . . . . . . . . . . . . . . . . . . . . 2
2 Methods . . . . . . . . . . . . . . . . . . . . . . . . . . . . . . . . . . . . . . . . . . . . . . . . . . . 22.1 Site Description . . . . . . . . . . . . . . . . . . . . . . . . . . . . . . . . . . . . . . . . . . 2
2.1.1 Biogeoclimatic zone characteristics . . . . . . . . . . . . . . . . . . . . . 32.2 Study Design and Treatments. . . . . . . . . . . . . . . . . . . . . . . . . . . . . . . 42.3 Weather Station Instrumentation . . . . . . . . . . . . . . . . . . . . . . . . . . . 5
2.3.1 Effects of radiation error on air temperature measurement. . . . . . . . . . . . . . . . . . . . . . . . . . . . . 6
2.4 Data Collection . . . . . . . . . . . . . . . . . . . . . . . . . . . . . . . . . . . . . . . . . . 6
2.5 Analysis. . . . . . . . . . . . . . . . . . . . . . . . . . . . . . . . . . . . . . . . . . . . . . . . . 6
3 Results and Discussion . . . . . . . . . . . . . . . . . . . . . . . . . . . . . . . . . . . . . . . 73.1 Soil Temperature . . . . . . . . . . . . . . . . . . . . . . . . . . . . . . . . . . . . . . . . . 73.2 Air Temperature . . . . . . . . . . . . . . . . . . . . . . . . . . . . . . . . . . . . . . . . . 123.3 Precipitation and Soil Moisture . . . . . . . . . . . . . . . . . . . . . . . . . . . . . 163.4 Snow-Free Dates . . . . . . . . . . . . . . . . . . . . . . . . . . . . . . . . . . . . . . . . . 18
4 Summary . . . . . . . . . . . . . . . . . . . . . . . . . . . . . . . . . . . . . . . . . . . . . . . . . . 18
5 References. . . . . . . . . . . . . . . . . . . . . . . . . . . . . . . . . . . . . . . . . . . . . . . . . . 28
1 Growing-season total 5°C soil temperature index based on 15-cm soil temperatures for each block, treatment, and microsite for 1997–2003 . . . . . . . . . . . . . . . . . . . . . . . . . . . . . . . . . . . . . . . 20
2 Growing-season mean daily 15-cm soil temperatures and mean daily minimum 15-cm air temperatures for each block, treatment, and microsite for 1997–2003 . . . . . . . . . . . . . . . . . . . . 21
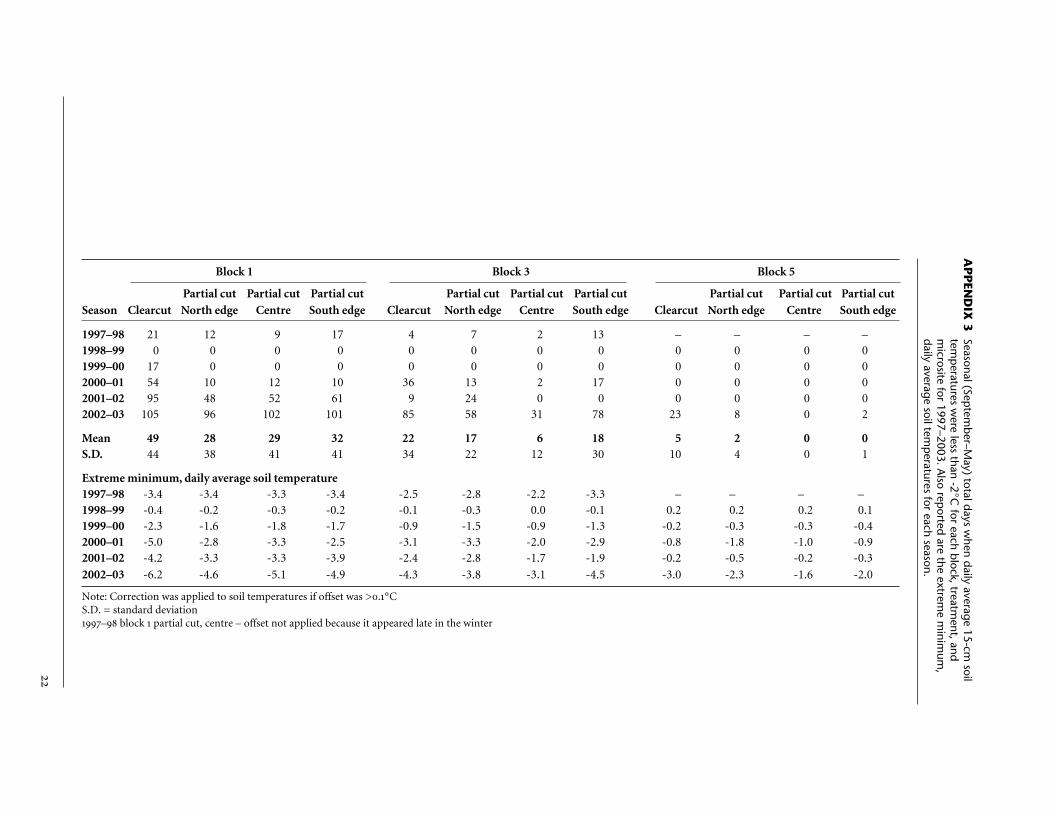
3 Seasonal total days when daily average 15-cm soil temperatures were less than -2°C for each block, treatment, and microsite for 1997–2003 . . . . . . . . . . . . . . . . . . . . . . . . . . . . . . . . . . . . . . . . . . . . . . . 22
4 Extreme daily minimum 15-cm air temperatures determined for the period 1 June–15 August, and for July only of each year, at each block, treatment and microsite for 1997–2003. . . . . . . . . . . . . . . 23
5 Total frost events and severe frosts determined for the periods 1 June–15 August, and for July only of each year, at each block treatment and microsite for 1997–2003 . . . . . . . . . . . . . . . . . . . . . 24
6 Total number of water stress days for each block andtreatment from 1999 to 2003 . . . . . . . . . . . . . . . . . . . . . . . . . . . . . . . . . . . 26
7 Annual snow-free dates based on 1-cm soil temperatures for each site, treatment, and microsite for 1998–2003. . . . . . . . . . . . . . . . . . 27

vi
1 Comparison of climate characteristics of subzones for study sites and other regional subzones . . . . . . . . . . . . . . . . . . . . . . . . . . 3
2 Mean growing-season 5°C , based on daily average 15 cm soil temperature, for the period 1999–2003 . . . . . . . . . . . . . . . . . . 8
3 Mean growing-season 15-cm soil temperature for the period 1999–2003 . . . . . . . . . . . . . . . . . . . . . . . . . . . . . . . . . . . . . . . . . . . . 8
4 Mean growing-season minimum 15-cm air temperature for the period 1999–2003 . . . . . . . . . . . . . . . . . . . . . . . . . . . . . . . . . . . . . . . . . . . . 13
5 Mean number of frost events determined using the 76-day period, 1 June to August 15, each year from 1999 to 2003 . . . . . . . . . . . . 15
6 Total growing-season rainfall at each block for the years 2000–2003 . . . . . . . . . . . . . . . . . . . . . . . . . . . . . . . . . . . . . . . . . . . . . 16
7 Mean snow-free date for each block, treatment, and microsite from 1998 to 2003. . . . . . . . . . . . . . . . . . . . . . . . . . . . . . . . . . . . 18
1 Map showing locations of blocks 1–5, in the vicinity of Satah Mountain . . . . . . . . . . . . . . . . . . . . . . . . . . . . . . . . . . . . . . . . . . . . . 2
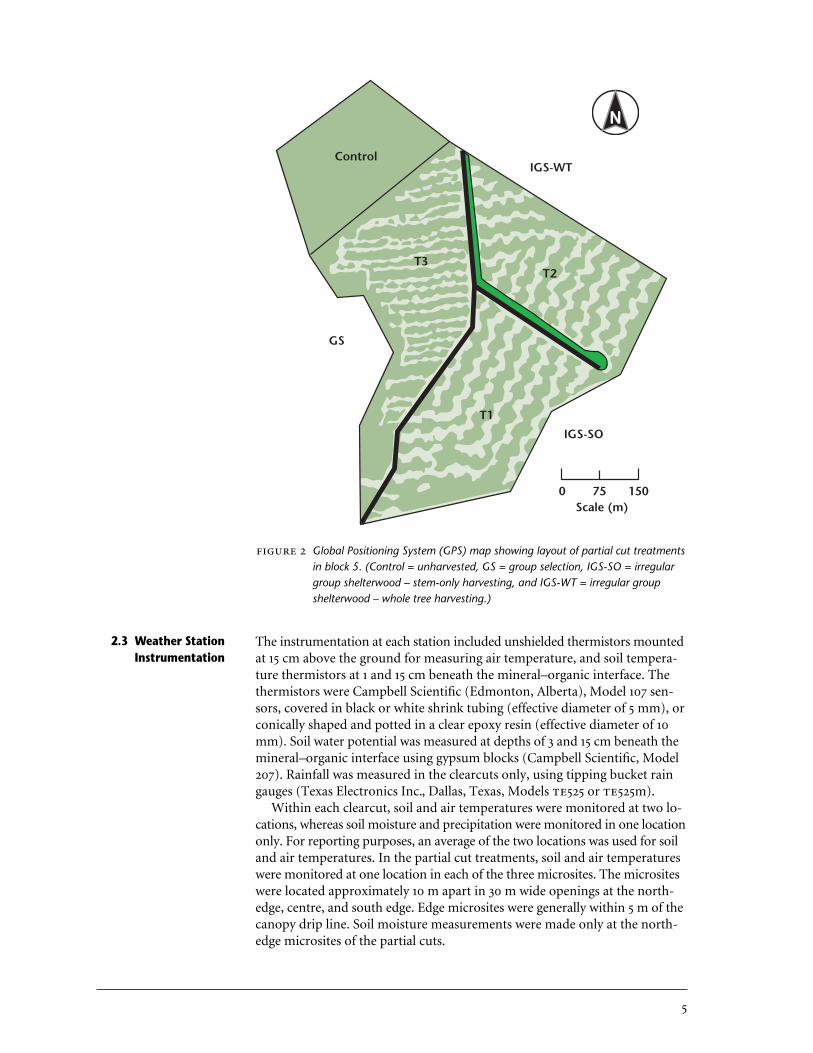
2 Global Positioning System map showing layout of partial cut treatments in block 5 . . . . . . . . . . . . . . . . . . . . . . . . . . . . . . . . . . . . . . 5
3 Example growing season showing plots comparing daily average 15-cm soil temperatures in the clearcuts with those in the partial cut microsites for each block . . . . . . . . . . . . . . . . . . . . . . . 9
4 Example year showing differences among daily average 15 cm soil temperature at the partial cut treatments for each block over the period October 2000–October 2001. . . . . . . . . . . . . . . . . . . . . . 10
5 Comparison of daily average 15 cm soil temperatures at the block 1 clearcut for a heavy- and a light-snow winter . . . . . . . . . . . . . . . 11
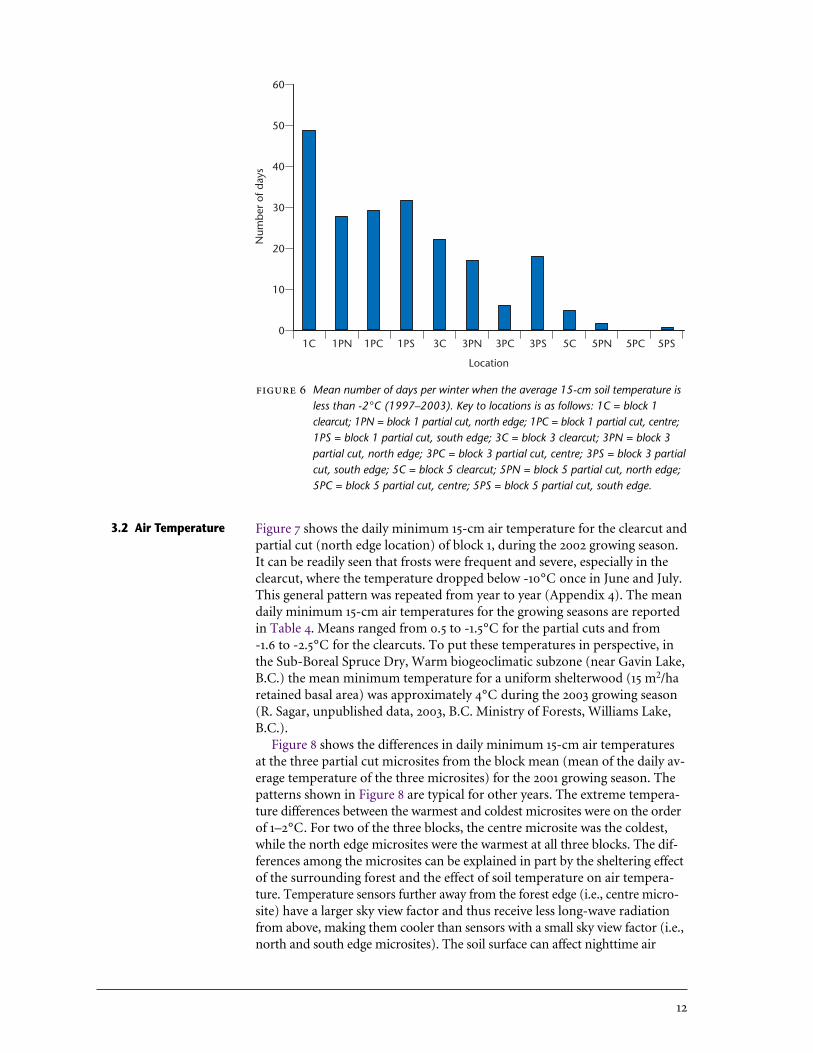
6 Mean number of days per winter when the average 15-cm soil temperature is less than -2°C . . . . . . . . . . . . . . . . . . . . . . . . . . . . . . 12
7 Comparison of daily minimum 15-cm air temperature at the clearcut and north edge microsites for block 1 during the 2002 growing season. . . . . . . . . . . . . . . . . . . . . . . . . . . . . . . . . . . . . . . . . . 13
8 Differences among daily minimum 15-cm air temperature at the partial cut treatments for each block over the period October 2000–October 2001 . . . . . . . . . . . . . . . . . . . . . . . . . . . . . . . . . . . 14
9 Total number of severe frosts at block 5, for the period 1 June–15 August during the 2002 growing season. . . . . . . . . . . . . . . . . . 15
10 Mean annual number of soil water stress days for each block and treatment . . . . . . . . . . . . . . . . . . . . . . . . . . . . . . . . . . . . . . . . . . 17
11 Growing-season soil water potential at the block 1 partial cut during 2001 . . . . . . . . . . . . . . . . . . . . . . . . . . . . . . . . . . . . . . . . . . . . . . 17
1 INTRODUCTION
Lodgepole pine (Pinus contorta) forests in the very dry, very cold MontaneSpruce (MSxv) and very dry, cold Sub-Boreal Pine – Spruce (SBPSxc)biogeoclimatic subzones represent a significant portion of the forest in theChilcotin. Many of these forests are important habitat for northern caribou, anecotype of woodland caribou (Rangifer tarandus caribou). Within the Cariboo– Chilcotin Land Use Planning Area, northern caribou are considered to be akey management species, and under the federal Species at Risk Act they areconsidered threatened. In winter, caribou prefer mature lodgepole pineforests with large amounts of terrestrial lichen and low snow depths that alloweasy cratering. They also inhabit forests where arboreal lichens are concen-trated. Arboreal and terrestrial lichens are consumed in nearly equal amountsthroughout the winter (Cichowski 1989).
Clearcutting is the most commonly used silvicultural system in lodgepolepine forests. This silvicultural system removes the arboreal lichen and dam-ages terrestrial lichen through physical disturbance, slash loading, lost substrate,and increased solar radiation (Miège et al. 2001). Arboreal lichen dispersal isslow and it may take many decades before a regenerating stand in a clearcutdevelops the canopy architecture and microclimate necessary to support lichenin amounts comparable to old stands (Stevenson et al. 2001). For these rea-sons, silvicultural systems based on partial cutting are being tested. They canpotentially reduce the impact of harvesting on caribou habitat, including theeffects on important lichen forage species.
Any harvesting of timber affects microclimate by increasing solar irradianceat the soil surface, and warming the soil (Chen et al. 1993; Bhatti et al. 2000).Harvesting increases the receipt of precipitation at the soil surface by elimi-nating interception of rain and snow by the forest canopy. Also, harvestingcan cause an increase in damaging summer frost events due to the loss of theforest sheltering effect (decreased long-wave radiation at the surface). Undera forest canopy, a portion of the long-wave radiation emitted from the sur-face is absorbed and re-radiated toward the surface and not lost to the opensky.
The temperature of both the air and soil are important environmental fac-tors that could affect the survival and growth of trees and lichen. Summerfrost has been identified as a serious problem in some high-elevation tree plan-tations (Stathers 1989; Steen et al. 1990). The physiological effects of frost onseedlings have been studied (Delucia and Smith 1987; Lundmark and Hall-gren 1987). Dang et al. (1992) found that the combination of a hard frost andsubsequent exposure to high levels of direct solar irradiance on a seedling thenext day is especially damaging. Conversely, shading after the frost enhancesrecovery by limiting excess trapped light energy within needles. Low soiltemperature affects the growth and vigour of seedlings by hampering rootuptake of water and nutrients, thereby decreasing the seedling’s ability to pho-tosynthesize (Delucia 1986). Lajzerowicz et al. (2004) showed that growthand photosynthesis in Engelmann spruce and subalpine fir seedlings decreasedas soil temperature decreased, within the range of 5–15°C.
In frost-prone areas, Stathers (1989) suggests that partial cutting will im-prove the success of planted and natural regeneration compared to clearcuttingbecause of the sheltering effects of the retained forest. It has been found thatclearcut patch size (and therefore proximity to the uncut forest) greatly

affects nighttime minimum air temperatures near the ground (Pettersen1993; Groot and Carlson 1996). Frost damage was found to be greatest near thecentre of the larger openings in the latter study. Jordan and Smith (1995) alsodemonstrated this sheltering effect in a subalpine meadow.
The objective of this study was to collect microclimate data to help explain par-tial cut versus clearcut differences in survival and growth of tree regenerationand lichens, and abundance of commercial mushrooms (black morel and pine).Specifically, the study will compare: (1) the clearcut and partial cut environ-ments; (2) the north edge, centre, and south edge microsites in small partialcut openings (30 m in diameter); and (3) three blocks located along an eleva-tional gradient from the SBPSxc to the MSxv.
2 METHODS
The study area is located about 110 km northwest of Alexis Creek, B.C., onthe Chilcotin Plateau, in west-central British Columbia. The five study blocksin the main trial are situated within 30 km of Satah Mountain (52° 28' N, 124° 43' W). For the microclimate study, three of the five blocks were selected tocover the elevational range of the study area (1290–1620 m) (Figure 1) and twobiogeoclimatic zones. Block 1 (1290 m) is in the Sub-Boreal Pine–Spruce VeryDry Cold (SBPSxc), while blocks 3 (1420 m) and 5 (1620 m) are in the Mon-tane Spruce Very Dry Very Cold (MSxv) biogeoclimatic subzone. The blocksare spread from east to west over about a 30 km distance. The clearcuts(blocks 1, 3 and 5) and partial cuts (blocks 1 and 3) are flat, while the block 5partial cut is on an east aspect with 7–20% slope. The forest canopy through-out the study area is almost exclusively lodgepole pine. The stands areeven-aged, ranging from 160 to 250 years old. Soils within all blocks are Orthic Dystric Brunisols with a sandy loam texture on glacial till parent
2.1 Site Description
1.1 MicroclimateStudy Objectives
SatahMountain
1915 m
Satah Mountain Road
SatahCamp
To Puntzi Lakeand Chilanko Forks
P-Road
Creek
Palmer
5
4
3
2 1
PunkutlaenkutLake
0 5 10kilometres
Map showing locations of blocks 1–5, in the vicinity of Satah Mountain.

material. In the SBPSxc, the forest floor is mostly less than 3.0 cm thick,while in the MSxv it is 3.5–6.5 cm.
The MSxv subzone occurs at middle to upper elevations surrounding theItcha and Ilgachuz Mountains and at mid elevations on the eastern slopes of theCoast Mountains. In the MSxv study blocks, the Lodgepole Pine–Grouseberry–Feathermoss site series (MSxv/01) is predominant. Here, understory vegetationis dominated by low-growing forbs, dwarf shrubs, mosses, and lichens.Crowberry (Empetrum nigrum) and grouseberry (Vaccinium scoparium) arecharacteristic species, and a nearly continuous cover of mosses (Pleuroziumschreberi, Ptilium crista-castrensis, and Dicranum spp.) is present (Steen andCoupé 1997).
The SBPSxc subzone occurs at elevations below the MSxv subzone, alongthe inside of the Coast Mountains, and extends as far north as the RainbowRange. In block 1, the predominant site series is Lodgepole Pine–Kinnikinnick–Feathermoss (SBPSxc/01). Understory vegetation is low-growing and domi-nated by kinnikinnick (Arctostaphylos uva-ursi), pinegrass (Calamagrostisrubescens), and a rich variety of lichens, primarily Cladonia species (Steenand Coupé 1997).
2.1.1 Biogeoclimatic zone characteristics Table 1 shows some general cli-mate characteristics of the SBPSxc, MSxv, and adjoining biogeoclimatic units(Reynolds 1997). The only climate data available for the MSxv unit are for themean annual precipitation (). The IDFdk4, SBPSxc, and MSxv unitscomprise an elevational transect starting southwest of Satah Mountain in theChilanko River valley, at approximately 915 m, and rising to 1640 m in thevicinity of Satah Mountain. Along this transect, climatic conditions becomewetter and cooler with increasing elevation. The in the IDFdk4 is 362mm and the mean annual temperature () is 3.2°C. Moving upwards inelevation to the SBPSxc unit, increases to 413 mm and falls to1.1°C. Precipitation increases still further to 563 mm in the MSxv unit, andalthough no temperature data are available for the MSxv unit, we can
Comparison of climate characteristics of biogeoclimatic units for study sites and other regional units (data fromReynolds 1997). A key to the heading abbreviations is listed below.
Unit ELE MAP MSP MWP MAT MTCM MTWM T>10 T<0 NFFD FFP
MSxv 1481.0 563.0 SBPSxc 1168.6 413.2 189.9 221.5 1.1 -11.4 11.2 2 5 87 14 SBPSmc 968.0 176.1 0.7 -12.9 10.9 2 5 SBPSdc 823.2 507.8 275.1 232.7 1.9 -13.5 13.9 3 5 152 61 IDFdk4 1065.5 362.4 169.4 199.4 3.2 -9.3 13.5 3 5 132 46
SBSmc2 926.7 574.7 227.9 354.0 1.5 -12.6 12.3 3 5 151 116
Key to column headingsELE ElevationMAP Mean Annual Precipitation (mm)MSP Mean Summer Precipitation May–September (mm)MWP Mean Winter Precipitation October–April (mm)MAT Mean Annual Temperature (oC)MTCM Mean Temperature Coldest Month (oC)MTWM Mean Temperature Warmest Month (oC)T>10 Number of Months with Mean Temperature >10oCT<0 Number of Months with Mean Temperature <0 oCNFFD Number of Frost-Free DaysFFP Frost-Free Period

infer that they would be lower than for the SBPSxc; probably less than 0°C.The low annual precipitation of the study area reflects the position of SatahMountain in the rain shadow of the Coast Range. For comparison, BellaCoola, (approximately 100 km to the west of Satah Mountain) on the wind-ward side of the Coast Range, has a of 1614 mm.
The number of frost-free days () and frost-free period () decreasemarkedly when moving uphill from the IDFdk4 to the SBPSxc. The de-creases from 46 days in the IDFdk4 to only 14 days in the SBPSxc. Data pre-sented later in this publication will show that a conventional frost-free periodmay not exist at our study sites.
The main research trial was set up based on a randomized block design. Thefive blocks were selected from a number of operational blocks scheduled andapproved for harvesting. Each study block (60–80 ha) was split into four treat-ment units (15–20 ha each) and randomly assigned a silvicultural system:
• no harvest;• irregular group shelterwood system with stem-only harvesting
(- or 1);• irregular group shelterwood system with whole tree harvesting
(- or 2); or• group selection with whole tree harvesting ( or 3).
The irregular group shelterwood systems target a 50% area removal every70 years, using openings of about 30 m in diameter. This system is intendedfor terrestrial lichen sites because the residual forest should provide a shelter-ing effect for the lichen in the openings. The group selection system, developedfor arboreal lichen sites, is based on 33% area removal every 80 years, and open-ing sizes 15 m in diameter. A diagram of these treatment units within block 5is shown in Figure 2.
For this study, only the - (2) treatments from blocks 1, 3, and 5were utilized. Harvesting on the trial blocks was completed in April 1996. Inboth irregular group shelterwood () treatments, the area cut averages 39%,gaps are up to 30 m wide, and skidtrails are 3–4 m wide. One gap from eachblock was randomly selected for microclimate monitoring.
Clearcuts were not part of the original study design but were added to pro-vide comparisons to partial cuts for the planted stock, natural regeneration,lichen, and microclimate studies. Each clearcut is large (>30 ha), and locatedadjacent to blocks 1 and 3, but about 1.2 km distant from block 5. Clearcutspaired with blocks 1 and 5 were harvested within 6 months of the trial. Theclearcut paired with block 3 was cut 1.5 years prior to the partial cuts. The soiltype, elevation, slope, and aspect of the clearcuts are very similar to the par-tial cuts, except at block 5. The climate station in the paired clearcut for block5 is on a slight north-facing slope (2%), while the one in the partial cut is onan east-facing slope (8%). All the clearcut microclimate stations were locatedat least 50 m from the forest edge.
2.2 Study Design andTreatments
The instrumentation at each station included unshielded thermistors mountedat 15 cm above the ground for measuring air temperature, and soil tempera-ture thermistors at 1 and 15 cm beneath the mineral–organic interface. Thethermistors were Campbell Scientific (Edmonton, Alberta), Model 107 sen-sors, covered in black or white shrink tubing (effective diameter of 5 mm), orconically shaped and potted in a clear epoxy resin (effective diameter of 10mm). Soil water potential was measured at depths of 3 and 15 cm beneath themineral–organic interface using gypsum blocks (Campbell Scientific, Model207). Rainfall was measured in the clearcuts only, using tipping bucket raingauges (Texas Electronics Inc., Dallas, Texas, Models 525 or 525m).
Within each clearcut, soil and air temperatures were monitored at two lo-cations, whereas soil moisture and precipitation were monitored in one locationonly. For reporting purposes, an average of the two locations was used for soiland air temperatures. In the partial cut treatments, soil and air temperatureswere monitored at one location in each of the three microsites. The micrositeswere located approximately 10 m apart in 30 m wide openings at the north-edge, centre, and south edge. Edge microsites were generally within 5 m of thecanopy drip line. Soil moisture measurements were made only at the north-edge microsites of the partial cuts.
2.3 Weather StationInstrumentation
Control
T3T2
T1
IGS-SO
Scale (m)
GS
IGS-WT
0 75 150
Global Positioning System (GPS) map showing layout of partial cut treatmentsin block 5. (Control = unharvested, GS = group selection, IGS-SO = irregulargroup shelterwood – stem-only harvesting, and IGS-WT = irregular groupshelterwood – whole tree harvesting.)
Monitoring of microclimate began at blocks 1 and 3 in 1997, and in 1998 atblock 5. Soil moisture monitoring was added to the blocks in June 1999, whilerain gauges were added to the clearcuts in June 2000.
2.3.1 Effects of radiation error on air temperature measurement The basicpremise of air temperature measurement is to put a sensor in the environmentto be measured, where it will equilibrate with the temperature of the air inthat environment through convective and conductive heat transfer. Howev-er, the unshielded thermistors used to measure air temperature are subject tosignificant radiation errors. Radiation error is a measurement error intro-duced into air temperature measurements when convective heat transfer toor from the sensor is unable to equilibrate sensor temperature with air tem-perature due to radiative loading. The magnitude of radiation error isdependent on sensor size, shape, and colour, as well as windspeed and radia-tive loading on the sensor. Generally speaking, radiation error increases withsensor size due to less effective convective heat transfer for larger objects. Radia-tion error is typically positive during the day (sensor temperature elevatedabove air temperature) and negative at night.
During the summer of 2003, an experiment was carried out to assess themagnitudes of radiation errors for the unshielded thermistors (R. Sagar, un-published data, 2003, B.C. Ministry of Forests, Williams Lake, B.C.). Fine wirethermocouples (30 [American wire guage] twisted and soldered, withan effective diameter of 0.5 mm) were installed at each weather station. Dueto their small diameter, radiation error is small for fine wire thermocouples(s). The results showed that radiation errors in the range of +6 to 8°Cwere typical for the black and conical epoxy thermistors during the day. Day-time errors for the white, shrink tube thermistor averaged only 1.2°C.Nighttime errors averaged about -0.5°C for all thermistor types. Due to thehigh daytime errors, daily maximum and mean air temperature data were notutilized in the data summaries.
Campbell Scientific, Model 10 dataloggers recorded sensor outputs at eachstation. Dataloggers were powered by two 6 lantern batteries wired in seriesto produce 12, and housed in watertight fiberglass enclosures. The batterieswere replaced in the spring and fall of each year. The dataloggers recorded allsensor outputs once every 5 minutes. These measurements were processed bythe datalogger to produce daily maximums, minimums, and averages for allair and soil temperature sensors. For the rain gauges, the datalogger outputwas daily total rainfall. Since soil moisture does not vary much diurnally, dailysamples were output. Data were downloaded to a laptop computer during twoor three annual site maintenance visits.
Analysis focused on growing-season microclimate conditions at the blocks.In order to standardize comparisons among different years and blocks, thegrowing season was defined as the period from 1 May to 30 September for thepurposes of calculating soil temperature index (), mean soil temperature,and mean minimum air temperature. For the purpose of looking at the fre-quency and severity of summer frost events, it was decided to use the periodof 1 June–15 August, when the current year’s growth on seedlings is most sen-sitive to frost damage, rather than the entire growing season.
Soil temperature index is calculated in the same way as growing degreedays. The for a particular day would be the total degrees that the daily
2.5 Analysis
2.4 Data Collection

average soil temperature exceeds a threshold temperature. For example, if a5°C threshold was set, and the daily average temperature was 7°C, then the equals 2 for the day. The temperature threshold used in this analysis was5°C. The name has been used here to avoid the assumption that theindex is related to seedling growth and phenology. The integrates suchfactors as solar irradiance, near-ground air temperature, snow-free season,and soil physical properties. These factors may affect seedling growth andsurvival; however, no growth effect should be inferred based on the alone.
Soil water stress was defined to be occurring when the soil water potential ata depth of 15 cm was less than -1.0 MPa. Previous research has found “perma-nent wilting points” for many plants to range between -1.0 and -5.0 MPa, withthe often quoted value for field crops being -1.5 MPa (Richards and Wadleigh1952). In this study, a day when soil water potential was measured at less than-1.0 MPa was identified as a soil water stress day. The number of these dayswas totalled for each growing season and site.
The snow-free date was determined for each year and site by observing dailyminimum and maximum 1-cm soil temperature. The 1-cm soil temperaturesensors are close enough to the bottom of the snowpack that daily minimumand maximum temperatures measure very close to 0°C during the snowmeltperiod, when the soil is being flushed with snowmelt water. Snowmelt finishedwhen the daily maximum 1-cm soil temperature first rose above 0.5°C. Insome cases, snow cover was temporarily re-established by late snowfalls for afew days.
Soil freezing can potentially interfere with root function or it can damageroots and reduce their ability to take up water, which leads to winter desicca-tion of the needles. To measure the prevalence of soil freezing, the total numberof days, per winter season, when the 15-cm soil temperature dropped below -2°C (soil freeze days) were determined.
3 RESULTS AND DISCUSSION
Mean accumulated 5°C soil temperature index () at each block, treatment,and microsite are shown in Table 2 (see Appendix 1 for full dataset). Clearcutsaccumulated 25–35% more than the warmest partial cut microsite, whichwas always the north edge locations. When compared with the average overall three partial cut microsites, the clearcuts accumulated 38–49% more .The microsites measured at the south edges of the gaps in the partial cuts hadthe lowest seasonal totals of in every case. These trends can be explainedby larger solar input to the soil surface in the clearcuts and north edge loca-tions, given similar surface compositions. These results are consistent withthose for clearcuts and partial cuts in the Engelmann Spruce–Subalpine firforests northeast of Likely, B.C., where accumulation was much higher inclearcuts than in 20 m diameter openings (Stathers et al. 2001). The growing-season totals decreased with increasing elevation, as evidenced by theclearcut values of 759, 748, and 581 for blocks 1, 3, and 5, respectively. Thiswas most likely caused by later snow-free dates at the higher-elevation sites,causing a delay in soil warming; however, lower mean air temperatures, wet-ter soils, and greater cloud cover as elevation increases may also contribute to lower s.
3.1 Soil Temperature
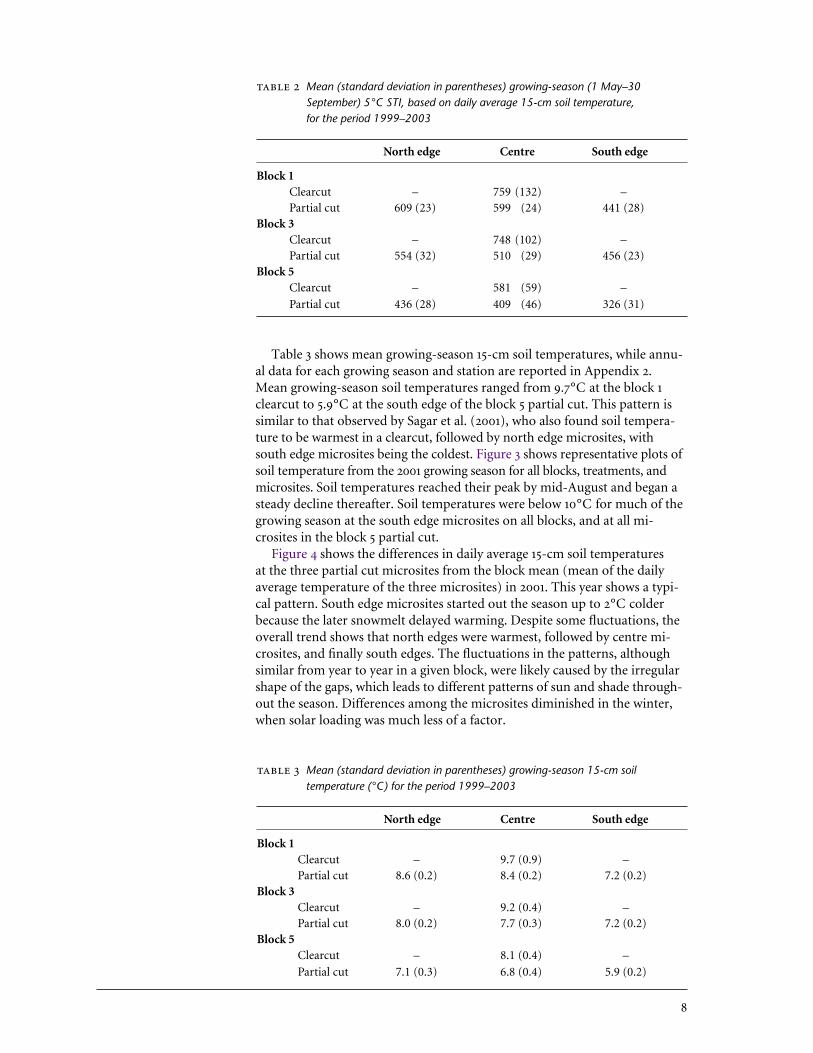
Table 3 shows mean growing-season 15-cm soil temperatures, while annu-al data for each growing season and station are reported in Appendix 2.Mean growing-season soil temperatures ranged from 9.7°C at the block 1clearcut to 5.9°C at the south edge of the block 5 partial cut. This pattern issimilar to that observed by Sagar et al. (2001), who also found soil tempera-ture to be warmest in a clearcut, followed by north edge microsites, withsouth edge microsites being the coldest. Figure 3 shows representative plots ofsoil temperature from the 2001 growing season for all blocks, treatments, andmicrosites. Soil temperatures reached their peak by mid-August and began asteady decline thereafter. Soil temperatures were below 10°C for much of thegrowing season at the south edge microsites on all blocks, and at all mi-crosites in the block 5 partial cut.
Figure 4 shows the differences in daily average 15-cm soil temperatures at the three partial cut microsites from the block mean (mean of the daily average temperature of the three microsites) in 2001. This year shows a typi-cal pattern. South edge microsites started out the season up to 2°C colderbecause the later snowmelt delayed warming. Despite some fluctuations, theoverall trend shows that north edges were warmest, followed by centre mi-crosites, and finally south edges. The fluctuations in the patterns, althoughsimilar from year to year in a given block, were likely caused by the irregularshape of the gaps, which leads to different patterns of sun and shade through-out the season. Differences among the microsites diminished in the winter,when solar loading was much less of a factor.
Mean (standard deviation in parentheses) growing-season 15-cm soiltemperature (°C) for the period 1999–2003
North edge Centre South edge
Block 1Clearcut – 9.7 (0.9) –Partial cut 8.6 (0.2) 8.4 (0.2) 7.2 (0.2)
Block 3Clearcut – 9.2 (0.4) –Partial cut 8.0 (0.2) 7.7 (0.3) 7.2 (0.2)
Block 5Clearcut – 8.1 (0.4) –
Partial cut 7.1 (0.3) 6.8 (0.4) 5.9 (0.2)
Mean (standard deviation in parentheses) growing-season (1 May–30September) 5°C STI, based on daily average 15-cm soil temperature, for the period 1999–2003
North edge Centre South edge
Block 1Clearcut – 759 (132) –Partial cut 609 (23) 599 (24) 441 (28)
Block 3Clearcut – 748 (102) –Partial cut 554 (32) 510 (29) 456 (23)
Block 5Clearcut – 581 (59) –
Partial cut 436 (28) 409 (46) 326 (31)

16
14
12
10
8
6
4
2
0
-2
15-c
m s
oil t
emp
erat
ure
(°C
)
19 May 8 June 28 June 18 July 7 Aug 27 Aug 16 Sept 6 Oct
Block 1
North edgeCentreSouth edgeClearcut
16
14
12
10
8
6
4
2
0
-2
15-c
m s
oil t
emp
erat
ure
(°C
)
Block 3
1 May 21 May 10 June 30 June 20 July 9 Aug 29 Aug 18 Sept 8 Oct
16
14
12
10
8
6
4
2
0
-2
15-c
m s
oil t
emp
erat
ure
(°C
)
Block 5
1 May 21 May 10 June 30 June 20 July 9 Aug 29 Aug 18 Sept 8 Oct
Example growing season (2001) showing plots comparing daily average 15-cm soil temperatures in the clearcuts with those in the partial cut microsites for each block.

1.5
1.0
0.5
0.0
-0.5
-1.0
-1.5
-2.0
-2.5
Tem
per
atur
e di
ffere
nce
(°C
)
Block 1
1 Oct 1 Dec 1 Feb 1 Apr 1 June 1 Aug 1 Oct
North edgeCentreSouth edge
Example year showing differences among daily average 15-cm soiltemperature at the partial cut treatments for each block over the periodOctober 2000–October 2001. Differences were calculated by taking the meanof daily averages over the three microsites, and subtracting this from theaverage temperatures measured at each position.
1.5
1.0
0.5
0.0
-0.5
-1.0
-1.5
-2.0
Tem
per
atur
e di
ffere
nce
(°C
)
Block 3
1 Oct 1 Dec 1 Feb 1 Apr 1 June 1 Aug 1 Oct
2.5
2.0
1.5
1.0
0.5
-0.0
-0.5
-1.0
-1.5
-2.0
Tem
per
atur
e di
ffere
nce
(°C
)
Block 5
1 Oct 1 Dec 1 Feb 1 Apr 1 June 1 Aug 1 Oct

8.0
6.0
4.0
2.0
0.0
-2.0
-4.0
-6.0
-8.0
15-c
m s
oil t
emp
erat
ure
(°C
)
17 Oct 16 Nov 16 Dec 15 Jan 14 Feb 16 Mar 15 Apr 15 May
2002–031998–99
Comparison of daily average 15-cm soil temperatures at the block 1 clearcutfor a heavy- (1998–99) and a light- (2002–03) snow winter.
In Figure 5, the daily mean 15-cm soil temperatures at the block 1 clearcutare compared for two different winters. The winter of 1998–99 was a heavy-snowwinter, while the snowpack was much shallower during the winter of 2002–03.Although no snow cover data are available for the Satah Mountain area, theautomated snowpillow data for Upper Mosley Creek (B.C. Ministry of Sus-tainable Resource Management; wlapwww.gov.bc.ca/rfc/archive) about 80 kmsouth of Satah Mountain, showed a peak snow water equivalent of 410 mmfor 1998–99 and 215 mm for 2002–03. During the heavy-snow winter, soil tem-perature never declined much below the freezing point due to the insulatingeffect of the snowpack. This pattern is typical of high-elevation and other sitesthat consistently have deep snowpacks. In contrast, there was long lasting anddeep soil freezing at 15 cm during the light-snow winter. Figure 6 shows the an-nual average number of soil freeze days (soil temperature <-2°C) for allblocks, treatments and microsites, and Appendix 3 contains the annual datafor each station. Soil freeze days declined markedly as elevation, and thus win-ter snowpack, increased. There was also a trend towards more soil freeze daysin the clearcuts compared to the partial cuts. This may have resulted fromlower night air temperatures, and, at certain points during the winter, snowdepths could have been lower due to wind and sun in the clearcut. There wasno consistent trend of differences in soil freeze days among the three partialcut microsites for blocks 1, 3, and 5.
60
50
40
30
20
10
0
Num
ber
of d
ays
Location
1C 1PN 1PC 1PS 3C 3PN 3PC 3PS 5C 5PN 5PC 5PS
Mean number of days per winter when the average 15-cm soil temperature isless than -2°C (1997–2003). Key to locations is as follows: 1C = block 1clearcut; 1PN = block 1 partial cut, north edge; 1PC = block 1 partial cut, centre;1PS = block 1 partial cut, south edge; 3C = block 3 clearcut; 3PN = block 3partial cut, north edge; 3PC = block 3 partial cut, centre; 3PS = block 3 partialcut, south edge; 5C = block 5 clearcut; 5PN = block 5 partial cut, north edge;5PC = block 5 partial cut, centre; 5PS = block 5 partial cut, south edge.
Figure 7 shows the daily minimum 15-cm air temperature for the clearcut andpartial cut (north edge location) of block 1, during the 2002 growing season.It can be readily seen that frosts were frequent and severe, especially in theclearcut, where the temperature dropped below -10°C once in June and July.This general pattern was repeated from year to year (Appendix 4). The meandaily minimum 15-cm air temperatures for the growing seasons are reportedin Table 4. Means ranged from 0.5 to -1.5°C for the partial cuts and from -1.6 to -2.5°C for the clearcuts. To put these temperatures in perspective, inthe Sub-Boreal Spruce Dry, Warm biogeoclimatic subzone (near Gavin Lake,B.C.) the mean minimum temperature for a uniform shelterwood (15 m2/haretained basal area) was approximately 4°C during the 2003 growing season(R. Sagar, unpublished data, 2003, B.C. Ministry of Forests, Williams Lake,B.C.).
Figure 8 shows the differences in daily minimum 15-cm air temperaturesat the three partial cut microsites from the block mean (mean of the daily av-erage temperature of the three microsites) for the 2001 growing season. Thepatterns shown in Figure 8 are typical for other years. The extreme tempera-ture differences between the warmest and coldest microsites were on the orderof 1–2°C. For two of the three blocks, the centre microsite was the coldest,while the north edge microsites were the warmest at all three blocks. The dif-ferences among the microsites can be explained in part by the sheltering effectof the surrounding forest and the effect of soil temperature on air tempera-ture. Temperature sensors further away from the forest edge (i.e., centre micro-site) have a larger sky view factor and thus receive less long-wave radiationfrom above, making them cooler than sensors with a small sky view factor (i.e.,north and south edge microsites). The soil surface can affect nighttime air
3.2 Air Temperature

temperature by transferring varying amounts of radiant and sensible heat tothe sensor. For example, warmer daytime soil temperatures (and sensors) canlead to warmer nighttime sensor temperatures. The effect of soil temperatureon nighttime air temperatures is also determined in part by the soil surfacetype (i.e., the organic layer depth and composition). A deep organic layer in-hibits the transfer of heat to the mineral soil below due to its low thermal con-ductivity and tends to be very warm at the air–organic interface during theday. At night, this heat is given up very quickly, leaving little to be given offlater in the night. The effect of opening sizes and position within openingson minimum air temperature is discussed in some detail by Groot and Carl-son (1996).
The seasonal (1 June–15 August) mean number of frost events is shown inTable 5 and the full dataset for each year and station is reported in Appendix5. Frost (air temperature <0°C) occurred on more than 50% of the nights atthe block 1 and 5 clearcuts. In fact, the frequency was almost two out of every
Mean (standard deviation in parentheses) growing-season minimum 15-cm air temperature (°C) for the period 1999–2003
North edge Centre South edge
Block 1Clearcut – 2.5 (0.2) –Partial cut 0.9 (0.2) -1.5(0.3) -0.9 (0.3)
Block 3Clearcut – -1.6 (0.5) –Partial cut 0.5(0.2) 0.1 (0.3) -0.4 (0.3)
Block 5Clearcut – -2.0 (0.8) –
Partial cut 0.0 (0.3) -0.1 (0.4) 0.3 (0.3)
15
10
5
0
-5
-10
-15
15-c
m a
ir te
mp
erat
ure
(°C
)
1 June 15 June 29 June 13 July 27 July 10 Aug
North edgeClearcut
Comparison of daily minimum 15 cm air temperature at the clearcut andnorth edge microsites for block 1 during the 2002 growing season.

1.0
0.5
0.0
-0.5
-1.0
Tem
per
atur
e di
ffere
nce
(°C
)
25 May 14 June 4 July 24 July 13 Aug 2 Sept 22 Sept 12 Oct
Block 1North edgeCentreSouth edge
Differences among daily minimum 15-cm air temperature at the partialcut treatments for each block over the period October 2000–October2001. Differences were calculated by taking the mean of dailyminimums over the three microsites, and subtracting this from theminimum temperatures measured at each position.
2.0
1.5
1.0
-0.5
0.0
-0.5
-1.0
-1.5
-2.0
Tem
per
atur
e di
ffere
nce
(°C
)
Block 3
25 May 14 June 4 July 24 July 13 Aug 2 Sept 22 Sept 12 Oct
1.5
1.0
-0.5
0.0
-0.5
-1.0
-1.5
-2.0
Tem
per
atur
e di
ffere
nce
(°C
)
Block 5
25 May 14 June 4 July 24 July 13 Aug 2 Sept 22 Sept 12 Oct

three nights at the block 5 clearcut. Frost occurred on an average of 17 nightsduring July at the block 5 clearcut, with five of these being severe frost events(air temperature <-4°C). Although there were fewer frosts in the partial cuts,they still occurred frequently. Severe frosts occurred, on average, at leasttwice every season at all locations, and as many as 14 times at the block 5clearcut.
Low air temperature has been shown to cause significant photosynthesisreductions in Engelmann spruce (Picea engelmannii) after exposure to tem-peratures of -4°C or lower (Delucia and Smith 1987). This suggests that,apart from the obvious problem of frost killing new growth, severe frost inthe summer may limit productivity of interior spruce (Picea glauca x P. engel-mannii) planted on these sites. The partially cut treatments significantlyreduced the incidence of severe frost compared to the clearcuts (see Figure 9).Severe frosts were uncommon during the month of July at all partially cut
Mean (standard deviation in parentheses) number of frost events (based on daily minimum 15 cm air temper-ature) determined using the 76-day period, 1 June–August 15, each year from 1999 to 2003
Number of days minimum 15 cm Ta < 0°C Number of days minimum 15 cm Ta < -4°CNorth edge Centre South edge North edge Centre South edge
Block 1Clearcut – 43 (6) – – 12 (4) –Partial cut 26 (4) 34 (8) 29 (6) 4 (2) 5 (2) 4 (2)
Block 3Clearcut – 36 (7) – – 7 (2) –Partial cut 20 (3) 22 (4) 28 (5) 2 (1) 2 (1) 4 (3)
Block 5Clearcut – 49 (10) – – 14 (4) –
Partial cut 24 (6) 29 (5) 27 (6) 3 (2) 3 (2) 3 (2)
16
14
12
10
8
6
4
2
0
Num
ber
fros
ts (
T <
-4°C
)
Location
Clearcut North edge Centre South edge
Total number of severe frosts (based on daily minimum 15-cm air temper-atures <-4°C) at block 5, for the period 1 June–15 August during the 2002growing season.

microsites (zero or one occurrence), while they occurred in most years at theclearcut treatments (Appendix 5). Another benefit of partial cutting, with re-spect to frost damage, is the reduction of direct solar irradiance due toshading by retained canopy, which may limit the severity of physiologicaldamage after a heavy frost (Dang et al. 1992). The lessening of severe frostsand reduction in solar radiation may explain the observed trends in spruceseedling survival and frost damage on blocks 1 and 5 (Daintith et al. 2005).For instance, 5 years after planting, in block 1, spruce seedling survival was78% in the clearcut compared to 92% in the irregular group shelterwood(whole tree harvesting) treatment; while in block 5, survival was 35% in theclearcut and 89% in the shelterwood. Survival was similar (>95%) for bothtreatments in block 3, where the average number of severe frost events wasabout half of that in the other two blocks. In the main research trial, across all five blocks, the amount of frost damage to terminal buds was 37% in theclearcuts, but only 18% in the shelterwood (whole tree) treatments.
Table 6 displays seasonal totals of rainfall in the clearcut treatments. The mostreliable record was at block 1, and it indicates that 2000 and 2001 had wettergrowing seasons than 2002 and 2003. There was also an indication that rain-fall increased with elevation, as expected.
Figure 10 details the mean number of growing-season soil water stress days(soil water potential <-1.0 MPa). No growing-season water stress was observedin the clearcut or north edge of the partial cut at block 5. This is probably dueto heavier and later melting winter snowpacks, higher summer rainfall, andlower evaporative loss (due to lower mean air temperatures). More stress dayswere observed at block 3 than at block 1. This difference could be due to regen-eration density, as there was a higher density of tree regeneration on block 3than block 1 (37% higher on the partial cut and 400% higher on the clearcut)(Steen et al. 2005).
Generally, more stress days were observed at the north edge of the openingsin the partial cut than in the clearcuts. This may be a result of higher evapo-transpiration rates, mainly from the adjacent forest in the partial cuts; but itis difficult to generalize, as we did not collect any soil water data for the othermicrosites within the partial cuts. Figure 11 shows a plot of growing-seasonsoil water potential that illustrates a typical pattern for soil water potential inmost years. Within the study area, water stress days typically occurred in oneor two discrete periods during the late summer of each data collection year(R. Sagar, unpublished data, B.C. Ministry of Forests, Williams Lake, B.C.). It isimportant to note that the convention is to describe soil water potential as anegative number, hence values become increasingly negative as the soil dries.
3.3 Precipitation andSoil Moisture
Total growing-season rainfall (mm) at each block for the years 2000–2003
Year Block 1 Block 3 Block 5 Measurement period
2000 163.1 – – 3 June–13 September2001 172.7 – 71.1a 19 May–21 October2002 77.2 115.8 133.3 14 June–16 October
2003 105.9b 96.8 112.2b 31 May–6 October
a Block 5, 2001 – Total rainfall for the period 7 August–21 October (new funnel was installedon 7 August).
b Blocks 3 and 5, 2003 – rain gauges found to be significantly out of level on 15 August 2003site visits.

-4.0
-3.5
-3.0
-2.5
-2.0
-1.5
-1.0
-0.5
0.0
Soil
wat
er p
oten
tial (
MPa
)
19 May 19 June 19 July 19 Aug 19 Sept 19 Oct
3 cm, north edge15 cm, north edge
Growing-season soil water potential at the block 1 partial cut during 2001.Measurements were made at depths of 3 and 15 cm beneath the mineralsoil–organic layer interface.
35
30
25
20
15
10
5
0
Num
ber
of s
tres
s da
ys
Location
1C 1PN 3C 3PN 5C 5PN
0 0
14
17
27
33
Mean annual number of soil water stress days (days when the 15-cm soilwater potential is less than -1.0 MPa bar) for each block and treatment(1999–2003). Note that the soil water potential was measured only at thenorth edge locations of the partial cuts. See Figure 6 for key to locationterms.

At this particular site, soil water stress measured at 3 cm soil depth began inearly September and lasted about a week until a rainfall wet the soil. Soil waterpotential, measured at a soil depth of 15 cm, decreased over the same time peri-od, but not as much as at the 3 cm depth. Annual growing-season soil waterstress days are reported for all blocks, treatments, and microsites in Appendix 6.
The mean snow-free dates for all blocks, treatments, and microsites are givenin Table 7 and the full dataset for each year and station are in Appendix 7. Theeffect of elevation is clear. The snow-free date averaged 1 month later at theblock 5 clearcut than the block 1 clearcut. The reasons are heavier snowpacksand slower melting due to lower average air temperatures at higher elevations.Clearcuts generally were snow-free a few days earlier than the earliest-meltingpartial cut site (except at block 5). South edge microsites were the latest to besnow-free in two of the three partial cuts.
3.4 Snow-free Dates
Mean snow-free date (based on 1-cm soil temperatures) for each block,treatment, and microsite from 1998 to 2003
North edge Centre South edge
Block 1Clearcut – 17 Apr –Partial cut 20 Apr 29 Apr 26 Apr
Block 3Clearcut – 26 Apr –Partial cut 30 Apr 3 May 8 May
Block 5Clearcut – 17 May –
Partial cut 6 May 16 May 26 May
4 SUMMARY
Soil temperatures were significantly warmer in the clearcut treatments incomparison to partial cuts. This manifests itself in a higher total in theclearcuts (37–48% more). The main reason that soil temperature and were higher in the clearcuts was higher total solar irradiance in the clearcuts.Earlier snow-free dates in the clearcuts also increase accumulation. Win-ter soil freezing was reduced in the partial cut treatments due to less extrememinimum air temperatures and longer duration of snow cover. The overallnumber of frosts (air temperature <0°C) and severe frosts (air temperature<-4°C) was significantly less in the partial cut treatments compared to theclearcuts. This is largely due to the sheltering effect of the surrounding forest.
The differences in microclimate among microsites within the partial cutswere less pronounced than the overall differences between clearcuts and par-tial cuts. Soil temperature and accumulation were greatest at the northedge microsites, and least at the south edges. Centre locations generally hadmore frost events than edge microsites due to increased sky view factors. Snow-free dates were 1–3 weeks later at the south edge microsites in comparison tothe north edges. Assuming that water is not limiting, the north edge micrositeshould be the most favourable location for seedling growth in a partial cutdue to the earlier snow-free dates, higher soil temperature, increased solar

irradiance, and good frost protection. The centre microsite would be the nextbest if frost damage is not too limiting. The south edge site is limited by lowsolar irradiance, cooler soil temperatures, and later snow-free dates that de-crease the length of the growing season. These results are similar to the findingsat other high-elevation study sites in the interior of British Columbia (Sagaret al. 2001; Stathers et al. 2001; and Spittlehouse et al. 2004). Sagar et al. (2001)reported that mean growing-season 10-cm soil temperatures were more than2°C warmer at the north edge location when compared to the south edge. Itis interesting to note that, given the relationship between solar loading andsoil temperature, microsites with the lowest soil temperatures at a givenblock also receive the lowest solar irradiance. This circumstance may makethese sites less favourable for regeneration of seedlings, especially pine, thansunnier microsites within the same opening.
As expected, soil temperature and decreased with increasing elevation(moving from block 1 to block 5). However, the effect of elevation was lessimportant as a determinant to the total number of growing-season frosts.Block 1 had a similar number of frosts to block 5, with block 3 having thefewest. Block 1 also had the lowest extreme minimum summer air tempera-tures recorded (see Appendix 4). Soil freezing decreased markedly withincreased elevation due to heavier and longer-lasting snowpacks. The num-ber of soil moisture stress days was minimal at block 5, which had higherannual precipitation. Overall, the effect of increasing elevation on microcli-mate was similar to that in moving from the north edge (most favourable) to the south edge (least favourable) within an opening.
The Cariboo – Chilcotin Land Use Plan () (Government of B.C.1995) set aside 181 000 ha to be harvested with “modified” harvesting systemsto maintain forage throughout the wintering area of northern caribou. Themicroclimate in small gaps is different from that of clearcuts, and, therefore,could influence the survival and growth of lichen and regeneration, as well asthe abundance of mushrooms. The influence may be direct or indirect. Forexample, in the planted stock study on the trial area (Daintith et al. 2005), regeneration, particularly spruce, showed more evidence of frost damage inthe clearcuts where the number of frost events was greatest. In the samestudy, the diameter growth of pine was significantly (α = 0.05) less in thepartial cuts (6.8–7.9 mm) than the clearcuts (10.5 mm); this may be attribut-able partially to lower soil temperature, but other factors such as light (notmeasured directly) are also important. This suggests using larger openingsizes to improve growth, but at the risk of increased frost.
Initial results from the pilot study (Miège et al. 2001) show that the smallopenings (15 m diameter) in the group selection silvicultural system had sim-ilar amounts of lichen compared to uncut forests, whereas the clearcuts withreserves had substantially less lichen. The authors point out that when theforest canopy is suddenly removed, the lichens are exposed to direct solar ra-diation, to which they can not quickly adapt, so they dry out and die. Althoughlight wasn’t directly measured in the microclimate study, the higher soil tem-peratures do indicate more solar radiation in the clearcuts. The response ofthe common terrestrial lichen species and commercial mushroom species arethe subjects of ongoing studies (Waterhouse 1998).
Evidence to date suggests that using group selection or irregular groupshelterwood would meet the objective of maintaining caribou habitat whileallowing some timber harvesting.

Block 1 Block 3 Block 5
Partial cut Partial cut Partial cut Partial cut Partial cut Partial cut Partial cut Partial cut Partial cut Year Clearcut North edge Centre South edge Clearcut North edge Centre South edge Clearcut North edge Centre South edge
1997 661 637 515 483 671 542 400 429 – – – –1998 943 839 874 677 942 483 454 389 – 590 524 478 1999 663 608 612 470 687 559 530 464 562 427 445 351 2000 699 636 613 461 706 545 520 463 562 431 382 318 2001 686 594 573 426 657 503 460 416 502 397 341 278 2002 760 580 572 401 725 575 517 474 648 463 438 356 2003 987 629 622 445 773 587 525 462 632 463 438 326
Mean 759 609 599 441 748 554 510 456 581 436 409 326S.D. 132 23 24 28 102 32 29 23 59 28 46 31
Shaded cells not used in calculations of mean and standard deviation (S.D.); see notes below1 2003 block 3 partial cut, north edge – sensor failed on 4 June so no data ( value was estimated by regression with centre position)2 2001 block 1 partial cut, north, south, and centre – missing data 27 April through 18 May based on data from clearcut, no were lost3 2000 block 1 partial cut – bad data 30 April through 2 June (missing was estimated based on years with complete data)4 1999 block 1 clearcut – missing data 17–27 September (probably no more than 25 missing )5 1998 block 3 partial cut – missing data from 8 August through 3 November6 1998 block 5, partial cut – data collection began 28 May (i.e., no data 1–27 May); estimated missing : north edge and centre <10; south edge 07 1997 blocks 1 and 3 – monitoring began on 5 June (i.e., no data 1 May –June)8 1997 blocks 1 and 3 partial cuts – no data for centre position from 5 June to 1 July
AP
PEN
DIX
1G
rowing-season (1 M
ay–30 Septem
ber) total 5°C
soil temp
eratureindex (STI) based on 15-cm
soil temp
eratures for each block,treatm
ent, and microsite for 1997–2003. M
eans and standarddeviations are based on the p
eriod 1999–2003.

AP
PEN
DIX
2G
rowing-season (1 M
ay–30 Septem
ber) mean daily 15 cm
soiltem
peratures and m
ean daily minim
um 15-cm
air temp
eratures (°C)
for each block, treatment, and m
icrosite for 1997–2003. Means and
standard deviations are for the period 1999–2003.
Block 1 Block 3 Block 5
Partial cut Partial cut Partial cut Partial cut Partial cut Partial cut Partial cut Partial cut Partial cut Season Clearcut North edge Centre South edge Clearcut North edge Centre South edge Clearcut North edge Centre South edge
Mean 15-cm soil temperature1997 10.6 10.4 10.7 9.1 10.7 9.6 9.4 8.6 –1998 11.1 10.5 10.6 9.1 11.0 9.6 9.1 8.1 – 9.7 9.2 8.8 1999 9.1 8.6 8.5 7.4 9.0 8.1 8.0 7.2 7.9 7.2 7.2 6.1 2000 9.3 8.7 8.5 7.4 9.3 8.1 7.9 7.3 8.1 7.3 6.8 5.9 2001 9.1 8.5 8.2 7.2 8.5 7.7 7.3 6.9 7.4 6.6 6.1 5.5 2002 9.6 8.4 8.3 6.8 9.3 8.2 7.7 7.2 8.4 7.3 7.1 6.1 2003 11.3 8.8 8.7 7.3 9.7 _ 7.8 7.3 8.5 7.2 7.0 5.9
Mean 9.7 8.6 8.4 7.2 9.2 8.0 7.7 7.2 8.1 7.1 6.8 5.9S.D. 0.9 0.2 0.2 0.2 0.4 0.2 0.3 0.2 0.4 0.3 0.4 0.2
Mean daily minimum 15 cm air temperature1997 1.5 0.0 0.0 0.5 0.3 1.8 1.9 0.7 –1998 -0.3 1.1 1.0 1.6 1.2 3.3 3.1 2.2 – 2.7 2.2 2.1 1999 -2.2 -1.1 -1.1 -0.6 -0.9 0.6 0.3 0.0 -1.0 0.0 0.3 0.3 2000 -2.5 -0.7 -1.3 -0.6 -1.2 0.7 0.3 -0.4 -1.5 0.1 -0.1 0.3 2001 -2.5 -0.8 -1.5 -0.9 -1.7 0.2 -0.3 -0.7 -2.8 -0.5 -0.7 -0.1 2002 -2.7 -1.0 -1.6 -1.1 -1.8 0.4 -0.1 -0.4 -1.9 0.0 0.0 0.4 2003 -2.5 -1.0 -1.9 -1.1 -2.2 0.5 0.1 -0.7 -2.6 0.3 -0.1 0.6
Mean -2.5 -0.9 -1.5 -0.9 -1.6 0.5 0.1 -0.4 -2.0 0.0 -0.1 0.3 S.D. 0.2 0.2 0.3 0.3 0.5 0.2 0.3 0.3 0.8 0.3 0.4 0.3
Shaded cells not used in calculations of mean and standard deviation (S.D.); see notes below1 2003 block 3 partial cut, north edge – sensor failed on 4 June so no data2 2001 block 1 partial cut, north, south ,and centre – missing data 27 April–18 May (corrected for missing data using linear regression)3 2000 block 1 partial cut – bad data 30 April–2 June (corrected for missing data using linear regression)4 1999 block 1 clearcut – missing data 17–27 September5 1998 block 3 partial cut – missing data from 8 August through 3 November6 1998 block 5 partial cut – data collection began 28 May (i.e., no data 1–27 May)7 1997 blocks 1 and 3 – monitoring began on 5 June (i.e., no data 1 May–4 Jun)8 1997 blocks 1 and 3 partial cuts – no data for centre position from 5 June to 1 July
Block 1 Block 3 Block 5
Partial cut Partial cut Partial cut Partial cut Partial cut Partial cut Partial cut Partial cut Partial cut Season Clearcut North edge Centre South edge Clearcut North edge Centre South edge Clearcut North edge Centre South edge
1997–98 21 12 9 17 4 7 2 13 – – – –1998–99 0 0 0 0 0 0 0 0 0 0 0 0 1999–00 17 0 0 0 0 0 0 0 0 0 0 0 2000–01 54 10 12 10 36 13 2 17 0 0 0 0 2001–02 95 48 52 61 9 24 0 0 0 0 0 0 2002–03 105 96 102 101 85 58 31 78 23 8 0 2
Mean 49 28 29 32 22 17 6 18 5 2 0 0S.D. 44 38 41 41 34 22 12 30 10 4 0 1
Extreme minimum, daily average soil temperature1997–98 -3.4 -3.4 -3.3 -3.4 -2.5 -2.8 -2.2 -3.3 – – – –1998–99 -0.4 -0.2 -0.3 -0.2 -0.1 -0.3 0.0 -0.1 0.2 0.2 0.2 0.1 1999–00 -2.3 -1.6 -1.8 -1.7 -0.9 -1.5 -0.9 -1.3 -0.2 -0.3 -0.3 -0.4 2000–01 -5.0 -2.8 -3.3 -2.5 -3.1 -3.3 -2.0 -2.9 -0.8 -1.8 -1.0 -0.9 2001–02 -4.2 -3.3 -3.3 -3.9 -2.4 -2.8 -1.7 -1.9 -0.2 -0.5 -0.2 -0.3
2002–03 -6.2 -4.6 -5.1 -4.9 -4.3 -3.8 -3.1 -4.5 -3.0 -2.3 -1.6 -2.0
Note: Correction was applied to soil temperatures if offset was >0.1°CS.D. = standard deviation1997–98 block 1 partial cut, centre – offset not applied because it appeared late in the winter
AP
PEN
DIX
3Seasonal (Sep
tember–M
ay) total days when daily average 15-cm
soiltem
peratures w
ere less than -2°C
for each block, treatment, and
microsite for 1997–2003. A
lso reported are the extrem
e minim
um,
daily average soil temp
eratures for each season.

APPENDIX 4 Extreme daily minimum 15-cm air temperatures (°C) determined forthe period 1 June–15 August, and for July only of each year, at eachblock, treatment, and microsite for 1997–2003.
Block 1
Partial cut Partial cut Partial cutClearcut North edge Centre South edge
Year Season July Season July Season July Season July
1997 -8.4 -6.3 -6.0 -3.9 -5.0 -4.1 -5.8 -3.6 1998 -8.0 -8.0 -5.0 -4.2 -5.4 -4.4 -5.0 -4.1 1999 -12.4 -6.0 -8.8 -3.1 -9.0 -3.3 -8.5 -3.0 2000 -8.2 -3.8 -4.7 -1.8 -5.6 -2.3 -5.0 -1.8 2001 -8.5 -6.4 -5.6 -3.2 -6.3 -4.0 -6.1 -3.2 2002 -10.9 -10.5 -8.0 -6.8 -8.9 -7.6 -7.8 -7.0 2003 -9.3 -4.0 -6.5 -2.9 -8.0 -3.5 -7.0 -2.6
Extreme -12.4 -10.5 -8.8 -6.8 -9.0 -7.6 -8.5 -7.0
Block 3
Partial cut Partial cut Partial cutClearcut North edge Centre South edge
Year Season July Season July Season July Season July
1997 -5.7 -4.2 -4.0 -1.7 -2.3 -1.9 -5.1 -2.7 1998 -5.5 -5.5 -3.3 -3.3 -3.7 -3.7 -4.4 -4.4 1999 -8.0 -4.9 -5.2 -1.8 -5.7 -2.5 -6.4 -3.5 2000 -6.0 -3.0 -3.9 -0.7 -4.4 -1.7 -4.7 -2.0 2001 -8.9 -5.1 -5.6 -3.1 -6.0 -4.0 -6.7 -4.3 2002 -7.8 -7.8 -4.7 -4.5 -5.4 -5.2 -5.8 -4.7 2003 -9.2 -4.4 -5.3 -1.7 -6.2 -1.9 -6.7 -2.2
Extreme -9.2 -7.8 -5.6 -4.5 -6.2 -5.2 -6.7 -4.7
Block 5
Partial cut Partial cut Partial cutClearcut North edge Centre South edge
Year Season July Season July Season July Season July
1997 – – – – – – – –1998 – – -3.6 -3.6 -4.3 -4.3 -4.2 -4.2 1999 -8.0 -8.0 -6.2 -3.2 -6.5 -4.1 -6.7 -4.0 2000 -7.2 -4.5 -3.8 -0.8 -4.7 -1.6 -4.4 -1.5 2001 -8.5 -7.1 -6.1 -4.0 -6.6 -4.7 -6.3 -4.6 2002 -10.4 -4.6 -6.8 -3.4 -7.4 -3.9 -7.1 -3.8 2003 -7.8 -5.6 -5.7 -0.9 -6.9 -1.6 -6.0 -1.2
Extreme -10.4 -8.0 -6.8 -4.0 -7.4 -4.7 -7.1 -4.6
Shaded cells have incomplete data for this year and location; see notes below.1 1997 blocks 1 and 3 – monitoring began on 5 June (i.e., no data 1 May–4 June)2 1997 blocks 1 and 3 partial cuts – no data for centre position from 5 June to 1 July3 1998 block 3 partial cut – missing data from 8 August to 3 November4 2000 block 1 partial cut – bad data 30 April–2 June

APPENDIX 5 Total frost events (based on daily minimum 15-cm air temperature)(temperature <0°C) and severe frosts (temperature <-4°C)determined for the periods 1 June–15 August, and for July only ofeach year, at each block, treatment, and microsite for 1997–2003.Means and standard deviations are for the period 1999–2003.
Total frosts (temp <0°C )
Block 1
Partial cut Partial cut Partial cutClearcut North edge Centre South edge
Year Season July Season July Season July Season July
1997 41 15 25 8 12 8 21 61998 24 5 12 2 15 3 11 21999 40 18 27 10 29 12 24 82000 34 11 19 4 23 6 21 42001 46 14 27 6 37 10 30 82002 51 20 31 10 43 14 37 152003 45 16 28 10 39 13 31 10
Mean 43 16 26 8 34 11 29 9S.D. 6 3 4 3 8 3 6 4
Block 3
Partial cut Partial cut Partial cutClearcut North edge Centre South edge
Year Season July Season July Season July Season July
1997 26 9 10 2 4 2 22 61998 14 3 8 1 9 1 12 21999 26 10 18 4 19 4 22 72000 30 5 16 1 19 1 25 32001 40 13 24 4 28 7 32 82002 41 15 23 9 25 10 35 102003 42 19 18 7 21 8 27 12
Mean 36 12 20 5 22 6 28 8S.D. 7 5 3 3 4 4 5 3
Block 5
Partial cut Partial cut Partial cutClearcut North edge Centre South edge
Year Season July Season July Season July Season July
1997 – – – – – – – –1998 – – 10 3 11 3 11 31999 35 14 20 7 22 8 23 92000 41 8 25 3 28 4 27 42001 56 18 33 7 36 8 37 82002 53 21 25 9 30 9 28 82003 58 23 16 3 27 11 20 6
Mean 49 17 24 6 29 8 27 7S.D. 10 6 6 3 5 3 6 2

Severe frosts (temp <-4°C )
Block 1
Partial cut Partial cut Partial cutClearcut North edge Centre South edge
Year Season July Season July Season July Season July
1997 11 2 6 0 3 1 5 01998 6 1 2 1 2 1 2 11999 17 6 5 0 5 0 5 02000 9 0 2 0 2 0 2 02001 10 2 5 0 5 0 5 02002 16 5 6 2 7 3 6 22003 9 0 3 0 6 0 3 0
Mean 12 3 4 0 5 1 4 0S.D. 4 3 2 1 2 1 2 1
Block 3
Partial cut Partial cut Partial cutClearcut North edge Centre South edge
Year Season July Season July Season July Season July
1997 6 1 2 0 0 0 3 01998 1 1 0 0 0 0 1 11999 5 1 3 0 3 0 3 02000 6 0 0 0 1 0 2 02001 9 1 2 0 2 0 7 12002 9 3 2 1 4 3 7 12003 8 2 2 0 2 0 2 0
Mean 7 1 2 0 2 1 4 0S.D. 2 1 1 0 1 1 3 1
Block 5
Partial cut Partial cut Partial cutClearcut North edge Centre South edge
Year Season July Season July Season July Season July
1997 – – – – – – – –1998 – – 0 0 1 1 1 11999 11 7 3 0 4 1 5 12000 11 1 0 0 1 0 1 02001 20 5 5 1 6 1 5 12002 14 6 3 0 3 0 3 02003 15 4 3 0 3 0 3 0
Means 14 5 3 0 3 0 3 0S.D. 4 2 2 0 2 1 2 1
Shaded cells indicate incomplete data for period; cells not included in mean and standard deviation (S.D.)1 1997 blocks 1 and 3 – monitoring began on 5 June (i.e., no data 1 May–4 June)2 1997 blocks 1 and 3 partial cuts – no data for centre position from 5 June to 1 July3 1998 block 3 partial cut – missing data from 8 August to 3 November4 2000 block 1 partial cut – bad data 30 April–2 June
Continued

Block 1 Block 3 Block 5
Partial cut Partial cut Partial cut Partial cut Partial cut Partial cut Clearcut Clearcut North edge North edge Clearcut Clearcut North edge North edge Clearcut Clearcut North edge North edge
Season 3 cm 15 cm 3 cm 15 cm 3 cm 15 cm 3 cm 15 cm 3 cm 15 cm 3 cm 15 cm
1999 0 0 0 0 0 0 0 0 0 0 0 0 2000 10 0 11 0 0 0 7 0 0 0 0 0 2001 9 0 5 0 12 0 32 10 0 0 0 0 2002 39 45 60 60 87 58 73 _ 0 0 0 0 2003 11 25 64 26 120 75 107 123 0 0 0 0
Means 14 14 28 17 44 27 44 33 0 0 0 0
1999, all sites – soil moisture monitoring did not begin until 29 June; since it was a wet year, no stress days were missed
AP
PEN
DIX
6Total num
ber of water stress days (soil w
ater potential <-1.0 M
Pa) for each block and treatm
ent from 1999 to 2003. N
ote that the soilw
ater potential w
as measured at the north edge locations of the
partial cuts only.

AP
PEN
DIX
7A
nnual snow-free dates based on 1-cm
soil temp
eratures for eachsite, treatm
ent, and microsite for 1998–2003. Earliest and latest
snow-free dates are highlighted.
Block 1 Block 3 Block 5
Partial cut Partial cut Partial cut Partial cut Partial cut Partial cut Partial cut Partial cut Partial cut Season Clearcut North edge Centre South edge Clearcut North edge Centre South edge Clearcut North edge Centre South edge
1998 19 Apr 22 Apr 29 Apr 24 Apr 28 Apr 28 Apr 30 Apr 03 May – – – –1999 24 Apr 28 Apr 11 May 10 May 30 Apr 07 May 09 May 20 May 23 May 09 May 23 May 31 May2000 11 Apr 18 Apr 26 Apr 22 Apr 19 Apr 22 Apr 27 Apr 30 Apr 14 May 27 Apr 11 May 22 May2001 25 Apr – – – 28 Apr 04 May 06 May 10 May 17 May 05 May 14 May 22 May2002 17 Apr 20 Apr 29 Apr 28 Apr 28 Apr 07 May 07 May 16 May 22 May 11 May 19 May 29 May2003 07 Apr 14 Apr 21 Apr 18 Apr 20 Apr 22 Apr 30 Apr 29 Apr 11 May 09 May 12 May 25 May
Mean 17 Apr 20 Apr 29 Apr 26 Apr 26 Apr 30 Apr 3 May 8 May 17 May 6 May 16 May 26 May
= Latest snow-free date
= Earliest snow-free date

5 REFERENCES
Bhatti, J.S., R.L. Flemming, N.W. Foster, F.R. Meng, C.P.A. Bourque, andP.A. Arp. 2000. Simulations of pre- and post-harvest soil temperature,soil moisture, and snowpack for jack pine: Comparison with field ob-servations. For. Ecol. Manage. 138: 413–426.
Chen, J., J.F. Franklin, and T.A. Spies. 1993. Contrasting microclimates amongclearcut, edge and interior of old-growth Douglas-fir forest. Agric. For.Meteorol. 63: 219–237.
Cichowski, D. 1989. Seasonal movements, habitat use, and winter feedingecology of woodland caribou in west-central British Columbia. MScthesis, Univ. of British Columbia, Vancouver, B.C.
Daintith, N.M., M.J. Waterhouse, and H.M. Armleder. 2005. Seedling perfor-mance in partially cut lodgepole pine stands in west-central BritishColumbia. Southern Interior Region, B.C. Min. For., Williams Lake,B.C. Unpublished
Dang, Q.L., V.J. Lieffers, and R.L. Rothwell. 1992. Effects of summer frosts andsubsequent shade on foliage gas exchange in peatland tamarack and blackspruce. Can. J. For. Res. 22: 973–979.
Delucia, E.H. 1986. Effect of low root temperature on net photosynthesis,stomatal conductance and carbohydrate concentration in Engelmannspruce (Picea engelmanni Parry ex. Engelm.) seedlings. Tree Physiol. 2: 143–154.
Delucia, E.H. and W.K. Smith. 1987. Air and soil temperature limitations onphotosynthesis in Engelmann spruce during summer. Can. J. For. Res.17: 527–533.
Government of British Columbia. 1995. Cariboo – Chilcotin land use plan(CCLUP): Ninety-day implementation process,. final report. February15, 1995.
Groot, A. and D.W. Carlson. 1996. Influence of shelter on night temperatures,frost damage and bud break of white spruce seedlings. Can. J. For. Res.26: 1531–1538.
Jordan, D.N. and W.K. Smith. 1995. Microclimate factors influencing the fre-quency and duration of growth season frost for subalpine plants. Agric.For. Meteorol. 77: 17–30.
Lajzerowicz, C.C., M. B. Walters, M. Krasowski, and H.B. Massicotte. 2004.Light and temperature differentially colimit subalpine fir and Engel-mann spruce seedling growth in partial cut subalpine forests. Can. J.For. Res. 34: 249–260.
Lundmark, T. and J.E. Hallgren. 1987. Effects of frost on shaded and exposedspruce and pine seedlings planted in the field. Can. J. For. Res. 17:1197–1207.

Miège, D., H. Armleder, M. Waterhouse, and T. Goward. 2001. A pilot studyof silvicultural systems for northern caribou winter range – lichen re-sponse. B.C. Min. For., Victoria, B.C. Work. Pap. 56.
Pettersen, K.M. 1993. Edge effect on a high elevation clearcut. BSc thesis,Univ. of Victoria, Victoria, B.C.
Reynolds, G. 1997. Climatic data summary for the biogeoclimatic zones ofBritish Columbia. B.C. Min. For., Res. Br., Victoria, B.C. Unpublished.
Richards, L.A. and C.H. Wadleigh. 1952. Soil water and plant growth. In Soilconditions and plant growth. B.T. Shaw (editor). Academic Press, NewYork, N.Y. pp. 73–251.
Sagar, R.M., M. Jull, and C. Delong. 2001. Climate and microclimate. InThe Lucille Mountain study: 8-year results of a silvicultural systems trial in the Engelmann Spruce – Subalpine Fir zone. M.J. Jull and S.K.Stevenson (editors). B.C. Min. For., Victoria, B.C. Work. Pap. 59, pp. 16–29.
Spittlehouse, D.L., R.S. Adams, and R.D. Winkler. 2004. Forest, edge andopening microclimate at Sicamous Creek. B.C. Min. For., Victoria,B.C. Res. Rep. 24.
Stathers, R.J. 1989. Summer frost in young forest plantations. For. Can. andB.C. Min. For., Victoria, B.C. Rep. 073.
Stathers, R.J., T. Newsome, M.J. Waterhouse, and C. Sutherland. 2001. Microcli-mate studies on a group selection silvicultural system in a high-elevationESSFwc3 forest in the Cariboo Forest Region. B.C. Min. For., Victoria,B.C. Work. Pap. 58.
Steen, O.A. and R.A. Coupé. 1997. A field guide to forest site identificationand interpretation for the Cariboo Forest Region. B.C. Min. For., Vic-toria, B.C. Land Manage. Handb. 39.
Steen, O.A., R.J. Stathers, and R.A. Coupé. 1990. Identification and manage-ment of summer frost-prone sites in the Cariboo Forest Region. For.Can. and B.C. Min. For., Victoria, B.C. Rep. 157.
Steen, O.A., M.J. Waterhouse, H.M. Armleder, and N. Daintith. 2005. Natural regeneration of lodgepole pine following partial harvesting on northern caribou winter range in west-central British Columbia.Southern Interior Region, B.C. Min. For., Williams Lake, B.C. Un-published.
Stevenson, S.K, H.M. Armleder, M.J. Jull, D.G. King, B.N. McLellan, andD.S. Coxson. 2001. Mountain caribou in managed forests: Recommen-dations for managers. 2nd ed. B.C. Min. Environ., Lands and Parks,Victoria, B.C. Wildl. Rep. R-26.
Waterhouse, M.J. 1998 Silvicultural systems to maintain northern caribouhabitat in lodgepole pine forests in the MSxv and SBPSxc subzones inthe Cariboo Forest Region: Working plan for EP1208. B.C. Min. For.,Victoria, B.C.