Embed Size (px)
Citation preview

Microbial Tools for Manure Management
Luis C. Solórzano, Ph. D., Dipl. ACASSr. Technical Service Manager-America’s
Silage Inoculants and Ruminant DFM’s
Fitchburg, WI
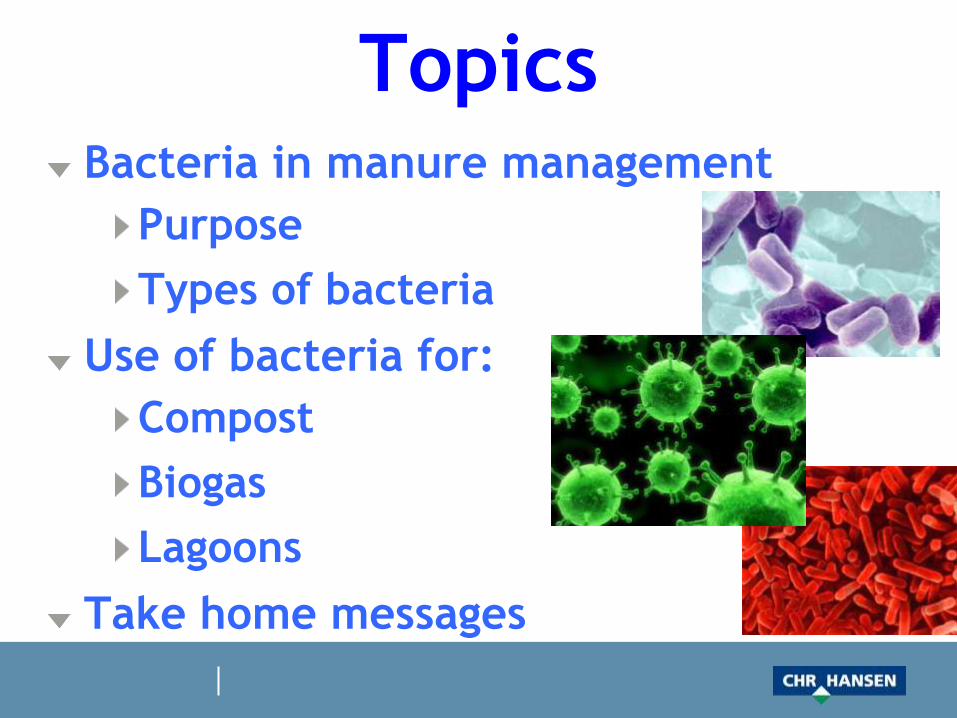
TopicsBacteria in manure management
Purpose
Types of bacteria
Use of bacteria for:
Compost
Biogas
Lagoons
Take home messages
Bacteria
Microorganisms:
Often unicellular
Omnipresent
Posses biochemical properties
beneficial
pathogenic
Purpose of Using Bacteria in Manure Management
Decompose organic matter anaerobically into useful compounds:
Amendment of soils
Energy
Reduce amount of solids
Environmental benefits
Reduce offensive odors/improve air quality
Reduce potential for contamination
Reduce pathogens
Reduce insects
Nutrient management
Reduce gasses and their toxicity
Types of Bacteria
Bacteria types based on Operational Temperature:
Psychrophiles: prefer cold
Mesophiles: mid-temperature
Thermophiles: prefer warmth
Psychrophiles
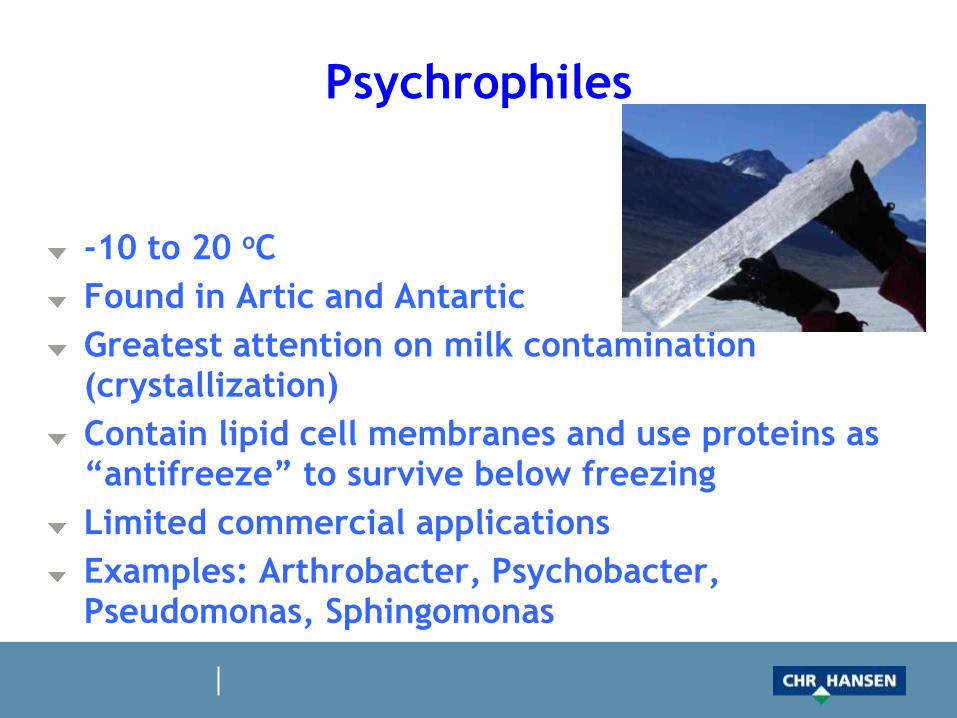
-10 to 20 oC
Found in Artic and Antartic
Greatest attention on milk contamination (crystallization)
Contain lipid cell membranes and use proteins as “antifreeze” to survive below freezing
Limited commercial applications
Examples: Arthrobacter, Psychobacter, Pseudomonas, Sphingomonas
Mesophiles
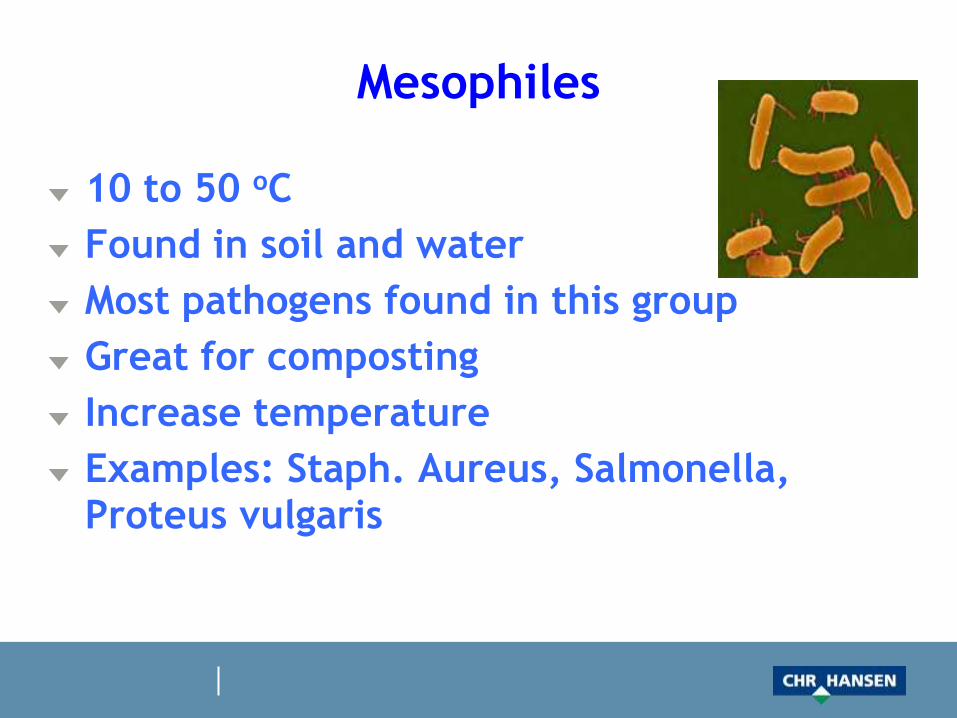
10 to 50 oC
Found in soil and water
Most pathogens found in this group
Great for composting
Increase temperature
Examples: Staph. Aureus, Salmonella, Proteus vulgaris
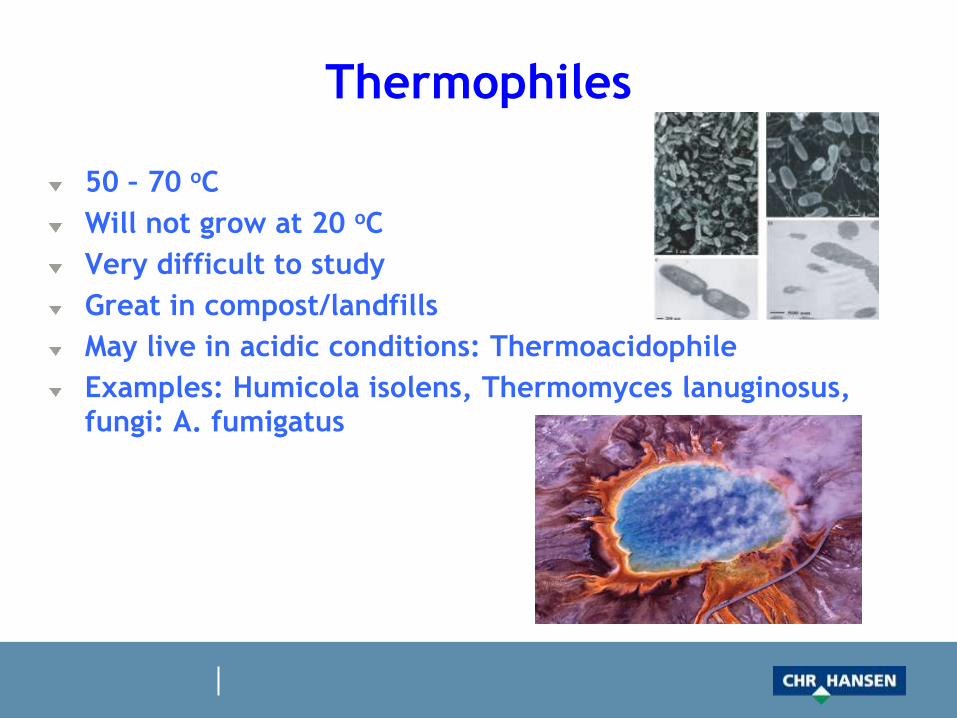
Thermophiles
50 – 70 oC
Will not grow at 20 oC
Very difficult to study
Great in compost/landfills
May live in acidic conditions: Thermoacidophile
Examples: Humicola isolens, Thermomyces lanuginosus, fungi: A. fumigatus
Composting
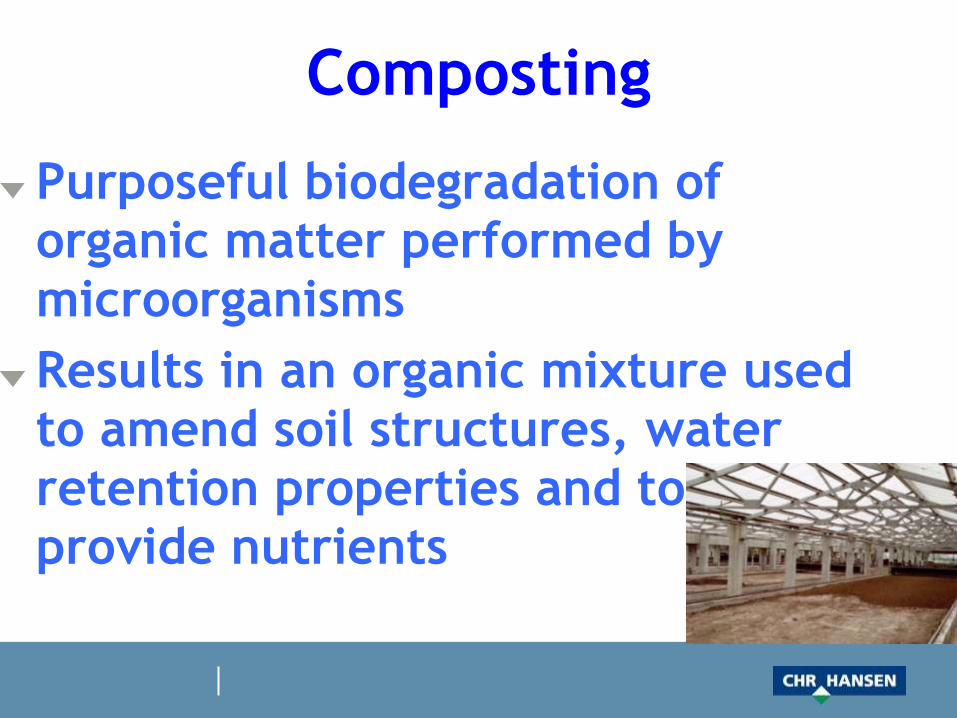
Composting
Purposeful biodegradation of organic matter performed by microorganisms
Results in an organic mixture used to amend soil structures, water retention properties and to provide nutrients
Compost
The bacteria typically used include mixtures of mesophiles and thermophiles (eg. B. megaterium, B. licheniformis, B. subtilis)
These bacterial mixtures will produce enzymes to help in the decomposing process (cellulases, proteases, amylases, xylanases and pectinases)
Typical dosification rates ~7 x 10⁹ CFU/ft3of compost material
Biogas Trial
Leibniz-Institut für Agrartechnik
Potsdam-Bornim e.V. 2008
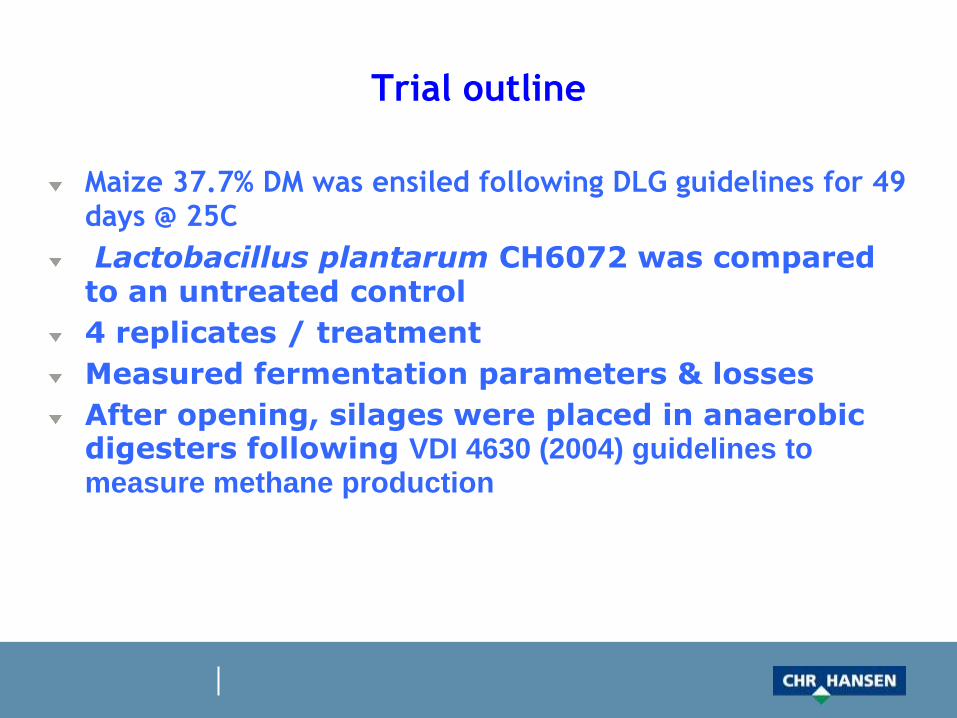
Trial outline
Maize 37.7% DM was ensiled following DLG guidelines for 49 days @ 25C
Lactobacillus plantarum CH6072 was compared to an untreated control
4 replicates / treatment
Measured fermentation parameters & losses
After opening, silages were placed in anaerobic digesters following VDI 4630 (2004) guidelines to measure methane production
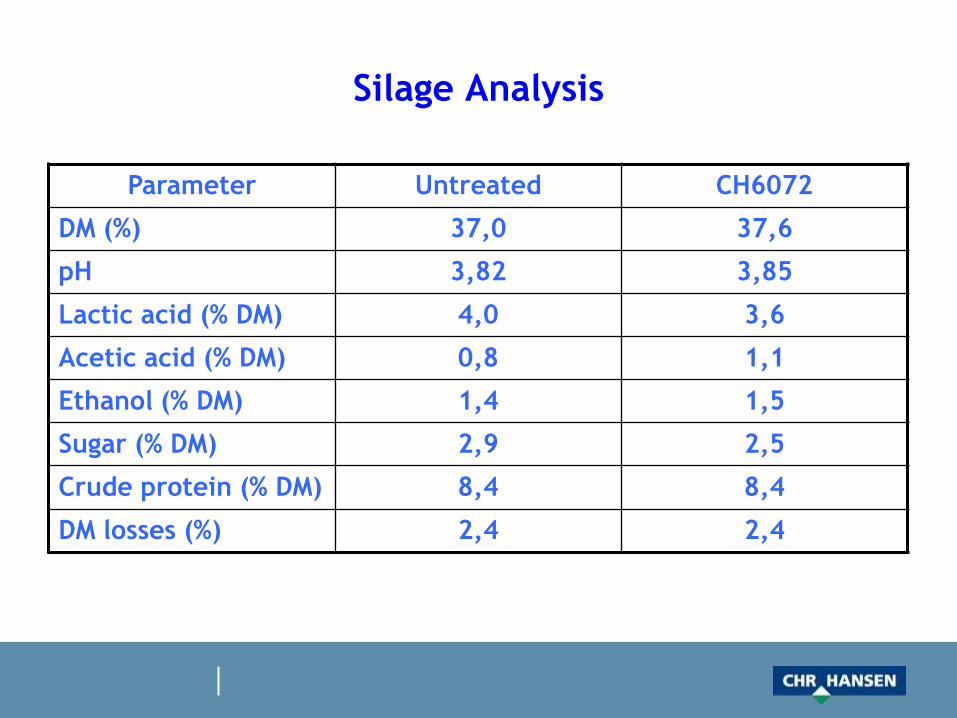
Silage Analysis
Parameter Untreated CH6072
DM (%) 37,0 37,6
pH 3,82 3,85
Lactic acid (% DM) 4,0 3,6
Acetic acid (% DM) 0,8 1,1
Ethanol (% DM) 1,4 1,5
Sugar (% DM) 2,9 2,5
Crude protein (% DM) 8,4 8,4
DM losses (%) 2,4 2,4
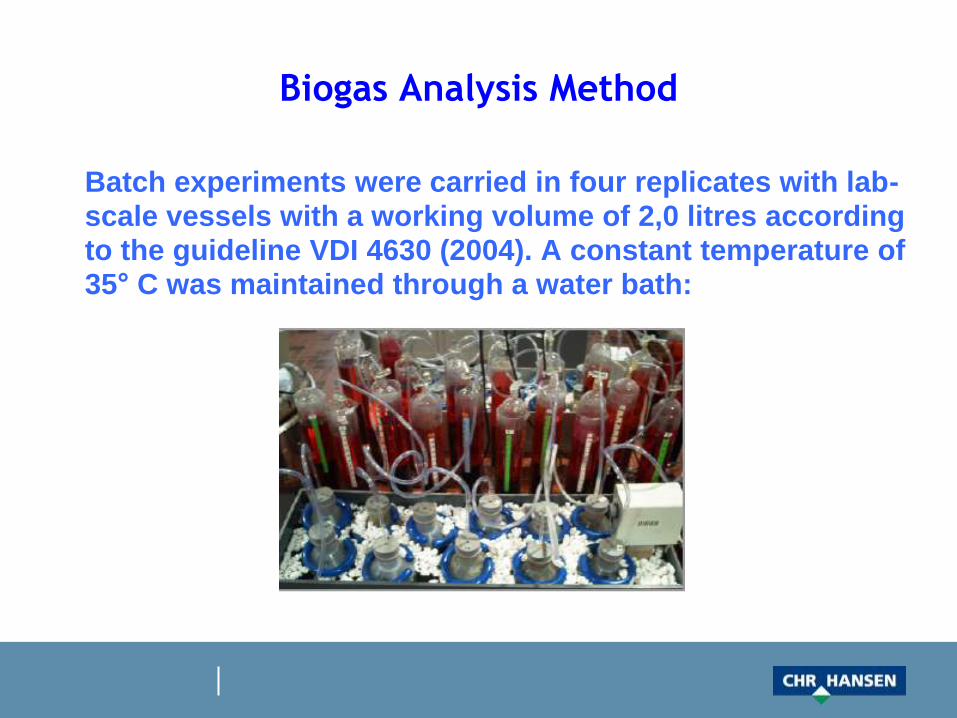
Biogas Analysis Method
Batch experiments were carried in four replicates with lab-scale vessels with a working volume of 2,0 litres according to the guideline VDI 4630 (2004). A constant temperature of 35° C was maintained through a water bath:
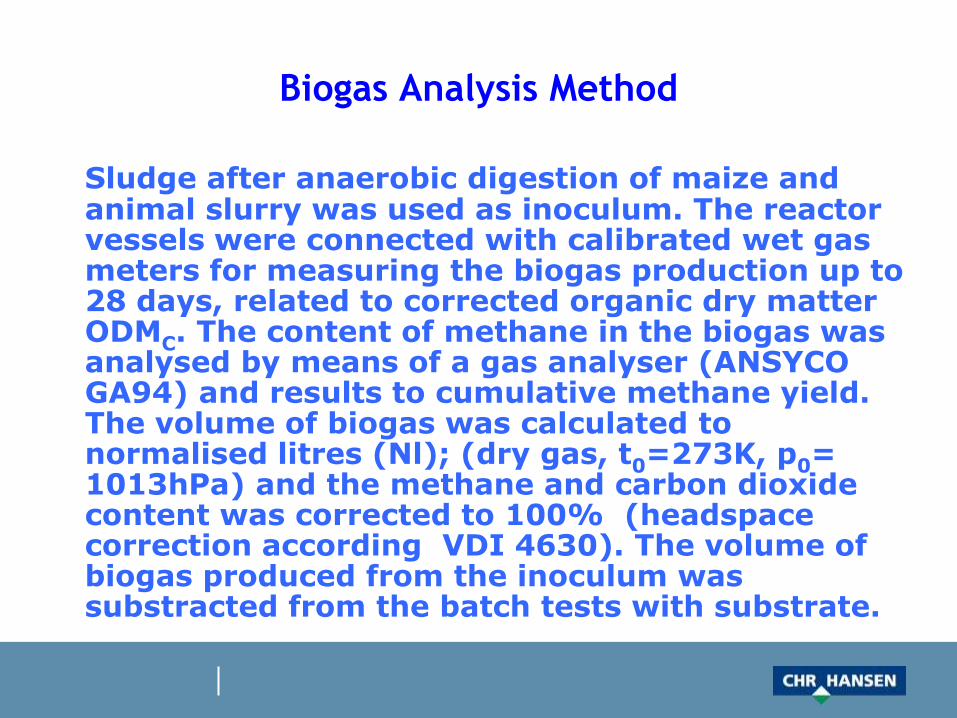
Biogas Analysis Method
Sludge after anaerobic digestion of maize and animal slurry was used as inoculum. The reactor vessels were connected with calibrated wet gas meters for measuring the biogas production up to 28 days, related to corrected organic dry matter ODMC. The content of methane in the biogas was analysed by means of a gas analyser (ANSYCO GA94) and results to cumulative methane yield. The volume of biogas was calculated to normalised litres (Nl); (dry gas, t0=273K, p0= 1013hPa) and the methane and carbon dioxide content was corrected to 100% (headspace correction according VDI 4630). The volume of biogas produced from the inoculum was substracted from the batch tests with substrate.
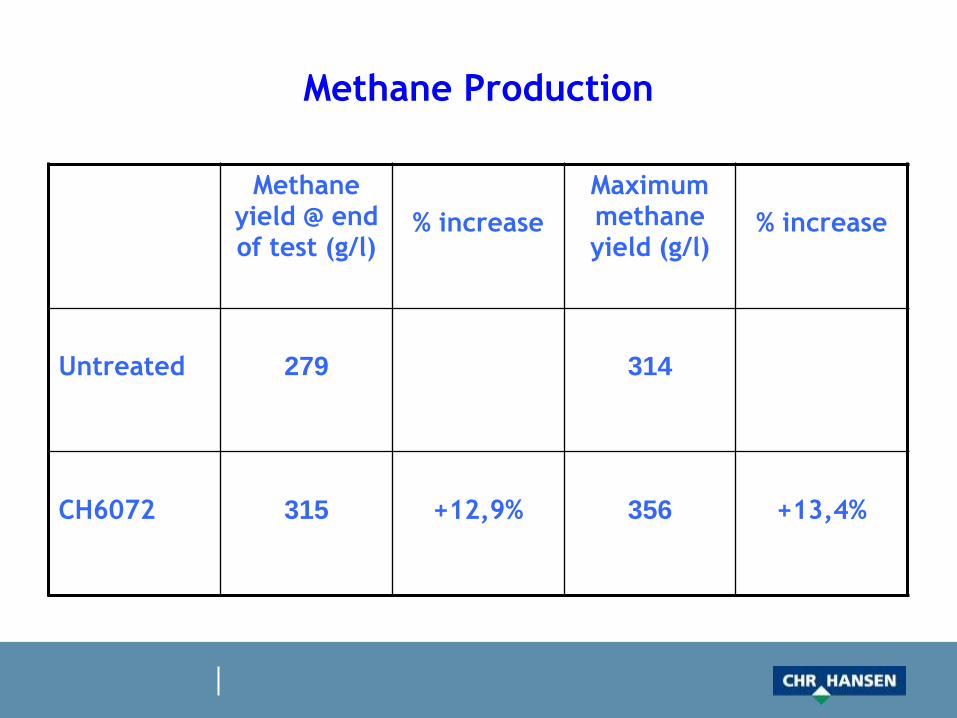
Methane Production
Methane yield @ end of test (g/l)
% increase
Maximum methane yield (g/l)
% increase
Untreated 279 314
CH6072 315 +12,9% 356 +13,4%
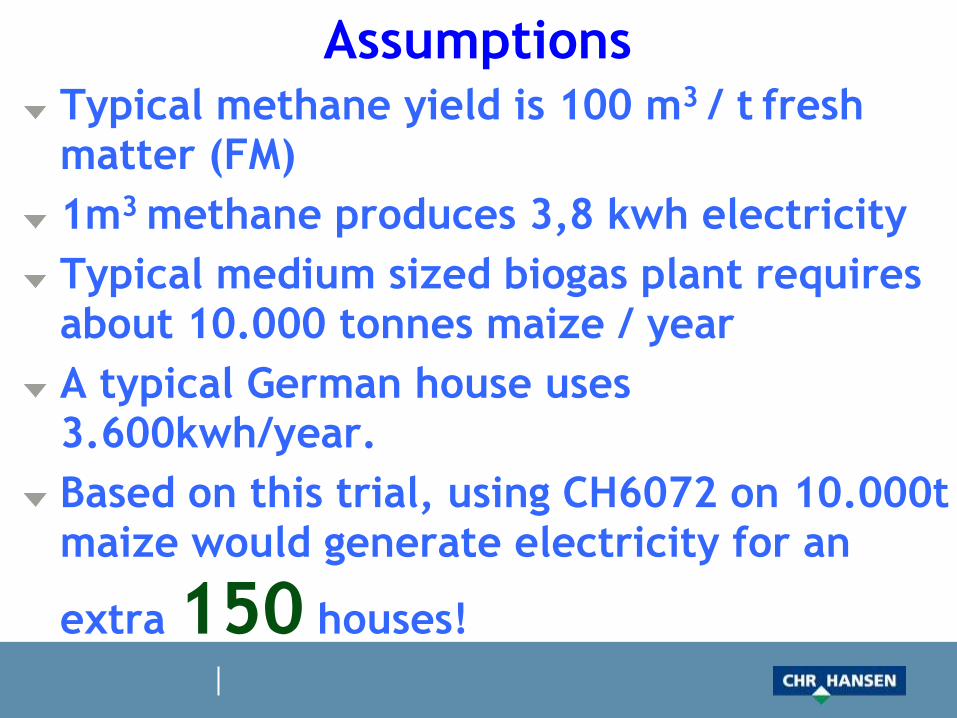
AssumptionsTypical methane yield is 100 m3 / t fresh matter (FM)
1m3 methane produces 3,8 kwh electricity
Typical medium sized biogas plant requires about 10.000 tonnes maize / year
A typical German house uses 3.600kwh/year.
Based on this trial, using CH6072 on 10.000t maize would generate electricity for an
extra 150 houses!
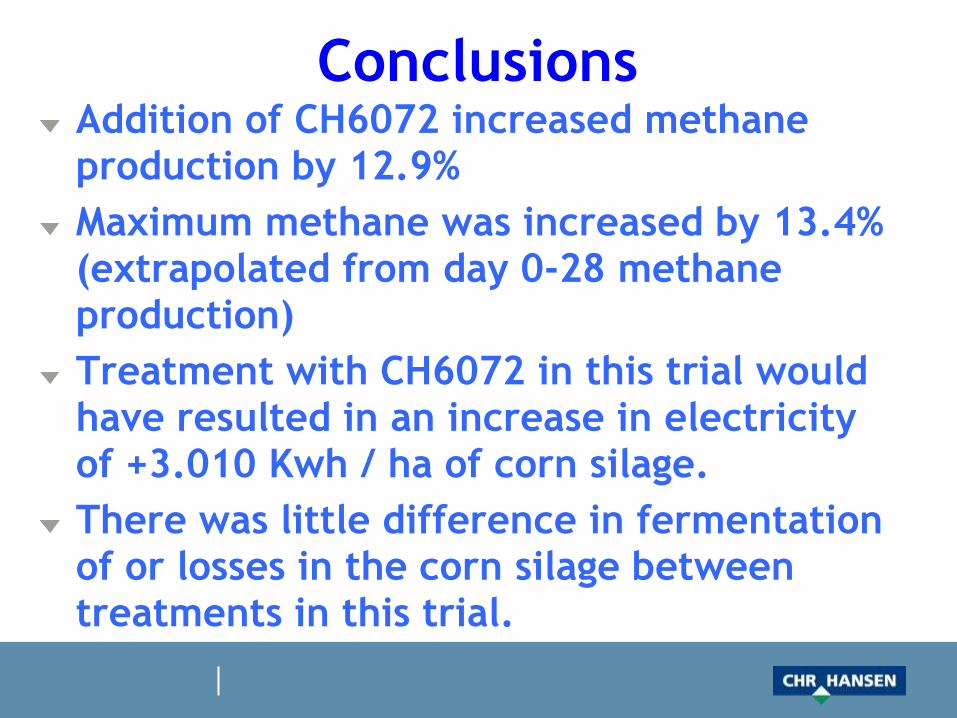
ConclusionsAddition of CH6072 increased methane production by 12.9%
Maximum methane was increased by 13.4% (extrapolated from day 0-28 methane production)
Treatment with CH6072 in this trial would have resulted in an increase in electricity of +3.010 Kwh / ha of corn silage.
There was little difference in fermentation of or losses in the corn silage between treatments in this trial.

Manure Lagoons
Manure Lagoon Research
Direct inoculation of dairy lagoons
DFM (swine):
Lab bench work
Bacteria used as a DFM and then
effect of manure lagoon
measured
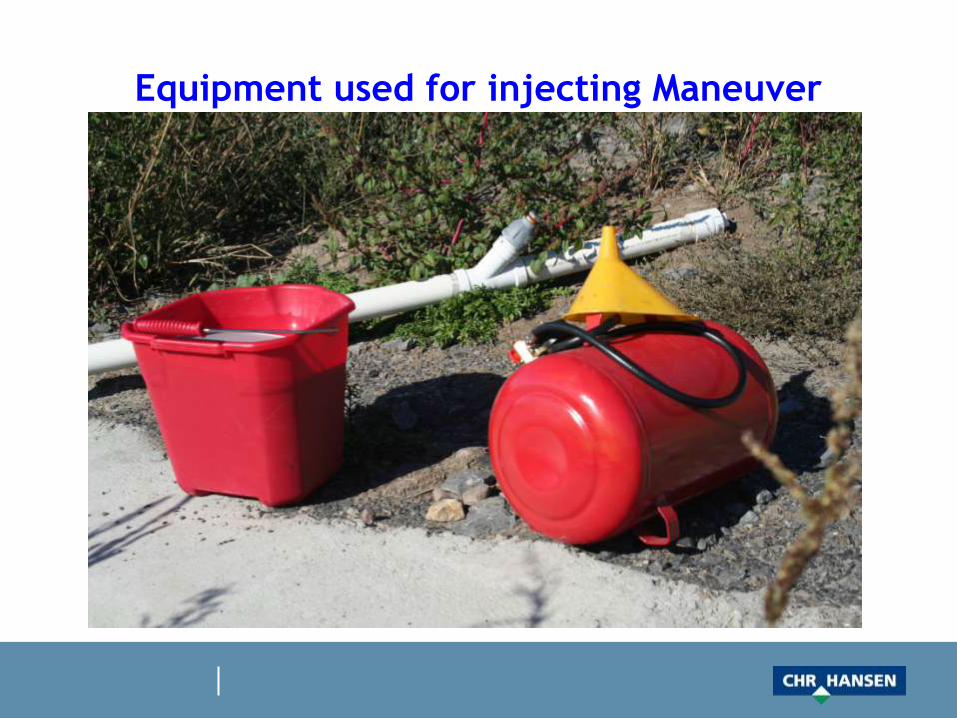
Equipment used for injecting Maneuver
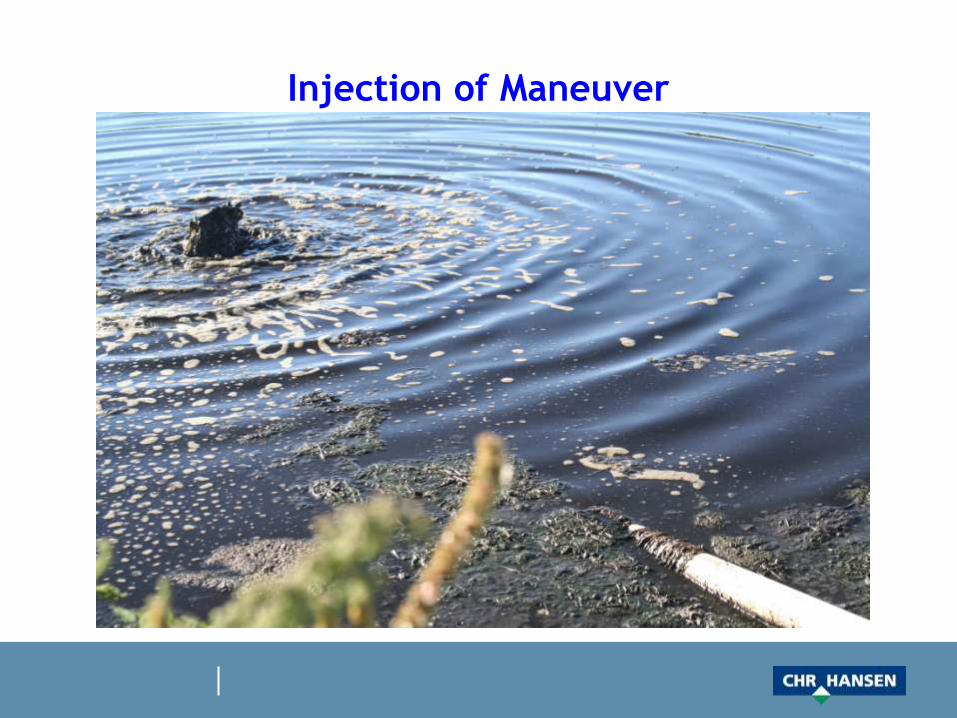
Injection of Maneuver
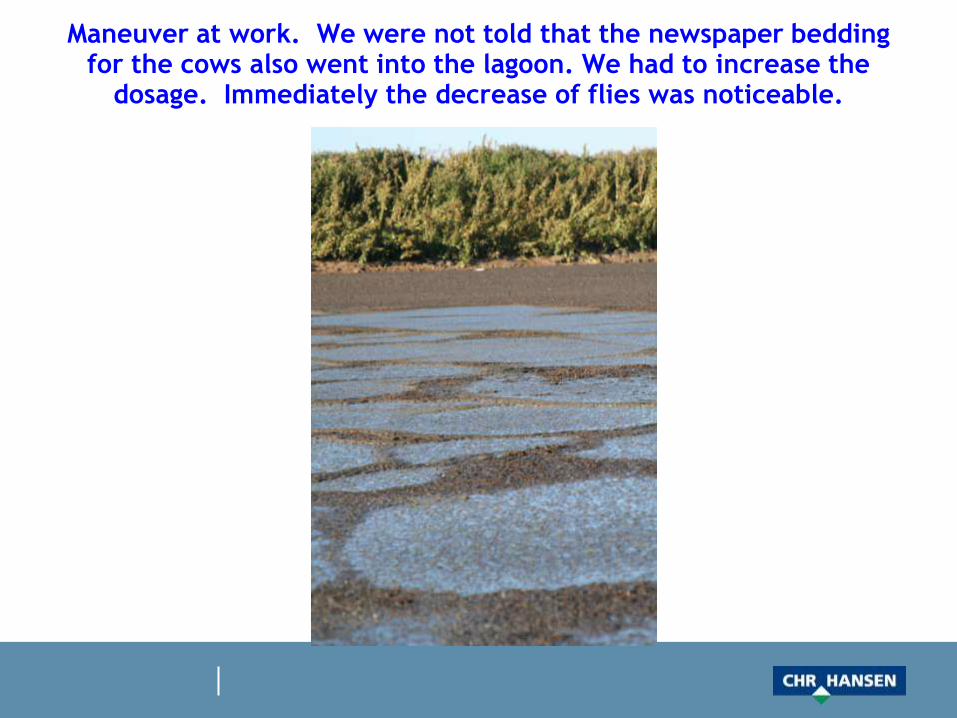
Maneuver at work. We were not told that the newspaper bedding for the cows also went into the lagoon. We had to increase the
dosage. Immediately the decrease of flies was noticeable.
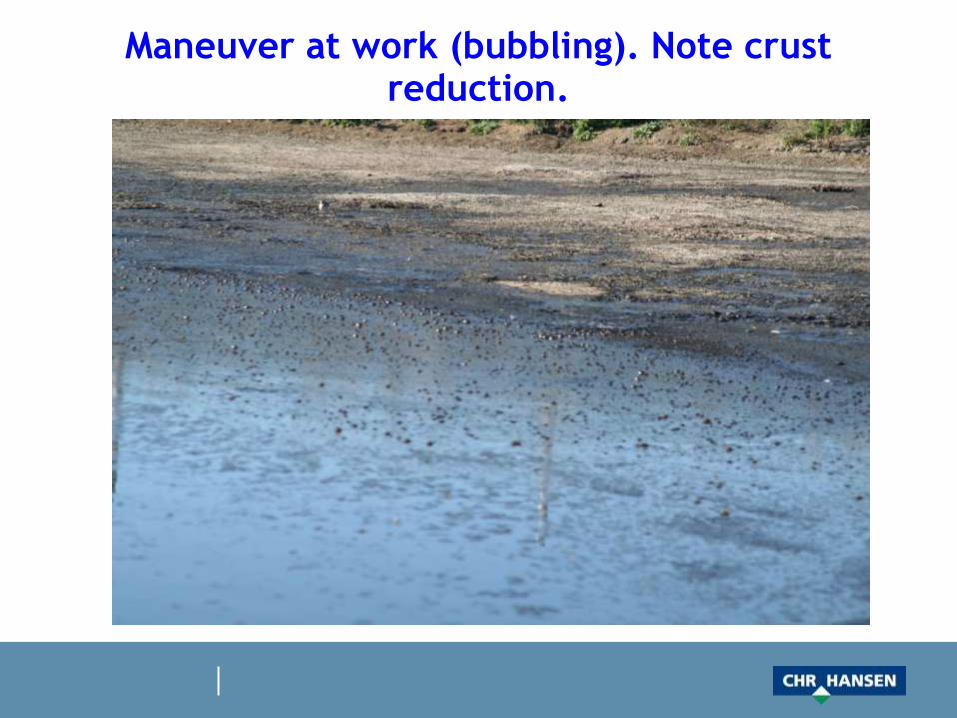
Maneuver at work (bubbling). Note crust reduction.

Maneuver at work. Note fence reflected on the cleanliness of surface
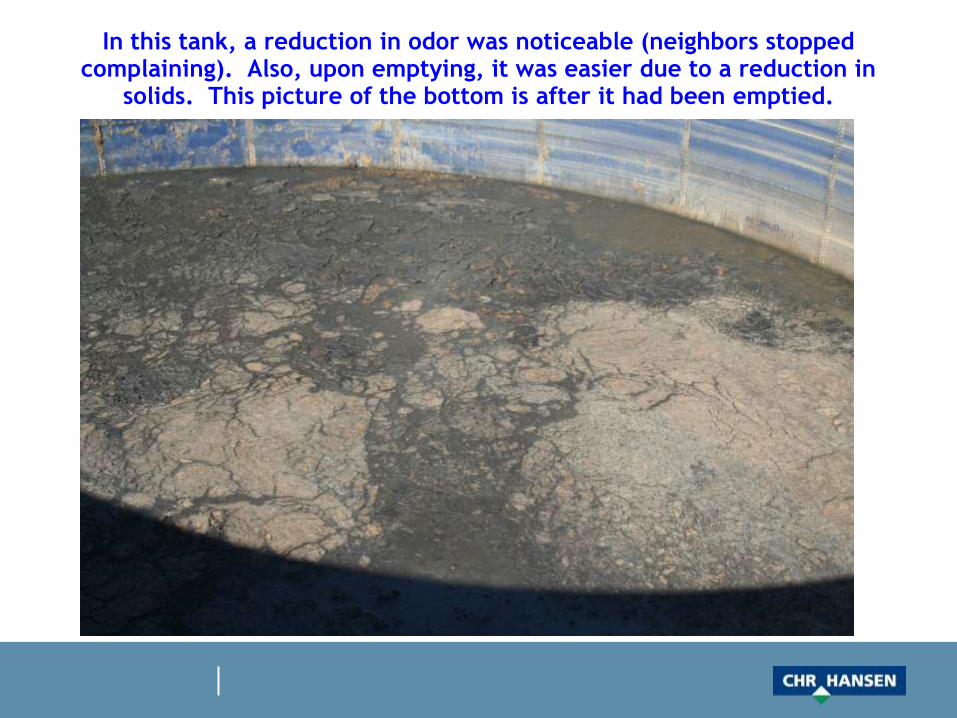
In this tank, a reduction in odor was noticeable (neighbors stopped complaining). Also, upon emptying, it was easier due to a reduction in
solids. This picture of the bottom is after it had been emptied.
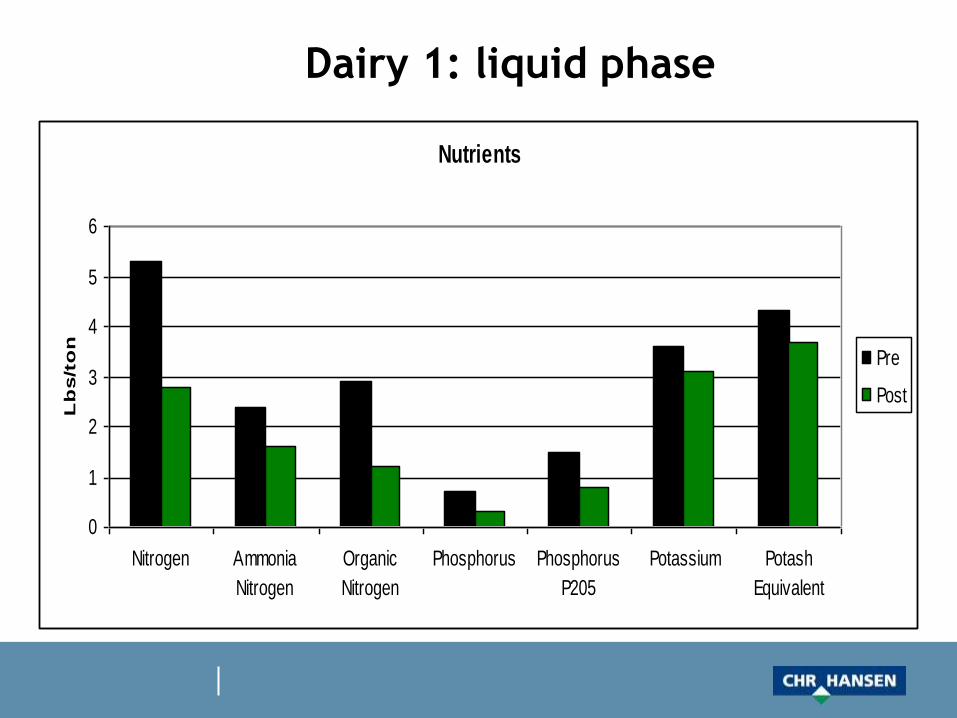
Dairy 1: liquid phase
Nutrients
0
1
2
3
4
5
6
Nitrogen Ammonia
Nitrogen
Organic
Nitrogen
Phosphorus Phosphorus
P205
Potassium Potash
Equivalent
Lb
s/t
on
Pre
Post
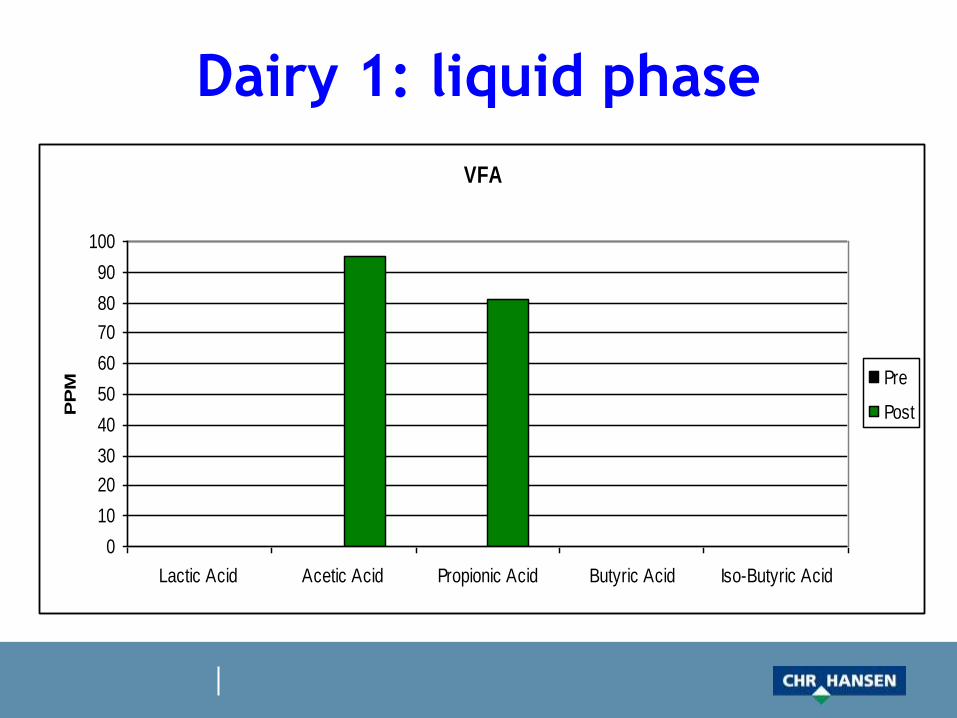
Dairy 1: liquid phase
VFA
0
10
20
30
40
50
60
70
80
90
100
Lactic Acid Acetic Acid Propionic Acid Butyric Acid Iso-Butyric Acid
PP
M Pre
Post
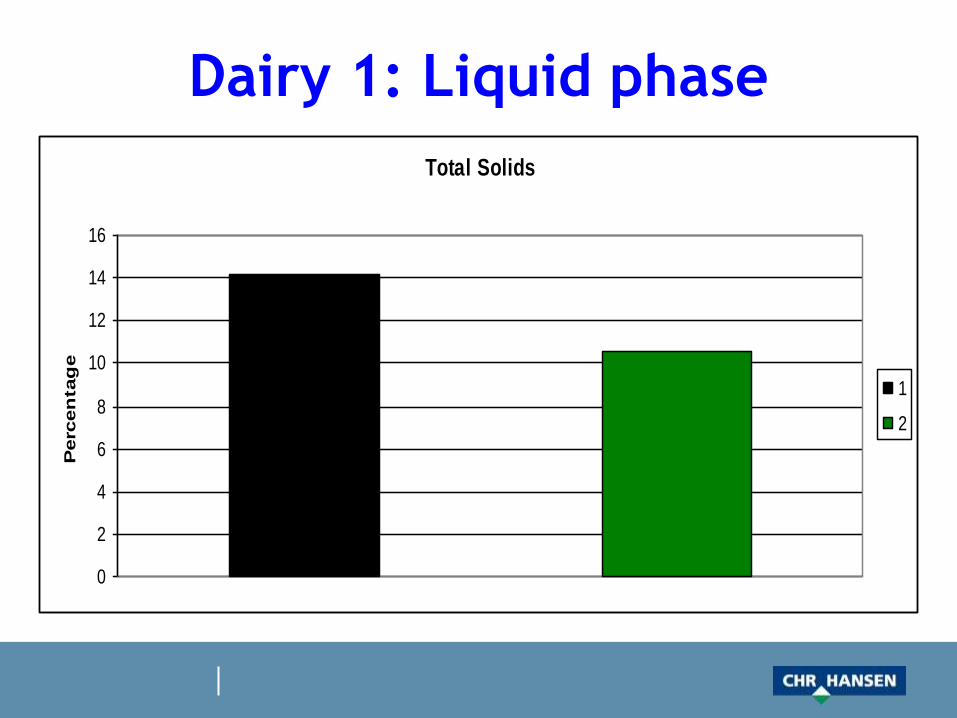
Dairy 1: Liquid phase
Total Solids
0
2
4
6
8
10
12
14
16
Perc
en
tag
e
1
2
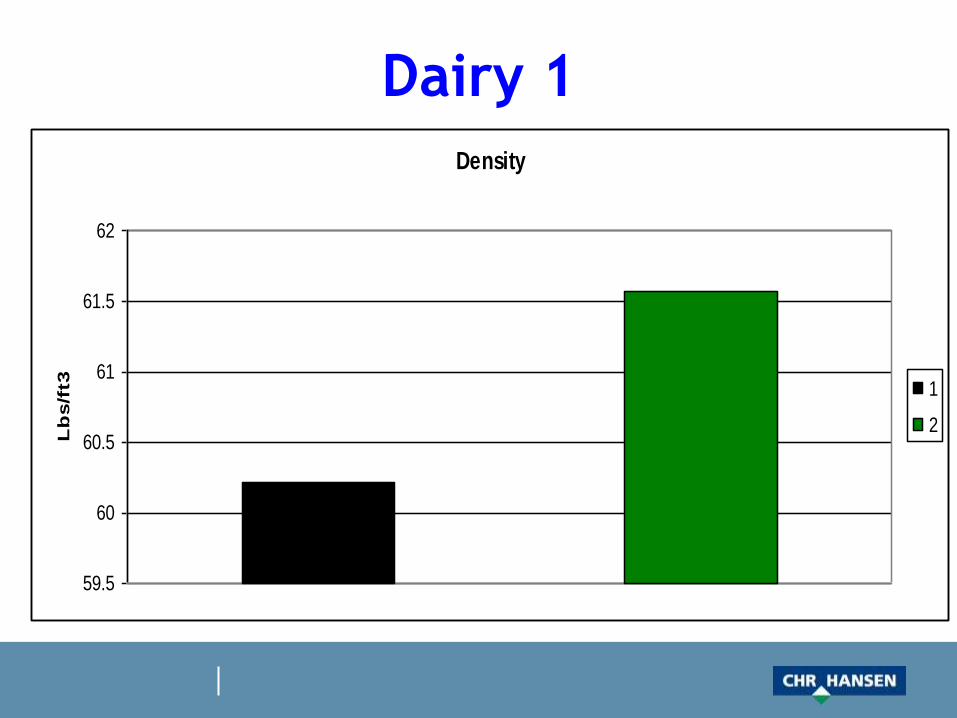
Dairy 1
Density
59.5
60
60.5
61
61.5
62
Lb
s/f
t3 1
2
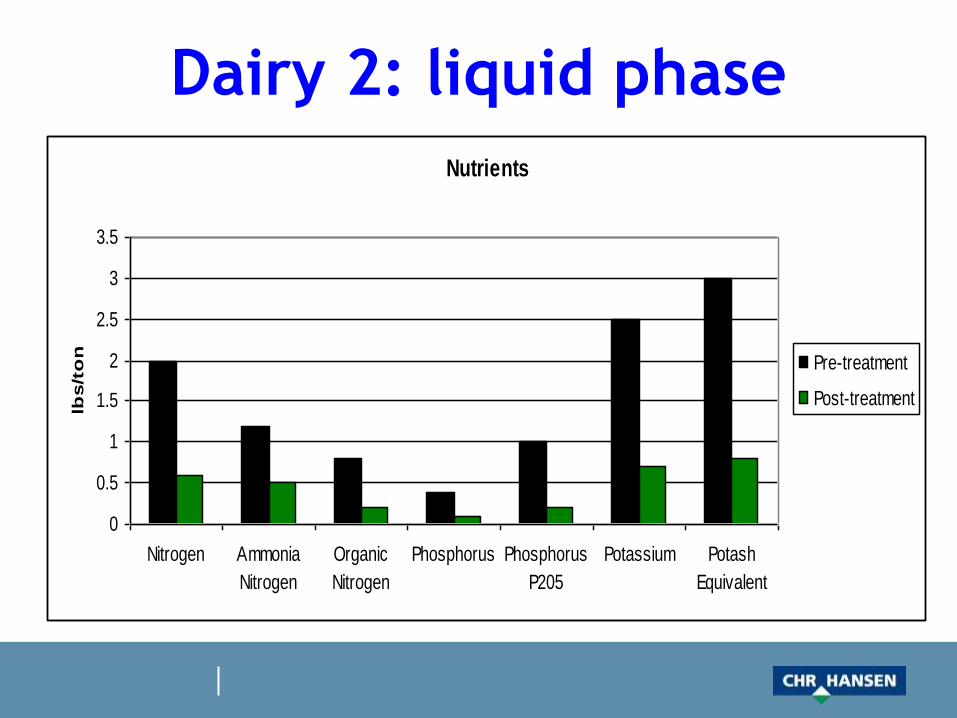
Dairy 2: liquid phase
Nutrients
0
0.5
1
1.5
2
2.5
3
3.5
Nitrogen Ammonia
Nitrogen
Organic
Nitrogen
Phosphorus Phosphorus
P205
Potassium Potash
Equivalent
lbs/t
on
Pre-treatment
Post-treatment
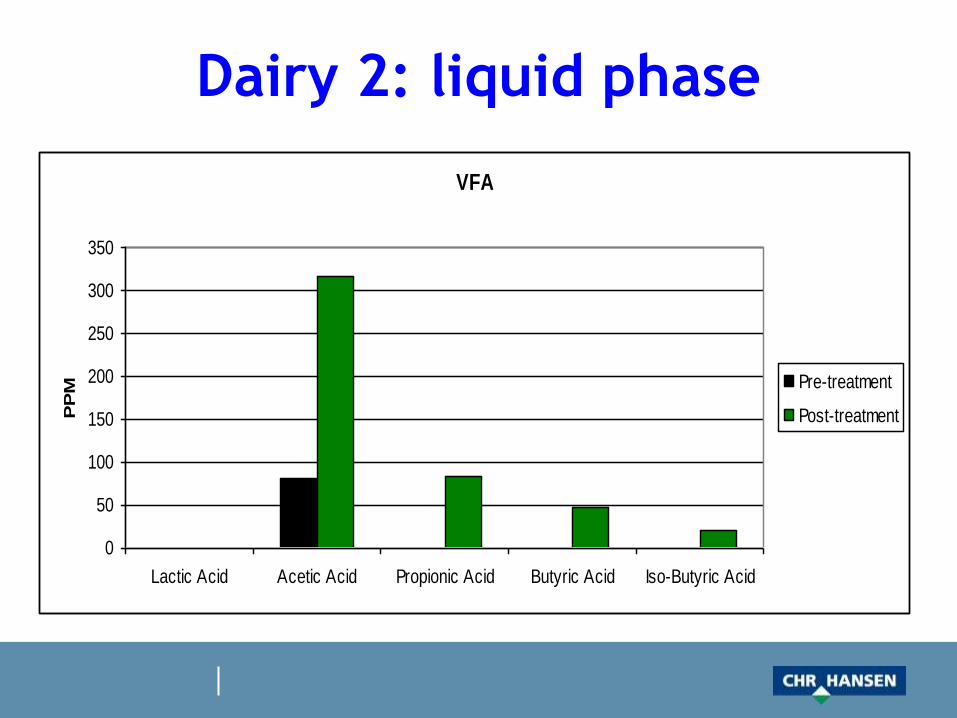
Dairy 2: liquid phase
VFA
0
50
100
150
200
250
300
350
Lactic Acid Acetic Acid Propionic Acid Butyric Acid Iso-Butyric Acid
PP
M Pre-treatment
Post-treatment
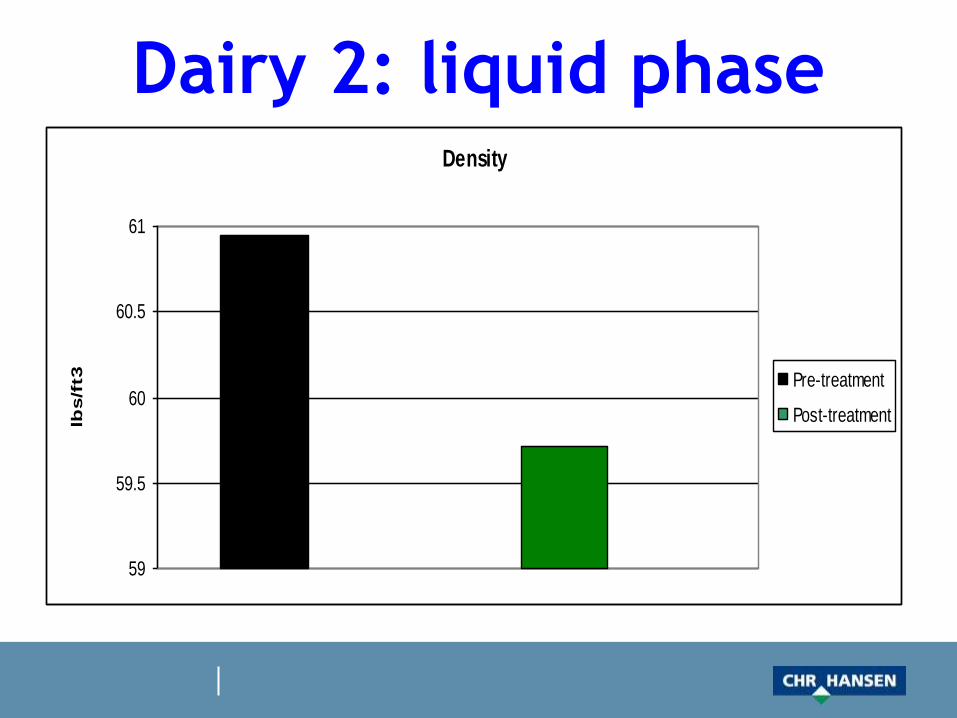
Dairy 2: liquid phaseDensity
59
59.5
60
60.5
61
lbs/f
t3 Pre-treatment
Post-treatment
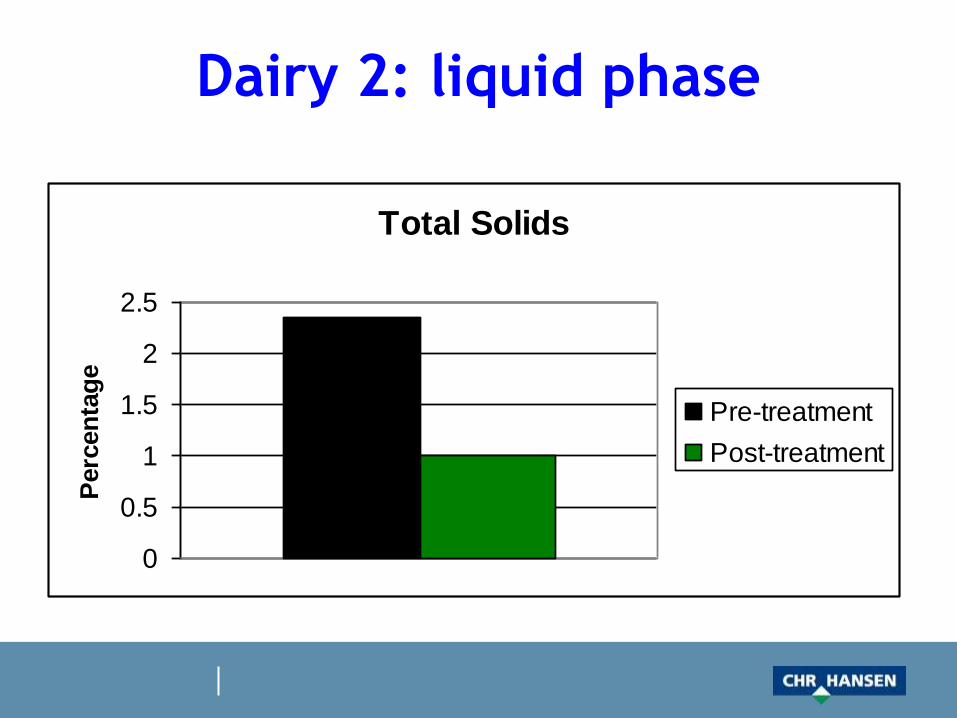
Dairy 2: liquid phase
Total Solids
0
0.5
1
1.5
2
2.5
Perc
en
tag
e
Pre-treatment
Post-treatment
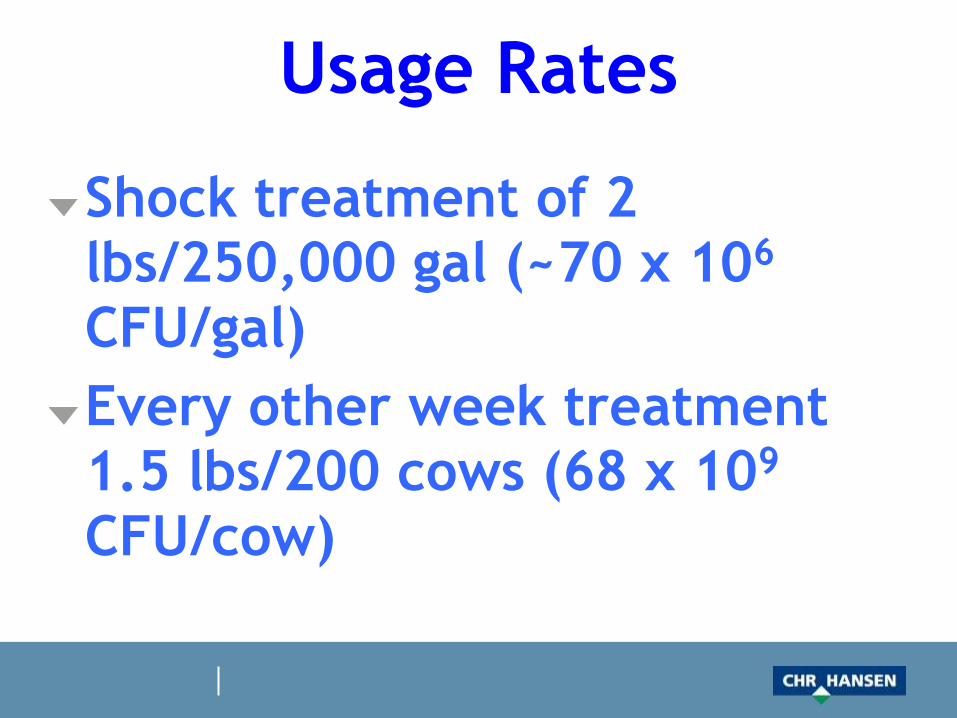
Usage Rates
Shock treatment of 2 lbs/250,000 gal (~70 x 106
CFU/gal)
Every other week treatment 1.5 lbs/200 cows (68 x 109
CFU/cow)

Lab Bench Work
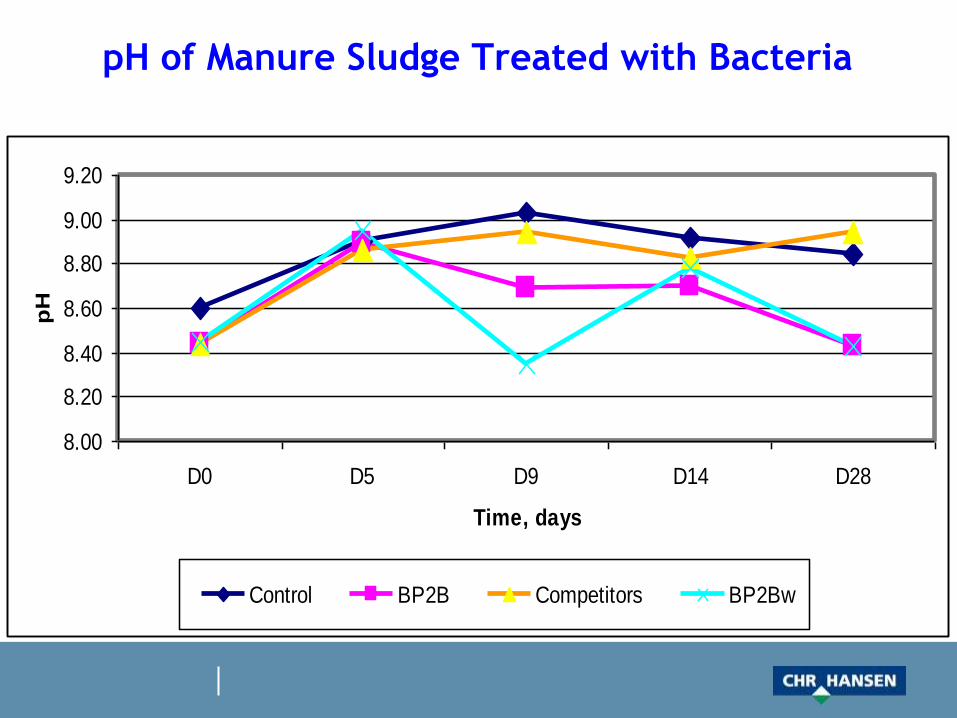
8.00
8.20
8.40
8.60
8.80
9.00
9.20
D0 D5 D9 D14 D28
Time, days
pH
Control BP2B Competitors BP2Bw
pH of Manure Sludge Treated with Bacteria
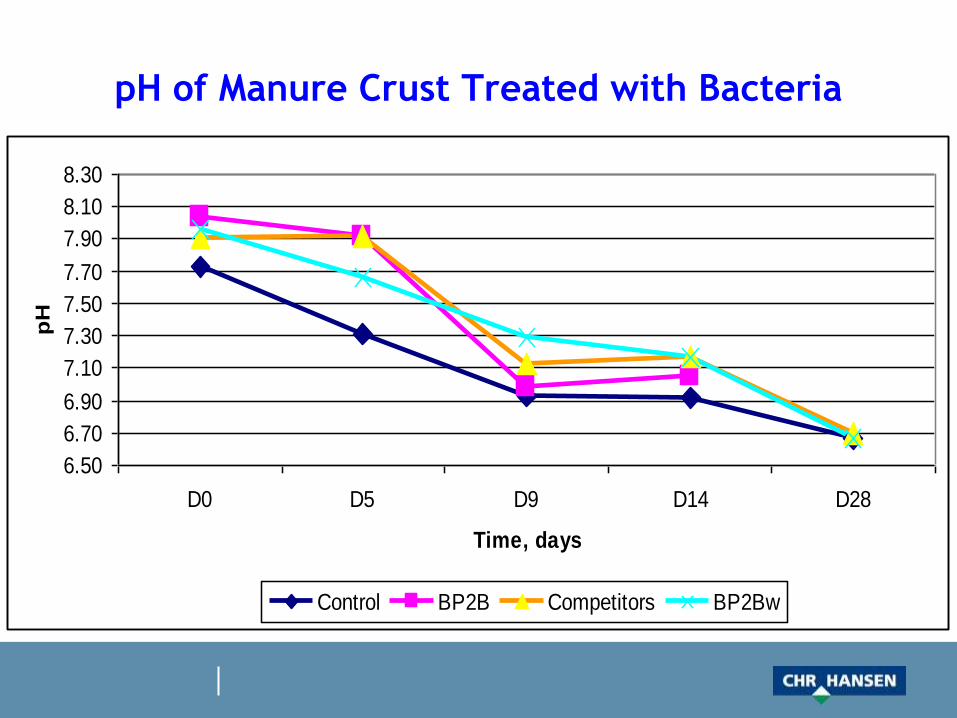
pH of Manure Crust Treated with Bacteria
6.50
6.70
6.90
7.10
7.30
7.50
7.70
7.90
8.10
8.30
D0 D5 D9 D14 D28
Time, days
pH
Control BP2B Competitors BP2Bw
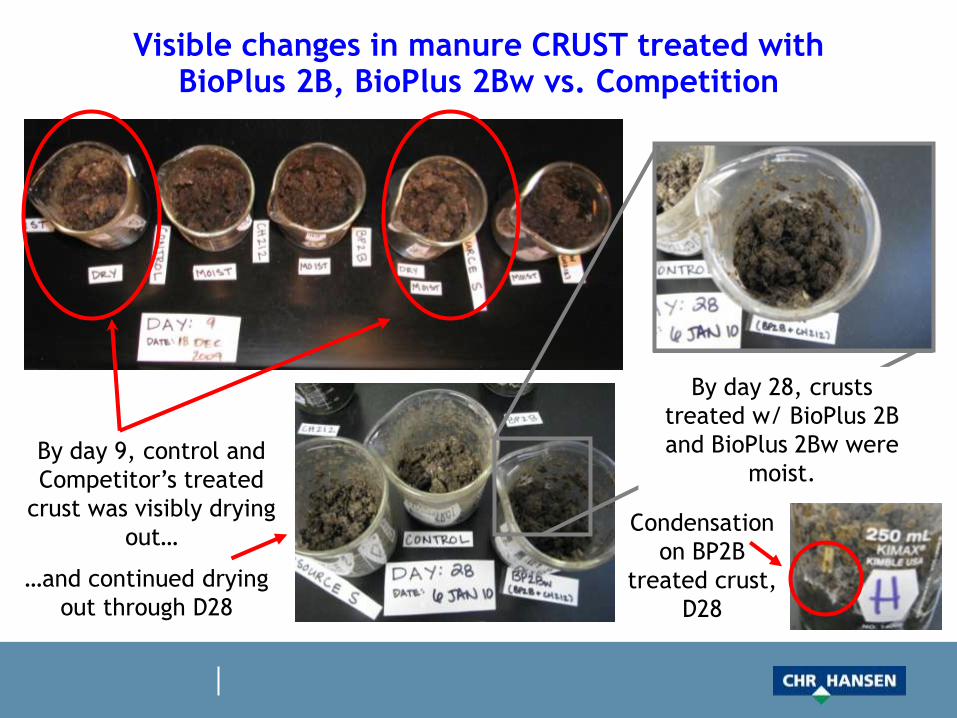
By day 9, control and
Competitor’s treated
crust was visibly drying
out… Condensation
on BP2B
treated crust,
D28
Visible changes in manure CRUST treated with BioPlus 2B, BioPlus 2Bw vs. Competition
By day 28, crusts
treated w/ BioPlus 2B
and BioPlus 2Bw were
moist.
…and continued drying
out through D28
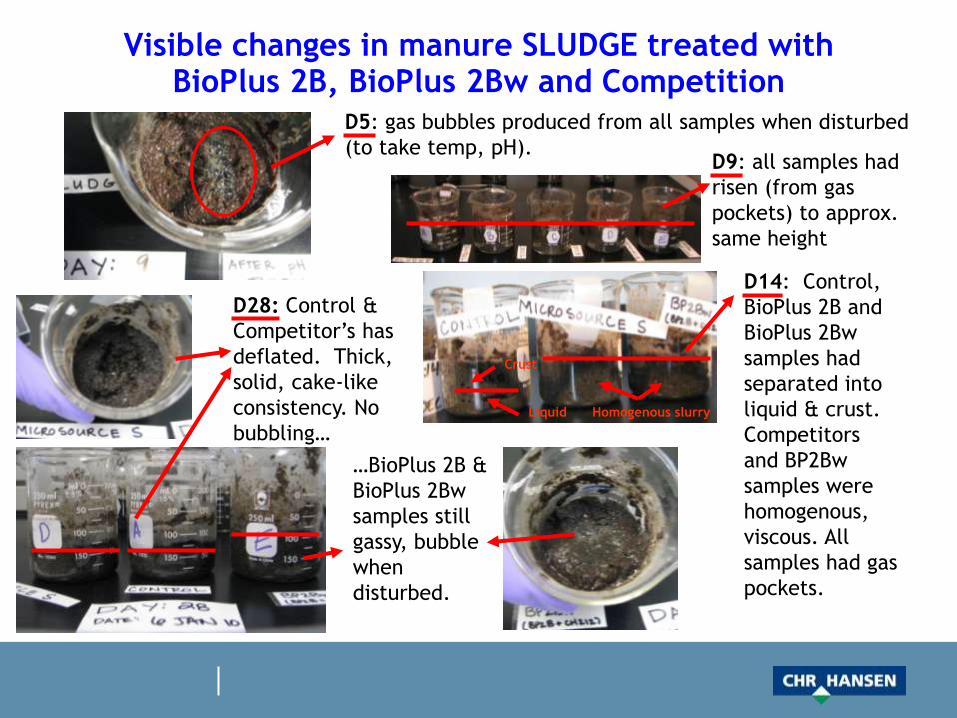
D5: gas bubbles produced from all samples when disturbed
(to take temp, pH). D9: all samples had
risen (from gas
pockets) to approx.
same height
D14: Control,
BioPlus 2B and
BioPlus 2Bw
samples had
separated into
liquid & crust.
Competitors
and BP2Bw
samples were
homogenous,
viscous. All
samples had gas
pockets.
Liquid
Crust
Homogenous slurry
D28: Control &
Competitor’s has
deflated. Thick,
solid, cake-like
consistency. No
bubbling…
…BioPlus 2B &
BioPlus 2Bw
samples still
gassy, bubble
when
disturbed.
Visible changes in manure SLUDGE treated with BioPlus 2B, BioPlus 2Bw and Competition
Comments from Microbiologist on the Crust
Control crust was dry by D9; flies present at D28
Competitor’s product treated crust was dry by D9; very little difference from control but w/o flies
CH BP2B moistest, no flies and rotten egg smell
CH BP2Bw 2nd moistest, no flies, no smells
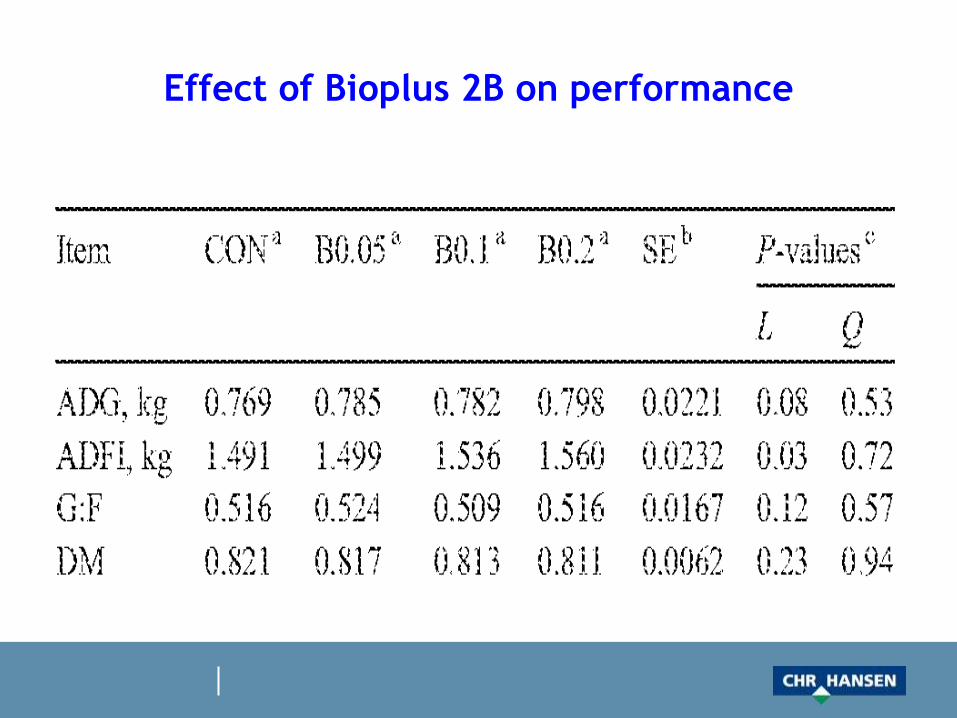
Effect of Bioplus 2B on performance
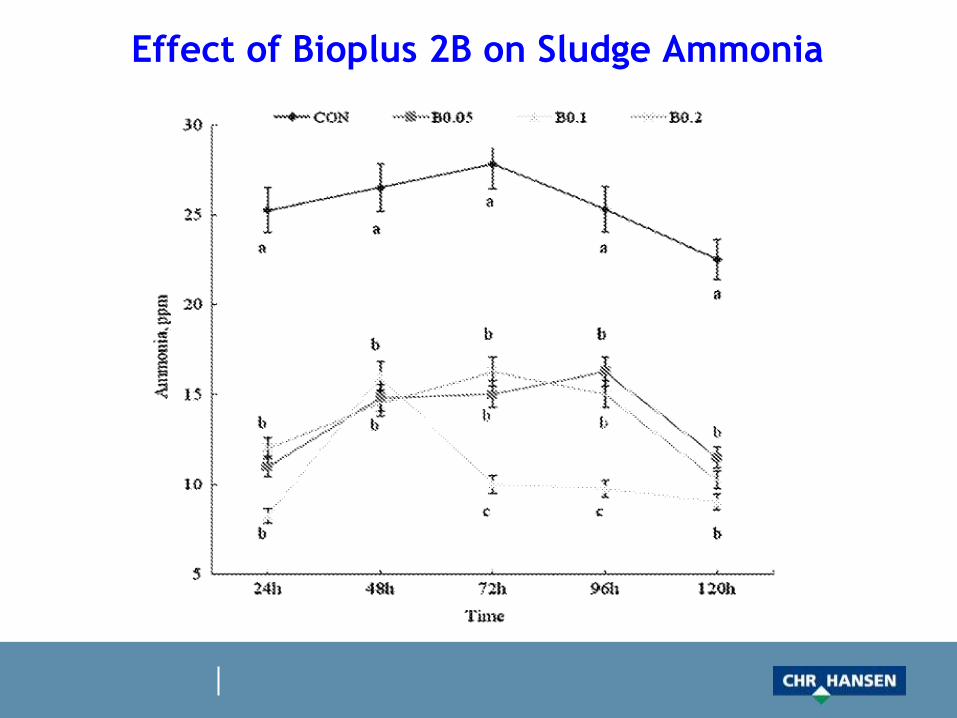
Effect of Bioplus 2B on Sludge Ammonia
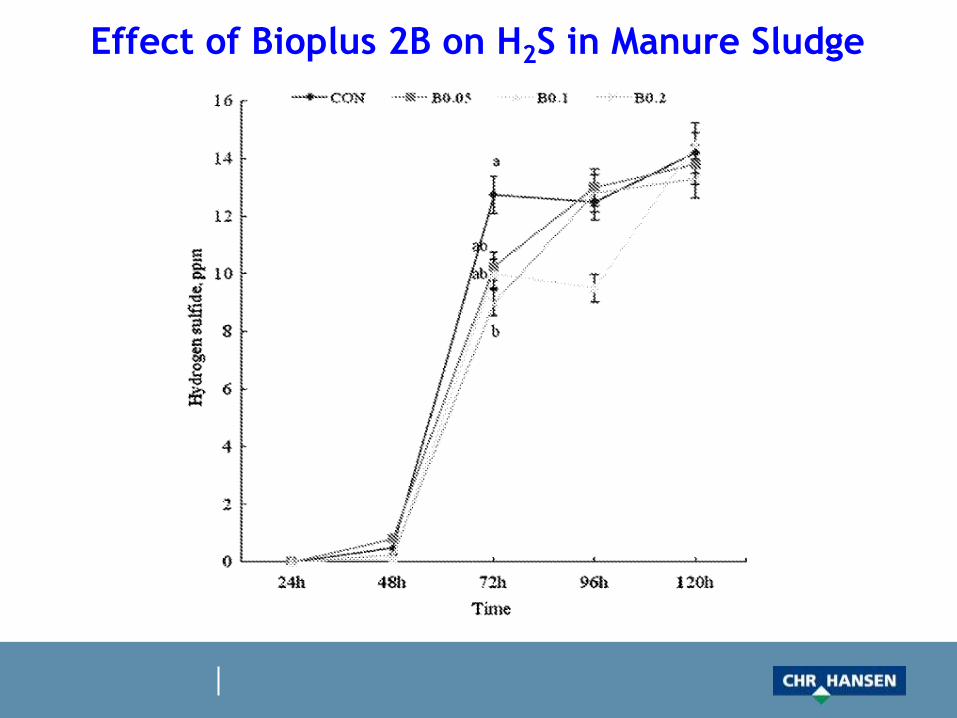
Effect of Bioplus 2B on H2S in Manure Sludge
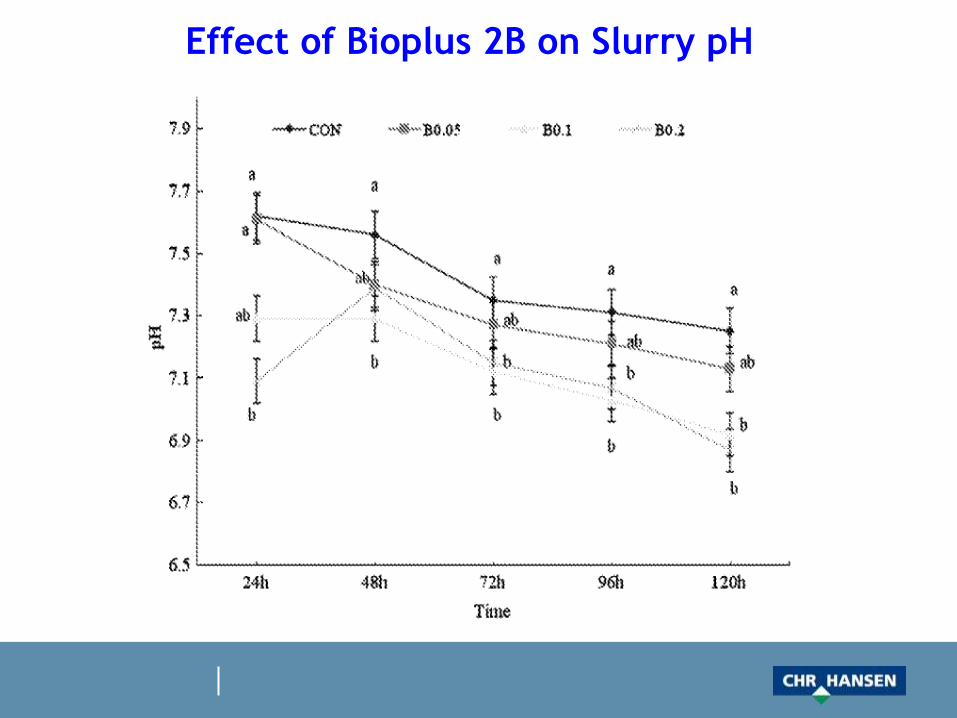
Effect of Bioplus 2B on Slurry pH
Conclusions
Improvements in pig performance
Decreased ammonia content
No changes in hydrogen sulfide or mercaptan
Take Home Messages
Bacteria are a tool to manage manure
Management conditions, including animal diet, influence success of microbial aids
Research indicates:
Ammonia control
Reduction in DM
Re-distribution of P
Fly control
Odor reduction
May be supplemented as a DFM in monogastrics