Embed Size (px)
Citation preview

Microarray Analysis Using R/Bioconductor
Reddy Gali, [email protected]@rt.med.harvard.edu
http://catalyst.harvard.edu

Agenda
• Introduction to microarrays• Workflow of a gene expression microarray experiment • Publishing microarray data (MIAME format)• Microarray experimental design• Public microarray databases• Microarray preprocessing - Quality control and Diagnostic
analysis
2
Agenda
3
• Introduction to R/Bioconductor• Installation of R and Bioconductor Packages• General data analysis and strategies• Data analysis using AffylmGUI

Microarray Applications
4
•Analyze and compare patterns of gene expression- before and after an intervention
- between tissue types- between transgenic strains- in neighboring cells (laser capture
microdissection)• Find DNA copy-number variations• SNP detection • Tool for genotyping• High throughput screening tool for drug
discovery • Elucidate gene function (RNAi
microarrays; Silva et al., PNAS 2004)• Investigate interactions between DNA
and protein (ChIP on Chip)

Workflow of Gene Expression
5
Biological question Experimental design
Tissue / sample preparation
Extraction of Total RNA
Microarray hybridization & processing
Image analysis
Probe amplification & labeling
Data analysisExpression measures - Normalization - Statistical Filtering - Clustering - Pathway analysis
Biological Verification
QC
QC
QC
QC
QC

Pitfalls of Microarray Experiment
6
• Gene expression changes detected by microarray analysis cannot be validated by other methods
- Inadequate design
- Data quality is low
- Statistical approach is not adequate - Expression level of gene is below detection limit
- Change in gene expression is small
- Microarray detection probe is not specific or not sensitive

Microarray Processing
7

Two color vs Single color
8
Homemade Microarray Affymetrix GeneChip
Tissue
Total RNA
Double-strandedcDNA
Biotin-labeledcRNA
Raw Data Output
Hybridization and Staining
in vitro transcription
cDNA synthesis
normal diseased
First-strand cDNAsynthesis
Cy5 Cy3
MixingHybridization
Cy3 or Cy5labeled cDNA
Tissue
Total RNA
Raw Data Output
normal diseased
Expression Ratio to Absolute Expression Values

Affymetrix probe design
9Lipshutz et al; 1999; Nature Genetics, 21(1):20-24
PMMM
11 Probe pairs / Probe SetMultiple Probe Sets / Gene

Questions usually asked
10
• What kind of technology or microarrays I have to use• How many replicates do I need• What is a real replicate• Do I need statistical advice• Should I do technical replicate• Should I do dye swap• Should I pool my samples• How do I analyze my dataset• What software should I use
Design of Microarray Experiment
11
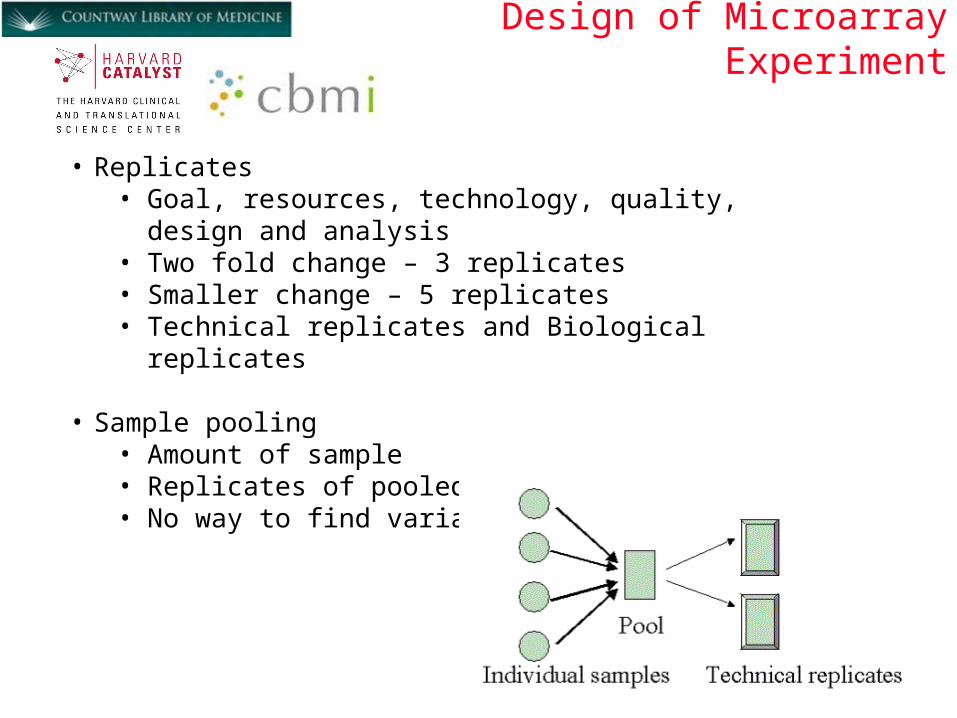
• Replicates• Goal, resources, technology, quality, design and
analysis• Two fold change – 3 replicates • Smaller change – 5 replicates• Technical replicates and Biological replicates
• Sample pooling• Amount of sample• Replicates of pooled sample• No way to find variance between samples

MIAME- How to publish
12
Minimum Information About a Microarray Experiment (MIAME)- www.mged.org

MIAME – Check list
13
• Type of experiment: for example, is it a comparison of normal vs. diseased tissue, a time course, or is it designed to study the effects of a gene knock-out?
• Experimental factors: the parameters or conditions tested, such as time, dose, or genetic variation.
• The number of hybridizations performed in the experiment.
• The type of reference used for the hybridizations, if any.
• Hybridization design: if applicable, a description of the comparisons made in each hybridization, whether to a standard reference sample, or between experimental samples. An accompanying diagram or table may be useful.
• Quality control steps taken: for example, replicates or dye swaps.

MIAME – Check list
14
• The origin of the biological sample (for instance, name of the organism, the provider of the sample) and its characteristics: for example, gender, age, developmental stage, strain, or disease state.
• Manipulation of biological samples and protocols used: for example, growth conditions, treatments, separation techniques.
• Protocol for preparing the hybridization extract: for example, the RNA or DNA extraction and purification protocol.
• Labeling protocol(s)
• External controls (spikes)

MIAME – Check list
15
• Type of scanning hardware and software used: this information is appropriate for a materials and methods section.
• Type of image analysis software used: specifications should be stated in the materials and methods.
• A description of the measurements produced by the image-analysis software and a description of which measurements were used in the analysis.
• The complete output of the image analysis before data selection and transformation (spot quantitation matrices).
• Data selection and transformation procedures.
• Final gene expression data table(s) used by the authors to make their conclusions after data selection and transformation (gene expression data matrices).

Gene Expression Omnibus- GEO
16

Public Microarray Databases
17
• BodyMap - http://bodymap.ims.u-tokyo.ac.jp/• SMD - http://genome-www5.stanford.edu/• RIKEN - http://read.gsc.riken.go.jp/• MGI - http://www.informatics.jax.org/• GEO - http://www.ncbi.nlm.nih.gov/geo/• CIBEX - http://cibex.nig.ac.jp/index.jsp• ArrayExpress - http://www.ebi.ac.uk/microarray-as/ae/

Microarray Platforms
18
• Agilent Microarrays 60-mer format
• Codelink Bioarrays 30-mer format
• Affymetrix GeneChips 25-mer format
• Illumina Beadchips
• NimbleGen 60-mer format

RNA quality
• OD 260/280 1.8-2• Electropherograms: degradation, rRNA peaks• Bio-analyzer graphs

Microarray data Mining
20
Biological question Experimental design
Microarray experiment
Biological verification/interpretation
Estimation/Testing
Clustering
Classification/PredictionData analysis
Expression quantification
Normalization
Image analysis
Pre-processing

Microarray data Mining
21
CDF / CEL
Quality assessment Background correction
probe level normalization probe set summary
Log ratiosLog intensities
Identify genesClustering etc

Microarrays – Image Inspection
22
Microarray: - Visual inspection of the chip Scratches, bubbles, uneven hybridization outlier detection

Diagnostic plots-RNA degradation
23

Box Plots of unnormalized data
24

Raw vs Normalized data
25
Raw Data Normalized Data

Histograms of unnormalized data
26

QC stats
27

Why Normalize
28
• It adjusts the individual hybridization intensities to balance them appropriately so that meaningful biological comparisons can be made.
• Unequal quantities of starting RNA• Differences in labeling or detection efficiencies between the
fluorescent dyes used
• Systematic biases in the measured expression levels. • Sample preparationSample preparation• Variability in hybridizationVariability in hybridization• Spatial effectsSpatial effects• Scanner settingsScanner settings• Experimenter biasExperimenter bias

Data analysis workflow
29

Free Software – Data analysis
30
• BioconductorBioconductor– is an open source and open development software
project to provide tools for the analysis and comprehension of genomic data.
• TMEV 4.0TMEV 4.0– is an application that allows the viewing of
processed microarray slide representations and the identification of genes and expression patterns of interest.
• dCHIPdCHIP– DNA-Chip Analyzer (dChip) is a software package
for probe-level (e.g. Affymetrix platform) and high-level analysis of gene expression microarrays and SNP microarrays.

R / Bioconductor
31
• R and Bioconductor packages• R (http://cran.r-project.org/ )is a comprehensive
statistical environment and programming language for professional data analysis and graphical display.
• Bioconductor (http://www.bioconductor.org/) is an open source and open development software project for the analysis of microarray, sequence and genome data.
• More 300 Bioconductor packages.• http://faculty.ucr.edu/~tgirke/Documents/R_BioC
ond/R_BioCondManual.html
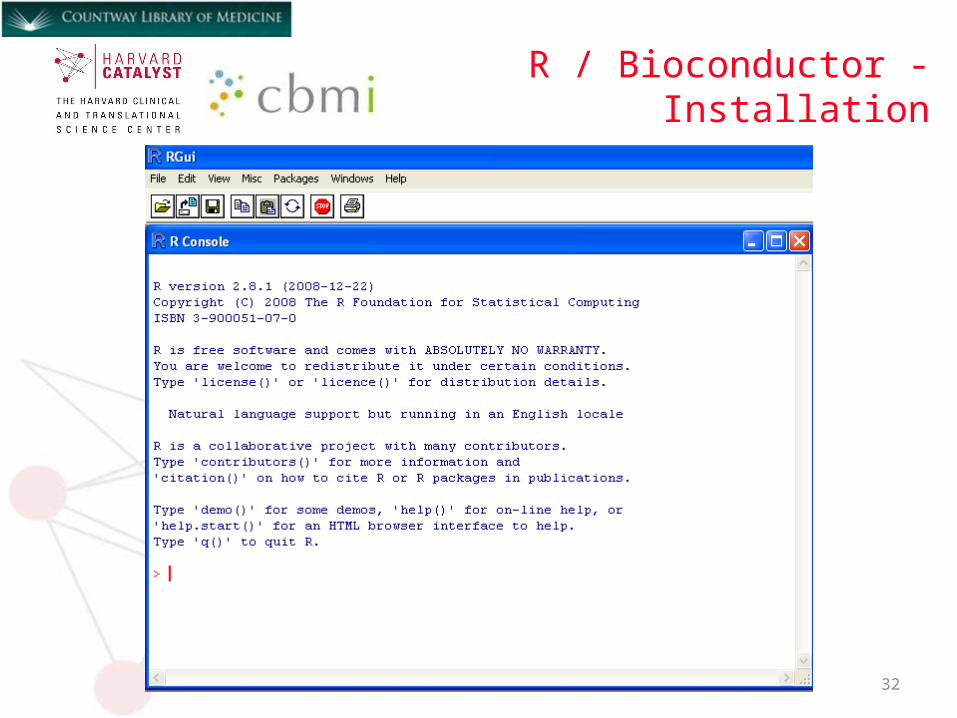
R / Bioconductor - Installation
32
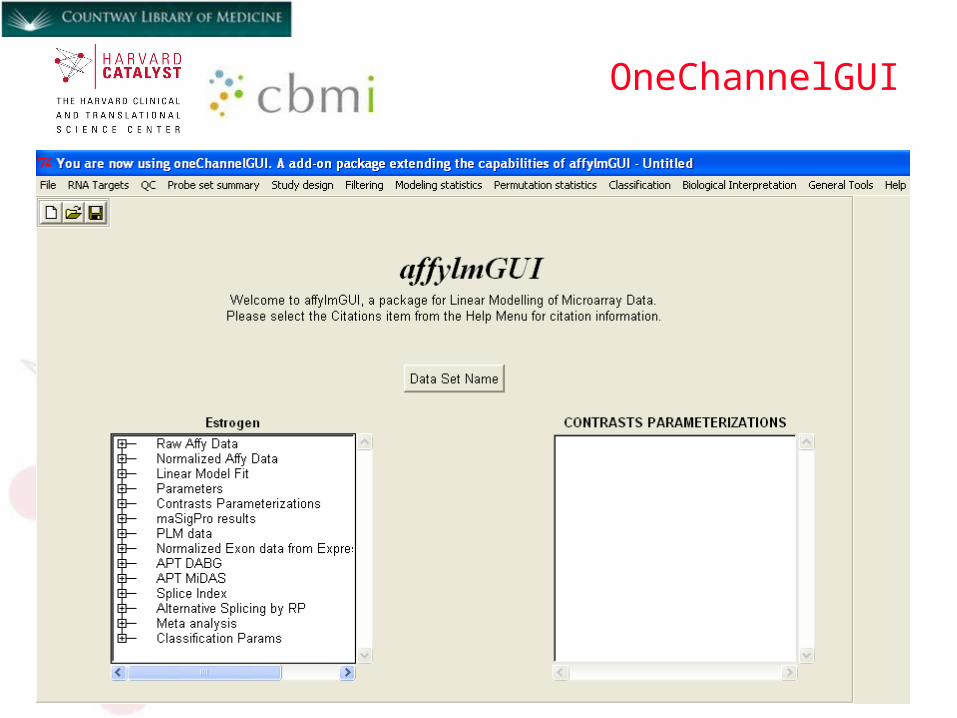
OneChannelGUI
33
• A graphical interface (GUI) for Bioconductor libraries to be used for quality control, normalization, filtering, statistical validation and
data mining for single channel microarrays • Affymetrix IVT, Human Gene 1.0 ST and exon
arrays are implemented • OneChannelGUI is an add-on Bioconductor
package providing a new set of functions extending the capability of the affylmGUI
package.

TCL and Tk pacakges
34
• ActiveTcl is ActiveState's distribution of Tcl. It is most commonly used for rapid prototyping,
scripted applications and GUIs. • Install Tcl - http://www.activestate.com/activetcl/• Tcl/Tk packages, BWidget and Tktable
• Install in C:\Tcl Directory

Installing R/ Active Tcl
35
• http://cran.r-project.org/• http://www.activestate.com/activetcl/
Installing AffylmGUI packagesfor Affymetrix data
36
• install.packages("affylmGUI",contriburl="http://
bioinf.wehi.edu.au/affylmGUI") • source("http://www.bioconductor.org/biocLite.R") • biocLite("affylmGUI", dependencies=TRUE)• biocLite("affylmGUI")• biocLite("tkrplot")• biocLite("affyPLM")• biocLite("R2HTML")• biocLite("xtable")
• library(affylmGUI)

AffylmGUI Browser
37

OneChannelGUI Installation
38
• source("http://www.bioconductor.org/biocLite.R")• biocLite("oneChannelGUI")
• biocLite("oneChannelGUI ", dependencies=TRUE)• library(oneChannelGUI)
OneChannelGUI
39

Target File creation
40
• Create, with excel, Create, with excel, a tab delimited filea tab delimited file named targets.txt named targets.txt• Targets file is made of three columns with the following Targets file is made of three columns with the following
header:header:• Name, FileName, TargetName, FileName, Target• In column In column NameName place a brief name (e.g. c1, c2, etc) place a brief name (e.g. c1, c2, etc)• In column In column FileNameFileName place the name of the place the name of the
corresponding .CEL filecorresponding .CEL file• In column In column TargetTarget place the experimental conditions (e.g. place the experimental conditions (e.g.
control, treatment, etc)control, treatment, etc)• Place targets.txt and CEL files into a folder (directory)Place targets.txt and CEL files into a folder (directory)
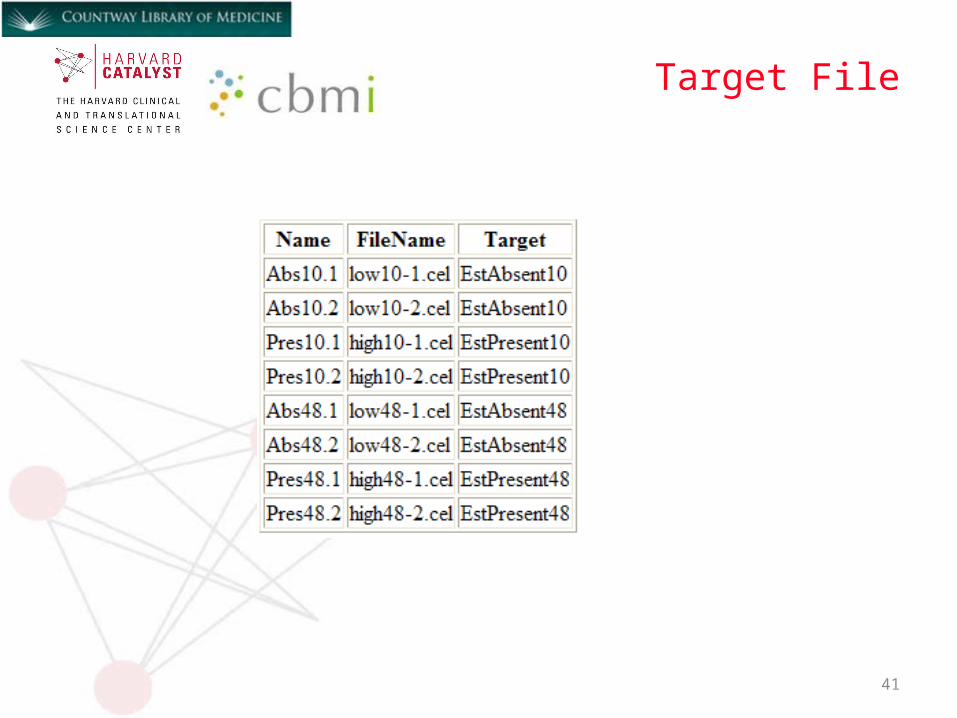
Target File
41

Working with OnechannelGUI
42

Working with OnechannelGUI
43
A
Click on “File” to start a new projectClick on “File” to start a new project
B
Select working directory that has the .CEL files and targets.txt file
Select working directory that has the .CEL files and targets.txt file
Click on “New” to start a new projectClick on “New” to start a new project
C
D
Selected 3’IVT arraysSelected 3’IVT arrays

Working with OnechannelGUI

Working with OnechannelGUI
45
NormalizationNormalization FilteringFiltering StatisticalStatisticalanalysisanalysis
AnnotationAnnotationBiological Biological KnowledgeKnowledgeextractionextraction
QualityQualitycontrolcontrol

Quality Control plots
46
Click on Quality Control menuClick on Quality Control menu
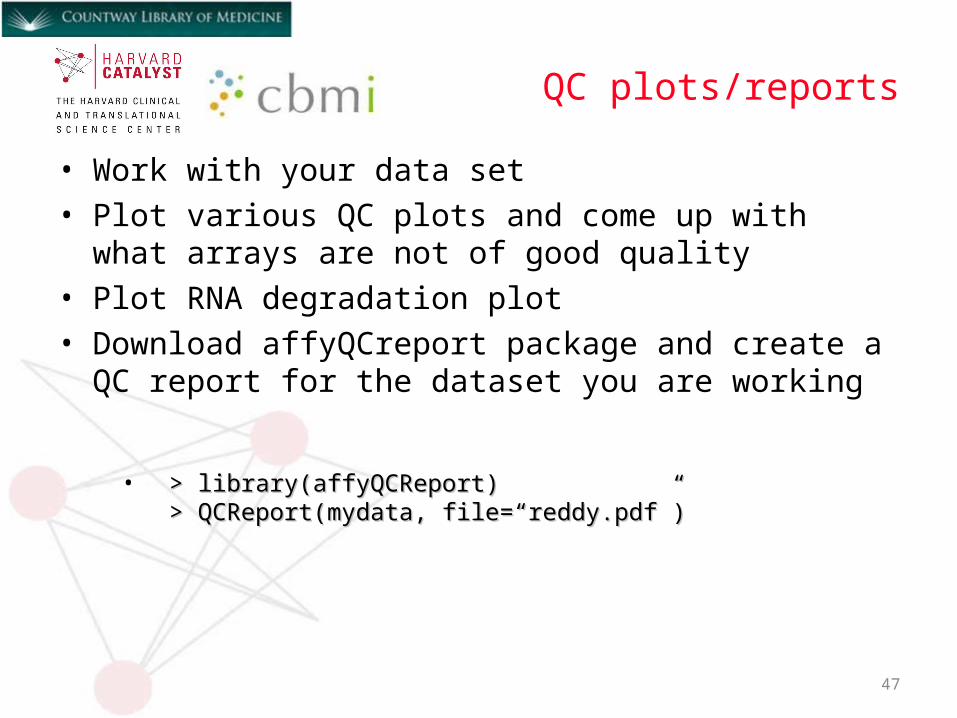
QC plots/reports
47
• > library(affyQCReport)> library(affyQCReport)> QCReport(mydata, file=“reddy.pdf”)> QCReport(mydata, file=“reddy.pdf”)
• Work with your data set• Plot various QC plots and come up with what
arrays are not of good quality• Plot RNA degradation plot• Download affyQCreport package and create a
QC report for the dataset you are working

Working with OnechannelGUI
48
NormalizationNormalization FilteringFiltering StatisticalStatisticalanalysisanalysis
AnnotationAnnotationBiological Biological KnowledgeKnowledgeextractionextraction
QualityQualitycontrolcontrol

Probe set summary
49
Click on probe set menuand select the probe set summary and normalization option.
Click on probe set menuand select the probe set summary and normalization option.
A
B

Normalization
50

Exercise 4
51
• Calculate probe set summaries with GCRMA and RMA– With GCRMA and RMA– Export and save the normalized values
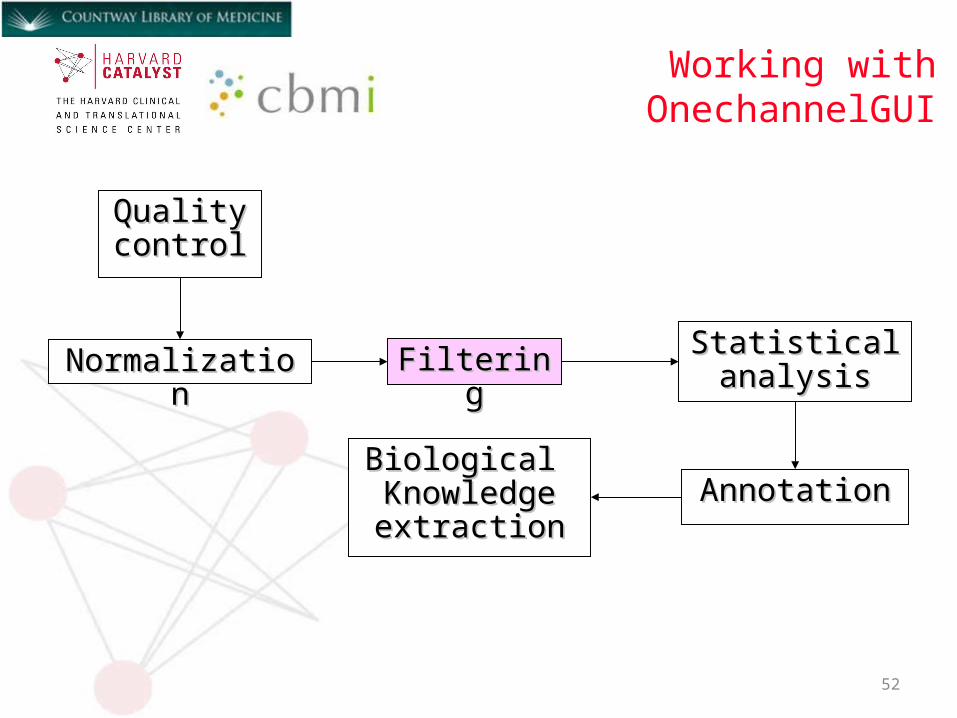
Working with OnechannelGUI
52
NormalizationNormalization FilteringFiltering StatisticalStatisticalanalysisanalysis
AnnotationAnnotationBiological Biological KnowledgeKnowledgeextractionextraction
QualityQualitycontrolcontrol

Filtering - OnechannelGUI
53
Signal features:Signal features: Percent intensities greater of a user defined Percent intensities greater of a user defined
valuevalue Interquantile range (IQR) greater of a Interquantile range (IQR) greater of a
defined valuedefined value
Annotation features:Annotation features:• Specific gene features (i.e. GO term, Specific gene features (i.e. GO term,
presence of transcriptional regulative presence of transcriptional regulative elements in promoters, etc.)elements in promoters, etc.)
• Using Ingenuity pathway Using Ingenuity pathway knowledge baseknowledge base

Filtering
54
• Perform IQR filter at 0.25 followed by an intensity Perform IQR filter at 0.25 followed by an intensity filter at 50% of the arrays with and intensity over filter at 50% of the arrays with and intensity over 100.100.
• Export the data as tab delimited file.Export the data as tab delimited file.-Question:-Question:
How many probe sets are left after the first How many probe sets are left after the first and the second filter?and the second filter?
• Using transcription factors from Ingenuity create a Using transcription factors from Ingenuity create a file containing only the entrez genes without header file containing only the entrez genes without header and use it to filter the data set. Save the data setand use it to filter the data set. Save the data set

Linear Modeling (Limma)

Differential Expression
Computer contrasts builds differential expression
Computer contrasts builds differential expression

MA and Volcano plots
57

Expression values
58
AffyIDAffyID
Gene Symbol
Gene Symbol
Gene Description
Gene Description
Log2 FCLog2 FC
Average intensity
Average intensity
T statisticsT statistics
P-valuesP-values
Log-odd statistics
Log-odd statistics

Differential Expression
59
• Use the “Table of Genes Ranked in order of Use the “Table of Genes Ranked in order of Differential Expression” and filter the genes and Differential Expression” and filter the genes and export the normalized expression valuesexport the normalized expression values
• Plot differentially expressed genes with raw p-value Plot differentially expressed genes with raw p-value ≤ ≤ 0.05 and an absolute fold change ≥ 1 for the two 0.05 and an absolute fold change ≥ 1 for the two
contrasts.contrasts.
• Using "Venn Diagram between probe set lists“, Using "Venn Diagram between probe set lists“, evaluate the level of overlap between the two sets. evaluate the level of overlap between the two sets.
Hint: make two sets from two contrastsHint: make two sets from two contrasts


![[XLS] · Web viewGali Beri Patiar Wali, H.No. 2273-2296, Gali Masjid Khajoor H.No. 2297-2312, Gali Chatti Behar Wali H.No. 2313-2324, Gali Chatti Phool Wali H.No. 2325-2329, Gali](https://img.pdfslide.us/doc/110x75/5af08dc47f8b9abc788d56fe/xls-viewgali-beri-patiar-wali-hno-2273-2296-gali-masjid-khajoor-hno-2297-2312.jpg)