Embed Size (px)
Citation preview
1
Microalgal Community Composition Assessment in Warringah Lagoons and Pittwater
2017-2018
FOR
NORTHERN BEACHES COUNCIL
Rendy Ruvindy, Dr Penelope Ajani and Professor Shauna Murray
University of Technology Sydney
& Sydney Institute of Marine Science
2
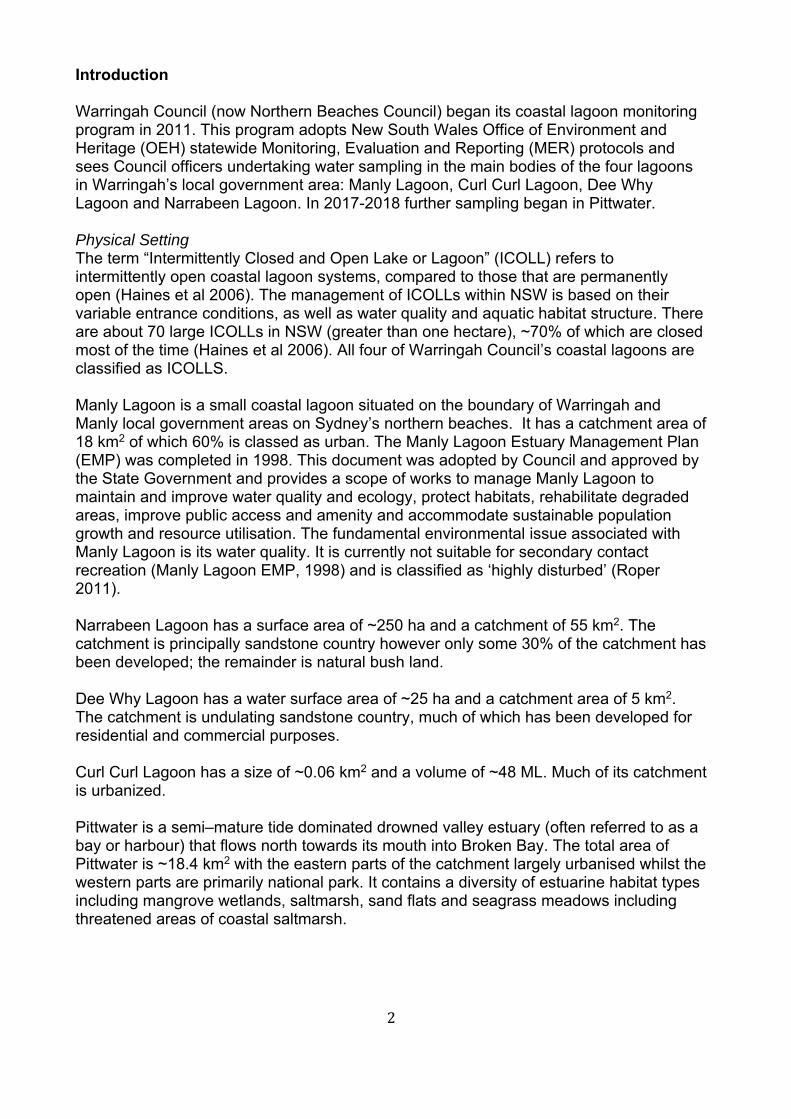
Introduction Warringah Council (now Northern Beaches Council) began its coastal lagoon monitoring program in 2011. This program adopts New South Wales Office of Environment and Heritage (OEH) statewide Monitoring, Evaluation and Reporting (MER) protocols and sees Council officers undertaking water sampling in the main bodies of the four lagoons in Warringah’s local government area: Manly Lagoon, Curl Curl Lagoon, Dee Why Lagoon and Narrabeen Lagoon. In 2017-2018 further sampling began in Pittwater. Physical Setting The term “Intermittently Closed and Open Lake or Lagoon” (ICOLL) refers to intermittently open coastal lagoon systems, compared to those that are permanently open (Haines et al 2006). The management of ICOLLs within NSW is based on their variable entrance conditions, as well as water quality and aquatic habitat structure. There are about 70 large ICOLLs in NSW (greater than one hectare), ~70% of which are closed most of the time (Haines et al 2006). All four of Warringah Council’s coastal lagoons are classified as ICOLLS. Manly Lagoon is a small coastal lagoon situated on the boundary of Warringah and Manly local government areas on Sydney’s northern beaches. It has a catchment area of 18 km2 of which 60% is classed as urban. The Manly Lagoon Estuary Management Plan (EMP) was completed in 1998. This document was adopted by Council and approved by the State Government and provides a scope of works to manage Manly Lagoon to maintain and improve water quality and ecology, protect habitats, rehabilitate degraded areas, improve public access and amenity and accommodate sustainable population growth and resource utilisation. The fundamental environmental issue associated with Manly Lagoon is its water quality. It is currently not suitable for secondary contact recreation (Manly Lagoon EMP, 1998) and is classified as ‘highly disturbed’ (Roper 2011). Narrabeen Lagoon has a surface area of ~250 ha and a catchment of 55 km2. The catchment is principally sandstone country however only some 30% of the catchment has been developed; the remainder is natural bush land. Dee Why Lagoon has a water surface area of ~25 ha and a catchment area of 5 km2. The catchment is undulating sandstone country, much of which has been developed for residential and commercial purposes. Curl Curl Lagoon has a size of ~0.06 km2 and a volume of ~48 ML. Much of its catchment is urbanized. Pittwater is a semi–mature tide dominated drowned valley estuary (often referred to as a bay or harbour) that flows north towards its mouth into Broken Bay. The total area of Pittwater is ~18.4 km2 with the eastern parts of the catchment largely urbanised whilst the western parts are primarily national park. It contains a diversity of estuarine habitat types including mangrove wetlands, saltmarsh, sand flats and seagrass meadows including threatened areas of coastal saltmarsh.
3
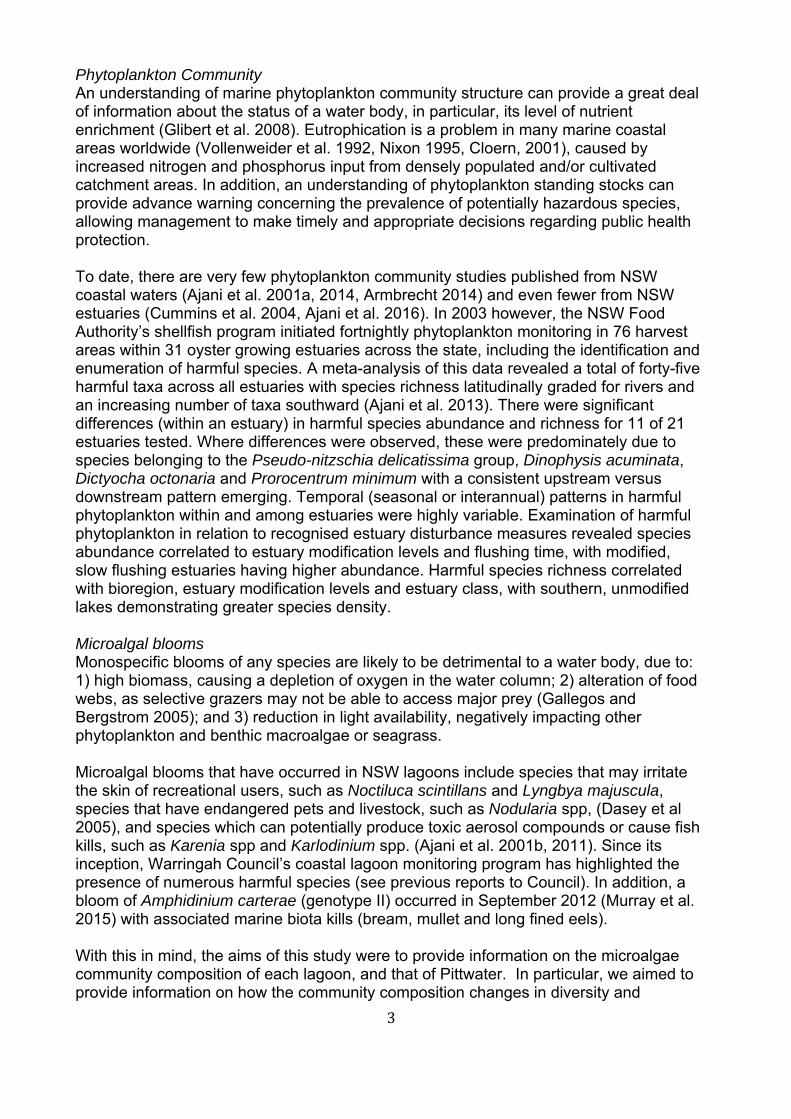
Phytoplankton Community An understanding of marine phytoplankton community structure can provide a great deal of information about the status of a water body, in particular, its level of nutrient enrichment (Glibert et al. 2008). Eutrophication is a problem in many marine coastal areas worldwide (Vollenweider et al. 1992, Nixon 1995, Cloern, 2001), caused by increased nitrogen and phosphorus input from densely populated and/or cultivated catchment areas. In addition, an understanding of phytoplankton standing stocks can provide advance warning concerning the prevalence of potentially hazardous species, allowing management to make timely and appropriate decisions regarding public health protection. To date, there are very few phytoplankton community studies published from NSW coastal waters (Ajani et al. 2001a, 2014, Armbrecht 2014) and even fewer from NSW estuaries (Cummins et al. 2004, Ajani et al. 2016). In 2003 however, the NSW Food Authority’s shellfish program initiated fortnightly phytoplankton monitoring in 76 harvest areas within 31 oyster growing estuaries across the state, including the identification and enumeration of harmful species. A meta-analysis of this data revealed a total of forty-five harmful taxa across all estuaries with species richness latitudinally graded for rivers and an increasing number of taxa southward (Ajani et al. 2013). There were significant differences (within an estuary) in harmful species abundance and richness for 11 of 21 estuaries tested. Where differences were observed, these were predominately due to species belonging to the Pseudo-nitzschia delicatissima group, Dinophysis acuminata, Dictyocha octonaria and Prorocentrum minimum with a consistent upstream versus downstream pattern emerging. Temporal (seasonal or interannual) patterns in harmful phytoplankton within and among estuaries were highly variable. Examination of harmful phytoplankton in relation to recognised estuary disturbance measures revealed species abundance correlated to estuary modification levels and flushing time, with modified, slow flushing estuaries having higher abundance. Harmful species richness correlated with bioregion, estuary modification levels and estuary class, with southern, unmodified lakes demonstrating greater species density. Microalgal blooms Monospecific blooms of any species are likely to be detrimental to a water body, due to: 1) high biomass, causing a depletion of oxygen in the water column; 2) alteration of food webs, as selective grazers may not be able to access major prey (Gallegos and Bergstrom 2005); and 3) reduction in light availability, negatively impacting other phytoplankton and benthic macroalgae or seagrass. Microalgal blooms that have occurred in NSW lagoons include species that may irritate the skin of recreational users, such as Noctiluca scintillans and Lyngbya majuscula, species that have endangered pets and livestock, such as Nodularia spp, (Dasey et al 2005), and species which can potentially produce toxic aerosol compounds or cause fish kills, such as Karenia spp and Karlodinium spp. (Ajani et al. 2001b, 2011). Since its inception, Warringah Council’s coastal lagoon monitoring program has highlighted the presence of numerous harmful species (see previous reports to Council). In addition, a bloom of Amphidinium carterae (genotype II) occurred in September 2012 (Murray et al. 2015) with associated marine biota kills (bream, mullet and long fined eels). With this in mind, the aims of this study were to provide information on the microalgae community composition of each lagoon, and that of Pittwater. In particular, we aimed to provide information on how the community composition changes in diversity and
4
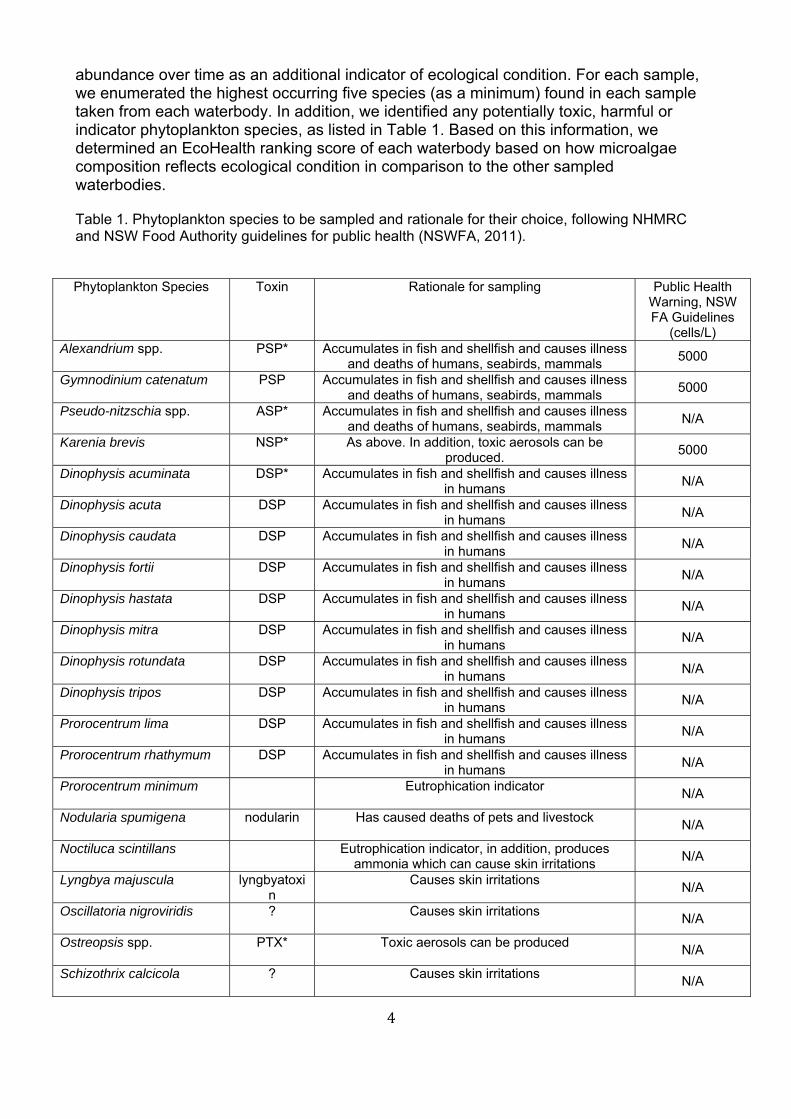
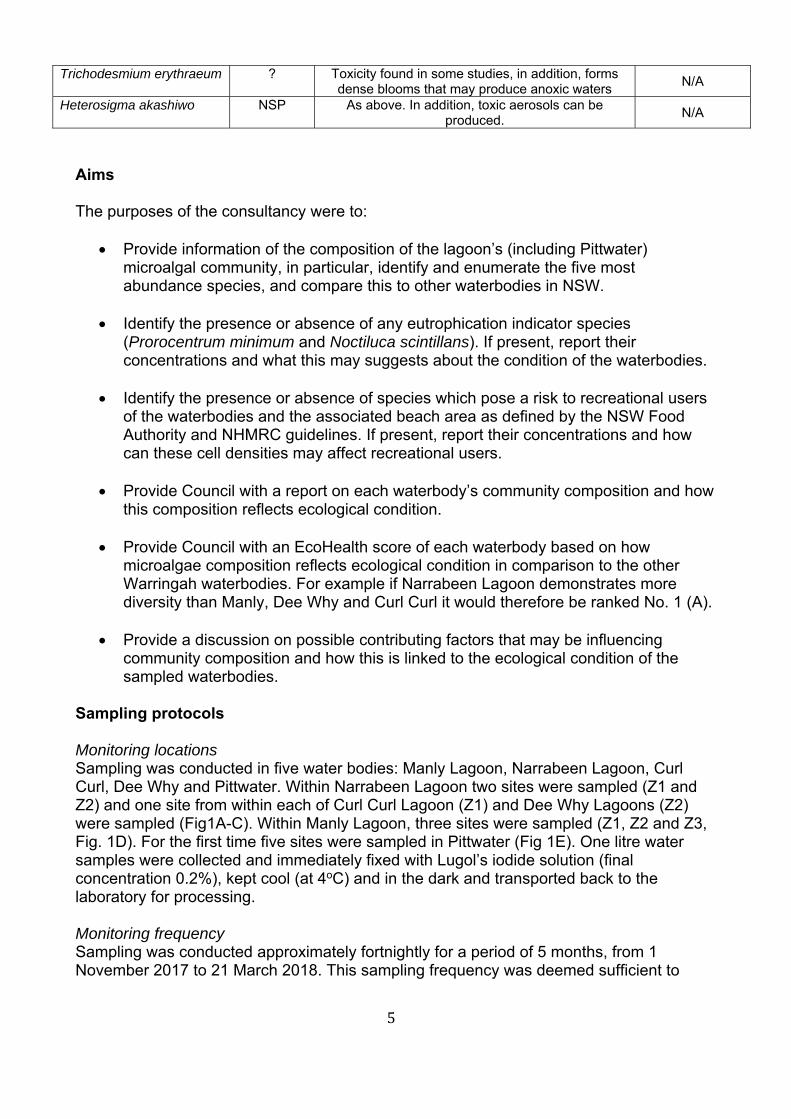
abundance over time as an additional indicator of ecological condition. For each sample, we enumerated the highest occurring five species (as a minimum) found in each sample taken from each waterbody. In addition, we identified any potentially toxic, harmful or indicator phytoplankton species, as listed in Table 1. Based on this information, we determined an EcoHealth ranking score of each waterbody based on how microalgae composition reflects ecological condition in comparison to the other sampled waterbodies. Table 1. Phytoplankton species to be sampled and rationale for their choice, following NHMRC and NSW Food Authority guidelines for public health (NSWFA, 2011).
Phytoplankton Species Toxin Rationale for sampling Public Health Warning, NSW FA Guidelines
(cells/L) Alexandrium spp. PSP* Accumulates in fish and shellfish and causes illness
and deaths of humans, seabirds, mammals 5000
Gymnodinium catenatum PSP Accumulates in fish and shellfish and causes illness and deaths of humans, seabirds, mammals
5000
Pseudo-nitzschia spp. ASP* Accumulates in fish and shellfish and causes illness and deaths of humans, seabirds, mammals
N/A
Karenia brevis NSP* As above. In addition, toxic aerosols can be produced.
5000
Dinophysis acuminata DSP* Accumulates in fish and shellfish and causes illness in humans
N/A
Dinophysis acuta DSP Accumulates in fish and shellfish and causes illness in humans
N/A
Dinophysis caudata DSP Accumulates in fish and shellfish and causes illness in humans
N/A
Dinophysis fortii DSP Accumulates in fish and shellfish and causes illness in humans
N/A
Dinophysis hastata DSP Accumulates in fish and shellfish and causes illness in humans
N/A
Dinophysis mitra DSP Accumulates in fish and shellfish and causes illness in humans
N/A
Dinophysis rotundata DSP Accumulates in fish and shellfish and causes illness in humans
N/A
Dinophysis tripos DSP Accumulates in fish and shellfish and causes illness in humans
N/A
Prorocentrum lima DSP Accumulates in fish and shellfish and causes illness in humans
N/A
Prorocentrum rhathymum DSP Accumulates in fish and shellfish and causes illness in humans
N/A
Prorocentrum minimum Eutrophication indicator
N/A
Nodularia spumigena nodularin Has caused deaths of pets and livestock
N/A
Noctiluca scintillans Eutrophication indicator, in addition, produces ammonia which can cause skin irritations
N/A
Lyngbya majuscula lyngbyatoxin
Causes skin irritations
N/A
Oscillatoria nigroviridis ? Causes skin irritations
N/A
Ostreopsis spp. PTX* Toxic aerosols can be produced
N/A
Schizothrix calcicola ? Causes skin irritations
N/A
5
Aims The purposes of the consultancy were to:
Provide information of the composition of the lagoon’s (including Pittwater) microalgal community, in particular, identify and enumerate the five most abundance species, and compare this to other waterbodies in NSW.
Identify the presence or absence of any eutrophication indicator species (Prorocentrum minimum and Noctiluca scintillans). If present, report their concentrations and what this may suggests about the condition of the waterbodies.
Identify the presence or absence of species which pose a risk to recreational users of the waterbodies and the associated beach area as defined by the NSW Food Authority and NHMRC guidelines. If present, report their concentrations and how can these cell densities may affect recreational users.
Provide Council with a report on each waterbody’s community composition and how
this composition reflects ecological condition. Provide Council with an EcoHealth score of each waterbody based on how
microalgae composition reflects ecological condition in comparison to the other Warringah waterbodies. For example if Narrabeen Lagoon demonstrates more diversity than Manly, Dee Why and Curl Curl it would therefore be ranked No. 1 (A).
Provide a discussion on possible contributing factors that may be influencing
community composition and how this is linked to the ecological condition of the sampled waterbodies.
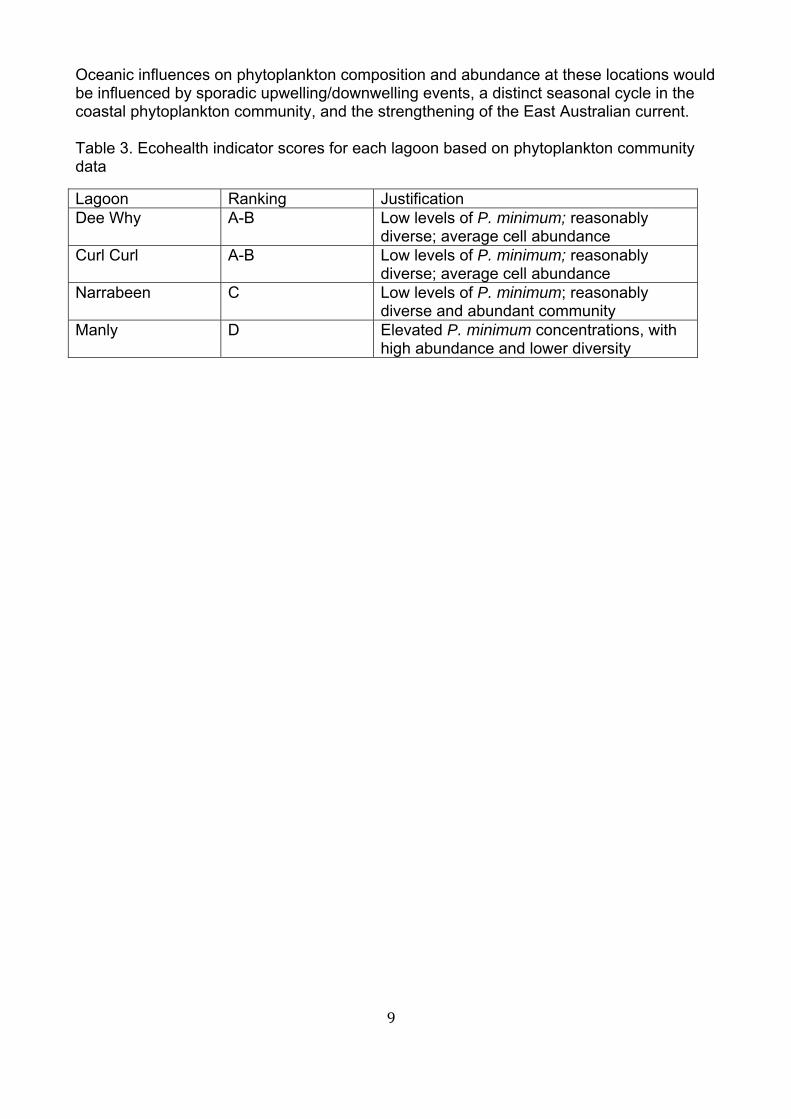
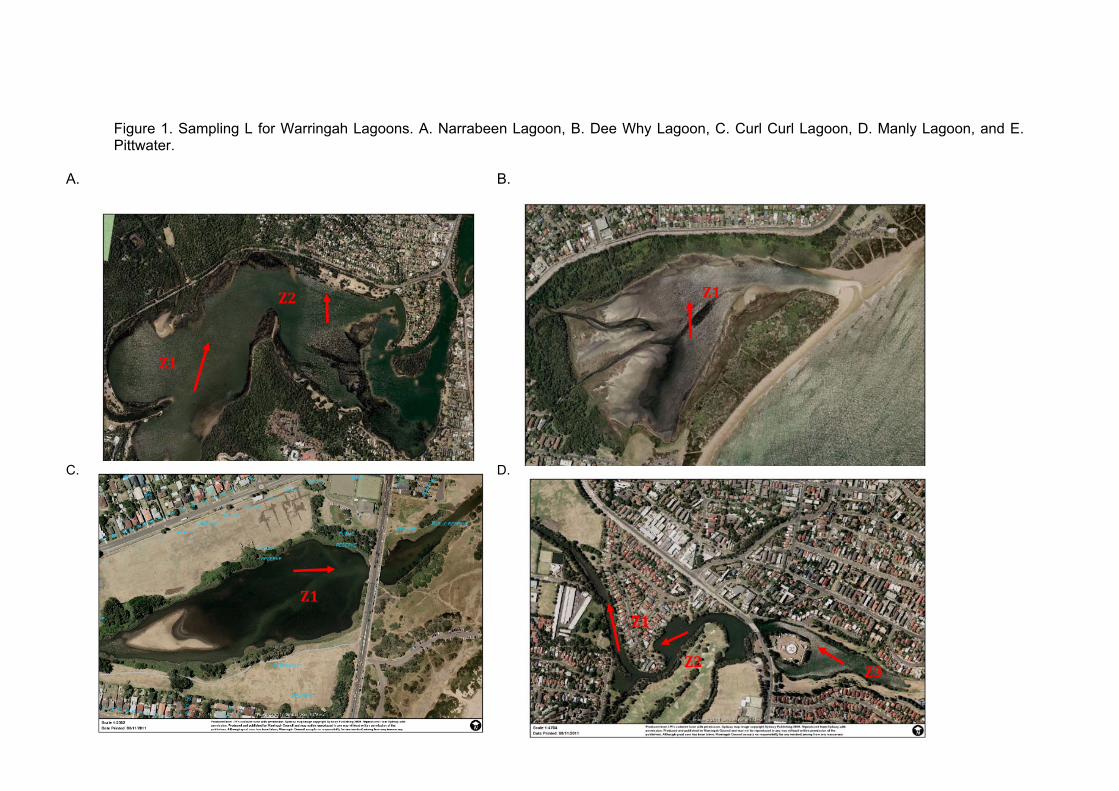
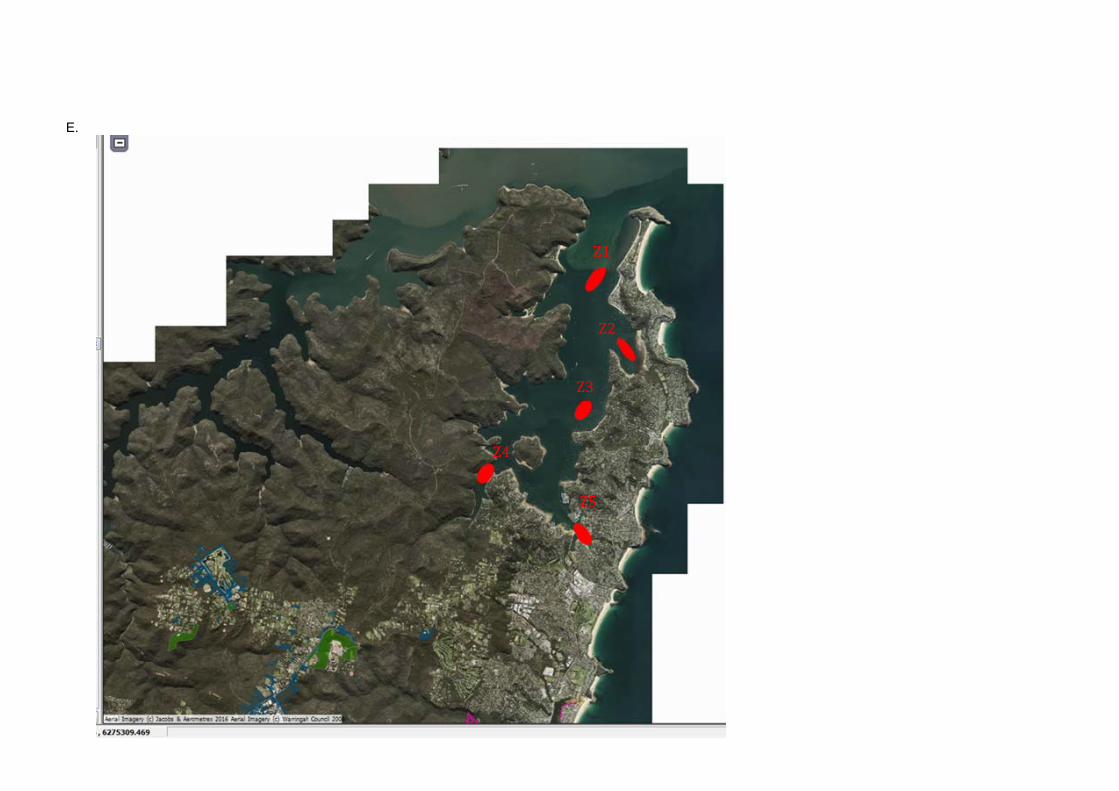
Sampling protocols Monitoring locations Sampling was conducted in five water bodies: Manly Lagoon, Narrabeen Lagoon, Curl Curl, Dee Why and Pittwater. Within Narrabeen Lagoon two sites were sampled (Z1 and Z2) and one site from within each of Curl Curl Lagoon (Z1) and Dee Why Lagoons (Z2) were sampled (Fig1A-C). Within Manly Lagoon, three sites were sampled (Z1, Z2 and Z3, Fig. 1D). For the first time five sites were sampled in Pittwater (Fig 1E). One litre water samples were collected and immediately fixed with Lugol’s iodide solution (final concentration 0.2%), kept cool (at 4oC) and in the dark and transported back to the laboratory for processing. Monitoring frequency Sampling was conducted approximately fortnightly for a period of 5 months, from 1 November 2017 to 21 March 2018. This sampling frequency was deemed sufficient to
Trichodesmium erythraeum ? Toxicity found in some studies, in addition, forms dense blooms that may produce anoxic waters
N/A
Heterosigma akashiwo NSP As above. In addition, toxic aerosols can be produced.
N/A
6
allow the observation of bloom development and seasonal changes, and is in line with NSW Food Authority protocol. Laboratory techniques Water samples were gently concentrated using vacuum filtration on to a 5 µm millipore filter. Filters were then washed with filtered seawater into a final volume of 10 ml. One ml subsamples were then scanned and counted using a Sedgewick-Rafter cell (1 ml = 50 x 20 mm; 1 square = 1 x 1 mm, Sarstedt, Germany) and an inverted compound light microscope (Leica DFC 295, Leica Microsystems, Germany). Identification and enumeration (100 cells minimum) were performed for the top five most abundant taxa (as a minimum). In addition if any taxa listed in Table 1 were identified they were also enumerated.
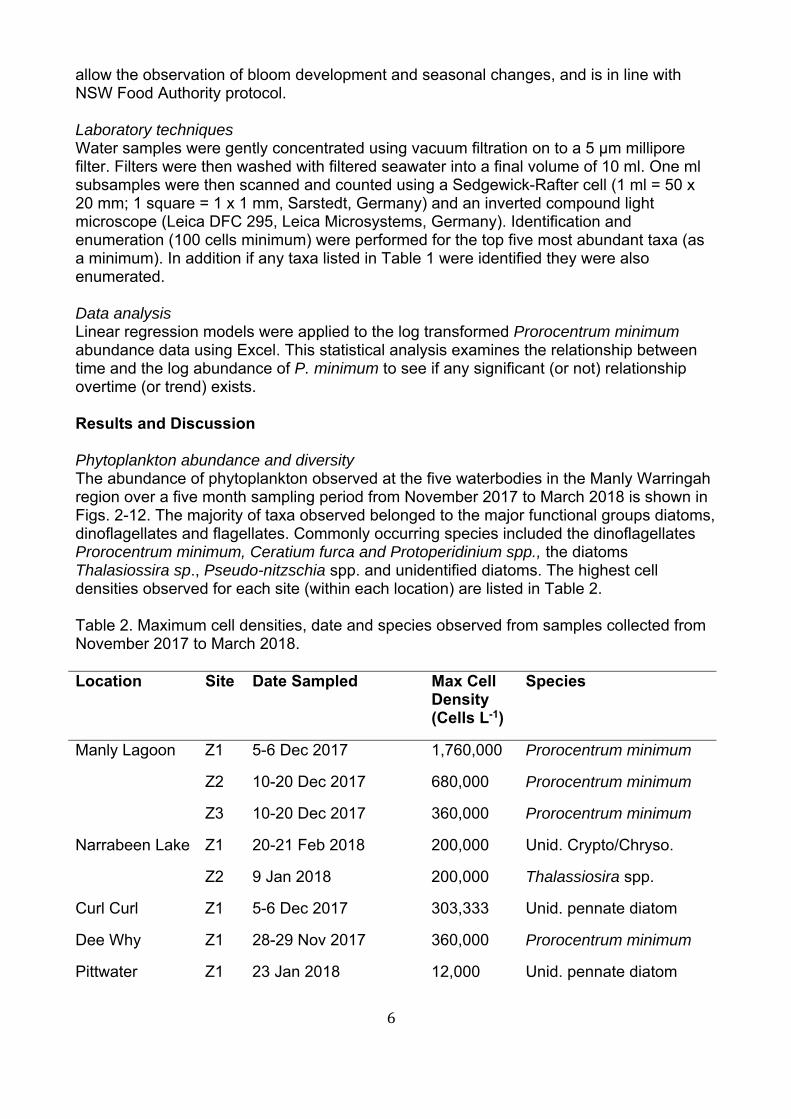
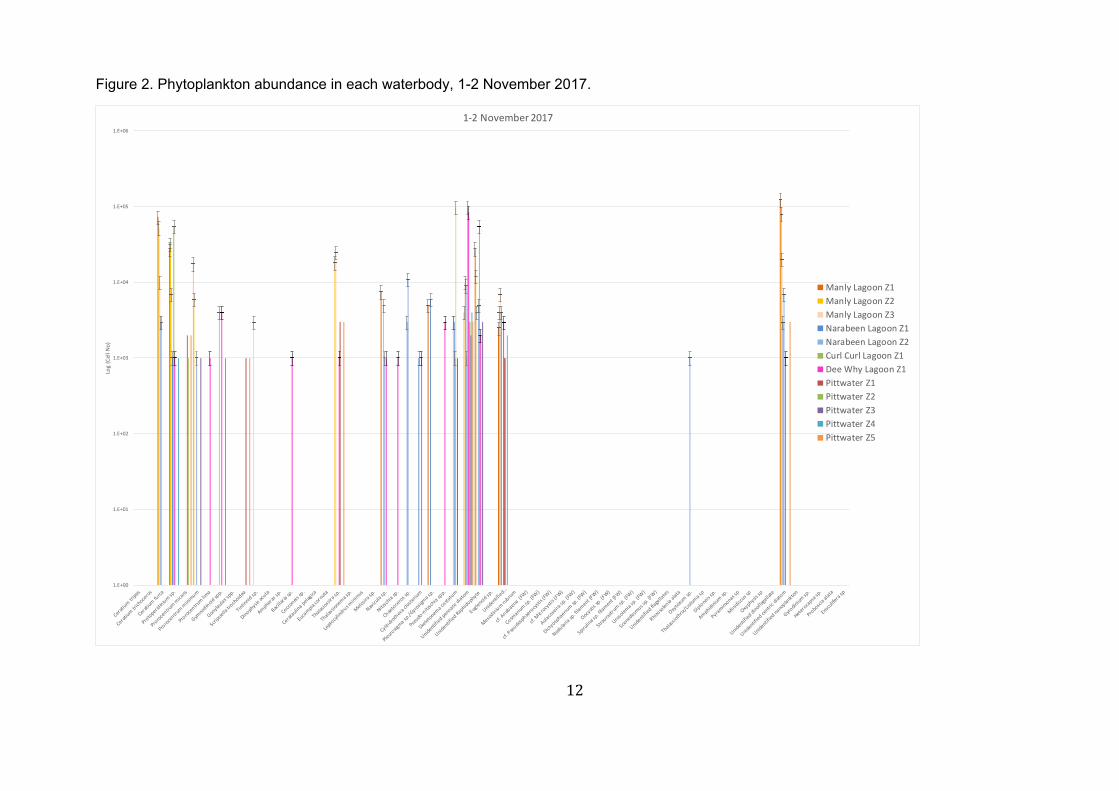
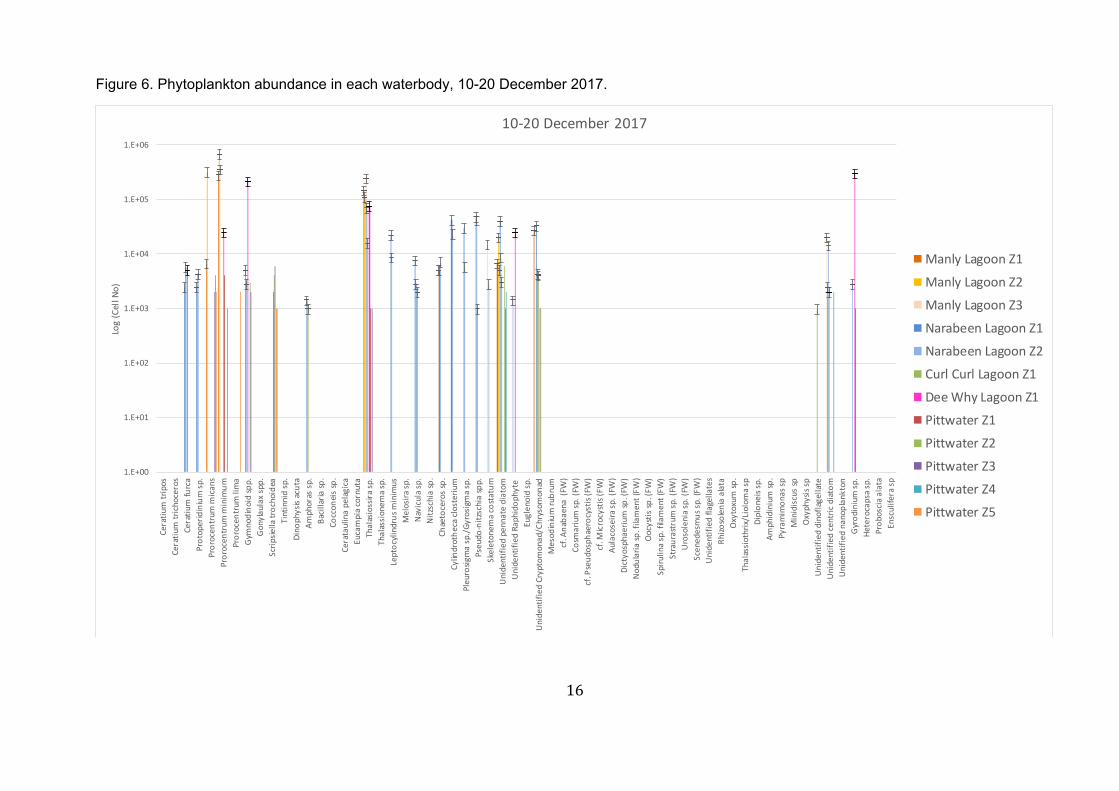
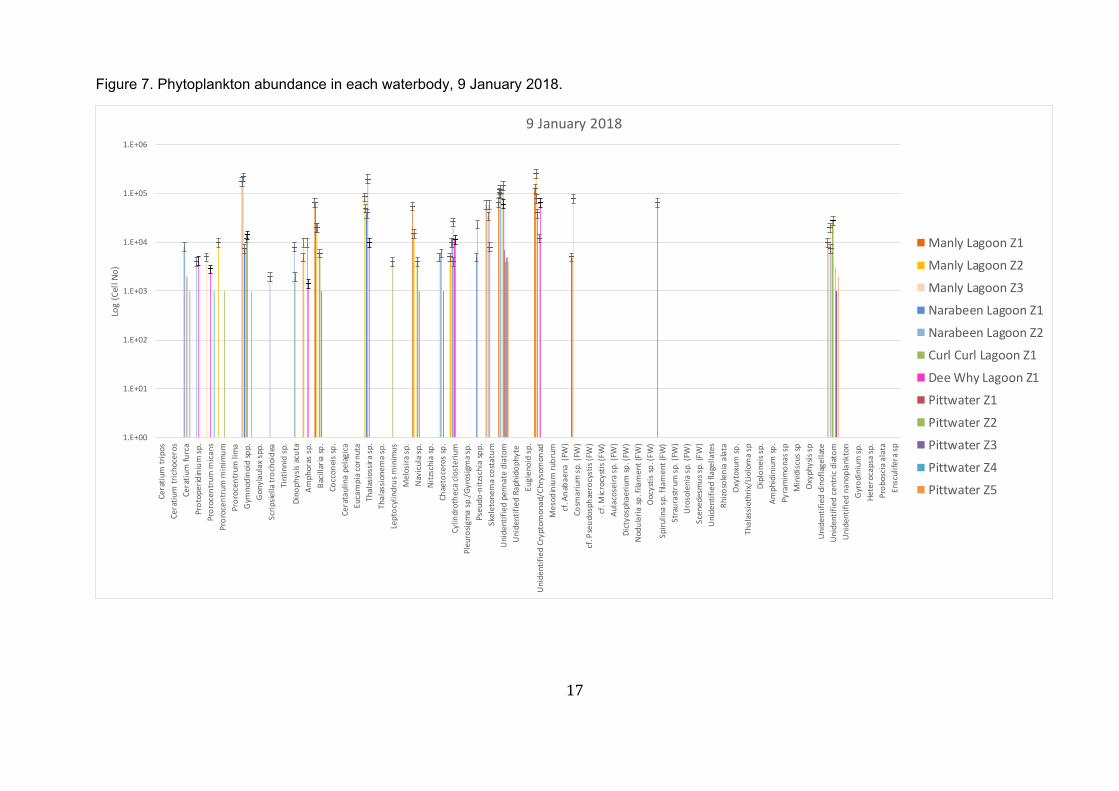
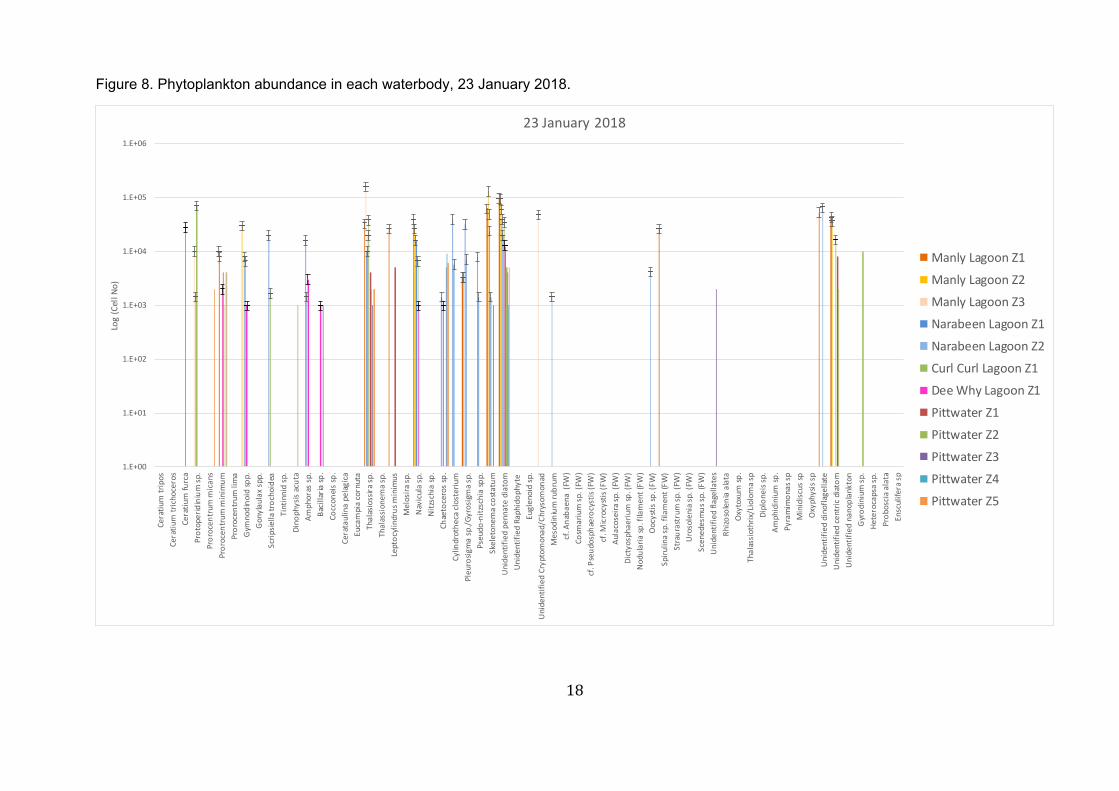
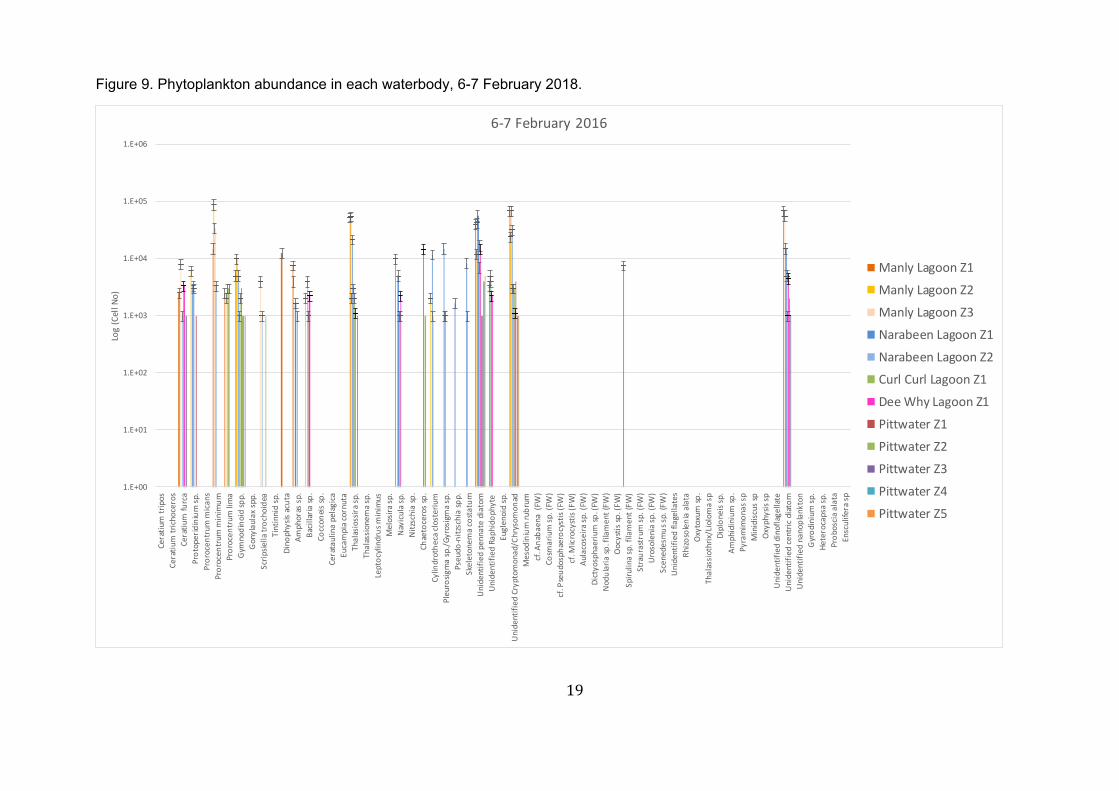
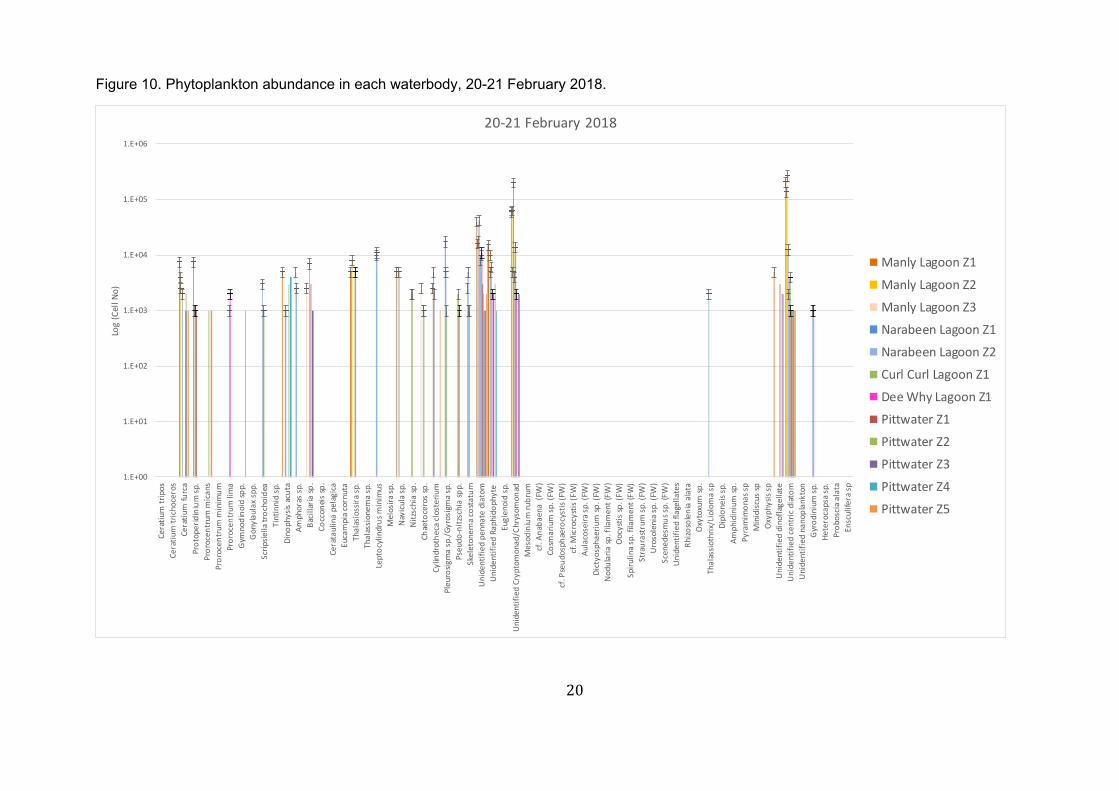
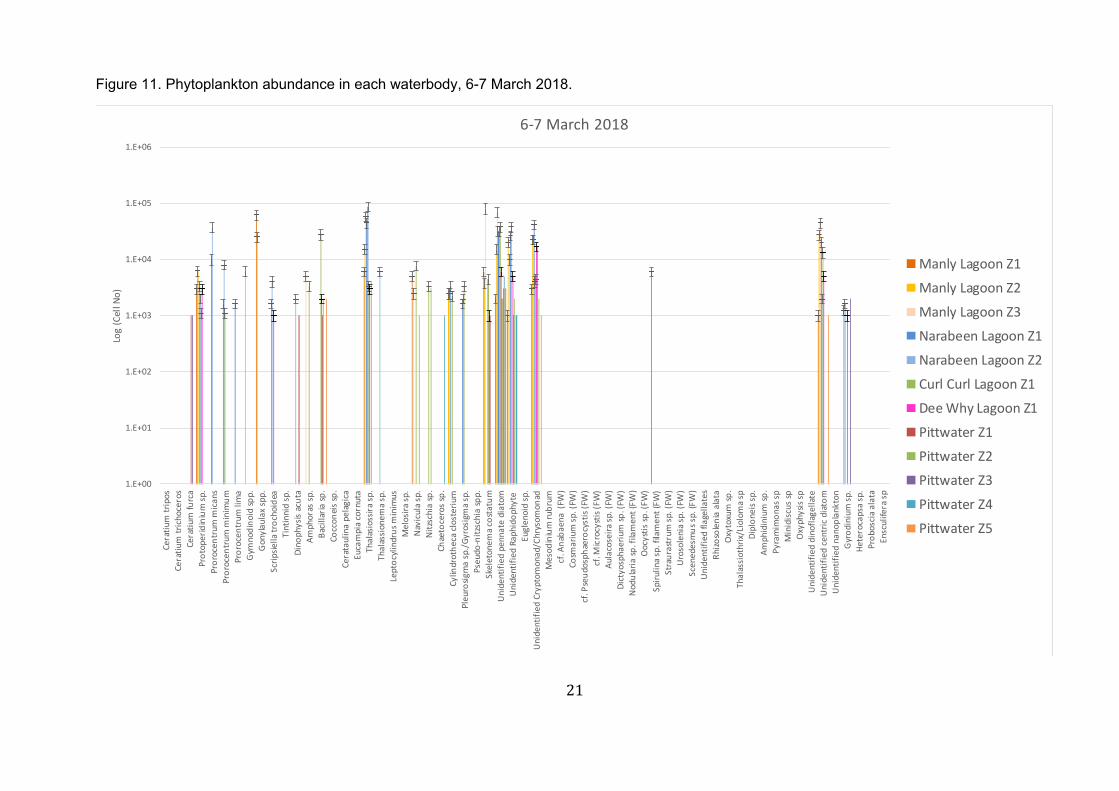
Data analysis Linear regression models were applied to the log transformed Prorocentrum minimum abundance data using Excel. This statistical analysis examines the relationship between time and the log abundance of P. minimum to see if any significant (or not) relationship overtime (or trend) exists. Results and Discussion Phytoplankton abundance and diversity The abundance of phytoplankton observed at the five waterbodies in the Manly Warringah region over a five month sampling period from November 2017 to March 2018 is shown in Figs. 2-12. The majority of taxa observed belonged to the major functional groups diatoms, dinoflagellates and flagellates. Commonly occurring species included the dinoflagellates Prorocentrum minimum, Ceratium furca and Protoperidinium spp., the diatoms Thalasiossira sp., Pseudo-nitzschia spp. and unidentified diatoms. The highest cell densities observed for each site (within each location) are listed in Table 2. Table 2. Maximum cell densities, date and species observed from samples collected from November 2017 to March 2018. Location Site Date Sampled Max Cell
Density (Cells L-1)
Species
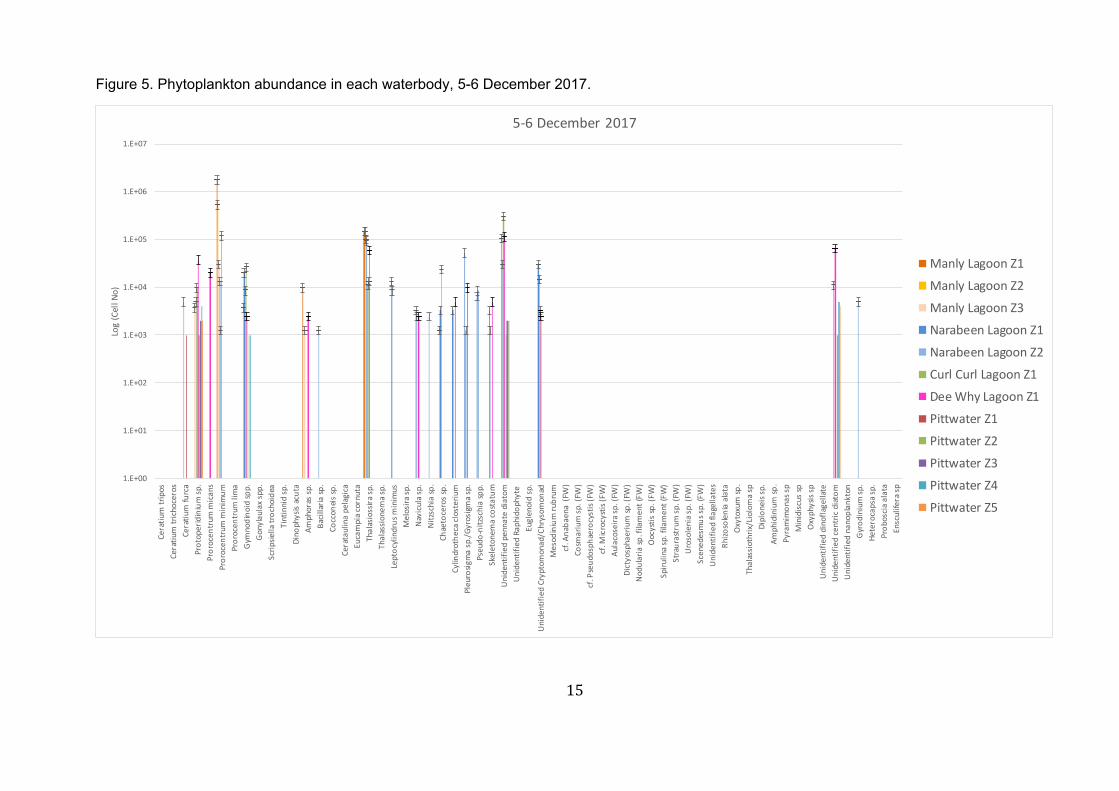
Manly Lagoon Z1 5-6 Dec 2017 1,760,000 Prorocentrum minimum
Z2 10-20 Dec 2017 680,000 Prorocentrum minimum
Z3 10-20 Dec 2017 360,000 Prorocentrum minimum
Narrabeen Lake Z1 20-21 Feb 2018 200,000 Unid. Crypto/Chryso.
Z2 9 Jan 2018 200,000 Thalassiosira spp.
Curl Curl Z1 5-6 Dec 2017 303,333 Unid. pennate diatom
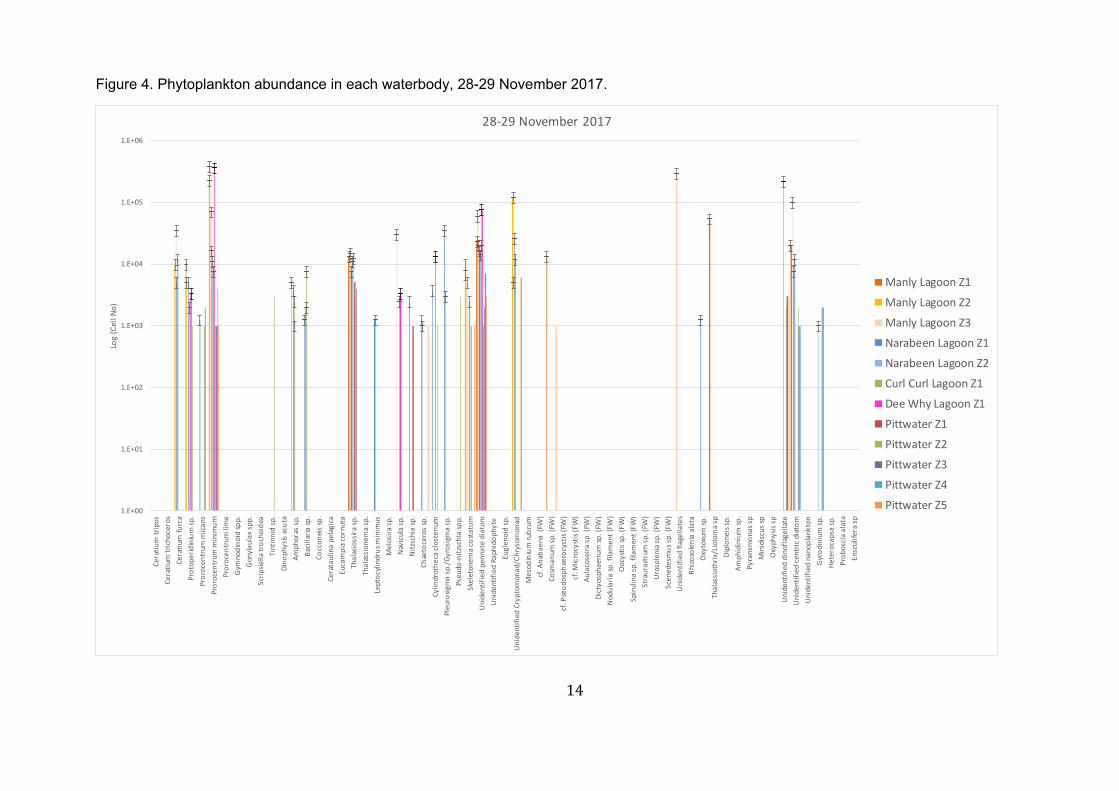
Dee Why Z1 28-29 Nov 2017 360,000 Prorocentrum minimum
Pittwater Z1 23 Jan 2018 12,000 Unid. pennate diatom
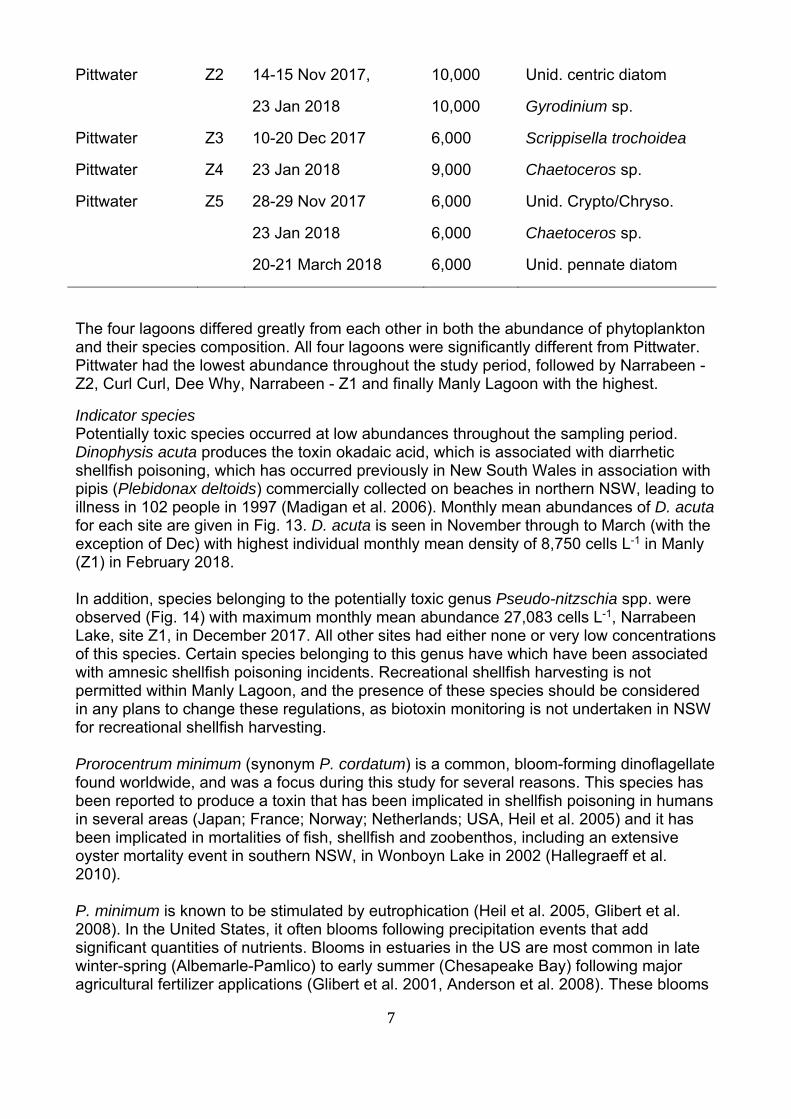
7
Pittwater Z2 14-15 Nov 2017,
23 Jan 2018
10,000
10,000
Unid. centric diatom
Gyrodinium sp.
Pittwater Z3 10-20 Dec 2017 6,000 Scrippisella trochoidea
Pittwater Z4 23 Jan 2018 9,000 Chaetoceros sp.
Pittwater Z5 28-29 Nov 2017
23 Jan 2018
20-21 March 2018
6,000
6,000
6,000
Unid. Crypto/Chryso.
Chaetoceros sp.
Unid. pennate diatom
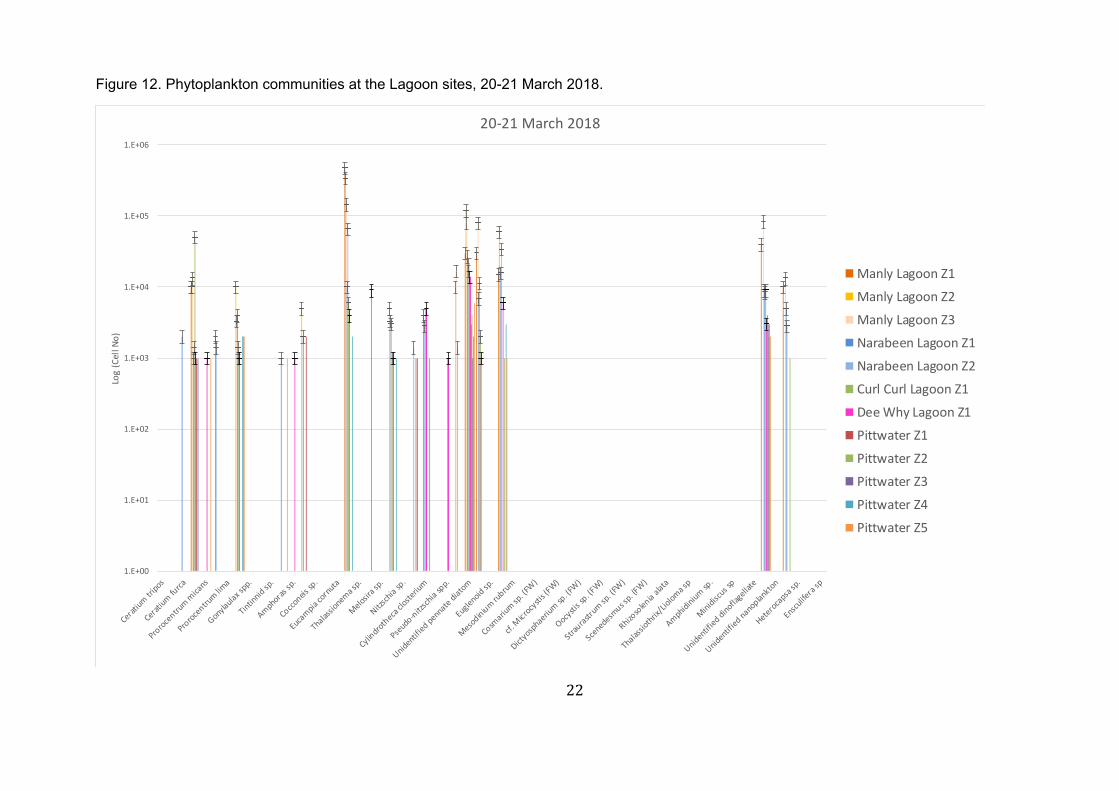
The four lagoons differed greatly from each other in both the abundance of phytoplankton and their species composition. All four lagoons were significantly different from Pittwater. Pittwater had the lowest abundance throughout the study period, followed by Narrabeen - Z2, Curl Curl, Dee Why, Narrabeen - Z1 and finally Manly Lagoon with the highest.
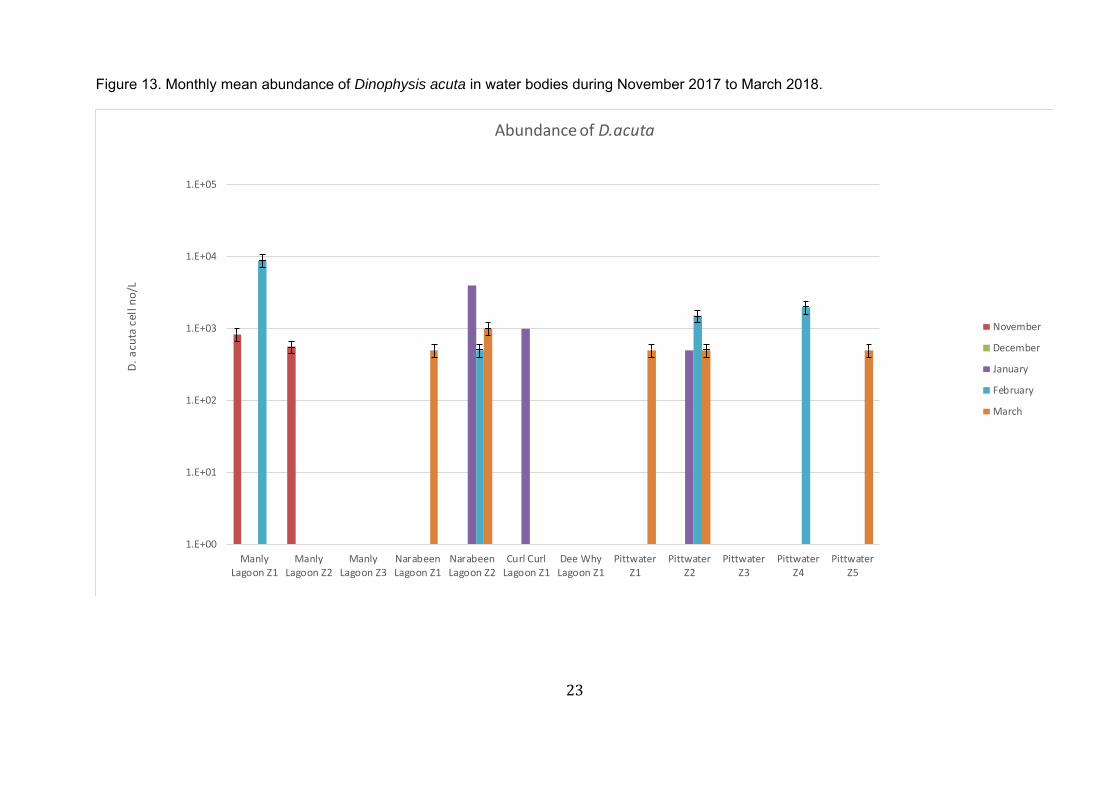
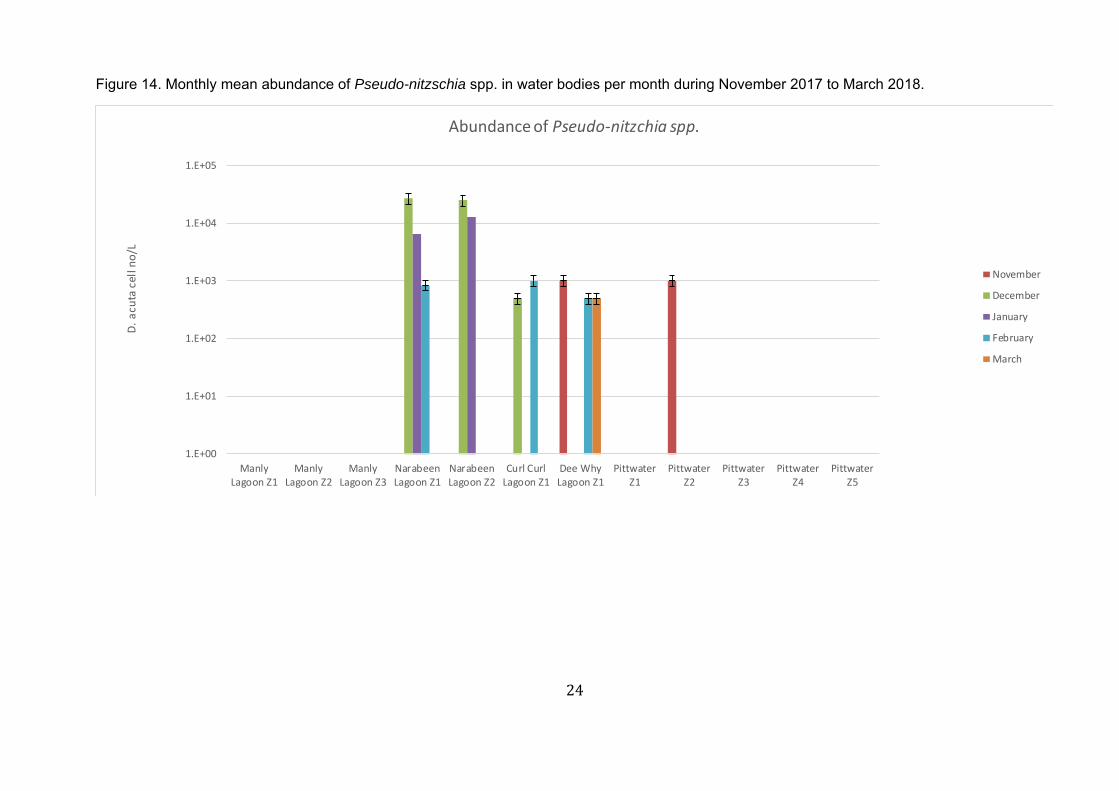
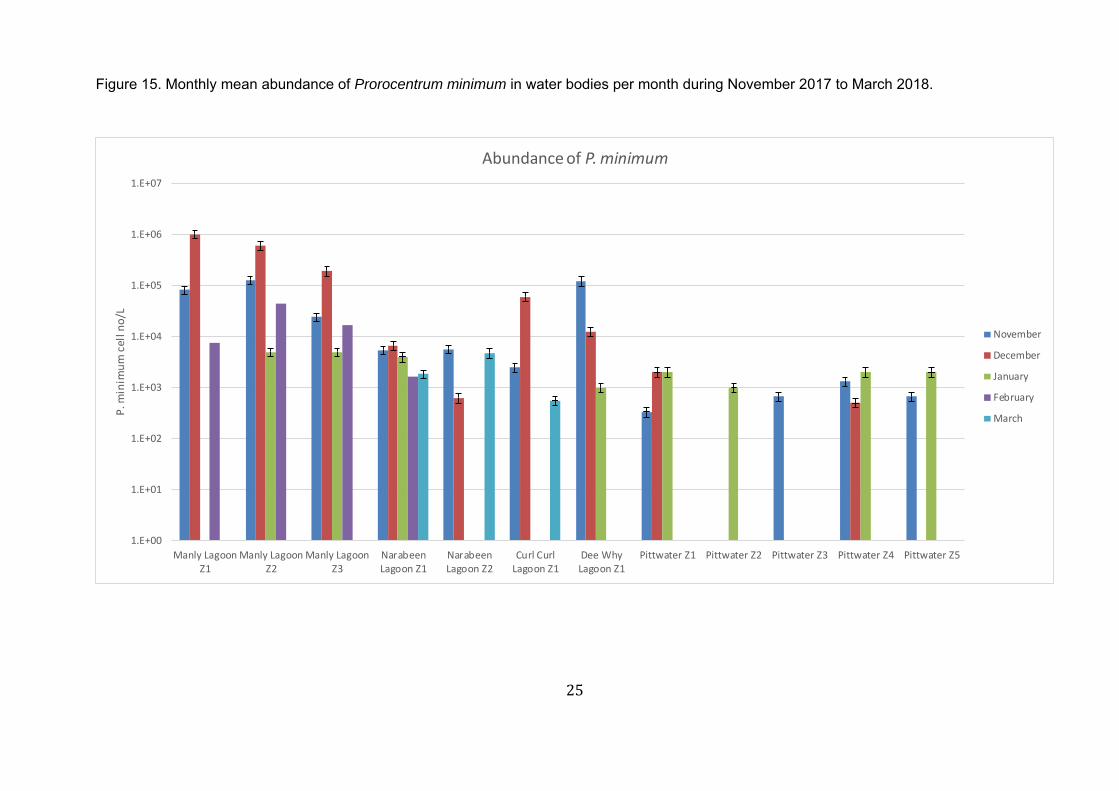
Indicator species Potentially toxic species occurred at low abundances throughout the sampling period. Dinophysis acuta produces the toxin okadaic acid, which is associated with diarrhetic shellfish poisoning, which has occurred previously in New South Wales in association with pipis (Plebidonax deltoids) commercially collected on beaches in northern NSW, leading to illness in 102 people in 1997 (Madigan et al. 2006). Monthly mean abundances of D. acuta for each site are given in Fig. 13. D. acuta is seen in November through to March (with the exception of Dec) with highest individual monthly mean density of 8,750 cells L-1 in Manly (Z1) in February 2018. In addition, species belonging to the potentially toxic genus Pseudo-nitzschia spp. were observed (Fig. 14) with maximum monthly mean abundance 27,083 cells L-1, Narrabeen Lake, site Z1, in December 2017. All other sites had either none or very low concentrations of this species. Certain species belonging to this genus have which have been associated with amnesic shellfish poisoning incidents. Recreational shellfish harvesting is not permitted within Manly Lagoon, and the presence of these species should be considered in any plans to change these regulations, as biotoxin monitoring is not undertaken in NSW for recreational shellfish harvesting. Prorocentrum minimum (synonym P. cordatum) is a common, bloom-forming dinoflagellate found worldwide, and was a focus during this study for several reasons. This species has been reported to produce a toxin that has been implicated in shellfish poisoning in humans in several areas (Japan; France; Norway; Netherlands; USA, Heil et al. 2005) and it has been implicated in mortalities of fish, shellfish and zoobenthos, including an extensive oyster mortality event in southern NSW, in Wonboyn Lake in 2002 (Hallegraeff et al. 2010). P. minimum is known to be stimulated by eutrophication (Heil et al. 2005, Glibert et al. 2008). In the United States, it often blooms following precipitation events that add significant quantities of nutrients. Blooms in estuaries in the US are most common in late winter-spring (Albemarle-Pamlico) to early summer (Chesapeake Bay) following major agricultural fertilizer applications (Glibert et al. 2001, Anderson et al. 2008). These blooms
8
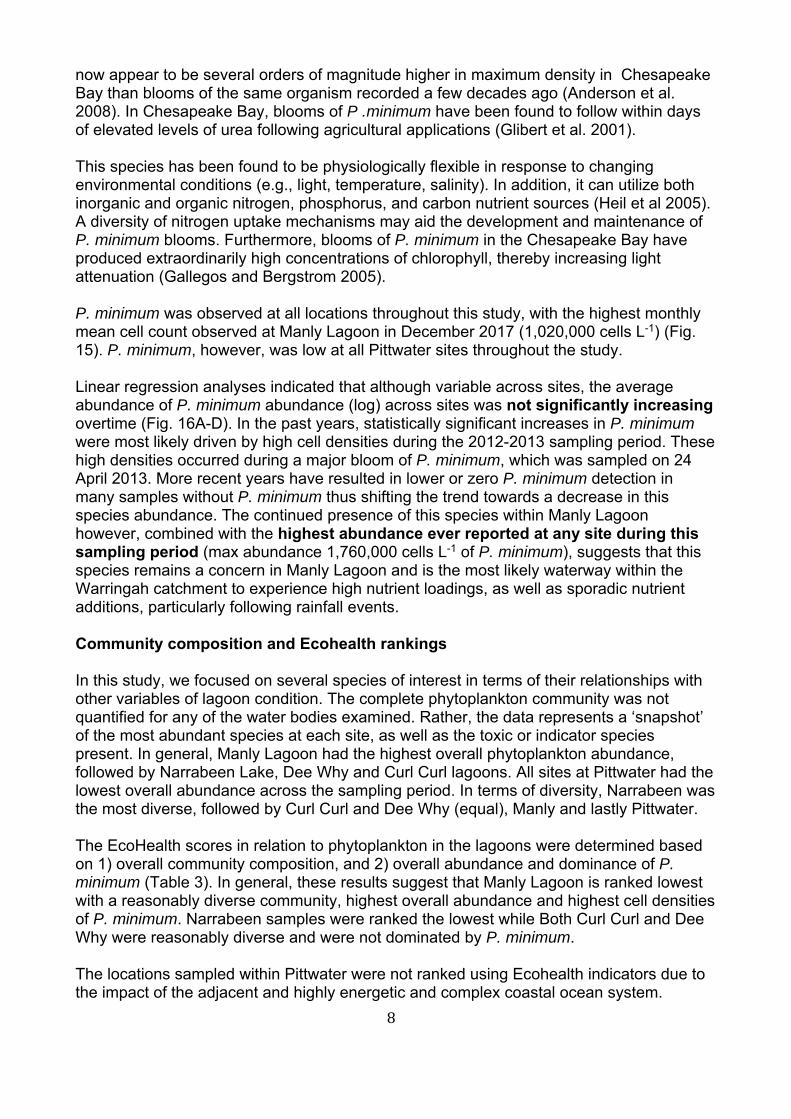
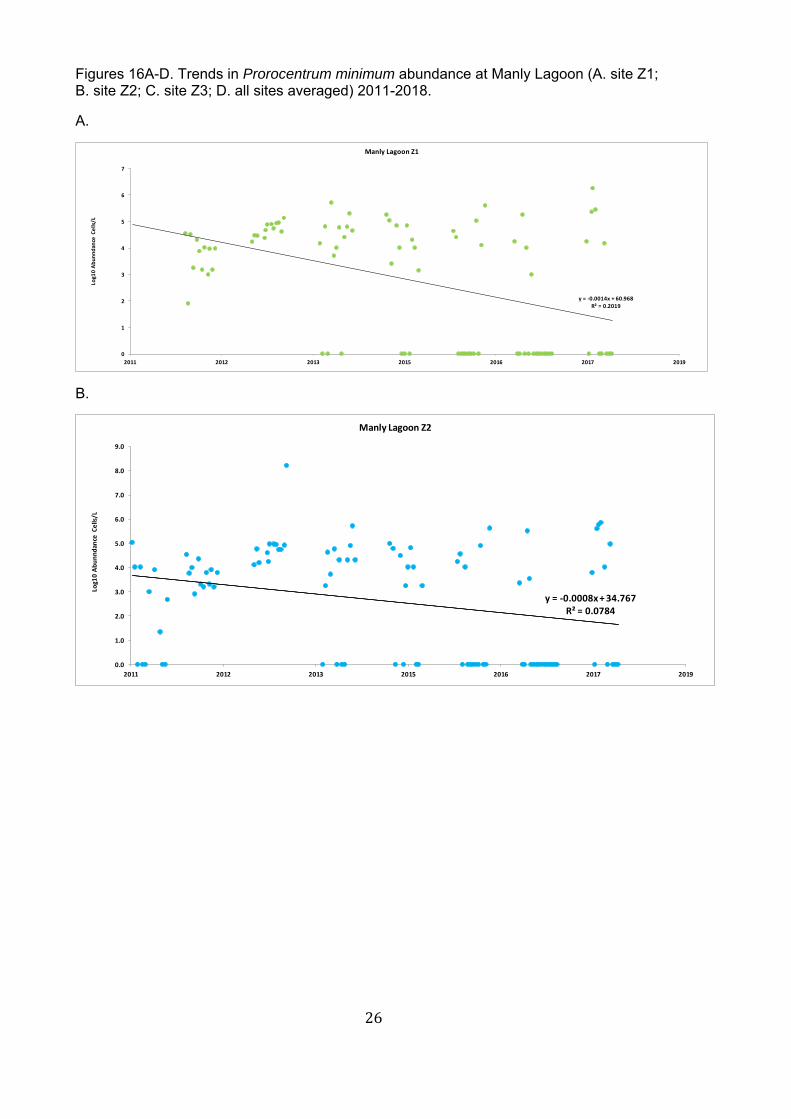
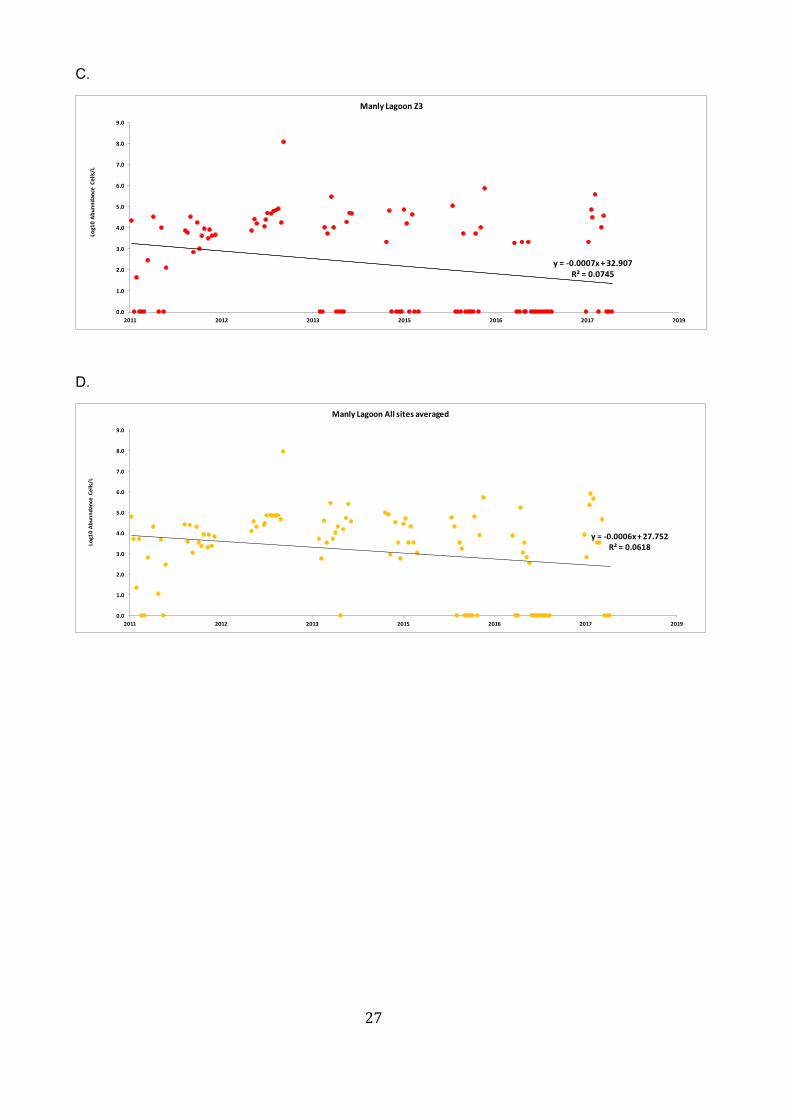
now appear to be several orders of magnitude higher in maximum density in Chesapeake Bay than blooms of the same organism recorded a few decades ago (Anderson et al. 2008). In Chesapeake Bay, blooms of P .minimum have been found to follow within days of elevated levels of urea following agricultural applications (Glibert et al. 2001). This species has been found to be physiologically flexible in response to changing environmental conditions (e.g., light, temperature, salinity). In addition, it can utilize both inorganic and organic nitrogen, phosphorus, and carbon nutrient sources (Heil et al 2005). A diversity of nitrogen uptake mechanisms may aid the development and maintenance of P. minimum blooms. Furthermore, blooms of P. minimum in the Chesapeake Bay have produced extraordinarily high concentrations of chlorophyll, thereby increasing light attenuation (Gallegos and Bergstrom 2005). P. minimum was observed at all locations throughout this study, with the highest monthly mean cell count observed at Manly Lagoon in December 2017 (1,020,000 cells L-1) (Fig. 15). P. minimum, however, was low at all Pittwater sites throughout the study. Linear regression analyses indicated that although variable across sites, the average abundance of P. minimum abundance (log) across sites was not significantly increasing overtime (Fig. 16A-D). In the past years, statistically significant increases in P. minimum were most likely driven by high cell densities during the 2012-2013 sampling period. These high densities occurred during a major bloom of P. minimum, which was sampled on 24 April 2013. More recent years have resulted in lower or zero P. minimum detection in many samples without P. minimum thus shifting the trend towards a decrease in this species abundance. The continued presence of this species within Manly Lagoon however, combined with the highest abundance ever reported at any site during this sampling period (max abundance 1,760,000 cells L-1 of P. minimum), suggests that this species remains a concern in Manly Lagoon and is the most likely waterway within the Warringah catchment to experience high nutrient loadings, as well as sporadic nutrient additions, particularly following rainfall events. Community composition and Ecohealth rankings In this study, we focused on several species of interest in terms of their relationships with other variables of lagoon condition. The complete phytoplankton community was not quantified for any of the water bodies examined. Rather, the data represents a ‘snapshot’ of the most abundant species at each site, as well as the toxic or indicator species present. In general, Manly Lagoon had the highest overall phytoplankton abundance, followed by Narrabeen Lake, Dee Why and Curl Curl lagoons. All sites at Pittwater had the lowest overall abundance across the sampling period. In terms of diversity, Narrabeen was the most diverse, followed by Curl Curl and Dee Why (equal), Manly and lastly Pittwater. The EcoHealth scores in relation to phytoplankton in the lagoons were determined based on 1) overall community composition, and 2) overall abundance and dominance of P. minimum (Table 3). In general, these results suggest that Manly Lagoon is ranked lowest with a reasonably diverse community, highest overall abundance and highest cell densities of P. minimum. Narrabeen samples were ranked the lowest while Both Curl Curl and Dee Why were reasonably diverse and were not dominated by P. minimum. The locations sampled within Pittwater were not ranked using Ecohealth indicators due to the impact of the adjacent and highly energetic and complex coastal ocean system.
9
Oceanic influences on phytoplankton composition and abundance at these locations would be influenced by sporadic upwelling/downwelling events, a distinct seasonal cycle in the coastal phytoplankton community, and the strengthening of the East Australian current. Table 3. Ecohealth indicator scores for each lagoon based on phytoplankton community data
Lagoon Ranking Justification Dee Why A-B Low levels of P. minimum; reasonably
diverse; average cell abundance Curl Curl A-B Low levels of P. minimum; reasonably
diverse; average cell abundance Narrabeen C Low levels of P. minimum; reasonably
diverse and abundant community Manly D Elevated P. minimum concentrations, with
high abundance and lower diversity
10
Figure 1. Sampling L for Warringah Lagoons. A. Narrabeen Lagoon, B. Dee Why Lagoon, C. Curl Curl Lagoon, D. Manly Lagoon, and E. Pittwater.
A. B.
C. D.
Z1
Z2 Z1
Z1
Z3
Z1
Z2
11
E.
Z1
Z2
Z3
Z4
Z5
12
Figure 2. Phytoplankton abundance in each waterbody, 1-2 November 2017.
1.E+00
1.E+01
1.E+02
1.E+03
1.E+04
1.E+05
1.E+06
Log (Cell N
o)
1‐2 November 2017
Manly Lagoon Z1Manly Lagoon Z2Manly Lagoon Z3Narabeen Lagoon Z1Narabeen Lagoon Z2Curl Curl Lagoon Z1Dee Why Lagoon Z1Pittwater Z1Pittwater Z2Pittwater Z3Pittwater Z4Pittwater Z5
13
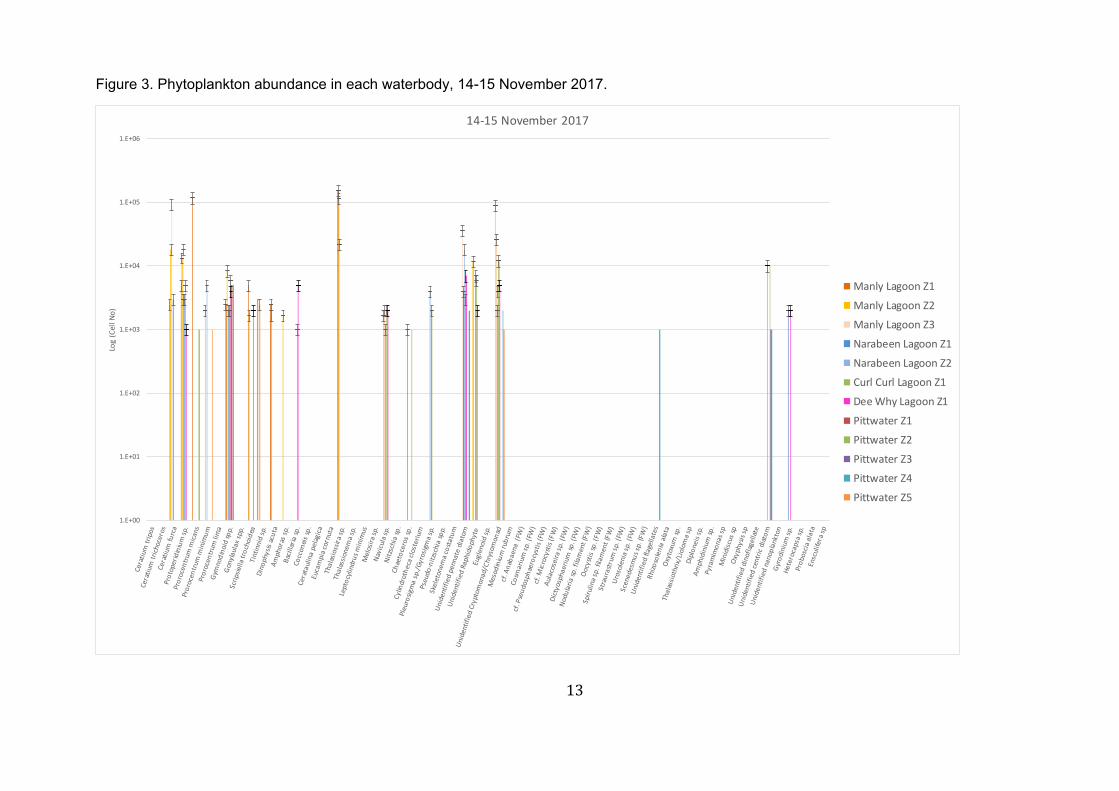
Figure 3. Phytoplankton abundance in each waterbody, 14-15 November 2017.
1.E+00
1.E+01
1.E+02
1.E+03
1.E+04
1.E+05
1.E+06
Log (Cell N
o)14‐15 November 2017
Manly Lagoon Z1
Manly Lagoon Z2
Manly Lagoon Z3
Narabeen Lagoon Z1
Narabeen Lagoon Z2
Curl Curl Lagoon Z1
Dee Why Lagoon Z1
Pittwater Z1
Pittwater Z2
Pittwater Z3
Pittwater Z4
Pittwater Z5
14
Figure 4. Phytoplankton abundance in each waterbody, 28-29 November 2017.
1.E+00
1.E+01
1.E+02
1.E+03
1.E+04
1.E+05
1.E+06
Ceratiu
m tripos
Ceratiu
m tricho
ceros
Ceratiu
m fu
rca
Protop
eridinium sp.
Prorocen
trum
mican
sProrocen
trum
minim
umProrocen
trum
lima
Gym
nodino
id sp
p.Gon
ylau
lax spp.
Scrip
siella
troc
hoidea
Tintinnid sp.
Dino
physis acuta
Amph
oras sp.
Bacillaria
sp.
Coccon
eis sp.
Cerataulina pe
lagica
Eucampia cornuta
Thalasiossira
sp.
Thalassion
ema sp.
Leptoc
ylindrus m
inim
usMelosira
sp.
Navicula sp.
Nitzschia sp.
Chaetoceros sp.
Cylin
drothe
ca closteriu
mPleu
rosig
ma sp./Gy
rosigm
a sp.
Pseu
do‐nitzschia spp.
Skeleton
ema co
statum
Unide
ntified
pen
nate diatom
Unide
ntified
Rap
hido
phyte
Euglen
oid sp.
Unide
ntified
Cryptom
onad
/Chrysom
onad
Mesod
inium ru
brum
cf. A
naba
ena (F
W)
Cosm
arium sp
. (FW
)cf. P
seud
osph
aerocystis (FW)
cf. M
icrocystis (F
W)
Aulacoseira
sp. (FW
)Dictyo
spha
erium sp
. (FW
)Nod
ularia sp
. filamen
t (FW
)Oocystis
sp. (FW
)Sp
irulin
a sp. filamen
t (FW
)Straurastrum
sp. (FW
)Urosolenia sp. (FW
)Scen
edesmus sp. (F
W)
Unide
ntified
flagellates
Rhizo
solenia alata
Oxytoxum sp
.Th
alassiothrix/Lioloma sp
Diplon
eis s
p.Am
phidinium sp
.Py
ramim
onas sp
Minidiscus sp
Oxyph
ysis sp
Unide
ntified
dinoflage
llate
Unide
ntified
cen
tric diatom
Unide
ntified
nan
oplank
ton
Gyrod
inium sp
.He
terocapsa sp.
Prob
oscia alata
Ensculife
ra sp
Log (Cell N
o)28‐29 November 2017
Manly Lagoon Z1
Manly Lagoon Z2
Manly Lagoon Z3
Narabeen Lagoon Z1
Narabeen Lagoon Z2
Curl Curl Lagoon Z1
Dee Why Lagoon Z1
Pittwater Z1
Pittwater Z2
Pittwater Z3
Pittwater Z4
Pittwater Z5
15
Figure 5. Phytoplankton abundance in each waterbody, 5-6 December 2017.
1.E+00
1.E+01
1.E+02
1.E+03
1.E+04
1.E+05
1.E+06
1.E+07
Ceratiu
m tripos
Ceratiu
m tricho
ceros
Ceratiu
m fu
rca
Protop
eridinium sp.
Prorocen
trum
mican
sProrocen
trum
minim
umProrocen
trum
lima
Gym
nodino
id sp
p.Gon
ylau
lax spp.
Scrip
siella
troc
hoidea
Tintinnid sp.
Dino
physis acuta
Amph
oras sp.
Bacillaria
sp.
Coccon
eis sp.
Cerataulina pe
lagica
Eucampia cornuta
Thalasiossira
sp.
Thalassion
ema sp.
Leptoc
ylindrus m
inim
usMelosira
sp.
Navicula sp.
Nitzschia sp.
Chaetoceros sp.
Cylin
drothe
ca closteriu
mPleu
rosig
ma sp./Gy
rosigm
a sp.
Pseu
do‐nitzschia spp.
Skeleton
ema co
statum
Unide
ntified
pen
nate diatom
Unide
ntified
Rap
hido
phyte
Euglen
oid sp.
Unide
ntified
Cryptom
onad
/Chrysom
onad
Mesod
inium ru
brum
cf. A
naba
ena (F
W)
Cosm
arium sp
. (FW
)cf. P
seud
osph
aerocystis (FW)
cf. M
icrocystis (F
W)
Aulacoseira
sp. (FW
)Dictyo
spha
erium sp
. (FW
)Nod
ularia sp
. filamen
t (FW
)Oocystis
sp. (FW
)Sp
irulin
a sp. filamen
t (FW
)Straurastrum
sp. (FW
)Urosolenia sp. (FW
)Scen
edesmus sp. (F
W)
Unide
ntified
flagellates
Rhizo
solenia alata
Oxytoxum sp
.Th
alassiothrix/Lioloma sp
Diplon
eis s
p.Am
phidinium sp
.Py
ramim
onas sp
Minidiscus sp
Oxyph
ysis sp
Unide
ntified
dinoflage
llate
Unide
ntified
cen
tric diatom
Unide
ntified
nan
oplank
ton
Gyrod
inium sp
.He
terocapsa sp.
Prob
oscia alata
Ensculife
ra sp
Log (Cell N
o)5‐6 December 2017
Manly Lagoon Z1
Manly Lagoon Z2
Manly Lagoon Z3
Narabeen Lagoon Z1
Narabeen Lagoon Z2
Curl Curl Lagoon Z1
Dee Why Lagoon Z1
Pittwater Z1
Pittwater Z2
Pittwater Z3
Pittwater Z4
Pittwater Z5
16
Figure 6. Phytoplankton abundance in each waterbody, 10-20 December 2017.
1.E+00
1.E+01
1.E+02
1.E+03
1.E+04
1.E+05
1.E+06
Ceratiu
m tripos
Ceratiu
m tricho
ceros
Ceratiu
m fu
rca
Protop
eridinium sp.
Prorocen
trum
mican
sProrocen
trum
minim
umProrocen
trum
lima
Gym
nodino
id sp
p.Gon
ylau
lax spp.
Scrip
siella
troc
hoidea
Tintinnid sp.
Dino
physis acuta
Amph
oras sp.
Bacillaria
sp.
Coccon
eis sp.
Cerataulina pe
lagica
Eucampia cornuta
Thalasiossira
sp.
Thalassion
ema sp.
Leptoc
ylindrus m
inim
usMelosira
sp.
Navicula sp.
Nitzschia sp.
Chaetoceros sp.
Cylin
drothe
ca closteriu
mPleu
rosig
ma sp./Gy
rosigm
a sp.
Pseu
do‐nitzschia spp.
Skeleton
ema co
statum
Unide
ntified
pen
nate diatom
Unide
ntified
Rap
hido
phyte
Euglen
oid sp.
Unide
ntified
Cryptom
onad
/Chrysom
onad
Mesod
inium ru
brum
cf. A
naba
ena (F
W)
Cosm
arium sp
. (FW
)cf. P
seud
osph
aerocystis (FW)
cf. M
icrocystis (F
W)
Aulacoseira
sp. (FW
)Dictyo
spha
erium sp
. (FW
)Nod
ularia sp
. filamen
t (FW
)Oocystis
sp. (FW
)Sp
irulin
a sp. filamen
t (FW
)Straurastrum
sp. (FW
)Urosolenia sp. (FW
)Scen
edesmus sp. (F
W)
Unide
ntified
flagellates
Rhizo
solenia alata
Oxytoxum sp
.Th
alassiothrix/Lioloma sp
Diplon
eis s
p.Am
phidinium sp
.Py
ramim
onas sp
Minidiscus sp
Oxyph
ysis sp
Unide
ntified
dinoflage
llate
Unide
ntified
cen
tric diatom
Unide
ntified
nan
oplank
ton
Gyrod
inium sp
.He
terocapsa sp.
Prob
oscia alata
Ensculife
ra sp
Log (Cell N
o)10‐20 December 2017
Manly Lagoon Z1
Manly Lagoon Z2
Manly Lagoon Z3
Narabeen Lagoon Z1
Narabeen Lagoon Z2
Curl Curl Lagoon Z1
Dee Why Lagoon Z1
Pittwater Z1
Pittwater Z2
Pittwater Z3
Pittwater Z4
Pittwater Z5
17
Figure 7. Phytoplankton abundance in each waterbody, 9 January 2018.
1.E+00
1.E+01
1.E+02
1.E+03
1.E+04
1.E+05
1.E+06
Ceratiu
m tripos
Ceratiu
m tricho
ceros
Ceratiu
m fu
rca
Protop
eridinium sp.
Prorocen
trum
mican
sProrocen
trum
minim
umProrocen
trum
lima
Gym
nodino
id sp
p.Gon
ylau
lax spp.
Scrip
siella
troc
hoidea
Tintinnid sp.
Dino
physis acuta
Amph
oras sp.
Bacillaria
sp.
Coccon
eis sp.
Cerataulina pe
lagica
Eucampia cornuta
Thalasiossira
sp.
Thalassion
ema sp.
Leptoc
ylindrus m
inim
usMelosira
sp.
Navicula sp.
Nitzschia sp.
Chaetoceros sp.
Cylin
drothe
ca closteriu
mPleu
rosig
ma sp./Gy
rosigm
a sp.
Pseu
do‐nitzschia spp.
Skeleton
ema co
statum
Unide
ntified
pen
nate diatom
Unide
ntified
Rap
hido
phyte
Euglen
oid sp.
Unide
ntified
Cryptom
onad
/Chrysom
onad
Mesod
inium ru
brum
cf. A
naba
ena (F
W)
Cosm
arium sp
. (FW
)cf. P
seud
osph
aerocystis (FW)
cf. M
icrocystis (F
W)
Aulacoseira
sp. (FW
)Dictyo
spha
erium sp
. (FW
)Nod
ularia sp
. filamen
t (FW
)Oocystis
sp. (FW
)Sp
irulin
a sp. filamen
t (FW
)Straurastrum
sp. (FW
)Urosolenia sp. (FW
)Scen
edesmus sp. (F
W)
Unide
ntified
flagellates
Rhizo
solenia alata
Oxytoxum sp
.Th
alassiothrix/Lioloma sp
Diplon
eis s
p.Am
phidinium sp
.Py
ramim
onas sp
Minidiscus sp
Oxyph
ysis sp
Unide
ntified
dinoflage
llate
Unide
ntified
cen
tric diatom
Unide
ntified
nan
oplank
ton
Gyrod
inium sp
.He
terocapsa sp.
Prob
oscia alata
Ensculife
ra sp
Log (Cell N
o)9 January 2018
Manly Lagoon Z1
Manly Lagoon Z2
Manly Lagoon Z3
Narabeen Lagoon Z1
Narabeen Lagoon Z2
Curl Curl Lagoon Z1
Dee Why Lagoon Z1
Pittwater Z1
Pittwater Z2
Pittwater Z3
Pittwater Z4
Pittwater Z5
18
Figure 8. Phytoplankton abundance in each waterbody, 23 January 2018.
1.E+00
1.E+01
1.E+02
1.E+03
1.E+04
1.E+05
1.E+06
Ceratiu
m tripos
Ceratiu
m tricho
ceros
Ceratiu
m fu
rca
Protop
eridinium sp.
Prorocen
trum
mican
sProrocen
trum
minim
umProrocen
trum
lima
Gym
nodino
id sp
p.Gon
ylau
lax spp.
Scrip
siella
troc
hoidea
Tintinnid sp.
Dino
physis acuta
Amph
oras sp.
Bacillaria
sp.
Coccon
eis sp.
Cerataulina pe
lagica
Eucampia cornuta
Thalasiossira
sp.
Thalassion
ema sp.
Leptoc
ylindrus m
inim
usMelosira
sp.
Navicula sp.
Nitzschia sp.
Chaetoceros sp.
Cylin
drothe
ca closteriu
mPleu
rosig
ma sp./Gy
rosigm
a sp.
Pseu
do‐nitzschia spp.
Skeleton
ema co
statum
Unide
ntified
pen
nate diatom
Unide
ntified
Rap
hido
phyte
Euglen
oid sp.
Unide
ntified
Cryptom
onad
/Chrysom
onad
Mesod
inium ru
brum
cf. A
naba
ena (F
W)
Cosm
arium sp
. (FW
)cf. P
seud
osph
aerocystis (FW)
cf. M
icrocystis (F
W)
Aulacoseira
sp. (FW
)Dictyo
spha
erium sp
. (FW
)Nod
ularia sp
. filamen
t (FW
)Oocystis
sp. (FW
)Sp
irulin
a sp. filamen
t (FW
)Straurastrum
sp. (FW
)Urosolenia sp. (FW
)Scen
edesmus sp. (F
W)
Unide
ntified
flagellates
Rhizo
solenia alata
Oxytoxum sp
.Th
alassiothrix/Lioloma sp
Diplon
eis s
p.Am
phidinium sp
.Py
ramim
onas sp
Minidiscus sp
Oxyph
ysis sp
Unide
ntified
dinoflage
llate
Unide
ntified
cen
tric diatom
Unide
ntified
nan
oplank
ton
Gyrod
inium sp
.He
terocapsa sp.
Prob
oscia alata
Ensculife
ra sp
Log (Cell N
o)23 January 2018
Manly Lagoon Z1
Manly Lagoon Z2
Manly Lagoon Z3
Narabeen Lagoon Z1
Narabeen Lagoon Z2
Curl Curl Lagoon Z1
Dee Why Lagoon Z1
Pittwater Z1
Pittwater Z2
Pittwater Z3
Pittwater Z4
Pittwater Z5
19
Figure 9. Phytoplankton abundance in each waterbody, 6-7 February 2018.
1.E+00
1.E+01
1.E+02
1.E+03
1.E+04
1.E+05
1.E+06
Ceratiu
m tripos
Ceratiu
m tricho
ceros
Ceratiu
m fu
rca
Protop
eridinium sp.
Prorocen
trum
mican
sProrocen
trum
minim
umProrocen
trum
lima
Gym
nodino
id sp
p.Gon
ylau
lax spp.
Scrip
siella
troc
hoidea
Tintinnid sp.
Dino
physis acuta
Amph
oras sp.
Bacillaria
sp.
Coccon
eis sp.
Cerataulina pe
lagica
Eucampia cornuta
Thalasiossira
sp.
Thalassion
ema sp.
Leptoc
ylindrus m
inim
usMelosira
sp.
Navicula sp.
Nitzschia sp.
Chaetoceros sp.
Cylin
drothe
ca closteriu
mPleu
rosig
ma sp./Gy
rosigm
a sp.
Pseu
do‐nitzschia spp.
Skeleton
ema co
statum
Unide
ntified
pen
nate diatom
Unide
ntified
Rap
hido
phyte
Euglen
oid sp.
Unide
ntified
Cryptom
onad
/Chrysom
onad
Mesod
inium ru
brum
cf. A
naba
ena (F
W)
Cosm
arium sp
. (FW
)cf. P
seud
osph
aerocystis (FW)
cf. M
icrocystis (F
W)
Aulacoseira
sp. (FW
)Dictyo
spha
erium sp
. (FW
)Nod
ularia sp
. filamen
t (FW
)Oocystis
sp. (FW
)Sp
irulin
a sp. filamen
t (FW
)Straurastrum
sp. (FW
)Urosolenia sp. (FW
)Scen
edesmus sp. (F
W)
Unide
ntified
flagellates
Rhizo
solenia alata
Oxytoxum sp
.Th
alassiothrix/Lioloma sp
Diplon
eis s
p.Am
phidinium sp
.Py
ramim
onas sp
Minidiscus sp
Oxyph
ysis sp
Unide
ntified
dinoflage
llate
Unide
ntified
cen
tric diatom
Unide
ntified
nan
oplank
ton
Gyrod
inium sp
.He
terocapsa sp.
Prob
oscia alata
Ensculife
ra sp
Log (Cell N
o)6‐7 February 2016
Manly Lagoon Z1
Manly Lagoon Z2
Manly Lagoon Z3
Narabeen Lagoon Z1
Narabeen Lagoon Z2
Curl Curl Lagoon Z1
Dee Why Lagoon Z1
Pittwater Z1
Pittwater Z2
Pittwater Z3
Pittwater Z4
Pittwater Z5
20
Figure 10. Phytoplankton abundance in each waterbody, 20-21 February 2018.
1.E+00
1.E+01
1.E+02
1.E+03
1.E+04
1.E+05
1.E+06
Ceratiu
m tripos
Ceratiu
m tricho
ceros
Ceratiu
m fu
rca
Protop
eridinium sp.
Prorocen
trum
mican
sProrocen
trum
minim
umProrocen
trum
lima
Gym
nodino
id sp
p.Gon
ylau
lax spp.
Scrip
siella
troc
hoidea
Tintinnid sp.
Dino
physis acuta
Amph
oras sp.
Bacillaria
sp.
Coccon
eis sp.
Cerataulina pe
lagica
Eucampia cornuta
Thalasiossira
sp.
Thalassion
ema sp.
Leptoc
ylindrus m
inim
usMelosira
sp.
Navicula sp.
Nitzschia sp.
Chaetoceros sp.
Cylin
drothe
ca closteriu
mPleu
rosig
ma sp./Gy
rosigm
a sp.
Pseu
do‐nitzschia spp.
Skeleton
ema co
statum
Unide
ntified
pen
nate diatom
Unide
ntified
Rap
hido
phyte
Euglen
oid sp.
Unide
ntified
Cryptom
onad
/Chrysom
onad
Mesod
inium ru
brum
cf. A
naba
ena (F
W)
Cosm
arium sp
. (FW
)cf. P
seud
osph
aerocystis (FW)
cf. M
icrocystis (F
W)
Aulacoseira
sp. (FW
)Dictyo
spha
erium sp
. (FW
)Nod
ularia sp
. filamen
t (FW
)Oocystis
sp. (FW
)Sp
irulin
a sp. filamen
t (FW
)Straurastrum
sp. (FW
)Urosolenia sp. (FW
)Scen
edesmus sp. (F
W)
Unide
ntified
flagellates
Rhizo
solenia alata
Oxytoxum sp
.Th
alassiothrix/Lioloma sp
Diplon
eis s
p.Am
phidinium sp
.Py
ramim
onas sp
Minidiscus sp
Oxyph
ysis sp
Unide
ntified
dinoflage
llate
Unide
ntified
cen
tric diatom
Unide
ntified
nan
oplank
ton
Gyrod
inium sp
.He
terocapsa sp.
Prob
oscia alata
Ensculife
ra sp
Log (Cell N
o)20‐21 February 2018
Manly Lagoon Z1
Manly Lagoon Z2
Manly Lagoon Z3
Narabeen Lagoon Z1
Narabeen Lagoon Z2
Curl Curl Lagoon Z1
Dee Why Lagoon Z1
Pittwater Z1
Pittwater Z2
Pittwater Z3
Pittwater Z4
Pittwater Z5
21
Figure 11. Phytoplankton abundance in each waterbody, 6-7 March 2018.
1.E+00
1.E+01
1.E+02
1.E+03
1.E+04
1.E+05
1.E+06
Ceratiu
m tripos
Ceratiu
m tricho
ceros
Ceratiu
m fu
rca
Protop
eridinium sp.
Prorocen
trum
mican
sProrocen
trum
minim
umProrocen
trum
lima
Gym
nodino
id sp
p.Gon
ylau
lax spp.
Scrip
siella
troc
hoidea
Tintinnid sp.
Dino
physis acuta
Amph
oras sp.
Bacillaria
sp.
Coccon
eis sp.
Cerataulina pe
lagica
Eucampia cornuta
Thalasiossira
sp.
Thalassion
ema sp.
Leptoc
ylindrus m
inim
usMelosira
sp.
Navicula sp.
Nitzschia sp.
Chaetoceros sp.
Cylin
drothe
ca closteriu
mPleu
rosig
ma sp./Gy
rosigm
a sp.
Pseu
do‐nitzschia spp.
Skeleton
ema co
statum
Unide
ntified
pen
nate diatom
Unide
ntified
Rap
hido
phyte
Euglen
oid sp.
Unide
ntified
Cryptom
onad
/Chrysom
onad
Mesod
inium ru
brum
cf. A
naba
ena (F
W)
Cosm
arium sp
. (FW
)cf. P
seud
osph
aerocystis (FW)
cf. M
icrocystis (F
W)
Aulacoseira
sp. (FW
)Dictyo
spha
erium sp
. (FW
)Nod
ularia sp
. filamen
t (FW
)Oocystis
sp. (FW
)Sp
irulin
a sp. filamen
t (FW
)Straurastrum
sp. (FW
)Urosolenia sp. (FW
)Scen
edesmus sp. (F
W)
Unide
ntified
flagellates
Rhizo
solenia alata
Oxytoxum sp
.Th
alassiothrix/Lioloma sp
Diplon
eis s
p.Am
phidinium sp
.Py
ramim
onas sp
Minidiscus sp
Oxyph
ysis sp
Unide
ntified
dinoflage
llate
Unide
ntified
cen
tric diatom
Unide
ntified
nan
oplank
ton
Gyrod
inium sp
.He
terocapsa sp.
Prob
oscia alata
Ensculife
ra sp
Log (Cell N
o)6‐7 March 2018
Manly Lagoon Z1
Manly Lagoon Z2
Manly Lagoon Z3
Narabeen Lagoon Z1
Narabeen Lagoon Z2
Curl Curl Lagoon Z1
Dee Why Lagoon Z1
Pittwater Z1
Pittwater Z2
Pittwater Z3
Pittwater Z4
Pittwater Z5
22
Figure 12. Phytoplankton communities at the Lagoon sites, 20-21 March 2018.
1.E+00
1.E+01
1.E+02
1.E+03
1.E+04
1.E+05
1.E+06
Log (Cell N
o)20‐21 March 2018
Manly Lagoon Z1
Manly Lagoon Z2
Manly Lagoon Z3
Narabeen Lagoon Z1
Narabeen Lagoon Z2
Curl Curl Lagoon Z1
Dee Why Lagoon Z1
Pittwater Z1
Pittwater Z2
Pittwater Z3
Pittwater Z4
Pittwater Z5
23
Figure 13. Monthly mean abundance of Dinophysis acuta in water bodies during November 2017 to March 2018.
1.E+00
1.E+01
1.E+02
1.E+03
1.E+04
1.E+05
ManlyLagoon Z1
ManlyLagoon Z2
ManlyLagoon Z3
NarabeenLagoon Z1
NarabeenLagoon Z2
Curl CurlLagoon Z1
Dee WhyLagoon Z1
PittwaterZ1
PittwaterZ2
PittwaterZ3
PittwaterZ4
PittwaterZ5
D. acu
ta ce
ll no
/LAbundance of D.acuta
November
December
January
February
March
24
Figure 14. Monthly mean abundance of Pseudo-nitzschia spp. in water bodies per month during November 2017 to March 2018.
1.E+00
1.E+01
1.E+02
1.E+03
1.E+04
1.E+05
ManlyLagoon Z1
ManlyLagoon Z2
ManlyLagoon Z3
NarabeenLagoon Z1
NarabeenLagoon Z2
Curl CurlLagoon Z1
Dee WhyLagoon Z1
PittwaterZ1
PittwaterZ2
PittwaterZ3
PittwaterZ4
PittwaterZ5
D. acu
ta ce
ll no
/LAbundance of Pseudo‐nitzchia spp.
November
December
January
February
March
25
Figure 15. Monthly mean abundance of Prorocentrum minimum in water bodies per month during November 2017 to March 2018.
1.E+00
1.E+01
1.E+02
1.E+03
1.E+04
1.E+05
1.E+06
1.E+07
Manly LagoonZ1
Manly LagoonZ2
Manly LagoonZ3
NarabeenLagoon Z1
NarabeenLagoon Z2
Curl CurlLagoon Z1
Dee WhyLagoon Z1
Pittwater Z1 Pittwater Z2 Pittwater Z3 Pittwater Z4 Pittwater Z5
P. m
inim
um cell n
o/L
Abundance of P. minimum
November
December
January
February
March
26
Figures 16A-D. Trends in Prorocentrum minimum abundance at Manly Lagoon (A. site Z1; B. site Z2; C. site Z3; D. all sites averaged) 2011-2018.
A.
y = ‐0.0014x + 60.968R² = 0.2019
0
1
2
3
4
5
6
7
2011 2012 2013 2015 2016 2017 2019
Log1
0 Abunndan
ce Cells/L
Manly Lagoon Z1
B.
y = ‐0.0008x + 34.767R² = 0.0784
0.0
1.0
2.0
3.0
4.0
5.0
6.0
7.0
8.0
9.0
2011 2012 2013 2015 2016 2017 2019
Log1
0 Abunndan
ce Cells/L
Manly Lagoon Z2
27
C.
y = ‐0.0007x + 32.907R² = 0.0745
0.0
1.0
2.0
3.0
4.0
5.0
6.0
7.0
8.0
9.0
2011 2012 2013 2015 2016 2017 2019
Log1
0 Abunndan
ce Cells/L
Manly Lagoon Z3
D.
y = ‐0.0006x + 27.752R² = 0.0618
0.0
1.0
2.0
3.0
4.0
5.0
6.0
7.0
8.0
9.0
2011 2012 2013 2015 2016 2017 2019
Log1
0 Abunndan
ce Cells/L
Manly Lagoon All sites averaged
28
References
Ajani, P., Lee, R., Pritchard, T. and M. Krogh (2001a). Phytoplankton dynamics at a long-term coastal station off Sydney, Australia. J. Coastal Res. 34: 60-73.
Ajani, P., Hallegraeff, G. and T. Pritchard (2001b). Historic Overview of Algal Blooms in Marine and Estuarine Waters of New South Wales, Australia. Proc. Lin. Soc. NSW. No 123: 1-22.
Ajani, P., Brett, S., Krogh, M., Scanes, P., Webster, G. and L. Armand (2013). The risk of harmful algal blooms (HABs) in the oyster growing estuaries of New South Wales. Environ. Mon. Assess. 185(6): 5295-5316.
Ajani, P., Allen, A. P., Ingleton, T. and L. Armand (2014). A decadal decline in abundance and a shift in phytoplankton composition at a long-term coastal station off southeast Australia. Limnol. & Oceanogr. 59(2):519-531.
Anderson D M., J M. Burkholder, W P. Cochlan, P M. Glibert,CJ. Goblere, C A. Heil, R Kudela, M L. Parsons, J.E. J Renseli, D W. Townsend, V L. Trainer, and GA. Vargo . 2008, Harmful algal blooms and eutrophication: Examining linkages from selected coastal regions of the United States. December 1; 8(1): 39–53.
Armbrecht, L. H., Roughan, M., Rossi, V., Schaeffer, A., Davies, P. L., Waite, A., Armand, L. (2014). Phytoplankton composition under contrasting oceanographic conditions: upwelling and downwelling (Eastern Australia), Continental Shelf Research, 75, pp. 54-67.
Cloern, J. E. 2001. Our evolving conceptual model of the coastal eutrophication problem. Mar. Ecol. Progr. Ser., 210, 223-253.
Cummins, S. P., Roberts, D. E., Ajani, P. A. and A. J. Underwood. (2004). Comparison of assemblages of phytoplankton between open water and seagrass habitats in a shallow coastal lagoon. Marine and Freshwater Research, 55: 447-456.
Dasey M, Ryan N, Wilson J, McGregor G, Fabbro L, Neilan B, Burns B, Kankaanpää H Morrison G, Geoffrey A. Codd G, Rissik D, Bowling L. 2005. Investigations into the taxonomy, toxicity and ecology of benthic cyanobacterial accumulations in Myall Lake, Australia. Marine and Freshwater Research 56: 45–55
Gallegos, CL, Bergstrom, P.W.2005. Effects of a Prorocentrum minimum bloom on light availability for and potential impacts on submersed aquatic vegetation in upper Chesapeake Bay. Harmful Algae 4: 553-574.
Glibert, P.M., Magnien, R., Lomas, M.W., Alexander, J., Fan, C., Haramoto, E., Trice, T.M., Kana, T.M., 2001. Harmful algal blooms in the Chesapeake and Coastal Bays of Maryland, USA: comparisons of 1997, 1998, and 1999 events. Estuaries 24, 875–883.
Glibert, P M., Mayorga, E, Seitzinger S. 2008. Prorocentrum minimum tracks anthropogenic nitrogen and phosphorus inputs on a global basis: Application of spatially explicit nutrient export models. Harmful Algae 8: 33-38
Hallegraeff, G. M.,C.J.S. Bolch, D.R.A. Hill, I. Jameson, J.-M. LeRoi, A. McMinn , S. Murray, M.F. de Salas, K. Saunders. 2010. Algae of Australia: Phytoplankton of Temperate Coastal Waters (CSIRO Publishing, Algae of Australia Series).
Heil CA, Glibert PM, Fan C. 2005 Prorocentrum minimum (Pavillard) Schiller –A review of a harmful algal bloom species of growing worldwide importance. Harmful Algae 4:449–470.
29
Madigan, T., Lee K, Padula, D.J., McNabb, P, Pointon, A. 2004. Diarrhetic shellfish poisoning toxins in South Australian shellfish. Harmful Algae 5: 119–123. Murray, S. A., Kohli, G. S., Farrell, H. et al. 2015. A fish kill associated with a bloom of Amphidinium carterae in a coastal lagoon in Sydney, Australia. Harmful Algae, 49: 19-28.
Nixon, S. W. 1995. Coastal marine eutrophication: a definition, social causes, and future concerns. Ophelia, 41, 199-219.
NSW Marine Biotoxin Management Plan (2011). NSW Shellfish Program NSW/FA/FI115/1105, NSW Food Authority, Sydney, pp. 1-36.
Vollenweider, R. A., Marchetti, R. & Viviani, R. 1992. Marine Coastal Eutrophication. Elsevier, London.