Embed Size (px)
Citation preview
1
Micro particle surface layering through dry coating: impact of
moisture content and process parameters on the properties of
orally disintegrating tablets Hamad Alyami1, Jasdip Koner2, Eman Z. Dahmash3, James Bowen4, David Terry5, 6 & Afzal R. Mohammed*
1 Aston School of Pharmacy, Aston University, Birmingham, B4 7ET, United Kingdom, +44-7454-741483,
[email protected] 2 Aston School of Pharmacy, Aston University, Birmingham, B4 7ET, United Kingdom, +44-7725-071192,
[email protected] 3 Aston School of Pharmacy, Aston University, Birmingham, B4 7ET, United Kingdom, +44-7554-802160,
[email protected] 4 Department of Engineering and Innovation, Open University, Milton Keynes, MK7 6AA, United Kingdom,
+44-7903497498, [email protected] 5 Children Hospital, Birmingham, B4 6NH, United Kingdom, +44-121-333-9793, [email protected] 6 Aston School of Pharmacy, Aston University, Birmingham, B4 7ET, United Kingdom, +44-121-333-9786,
*Corresponding author: Aston School of Pharmacy, Aston University, Birmingham, B4 7ET, United Kingdom,
+44-121-204-4183, [email protected]
2
Abstract
Objectives The aim of this study was to investigate the influence of processing parameters in dry coating on
particle and dosage form properties upon varying the surface adsorbed moisture of microcrystalline
cellulose (MCC), a model filler/binder for orally disintegrating tablets (ODTs).
Methods The moisture content of MCC was optimized using the spray water method and analysed using
thermogravimetric analysis. Micro/macro property assessment was determined using atomic force
microscopy, nano indentation, scanning electron microscopy, tablet hardness and disintegration testing.
Key findings The results showed that MCC demonstrated its best flowability at a moisture content of
11.2%w/w when compared to control, comprising of 3.9%w/w moisture. The use of the composite powder
coating process (without air) resulted in up to 80% increase in tablet hardness, when compared to the
control. The study also demonstrated that surface adsorbed moisture can be displaced upon addition of
excipients during dry processing circumventing the need for particle drying prior to tabletting.
Conclusions It was concluded that MCC with a moisture content of 11%w/w provides a good balance
between powder flowability and favourable ODT characteristics.
Keywords
Composite; nanoindentaion; disintegration; flowability; hardness
3
Introduction
In recent years, paediatric drug development has come to the forefront of research due to the incentives
offered by regulatory bodies in the US and within the EU, including financial rewards and patent extensions
for drug formulations[1]. In the past, big Pharma companies were more focused on developing adult friendly
dosage forms due to the high profit margins and perceived lower risk of development. Children are a unique
entity in the fact that they develop at a vast rate, from the day of birth to becoming adults, with the first 18
years of their lives sub classified in to several groups: Premature new-borns (<38 weeks gestational age);
Term new-borns (>38 weeks gestational age); Neonate (0-30 days); Infant (1month-2 years); Young Child (2-
6 years); Child (6-12 years) and Adolescents (12-18 years)[2]. This presents various formulation challenges,
primarily pharmacokinetic and pharmacodynamic, as absorption, distribution, metabolism and excretion are
highly varied throughout these years, and the dose for administration needs to be tailored throughout the
paediatric age range[3].
For paediatric dosage forms to be acceptable there are a number of practical aspects that also need to be
considered such as, risk of choking for solid dosage forms, elegance, palatability and acceptance of the
dosage form by the child[4]. Historically oral liquid dosage forms, such as syrups, have been the dosage form
of choice for many paediatric patients due to their ease of administration and dose flexibility. Nonetheless,
oral liquid dosage forms have many disadvantages such as: poor taste of bitter drugs; drug stability, with
many antibiotic formulations having 7-14 day expiry after reconstitution; storage conditions, with many
being items that need to be kept in the fridge and transportability issues, with liquid bottles occupying large
space. Consequently, the WHO recently stated that young children may be treated with oral solid dosage
forms, such as orally disintegrating tablets (ODTs) and as such there is a concerted effort in understanding
and developing technologies to formulate these dosage forms [5].
ODTs are a dosage form designed to disperse on the tongue when it comes in to contact with saliva, thereby
reducing the need for tablets to be swallowed whole without water, making them ideal dosage forms for
paediatric populations. The standards for a dosage form to be classed as an ODT is that ‘it must disintegrate
rapidly in the oral cavity, with an in-vitro disintegration time of approximately 30 seconds or less’, and in
general have a weight of no more than 500mg[6]. ODTs combine the advantages of solid and liquid dosage
forms with some novel ODT technologies allowing high drug loading whilst offering pleasant mouth feel with
an acceptable taste.
Although ODTs present many advantages over other paediatric formulations, there are several challenges
associated with these types of tablets. There are two common methods of manufacture; freeze drying, that
produces rapidly disintegrating tablets which are often mechanically weak and require specialised packaging
and equipment, and direct compression[7]. Direct compression utilises traditional tableting equipment and
requires no specialised processing techniques to form robust and fast disintegrating ODTs. Due to the
simplicity of the method, excipient and bulk powder characteristics need to be considered. Flowability of the
bulk powder is of particular importance as the powder needs to be able to flow in to the dies at a consistent
rate to form uniform tablets that have a consistent weight and drug content. As the tablets disintegrate
within the oral cavity, taste is a key factor that needs to be evaluated, as poor palatability of the dosage form
would lead to poor medication adherence. This can often be solved using flavourings and sweeteners, with
more complex systems such as film coating of granules and microencapsulation also used, which can often
increase development costs and also expose active pharmaceutical ingredients (APIs) to unfavourable
conditions. One of the simplest ways to address this issue is the use of mannitol, a polyol isomer of sorbitol,
4
which has a very sweet taste and cooling effect in the mouth and can often provide a palatable dosage form [8]. It has dual functionality in that it is also a popular binder/filler used in ODTs due to its advantages in
producing acceptable dosage forms. Other considerations specifically for ODTs include disintegration time,
as this needs to be optimised to allow the dosage form to disintegrate within specified timeframes. This can
often involve the use of superdisintegrants in the powder blend, such as crospovidone, which uses capillary
action to induce water uptake in to the tablet through wicking mechanisms, resulting in a rapid volume
expansion of the tablet and subsequent break-up of the tablet structure[9]. Inclusion of superdisintegrants
in to ODTs can increase moisture sensitivity in ODTs. High levels of moisture in the final dosage form can
present difficulties particularly in ODTs, due to their ability to uptake moisture from the surroundings as well
as their fast disintegrating properties [10] Including mannitol can often aid in reducing the hygroscopic nature
of the ODT, due to mannitols non-hygroscopic nature[8]. Alongside this, powder deformation processes need
to be evaluated to minimise the elastic deformation properties of the powder, which could lead to capping
and lamination of the tablet [11]. MCC is a common excipient employed in ODTs as it has very high
compactability due to its plastic behaviour, leading to robust dosage form manufacture[12].
The objective of this study was to study the effects of moisture content on MCC, which is a model
filler/binder for ODTs, in order to optimise the moisture levels to produce the most advantageous
powder/tablets. A novel composite coater developed in our laboratory was used to investigate the effect of
process parameters on the moisture content, as well as studying the effect of excipient addition on the
resultant moisture. It was hypothesised that the powder coater could be used as a novel tool to optimise
moisture levels within MCC to a desirable quantity, producing not only a favourable pre-processed material
with good flowability and compaction properties, but also a suitable tableting excipient to formulate robust
ODTs without a resultant compromise in disintegration time.
5
Materials and Methods
Materials
D-mannitol, magnesium stearate and sodium chloride salt (NaCl) were purchased from Sigma-Aldrich (Pool,
UK), while microcrystalline cellulose (MCC) (Avicel PH-200) was obtained from FMC BioPolymer Europe
(Brussels, Belgium). Crospovidone (CrosPVP, Polyplasdone® XL-10) was obtained from Ashland (Wilmington,
USA). All the ingredients were of pharmaceutical grade.
Methods
Optimisation of Moisture Content
The first step of the moisture process began with weighing a precise amount of the original MCC powder
(20g) (MCC1) which was spread evenly on a tray. In the next step, increments of distilled water were added
at approximately 30 second intervals without any shaking. The moisture content was tested at intermittent
durations until the desired moisture contents 11.2% (MCC 2) and 40% (MCC 3) were obtained. The amount
of added water was approximately 5-10 ml providing moisture content between 10% and 40% for the MCC
powder. The moist powders were transferred into a small airtight container and sealed using para film.
Sieving process, interactive and composite powder coating technique
The two key excipients studied included microcrystalline cellulose (MCC) and mannitol. Selected particle
sizes of both D-mannitol and MCC were obtained by sieving. MCC was passed through sieve with mesh size
of 355μm and the sample retained at sieves with pores size of 250μm was used. D-mannitol was sieved using
38μm sieve and particles retained on the 20μm sieve were used. The composite mixing process was carried
out considering several critical operating parameters; speed of the mixer, mixing time and the use of air flow.
As for the materials used, the parameters considered were pertinent to the guest loading percentage,
measured in weight per weight, and the type of carrier material in terms of particle size and shape. Samples
were tested alongside interactive mixtures with the same content, but mixed at low speeds (300rpm) and a
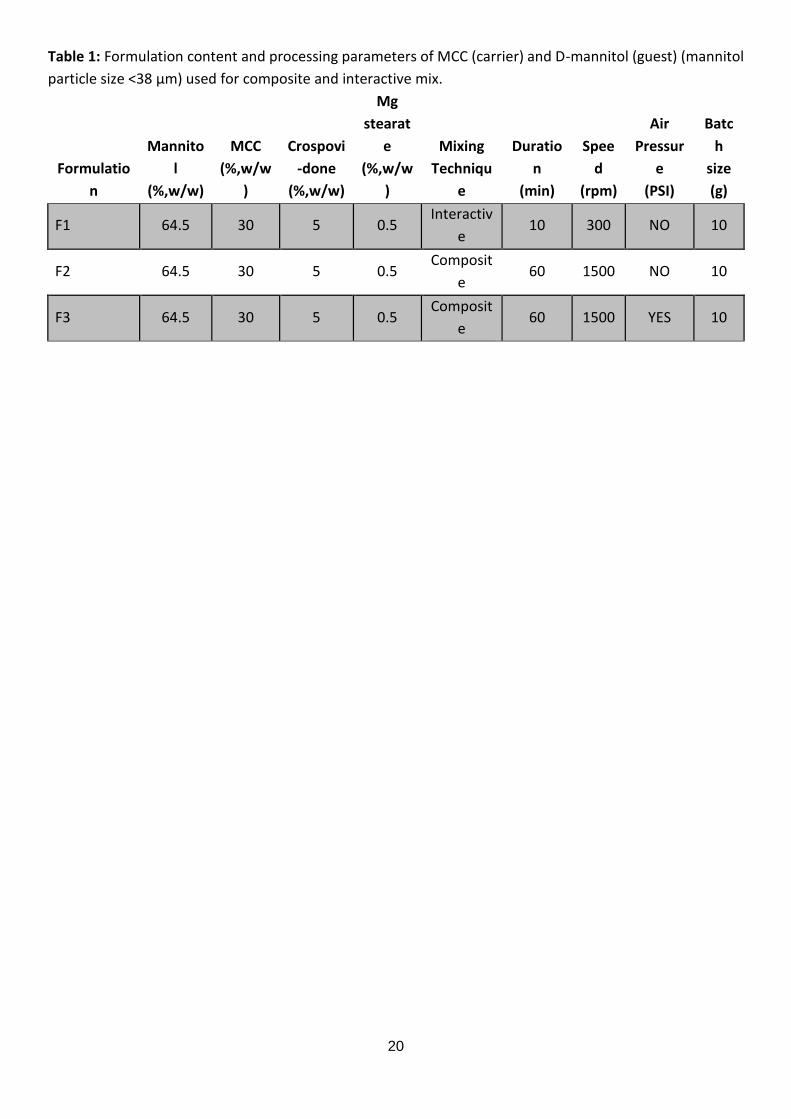
shorter time (10 minutes). The formulation and the processing parameters are listed in table 1 below.
Characterising interactive and powder coating
Measurement of powder moisture content using TGA
A thermogravimetric analyzer, Pyris 1 TGA from Perkin Elmer (Massachusetts, USA) was used to measure
the moisture content of all powders. 2-5 mg of each sample was loaded onto the TGA pan and heated
between 30-300°C at a scanning rate of 30°C/min and held for 5 minutes at 100°C under a nitrogen stream.
Pyris Manager Software (version 5.00.02) was used for analysing the obtained thermograms. Moisture
content was obtained by calculating Δy for each run between 70°C and 130°C. All samples were analyzed in
triplicate.
Assessment of powder flow properties by measurement of angle of repose
The angle of repose measurement was performed using the recommended British Pharmacopeia
procedure[13]. Approximately 10 g of powder was poured through a funnel into a base free from vibration
to form a pile. The funnel was positioned 2 - 5 cm from the top of the powder pile as it was forming. Angle
of repose was determined by measuring the height of the pile (h) and diameter of the base (d); then angle
of repose (α) was calculated from the equation:
𝑡𝑎𝑛α = ℎ ÷ (0.5 × 𝑑)
6
Scanning electron microscopy (SEM)
The morphology of MCC at different moisture contents, D-mannitol, the mixture and the coated powder
particles were examined using a Stereoscan 90 from Cambridge Instruments (Crawley, UK) scanning electron
microscope (SEM). Approximately 1-2 mg of each material was placed onto a double-sided adhesive strip on
an aluminium stub. The specimen stub was coated with a thin layer of gold using a Polaron SC500 sputter
coater from Polaron Equipment ltd. (Watford, UK) at 20 mA for 3 min followed by sample examination using
SEM. The acceleration voltage (kV) and the magnification can be seen on each micrograph. Various
magnifications were applied to identify characteristics of the powders.
Particle size analysis
Particle size of the powders was measured by the laser diffraction technique using HELOS/BR particles size
analyzer equipped with a RODOS dry disperser with VIBRI/L vibrating feeder, from Sympatec (Clausthal-
Zellerfeld, Germany). The measuring range of the lens was 0 - 175µm. About 1 g of each powder was placed
in the feeder tray and the run started at trigger condition of 2% Copt (optical concentration) for 10 sec with
a powder dispensing pressure of 2bar. Volume mean diameter (VMD) was recorded for the powders and all
the measurements were examined in triplicate.
Atomic Force Microscopy (AFM)
Acquisition of topographical data was performed using a NanoWizard II AFM (JPK, UK) operating in force
scan mapping mode under ambient conditions (18oC, 50% relative humidity). This involved the use of a
scanner with a maximum lateral range of 100 × 100μm and a maximum vertical range of 15μm. Data
acquisition was performed using rectangular Si cantilevers (HQ:CSC17/noAl, MikroMasch, Estonia) having
pyramidal tips with 10nm nominal radii of curvature. Cantilever spring constants were on the order 0.3N/m,
calibrated according to the method reported by [14]. Topography was assessed over a 2μm x 2μm area using
a grid of 128 x 128 pixels. Data was acquired by driving the fixed end of the cantilever at a velocity of 50μm/s
towards the sample surface, whilst monitoring the deflection of the free end of the cantilever using a laser
beam. Upon making contact with a surface feature, the height of the contact point was recorded,
representing one pixel in the image, which was converted into a map of surface topography. A maximum
compressive load of 10nN was applied to the surface during data acquisition.
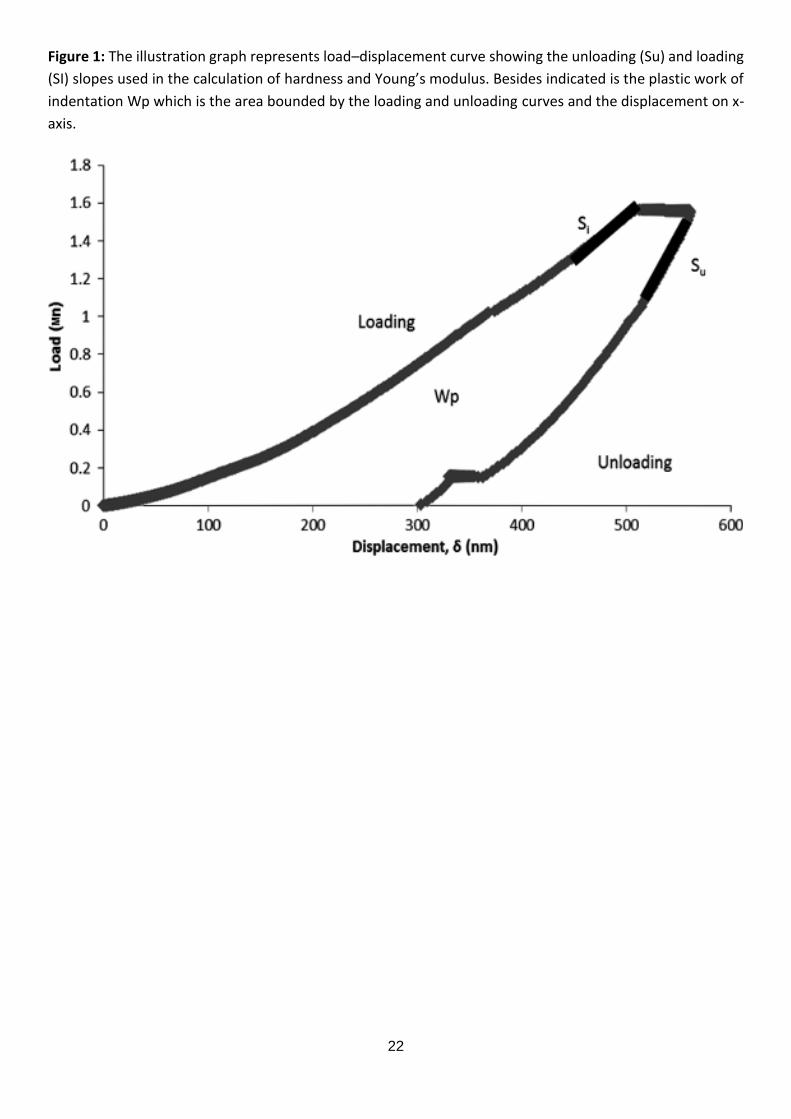
Nanoindentation
The hardness and Young’s modulus of the powder wafers was measured using a Nanoindenter XP (MTS,
USA) employing a diamond-coated Berkovich indenter. 36 indentations were performed perpendicular to
the wafer surface, each in a different unperturbed area. Samples were indented at a strain rate of 0.05s-1 to
a maximum depth of 500nm. The hardness and Young’s modulus were calculated from analysis of the load-
displacement data, fitting a second order polynomial to the unloading curve (Figure 1) [15]. The Poisson’s
ratio of the powder was assumed to be 0.3. In this approach the total penetration depth is assumed by the
sum of the plastic depth (contact depth), δc, and the elastic depth, δe, which represents the elastic flexure
of the surface during loading. Thus the total penetration depth, δ, is given by
𝛿 = 𝛿𝑐 + 𝛿𝑒
and
𝛿𝑒 = 휀 (𝑃 ÷ 𝑆𝑢)
7
Where Su is the slope of the unloading curve at maximum load (see fig 3), P is the indenter load and ε is a
constant which depends on indenter geometry. So the hardness, H, is then given by equation
𝐻 = 𝑃 ÷ 𝐴𝑐
Where Ac is an ideal Berkovich indenter constant .Young’s modulus can be determined from the slope of
the unloading curve using a modified form of Sneddon’s flat punch equation where
𝑆u = 𝛾𝛽 2
√𝜋 𝐸𝑟√Ac
Where γ is the correction factor, β is the cone to pyramid indenter conversion factor and Er is the contact
modulus which can be derived from Young’s modulus € and Poisson’s ratio (v) of the indenter and the test
material via
1
𝐸𝑟=
1 − 𝑣𝑚2
𝐸𝑚+
1 − 𝑣𝑖2
𝐸𝑖
Where the m and i refer to the test material and indenter, respectively.
Calculation of surface coverage
Surface coverage was calculated using the equation and method described in[16]. The amount of guest
material in weight percentage (Gwt%) required to achieve 100% coverage within the given parameters was
as follows:
𝐺𝑤𝑡% =𝑁𝑑3 𝑝𝑑
(𝐷3 𝑝𝐷) + (𝑁𝑑3 𝑝𝑑) × 100
Where N is:
𝑁 =4(𝐷 + 𝑑)2
𝑑2
Where d is the diameter of guest particle, D is the diameter of the host particle, pd is the density of the guest
particle and pD is the density of the host particle.
Tablet Preparation and Characterization
Ternary mixture tablets were prepared comprising of the excipients at fixed quantities: 30% w/w of MCC,
5% w/w crospovidone, and 64.5% w/w mannitol and 0.5 % w/w magnesium stearate (lubricant). Powders
were processed as interactive/composite mixes and compacted into 500 mg tablets under compression force
of 10 KN, with a dwell time of 6s before compression force was released. The tablet press utilized for
preparing the tablets was a bench-top semi-automatic hydraulic press from Specac Ltd. (Slough, UK)
equipped with flat faced dies of 13 mm diameter. Tablets were characterized for porosity, hardness,
disintegration time and friability. All tests were carried out in triplicate (n=3).
Tablet hardness
A tablet hardness tester from Schleuniger (Thun, Switzerland) was used to examine the hardness of three
tablets of each formulation. Hardness is the force required to break up the tablet from its original structure
8
and was measured in Newtons (N) for this study. All measurements were carried out in triplicate and the
values reported as mean ± standard deviation.
Tablet disintegration
The disintegration time was obtained using the standard USP moving basket apparatus (USP Convention,
2005). A ZT3 disintegration tester from Erweka (Heusenstamm, Germany) was used. A tablet was placed in
the disintegration basket (without using a disk) which was raised and lowered at a constant frequency of 30
cycles/min in the disintegration medium. Distilled water (800 mL) maintained at 37°C was used as the
disintegration medium while disintegration time was recorded for one tablet at a time to improve accuracy
of recording. Time of disintegration was recorded when all the disintegrated fractions of tablet passed
through the mesh at the base of the disintegration basket.
Tablet friability
The ability of the tablets to withstand mechanical stress, known as friability was measured using a Roche
friabilator from J. Engelsmann AG (Ludwigshafen, Germany). 10 tablets were rotated at 25 rpm for 100
revolutions. Tablets were de-dusted before and after the test, and friability expressed as the percentage loss
in weight. The percentages loss in weight (% Friability) was calculated using the following equation.
% 𝐹𝑟𝑖𝑎𝑏𝑖𝑙𝑖𝑡𝑦 = 𝐼𝑛𝑖𝑡𝑖𝑎𝑙 𝑊𝑒𝑖𝑔ℎ𝑡 − 𝐹𝑖𝑛𝑎𝑙 𝑤𝑒𝑖𝑔ℎ𝑡
𝐼𝑛𝑖𝑡𝑖𝑎𝑙 𝑤𝑒𝑖𝑔ℎ𝑡 × 100
Tablet porosity
Tablet porosity was measured using a helium multipycnometer from Quantachrome Instruments (Syosset,
USA). One tablet was placed in a micro sample cell of the instrument and the true volume Vt was obtained
using the equation:
𝑉𝑡 = 𝑉𝐶 − 𝑉𝑅 (𝑃1
𝑃2 − 1)
Where Vt is true volume of the sample, VC is volume of the sample cell, VR is the known reference volume,
P1 is atmospheric pressure and P2 is pressure change during determination. Vt was used to calculate the
true density of the tablet by weighing the tablet and substituting the values into:
𝑇𝑟𝑢𝑒 𝐷𝑒𝑛𝑠𝑖𝑡𝑦 = 𝑇𝑎𝑏𝑙𝑒𝑡 𝑊𝑒𝑖𝑔ℎ𝑡
𝑇𝑟𝑢𝑒 𝑉𝑜𝑙𝑢𝑚𝑒
Porosity (ε) was calculated using the equation:
휀 = 1 − (𝐵𝑢𝑙𝑘 𝐷𝑒𝑛𝑠𝑖𝑡𝑦
𝑇𝑟𝑢𝑒 𝐷𝑒𝑛𝑠𝑖𝑡𝑦)
Bulk density was calculated from:
𝐵𝑢𝑙𝑘 𝐷𝑒𝑛𝑠𝑖𝑡𝑦 = 𝑇𝑎𝑏𝑙𝑒𝑡 𝑊𝑒𝑖𝑔ℎ𝑡
𝐵𝑢𝑙𝑘 𝑉𝑜𝑙𝑢𝑚𝑒
Bulk volume was acquired by measuring the radius (r) and thickness (h) of the tablet using a digital calliper
and substituting in the equation for volume of a flat-faced tablet:
𝑉 = 𝜋 × 𝑟2 × ℎ
9
Statistical analysis
One way ANOVA followed by Tukey post-hoc test or student t-test were performed according to the
obtained results, using GraphPad Prism 6.02 software (California, USA). Statistical significance was
considered at a p value <0.05. Where applicable, all results are presented as mean ± SD for triplicate
measurements to account for the noise encountered within the experiments.
10
Results and Discussion
The work presented in this study provides a systematic investigation on the impact of moisture content of
MCC on powder and tablet performance. Moisture content of the pre and post processed materials; MCC,
D-mannitol, crospovidone, magnesium stearate and the ternary mixtures were analysed using TGA for loss
on drying. These excipients were selected based on their role as binders, fillers, disintegrants or dual
functional binder/disintegrant systems within ODTs. The majority of the work on moisture content was
conducted with MCC as it is a hygroscopic excipient that is commonly employed within ODTs as a
binder/filler[17].
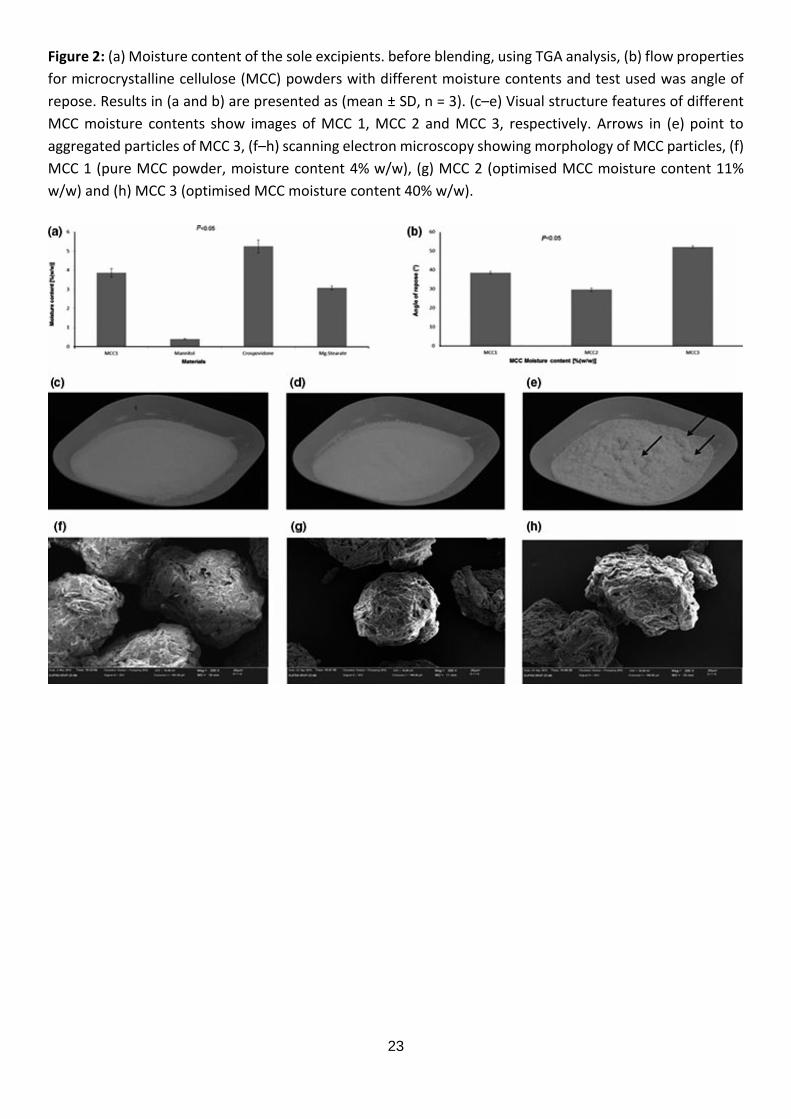
Moisture content of the investigated excipients
Error! Reference source not found.(a) shows the levels of moisture obtained from each of the studied
excipients through TGA analysis. It was seen that D-mannitol had the lowest moisture content, at about 0.5%
w/w compared to MCC, which had a moisture content of 3.8% w/w. This was in line with the literature
findings where the moisture content of MCC was reported to be around 3-4% w/w[18]. with D-mannitol
expected to have low moisture content due to its non-hygroscopic nature[8].
In this study it was hypothesised that the levels of moisture within MCC influenced the physio-mechanical
properties of the particles, including their hardness/tensile strength, flow and their compaction behaviour.
In order to achieve different levels of moisture within MCC, the micro-spray method was used to increase
levels of adsorbed water in the MCC to two different levels compared to the control MCC (4%) (MCC 1),
which had not been subjected to moisture addition. The moisture contents investigated were 11% w/w (MCC
2) and 40% w/w (MCC 3). The three MCC powders were then subjected to a range of investigations to
ascertain the effect that the moisture had during processing, addition of further excipients and on the tablet
properties of the ODTs.
Effect of moisture content on morphology and flow of MCC
Good flow properties are a requirement for the successful manufacturing of tablets as it affects mixing,
content uniformity, tablet compression and scale-up operations[19]. Flow properties of the materials tested
were primarily affected by the size and shape of the particles within the powder, which in turn affected the
cohesivity and the mechanical interlocking between the particles[20]. Flow properties were evaluated before
mixing/tableting was carried out for the different MCC powders. Powder flow properties of the different
MCC powders were assessed by measuring the angle of repose. The results showed significant differences
(ANOVA, p<0.05) between the angle of repose of the powders, with MCC 2, at 11%w/w moisture content,
demonstrating the best flowability with a low angle of repose at 29.60±0.86°, as shown in Figure 2(b) when
compared to the control MCC, which had a fair flow, with the angle of repose of 38.52±0.67°. However at
high moisture content of 40%w/w (MCC 3), poor flow was observed, with the angle of repose at 52±0.61°,
indicating that high levels of moisture significantly worsened the flow properties of the powder[21],
At low moisture levels, water on the particle surface acted as a lubricant by decreasing friction and increasing
the flowability of the powder thereby allowing the particles to move more easily over each other. For MCC2
it can be hypothesised that the moisture was able to act as a lubricant and increased the distance between
the particles which also had the dual effect of reducing the effect of the van der Waals forces and reducing
the cohesive forces. Once monolayer coverage was achieved, additional water did not significantly
11
contribute to the lubricating and spacing effect and therefore further enhancements in flowability were
minimal[22],
On the other hand, MCC showed a sharp decrease in flowability with increasing moisture content up to 40%
W/W. This was attributed to the increased cohesion from the stronger liquid bridges formed from the
condensed water on the surface of the particles. At higher moisture levels, the water possibly increased
cohesion through stronger liquid bridges thereby reducing flowability. Furthermore, water could primarily
affect cohesion by increasing capillary forces through strengthening liquid bridges between the particles[23,
24]. When the angle of repose test was carried out, it was also observed that MCC adhered to the funnel,
(Error! Reference source not found. (e)), demonstrating that not only did the powder become more cohesive
in nature, it also became more adhesive to external surfaces, indicating a worsening flow.
Analysis of SEM images after curing of MCC powder showed a slight enlargement in size with MCC 2 (at 11%
moisture content), as shown in Error! Reference source not found.(g) which possibly was an additional
factor for improved flowbaility, as the larger particle size results in a reduction in cohesivity of the particles
due to lower electrostatic forces, thereby enhancing the flow of particles [25]. It could also be said that the
fine particles contained within the powder were also able to agglomerate/coat the larger particles, resulting
in an increased particle size, due to the increased cohesivity, which reduced the overall cohesiveness of the
blend and synergistically worked with the lubricating effect of the surface adsorbed water to improve the
flow of MCC.
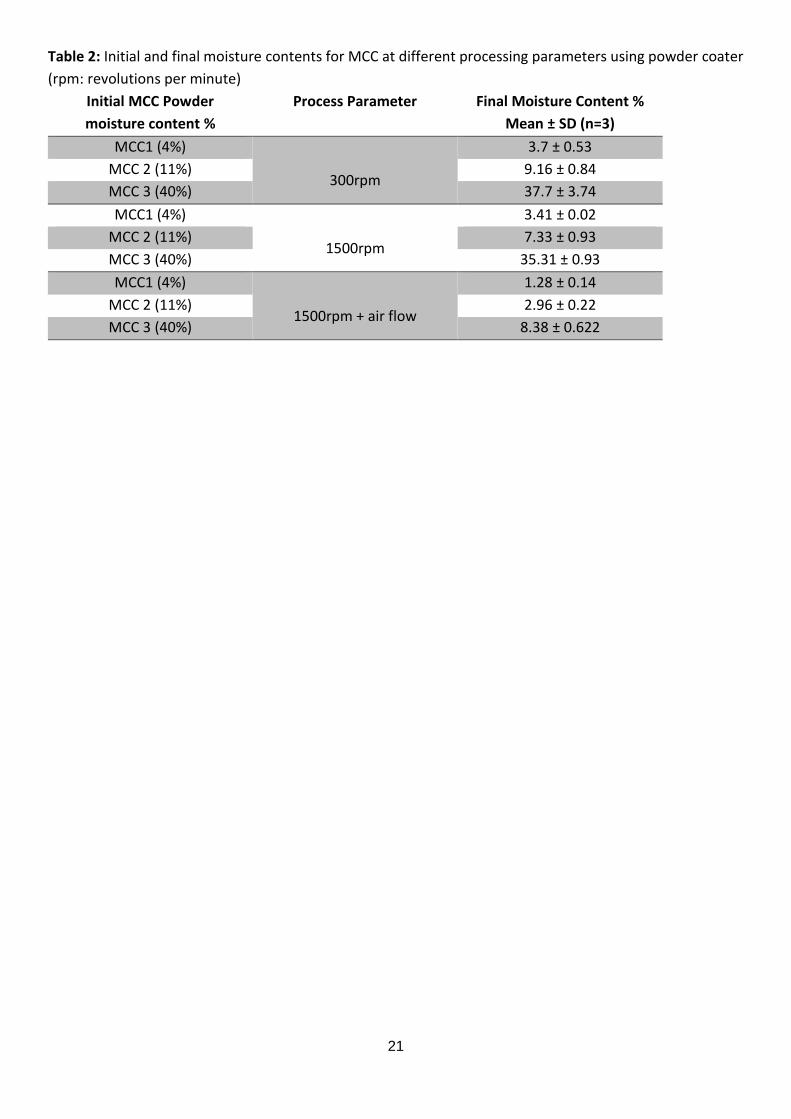
The effect of process parameters on MCC moisture content
To assess the effects of processing parameters on the moisture content of the MCC powders, three different
parameters were used with each of the powders of MCC to analyse the effect on the resultant moisture
content.
In this study a novel composite coater designed and built in our laboratory was used as the mixer of choice,
and the effect of processing parameters within this device were assessed (Table 1). The first parameter was
to mix the powder at a low speed of 300rpm for 10 minutes to achieve interactive mixture (10 minutes was
chosen as previous work in the group had shown that this duration produced a homogenous interactive mix).
The second processing parameter included the composite coater at a speed of 1500rpm for 60 minutes,
which would be used to form composite dry coated particles due to the high shear forces generated by the
device. The third parameter had the device at the same speed and time as the second parameter (1500rpm
for 60 minutes) but with the inclusion of air to increase the deagglomerating and shear forces during mixing
and to aid and increase the dry coating capabilities of the excipients used in the mix. The resultant moisture
content of the three MCC powders after undergoing the different processing parameters are displayed in
Error! Reference source not found..
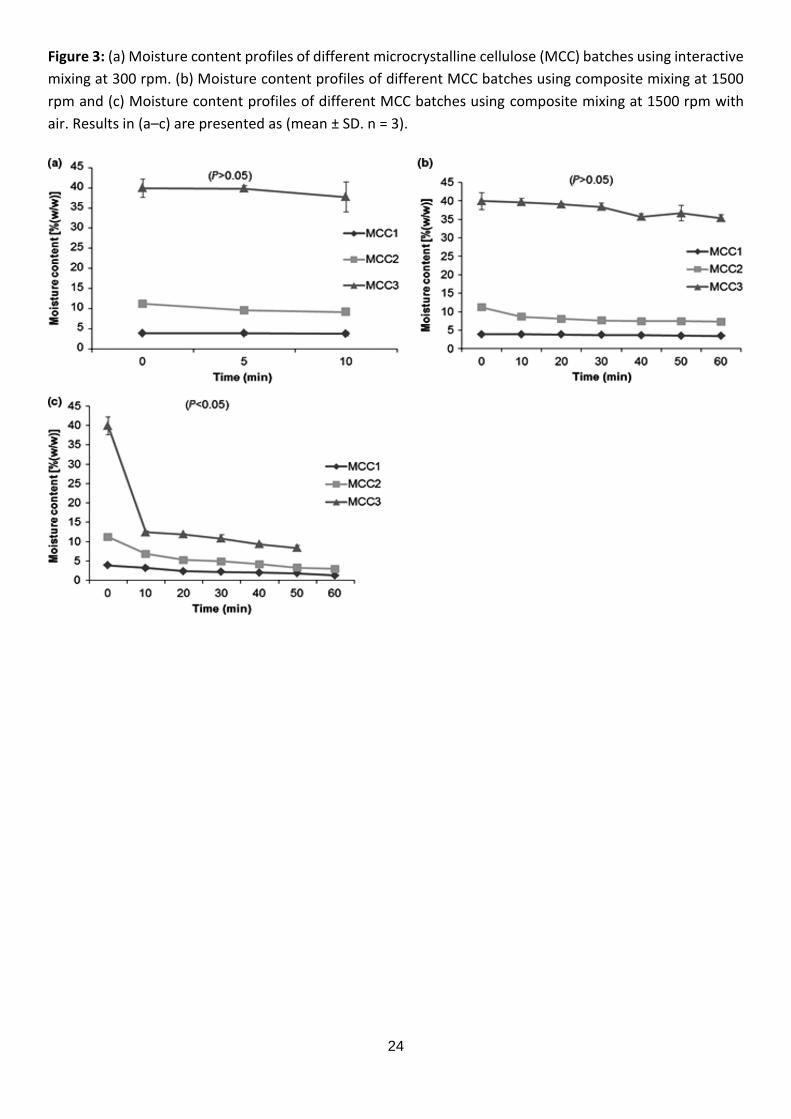
The interactively mixed powders at 300rpm are shown in Error! Reference source not found. (b). The results
showed no significant difference (ANOVA p>0.05) between the moisture content over time, indicating the
mixing method had little effect on the moisture. Similarly, Error! Reference source not found.(b) shows that
no significant difference in moisture content was observed using composite mixing without including air
pressure (ANOVA p>0.05) in all three powders.
12
Results of the moisture content over time using air in the mixing process are shown in Error! Reference
source not found. (c) and demonstrated that the use of air at a mixing speed of 1500 rpm resulted in a
significant decrease in the moisture content of MCC (p<0.05). This could possibly be attributed to the
formation of vortexes/whirlpools within the system upon fluidisation of powder bed, which was
demonstrated by computational fluid dynamics (CFD) (data not shown). This vortex was responsible for the
fluid environment in the chamber resulting in the enhancement of the drying of the powder; hence there
was a large reduction in moisture content of the powders when air was introduced during mixing. This led
to the hypothesis that use of air in the processing of high moisture excipients could therefore be used to
optimise levels of moisture within the excipient to the user’s desired levels, with processing times altered
according to the required final moisture content.
Mechanistic investigation of adding excipients and its effect on the moisture content of MCC
To assess the effects of excipient addition on moisture content, mannitol and crospovidone were added to
the different MCC powders. For interactive mixing, all three materials were added together and mixed for
10 minutes. For composite coating, excipients were added in a two-step process. Firstly to optimise the
amount of mannitol added to form a full surface coverage around the MCC particles, surface coverage was
calculated using equations by Yang et al (2005) with the following parameters; true density of MCC being
1.94g/cm3 and D-mannitol 1.67 g/cm3; particle size of MCC being 2 50μm and D-mannitol 25.9μm, resulting
in the percentage per weight of mannitol to achieve complete coverage calculated at 30.28%. This amount
of guest particle (mannitol) was in agreement with the results stated in [16] as with a volume ratio of 5 the
average coverage was around 56%. The value for surface coverage would be significantly reduced upon the
reduction in particle size of mannitol or increase in particle size of MCC. The second step involved the
addition of the remaining portion of the mannitol, alongside the addition of the crospovidone which was
mixed for a further 30 minutes to form the final mixture.
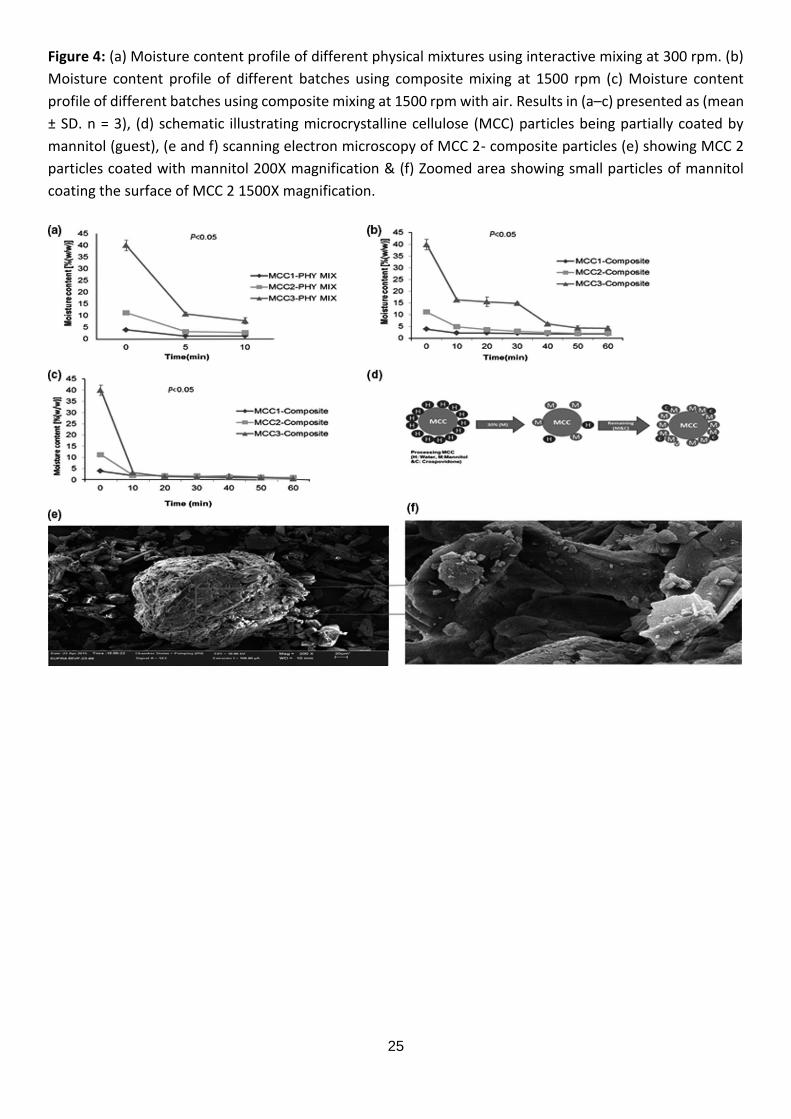
Error! Reference source not found.(a-c) show the moisture content profiles of the interactive against
compositely mixed powders. All graphs indicated a reduction in the moisture content when the materials, in
particular mannitol, were added to MCC, compared to MCC alone (ANOVA, p<0.05). With the interactive mix
there was a large drop in the MCC moisture content for all three of the powders tested when the excipients
were added to the powder blend and mixed over the 10 minute time period. In terms of the composite
blends, SEM images, in figure 4(e&f), showed that the mannitol was attached to the surface of MCC 2
particles and formed a coat around the MCC. Figure 4(b&c) showed the moisture loss of the two composite
coating processes, without air and with air respectively, and both indicated very large drops in moisture
content after 60 minutes, due to the addition of the excipients. With the mixing that included air, as shown
in figure 4(c), the moisture content was expected to reduce more dramatically as the air within the chamber
aided in the drying of the MCC powder. Alongside the use of air, the addition of excipient resulted in around
35% of moisture being lost in the first 10 minutes for MCC 3. In comparison to the use of air alone figure 3(c)
where the moisture loss after 10 minutes was around 25%, it showed that the addition of excipients was a
key factor in the loss of moisture from the MCC particles. Comparing air and excipients, it was seen that the
moisture loss of the MCC at 1500 rpm with air was very similar to when the mannitol was added to the MCC
without air at a 1500 rpm mixing speed, with the moisture content of MCC 3 dropping to around 15% in both
cases.
13
It was hypothesised that the water particles acted as a guest molecule and surrounded MCC during the
introduction of external moisture. However, once the mannitol was added to the mix, it attaches itself to
the surface of the MCC during the coating process, to replace water molecules, as there was a difference in
the densities between mannitol and water, with water having a relative density of 1g/cm3 and mannitol
density being 1.67g/cm3. Therefore, it was assumed that water droplets were knocked out from the surface
of MCC by mannitol, which resulted in the reduction in the moisture content observed in Error! Reference
source not found.(d). Of particular interest was the composite mix without air, shown in figure 4(b), where
there was a large loss of moisture observed upon the addition of the first portion of mannitol, with around
25% moisture loss within 10 minutes of mixing followed by a plateau of moisture loss up until 30 minutes.
However upon the second stage of excipient addition at 30 minutes, there was a further large drop in
moisture content between 30-40 minutes by around 10%, which again plateaued. This indicated that the
addition of other solid materials in to the powder blend clearly resulted in a loss in moisture as increased
amounts of water were displaced from the surface of the MCC particles during the addition of further solid
material. This supported the theory that water was substituted on the surface of MCC particles, as shown in
figure 4(d), as the addition of the excipients in two stages resulted in further loss of water at each stage of
excipient addition. To further understand these differences and to substantiate the above hypothesis, micro
and macro properties of the materials were studied using a range of different techniques.
Investigation of the Micro and Macro properties of Ternary mixed powder blends
Micro Property assessment using AFM, Nano indentation and SEM
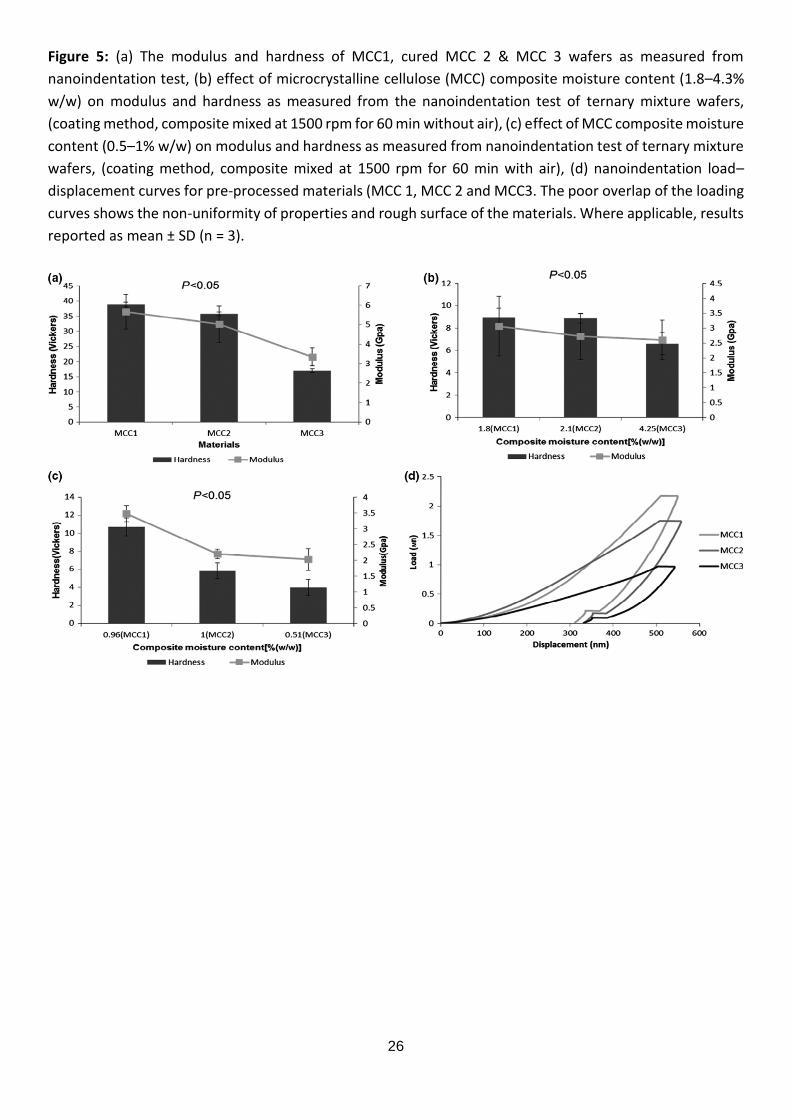
Nanoindentation was used to assess the micro-mechanical properties of the different MCC particles, with
penetration resistance and hardness being two key features assessed. Wafers were prepared to give a
uniform flat surface, as nanoindentation only tested local to the sample surface on to which the indents
were performed. Wafers with the three different moisture contents of MCC and the interactive/compositely
mixed powders were prepared and were subjected to the nanoindentation test, to examine viscoelastic
behaviour and their elastic modulus and hardness. Modulus and hardness of the wafers prepared from the
three MCC moisture contents and powders compositely mixed at 1500 rpm with and without air were
obtained and displayed in Error! Reference source not found.(a,b&c) respectively. With regards to the pre-
processing materials, MCC 1, MCC 2 and MCC 3 pellets were subjected to the nanoindentaion test and the
load penetration graph is shown in Error! Reference source not found.(d). The penetration of the
nanoindenter on the surface of the pellet was governed by many features, for example the degree of
compaction of the particles in the pellet and the structure and porosity of the particles[26]. MCC 1 and MCC
2 showed similar profiles, indicating approximately the same absorption of energy during the
loading/unloading cycle. In MCC 3 penetration was much less and the deformation predominantly showed
an elastic profile. MCC 3 was found to have the lowest modulus at around 3.34 GPa and hardness around 17
Vickers, which could have been due to high moisture content and wide particle size distribution, giving rise
to porous aggregates, which were subsequently confirmed by visual and SEM analysis in (shown in section
3.1). The results of the modulus and hardness of the different MCC powders showed a significant difference
(ANOVA,p<0.05).
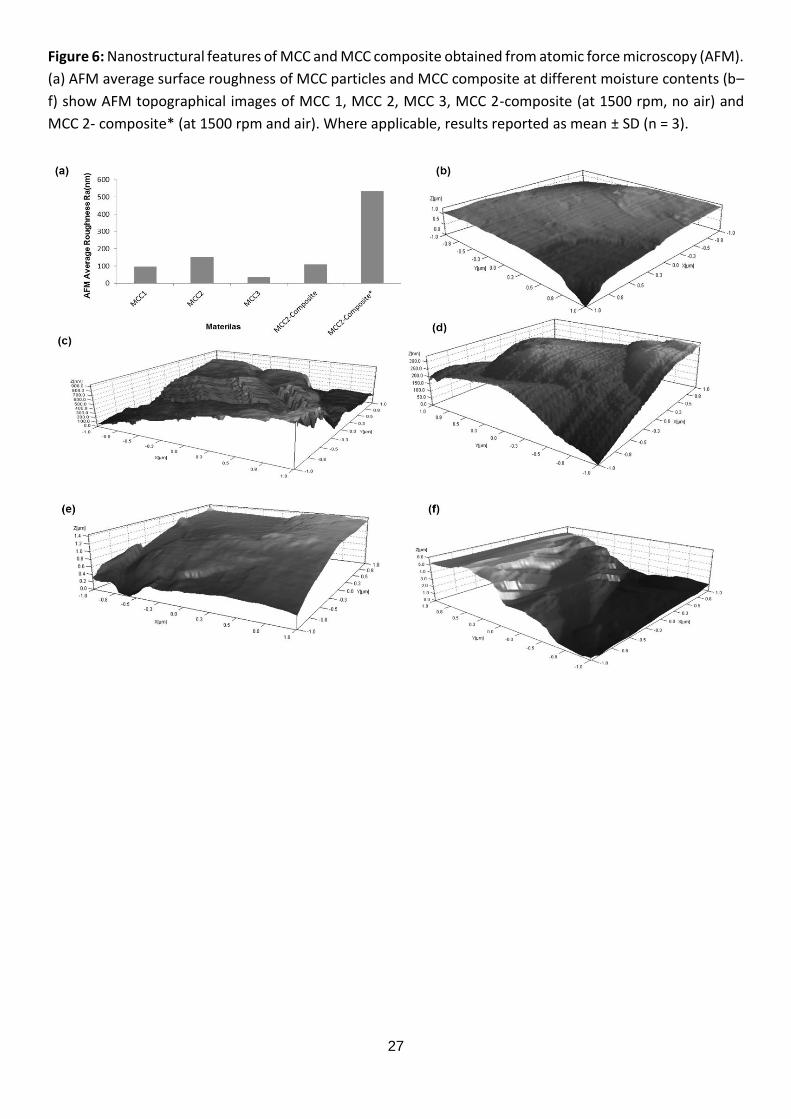
Data from AFM also showed that MCC 3 was composed primarily of smooth surface topography particles
with the lowest average roughness Ra of approximately 35nm, as shown in figure 6(a). This was possibly due
to the high levels of adsorbed moisture on the surface on the particles, which resulted in a smoother surface
14
[27]. The highest modulus and hardness was observed with MCC 2, and these values correlate to the AFM
readings whereby particle roughness was highest.
A major change in hardness and modulus was observed in compositely mixed blends shown in Error!
Reference source not found.(b&c) compared to pre-processing materials. This experiment provided
evidence that MCC was coated by mannitol as a sharp decrease in hardness and modulus of the particles
was observed. The decrease in mechanical properties indicated that the surface of MCC was coated with
mannitol. Mannitol has lower compactability when used in tablet formulation, giving tablets of a lower
mechanical strength; hence, mannitol had undergone fragmentation under pressure, resulting in the
formation of weak wafers[28].
In addition, previous research from our group has stated that the needle shape of the particles of mannitol
results in its low compactability[20]. To further support the fragmentation pattern, AFM topographical
analysis was performed which showed a considerable number of asperities that were liable to damage when
slight force was applied using the AFM cantilever. Additionally, morphological studies using SEM showed
columnar/longitudinal particles for pure mannitol in comparison to MCC which was primarily composed of
irregularry shaped particles with microfibrilar structure[20]. Using one way ANOVA, results of modulus and
hardness demonstrated no significance difference between composite mix with/without air flow (p>0.05).
Furthermore, AFM confirmed the smooth surface of particles when no air was included (figure 6(e)),
whereas, the composite mixing with air presented a very high roughness (Ra was 534 approaching
approximately five times that of composite mixing without air) (figure 6 (a)).
Macro properties of ternary mixed powder blends
In this section tablet properties of the different ternary mixtures of powders containing the different MCC
moisture content powders were investigated. Disintegration time, hardness and porosity were both affected
by the increase in moisture content possibly as a result of the different densification mechanisms of the
powder bed and particulate deformation due to the fragmentation of mannitol and plastic deformation of
MCC[29].
Investigation of the effect of moisture content on mechanical properties of ODTs
The results of tablets made from ternary mixtures comprising of 64.5% w/w mannitol, 30% w/w MCC
(different moisture contents), 5% w/w crospovidone and 0.5% w/w magnesium stearate showing the
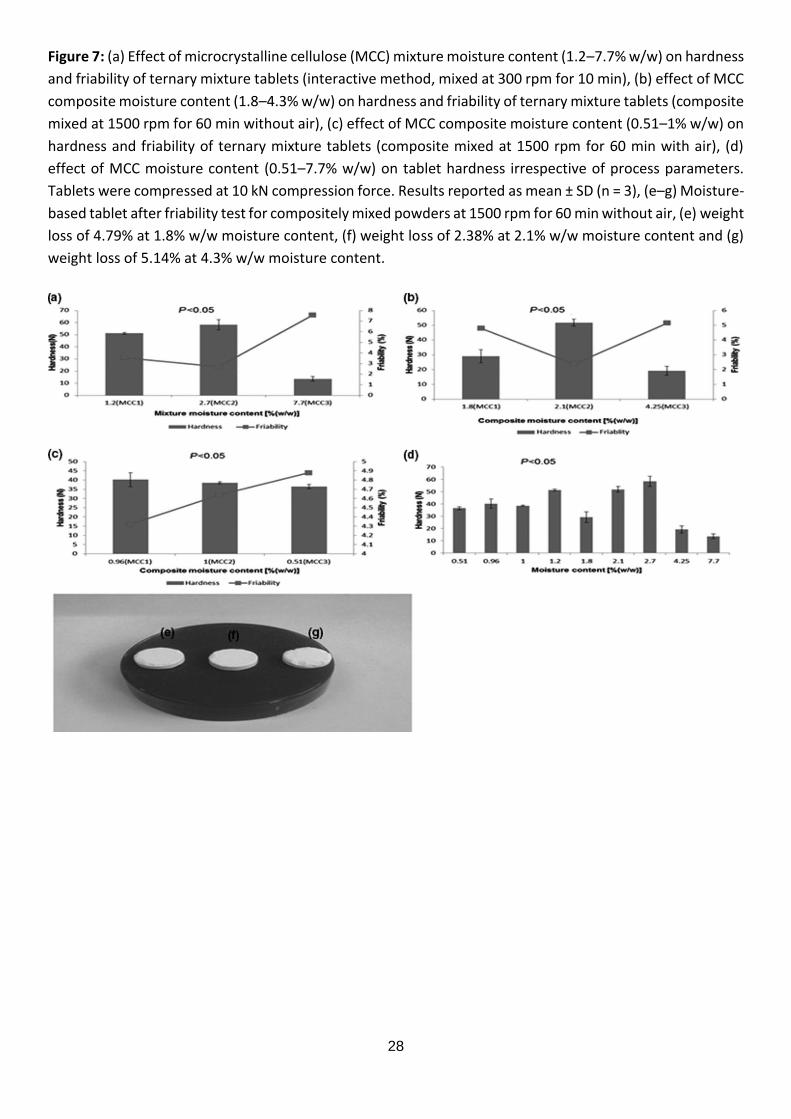
relationship between moisture content and hardness/friability, are depicted in figure 7(a-c). With regards to
the interactive mixture, using MCC 2 where the final moisture content of the powder came to approximately
2.7% w/w, provided tablets with increased compact strength whereas at higher moisture contents, using
MCC 3 (>4% w/w final moisture content) a dramatic reduction in tablets hardness was obtained as shown in
figure 7 (a&b). The initial increase in crushing strength of tablet compacts with increasing moisture content
up to 2.7% w/w was possibly due to the hydrodynamic lubrication effect of moisture, which allowed a greater
fraction of the applied force to be diffused through the compact on to the lower punch. Meanwhile, an initial
increase in moisture content resulted in a higher crushing strength, due to increased particle-particle
interaction. Consequently the increased moisture possibly improved plastic deformation[30].
With regards to the composite blend without the inclusion of air, it was clear that increased moisture content
up to 2% w/w resulted in an improvement of the tablet hardness. For example, the MCC 2 formulation (2.1%
w/w moisture content) had a hardness of 52N, whereas the hardness of tablets with MCC 1 (1.8% w/w
15
moisture content) was 29N. It is possible that the increased amount of moisture contributed to an increase
in the initial consolidation rate as well as the final granule consolidation during compaction as the moisture
acted as a low viscous binder[31].
The use of the composite dry powder coating process without air to form a final 2.1% w/w moisture content
(MCC 2) resulted in enhancement of the hardness profile of the tablets, up to 80%, when compared to 1.8%
w/w moisture content powder (using MCC 1), as shown in figure 7 (b). This was attributed to the strong
adherence of the fine mannitol particles to the surface of MCC. Furthermore, the increase in hardness due
to the moisture content and coating may have been due to the formation of a mono molecular layer of
moisture around the powder particles. This film of moisture could enable the formation of interparticle
hydrogen bonding and/or increased the van der Waals' forces, therefore smoothing out the surface micro
irregularities and dropping interparticle separation[32].
The presence of excessive moisture decreased the compact strength, by reducing the hydrodynamic
resistance and therefore increasing elastic recovery after ejection[33]. A high compaction force and high
moisture content may have also led to a significant moisture squeeze out onto the particle surface, thus
reducing interparticle bonding and thereby increasing elastic recovery resulting in a reduction of the crushing
strength[30]. A previous study found that sodium chloride compacts containing higher moisture content had
lower strength[18]. Another possible explanation for a decrease in hardness at high moisture content was the
formation of multilayers of water at the particle surface. These layers may have disturbed or decreased inter
molecular attraction forces and thus reduced tablet strength[34].
Overall, a proportional relationship between the tablet hardness and friability was seen; as hardness
increased the friability was improved in all approaches. For example, hardness in figure 7(a) showed that at
7.7% w/w moisture content, the tablets had the lowest hardness value at 13.57±3.32N and the highest
friability percentage at 7.6%. While, the highest hardness of 51.9±2.35N with lowest friability of 2.38%, was
found with 2.1% w/w moisture content as shown in figure 7 (b).
It was also observed that post friability test, capping of prepared tablets increased with the increased
moisture content (>4% using MCC 3) as shown in figure 7 (g). The tendency to cap may have increased due
to the weakening of the interparticle bonds as a result of the disruption of molecular forces and greater
separation of the MCC particles by excess moisture [30].
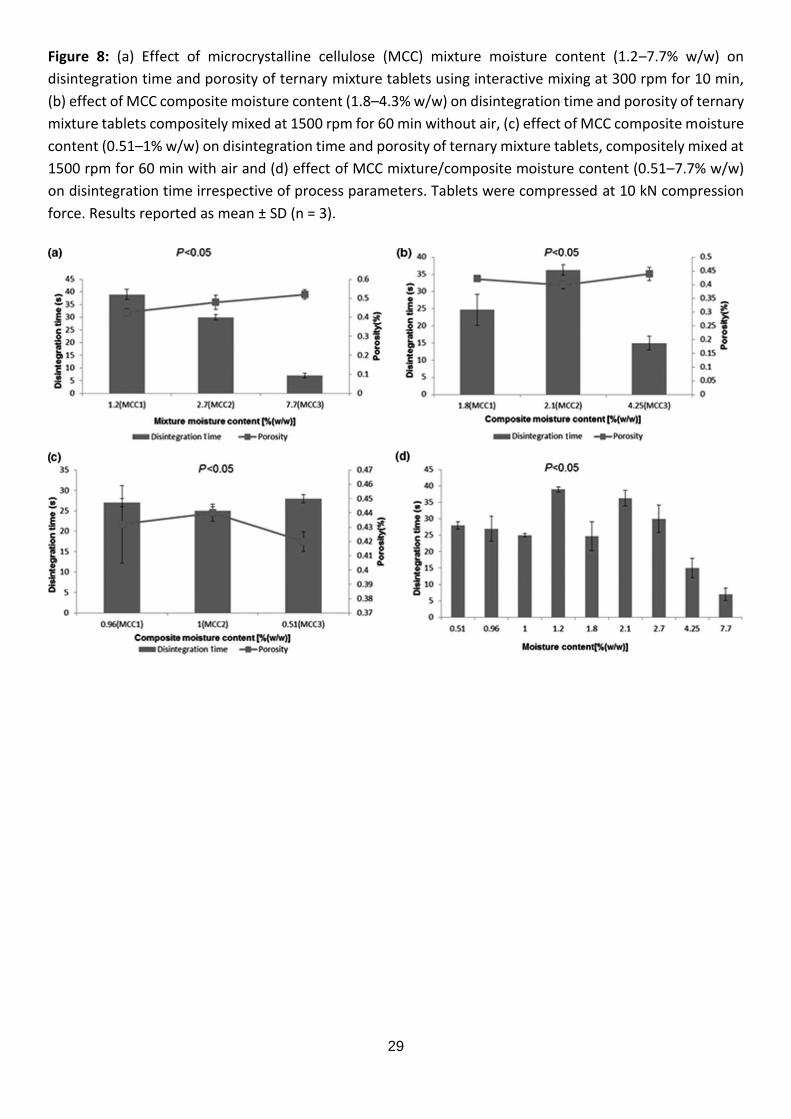
Effect of moisture content on disintegration time and tablet porosity
Error! Reference source not found. shows the effect of moisture content on tablet disintegration time and
porosity. For example, at 7.7% w/w moisture content (with MCC 3) using interactive mixing at low speed
(300 rpm), the tablets had a disintegration time of 7±1s whereas those prepared from 1.2% moisture
powders (using MCC 1) had a longer disintegration time of 39±2s (P<0.05), Error! Reference source not
found.(a).
The porosity results during interactive mixing, shown in figure 8 (a), were consistent with disintegration
results as the increase in moisture content caused a significant increase in porosity and a sharp decrease in
disintegration time (ANOVA, p<0.05). This suggested that the high amount of moisture content may have
led to creating a freely moving environment of the particle that contributed to finding the most suitable
16
compact configuration; while disintegration time was prolonged at low moisture content as the reduction of
pores reduced the ability for water to penetrate and break up the tablet. Although tablets retained high
porosity, which is important to enhance water penetration and disintegration of tablets, their hardness was
insufficient at 14±3.3 N (figure 7 (a)). Additionally, increasing particle size range may have led to larger void
spaces, which yielded a growth in porosity. Interestingly, when scanning electron microscopy (SEM) tests
were carried out, it was recognized that a small increase in particle size of the MCC 2 moisture content
particles was observed compared to MCC 1.
These increases in average particle size of the MCC 2 powders could be referred to as the coalescence
process, at which the particles combined to form big clusters. Therefore, it is possible that the increased
non-viscous binder (water) led to improved hardness, friability, disintegration time and porosity of tablets
as the increased moisture created free movement for particles, increasing the consolidation process and
decreasing the coalescence processes[31].
17
Conclusion
Manufacturing powders with differing levels of moisture content resulted in an alteration in the powder
morphology as observed from SEM and AFM studies. This study showed that the amount of moisture content
within MCC affected the mechanical properties of the subsequent powders and it was concluded that
inclusion of 11% MCC moisture content resulted in the most flowable powder with favourable ODT
characteristics, as tablets displayed increased hardness when formed using direct compression. Extreme
moisture contents in pre-processing materials could be reduced using varying process parameters using
composite dry coating, as well as mixing of the powders with excipients designed to dry coat the surface of
the high moisture content carrier particles. The understanding of tableting performance of excipients at the
particle level (nanoindentaion study) would facilitate the rational design of ODT formulations through
consideration of the main factors that contribute to high hardness and fast disintegration which in turn
would considerably accelerate product development.
Conflict of interest
The authors confirm that this article content has no conflicts of interest.
Acknowledgment
The authors would like to acknowledge the funding from Najran University (Saudi Arabia) for providing a full
scholarship to support Hamad Alyami towards his PhD. Colorcon® Inc and Aston University are thanked for
their financial support in funding Jasdip Koner. Eman Dahmash Is a recipient of overseas bursary funded by
Aston University.
18
References
1. Turner, M., et al. Paediatric drug development: The impact of evolving regulations. Advanced drug
delivery reviews. (2014). 73: p. 2-13.
2. Kellie, S.J. and Howard, S.C. Global child health priorities: What role for paediatric oncologists?
European Journal of Cancer. (2008). 44(16): p. 2388-2396.
3. Ivanovska, V., et al. Pediatric drug formulations: A review of challenges and progress. Pediatrics.
(2014). 134(2): p. 361-372.
4. Nunn, T. and Williams, J. Formulation of medicines for children. British journal of clinical
pharmacology. (2005). 59(6): p. 674-676.
5. van Riet-Nales, D.A., et al. Acceptability of different oral formulations in infants and preschool
children. Archives of disease in childhood. (2013). 98(9): p. 725-731.
6. Siddiqui, M.N., et al. A short review on “a novel approach in oral fast dissolving drug delivery system
and their patents”. Advances in Biological Research. (2011). 5(6): p. 291-303.
7. Parkash, V., et al. Fast disintegrating tablets: Opportunity in drug delivery system. Journal of
advanced pharmaceutical technology & research. (2011). 2(4): p. 223.
8. Yoshinari, T., et al. Moisture induced polymorphic transition of mannitol and its morphological
transformation. International journal of pharmaceutics. (2002). 247(1): p. 69-77.
9. Pabari, R. and Ramtoola, Z. Effect of a disintegration mechanism on wetting, water absorption, and
disintegration time of orodispersible tablets. Journal of Young Pharmacists. (2012). 4(3): p. 157-163.
10. Hirani, J.J., et al. Orally disintegrating tablets: A review. Tropical Journal of Pharmaceutical Research.
(2009). 8(2): p. 161-172.
11. Prescott, J.K. and Barnum, R.A. On powder flowability. Pharmaceutical technology. (2000). 24(10):
p. 60-85.
12. Vromans, H. and Lerk, C. Densification properties and compactibility of mixtures of pharmaceutical
excipients with and without magnesium stearate. International journal of pharmaceutics. (1988).
46(3): p. 183-192.
13. Pharmacopoeia, B. Appendix xvii a. Particle size of powders. vV. (2012).
14. Bowen, J., et al. On the calibration of rectangular atomic force microscope cantilevers modified by
particle attachment and lamination. Measurement Science and Technology. (2010). 21(11): p.
115106.
15. Zhu, W., et al. Bond and interfacial properties of reinforcement in self-compacting concrete.
Materials and structures. (2004). 37(7): p. 442-448.
16. Yang, J., et al. Dry particle coating for improving the flowability of cohesive powders. Powder
Technology. (2005). 158(1): p. 21-33.
17. Rowe, R.C., et al. Handbook of pharaceutical excipients. 7 ed, ed. R.C. Rowe. Vol. 7. 2012, London:
Pharmaceutical Press.
18. Khan, K., et al. The effect of moisture content of microcrystalline cellulose on the compressional
properties of some formulations. Drug Development and Industrial Pharmacy. (1981). 7(5): p. 525-
538.
19. Sarraguça, M.C., et al. Determination of flow properties of pharmaceutical powders by near infrared
spectroscopy. Journal of pharmaceutical and biomedical analysis. (2010). 52(4): p. 484-492.
20. Al-Khattawi, A., et al. Evidence-based nanoscopic and molecular framework for excipient
functionality in compressed orally disintegrating tablets. (2014).
19
21. Al-Khattawi, A., et al. Systematic screening of compressed odt excipients: Cellulosic versus non-
cellulosic. Current drug delivery. (2014). 11(4): p. 486-500.
22. Crouter, A. and Briens, L. The effect of moisture on the flowability of pharmaceutical excipients. AAPS
PharmSciTech. (2014). 15(1): p. 65-74.
23. Dawoodbhai, S. and Rhodes, C.T. The effect of moisture on powder flow and on compaction and
physical stability of tablets. Drug Development and Industrial Pharmacy. (1989). 15(10): p. 1577-
1600.
24. Shi, L., et al. Initial moisture content in raw material can profoundly influence high shear wet
granulation process. International journal of pharmaceutics. (2011). 416(1): p. 43-48.
25. Karner, S. and Urbanetz, N.A. The impact of electrostatic charge in pharmaceutical powders with
specific focus on inhalation-powders. Journal of Aerosol Science. (2011). 42(6): p. 428-445.
26. Das, K., et al. A study of the mechanical, thermal and morphological properties of microcrystalline
cellulose particles prepared from cotton slivers using different acid concentrations. Cellulose. (2009).
16(5): p. 783-793.
27. Mujumdar, A., et al. Improvement of humidity resistance of magnesium powder using dry particle
coating. Powder Technology. (2004). 140(1–2): p. 86-97.
28. Koner, J.S., et al. A holistic multi evidence approach to study the fragmentation behaviour of
crystalline mannitol. Scientific reports. (2015). 5.
29. Tatavarti, A.S., et al. Evaluation of the deformation behavior of binary systems of methacrylic acid
copolymers and hydroxypropyl methylcellulose using a compaction simulator. International journal
of pharmaceutics. (2008). 348(1): p. 46-53.
30. Nokhodchi, A., et al. The effect of moisture on the properties of ibuprofen tablets. International
journal of pharmaceutics. (1995). 118(2): p. 191-197.
31. Iveson, S.M., et al. Nucleation, growth and breakage phenomena in agitated wet granulation
processes: A review. Powder Technology. (2001). 117(1): p. 3-39.
32. Malamataris, S. and Pilpel, N. Tensile strength and compression of coated pharmaceutical powders:
Tablets. Journal of Pharmacy and Pharmacology. (1983). 35(1): p. 1-6.
33. Li, L. and Peck, G. The effect of moisture content on the compression properties of maltodextrins.
Journal of Pharmacy and Pharmacology. (1990). 42(4): p. 272-275.
34. Kristensen, H., et al. Mechanical properties of moist agglomerates in relation to granulation
mechanisms part ii. Effects of particle size distribution. Powder technology. (1985). 44(3): p. 239-
247.
35. Brittain, H.G. Physical characterization of pharmaceutical solids. 1995: Marcel Dekker.
20
Table 1: Formulation content and processing parameters of MCC (carrier) and D-mannitol (guest) (mannitol
particle size <38 μm) used for composite and interactive mix.
Formulatio
n
Mannito
l
(%,w/w)
MCC
(%,w/w
)
Crospovi
-done
(%,w/w)
Mg
stearat
e
(%,w/w
)
Mixing
Techniqu
e
Duratio
n
(min)
Spee
d
(rpm)
Air
Pressur
e
(PSI)
Batc
h
size
(g)
F1 64.5 30 5 0.5 Interactiv
e 10 300 NO 10
F2 64.5 30 5 0.5 Composit
e 60 1500 NO 10
F3 64.5 30 5 0.5 Composit
e 60 1500 YES 10
21
Table 2: Initial and final moisture contents for MCC at different processing parameters using powder coater
(rpm: revolutions per minute)
Initial MCC Powder
moisture content %
Process Parameter Final Moisture Content %
Mean ± SD (n=3)
MCC1 (4%)
300rpm
3.7 ± 0.53
MCC 2 (11%) 9.16 ± 0.84
MCC 3 (40%) 37.7 ± 3.74
MCC1 (4%)
1500rpm
3.41 ± 0.02
MCC 2 (11%) 7.33 ± 0.93
MCC 3 (40%) 35.31 ± 0.93
MCC1 (4%)
1500rpm + air flow
1.28 ± 0.14
MCC 2 (11%) 2.96 ± 0.22
MCC 3 (40%) 8.38 ± 0.622
22
Figure 1: The illustration graph represents load–displacement curve showing the unloading (Su) and loading
(SI) slopes used in the calculation of hardness and Young’s modulus. Besides indicated is the plastic work of
indentation Wp which is the area bounded by the loading and unloading curves and the displacement on x-
axis.
23
Figure 2: (a) Moisture content of the sole excipients. before blending, using TGA analysis, (b) flow properties
for microcrystalline cellulose (MCC) powders with different moisture contents and test used was angle of
repose. Results in (a and b) are presented as (mean ± SD, n = 3). (c–e) Visual structure features of different
MCC moisture contents show images of MCC 1, MCC 2 and MCC 3, respectively. Arrows in (e) point to
aggregated particles of MCC 3, (f–h) scanning electron microscopy showing morphology of MCC particles, (f)
MCC 1 (pure MCC powder, moisture content 4% w/w), (g) MCC 2 (optimised MCC moisture content 11%
w/w) and (h) MCC 3 (optimised MCC moisture content 40% w/w).
24
Figure 3: (a) Moisture content profiles of different microcrystalline cellulose (MCC) batches using interactive
mixing at 300 rpm. (b) Moisture content profiles of different MCC batches using composite mixing at 1500
rpm and (c) Moisture content profiles of different MCC batches using composite mixing at 1500 rpm with
air. Results in (a–c) are presented as (mean ± SD. n = 3).
25
Figure 4: (a) Moisture content profile of different physical mixtures using interactive mixing at 300 rpm. (b)
Moisture content profile of different batches using composite mixing at 1500 rpm (c) Moisture content
profile of different batches using composite mixing at 1500 rpm with air. Results in (a–c) presented as (mean
± SD. n = 3), (d) schematic illustrating microcrystalline cellulose (MCC) particles being partially coated by
mannitol (guest), (e and f) scanning electron microscopy of MCC 2- composite particles (e) showing MCC 2
particles coated with mannitol 200X magnification & (f) Zoomed area showing small particles of mannitol
coating the surface of MCC 2 1500X magnification.
26
Figure 5: (a) The modulus and hardness of MCC1, cured MCC 2 & MCC 3 wafers as measured from
nanoindentation test, (b) effect of microcrystalline cellulose (MCC) composite moisture content (1.8–4.3%
w/w) on modulus and hardness as measured from the nanoindentation test of ternary mixture wafers,
(coating method, composite mixed at 1500 rpm for 60 min without air), (c) effect of MCC composite moisture
content (0.5–1% w/w) on modulus and hardness as measured from nanoindentation test of ternary mixture
wafers, (coating method, composite mixed at 1500 rpm for 60 min with air), (d) nanoindentation load–
displacement curves for pre-processed materials (MCC 1, MCC 2 and MCC3. The poor overlap of the loading
curves shows the non-uniformity of properties and rough surface of the materials. Where applicable, results
reported as mean ± SD (n = 3).
27
Figure 6: Nanostructural features of MCC and MCC composite obtained from atomic force microscopy (AFM).
(a) AFM average surface roughness of MCC particles and MCC composite at different moisture contents (b–
f) show AFM topographical images of MCC 1, MCC 2, MCC 3, MCC 2-composite (at 1500 rpm, no air) and
MCC 2- composite* (at 1500 rpm and air). Where applicable, results reported as mean ± SD (n = 3).
28
Figure 7: (a) Effect of microcrystalline cellulose (MCC) mixture moisture content (1.2–7.7% w/w) on hardness
and friability of ternary mixture tablets (interactive method, mixed at 300 rpm for 10 min), (b) effect of MCC
composite moisture content (1.8–4.3% w/w) on hardness and friability of ternary mixture tablets (composite
mixed at 1500 rpm for 60 min without air), (c) effect of MCC composite moisture content (0.51–1% w/w) on
hardness and friability of ternary mixture tablets (composite mixed at 1500 rpm for 60 min with air), (d)
effect of MCC moisture content (0.51–7.7% w/w) on tablet hardness irrespective of process parameters.
Tablets were compressed at 10 kN compression force. Results reported as mean ± SD (n = 3), (e–g) Moisture-
based tablet after friability test for compositely mixed powders at 1500 rpm for 60 min without air, (e) weight
loss of 4.79% at 1.8% w/w moisture content, (f) weight loss of 2.38% at 2.1% w/w moisture content and (g)
weight loss of 5.14% at 4.3% w/w moisture content.
29
Figure 8: (a) Effect of microcrystalline cellulose (MCC) mixture moisture content (1.2–7.7% w/w) on
disintegration time and porosity of ternary mixture tablets using interactive mixing at 300 rpm for 10 min,
(b) effect of MCC composite moisture content (1.8–4.3% w/w) on disintegration time and porosity of ternary
mixture tablets compositely mixed at 1500 rpm for 60 min without air, (c) effect of MCC composite moisture
content (0.51–1% w/w) on disintegration time and porosity of ternary mixture tablets, compositely mixed at
1500 rpm for 60 min with air and (d) effect of MCC mixture/composite moisture content (0.51–7.7% w/w)
on disintegration time irrespective of process parameters. Tablets were compressed at 10 kN compression
force. Results reported as mean ± SD (n = 3).