Embed Size (px)
Citation preview

SANDIA REPORT SAND2010-6702 Unlimited Release Printed September 2010
Micro-Optics for Imaging Robert R. Boye Prepared by Sandia National Laboratories Albuquerque, New Mexico 87185 and Livermore, California 94550
Sandia National Laboratories is a multi-program laboratory managed and operated by Sandia Corporation, a wholly owned subsidiary of Lockheed Martin Corporation, for the U.S. Department of Energy’s National Nuclear Security Administration under contract DE-AC04-94AL85000 Approved for public release; further dissemination unlimited.

2
Issued by Sandia National Laboratories, operated for the United States Department of Energy by Sandia Corporation. NOTICE: This report was prepared as an account of work sponsored by an agency of the United States Government. Neither the United States Government, nor any agency thereof, nor any of their employees, nor any of their contractors, subcontractors, or their employees, make any warranty, express or implied, or assume any legal liability or responsibility for the accuracy, completeness, or usefulness of any information, apparatus, product, or process disclosed, or represent that its use would not infringe privately owned rights. Reference herein to any specific commercial product, process, or service by trade name, trademark, manufacturer, or otherwise, does not necessarily constitute or imply its endorsement, recommendation, or favoring by the United States Government, any agency thereof, or any of their contractors or subcontractors. The views and opinions expressed herein do not necessarily state or reflect those of the United States Government, any agency thereof, or any of their contractors. Printed in the United States of America. This report has been reproduced directly from the best available copy. Available to DOE and DOE contractors from U.S. Department of Energy Office of Scientific and Technical Information P.O. Box 62 Oak Ridge, TN 37831 Telephone: (865) 576-8401 Facsimile: (865) 576-5728 E-Mail: [email protected] Online ordering: http://www.osti.gov/bridge Available to the public from U.S. Department of Commerce National Technical Information Service 5285 Port Royal Rd. Springfield, VA 22161 Telephone: (800) 553-6847 Facsimile: (703) 605-6900 E-Mail: [email protected] Online order: http://www.ntis.gov/help/ordermethods.asp?loc=7-4-0#online

3
SAND2010-6702 Unlimited Release
Printed September 2010
Micro-Optics for Imaging
Robert R. Boye Photonic Microsystems Technologies
Sandia National Laboratories PO Box 5800
Albuquerque, NM 87185-1082
Abstract This project investigates the fundamental imaging capability of an optic with a physical thickness substantially less than 1 mm. The analysis assumes that post-processing can overcome certain restrictions such as detector pixel size and image degradation due to aberrations. A first order optical analysis quickly reveals the limitations of even an ideal thin lens to provide sufficient image resolution and provides the justification for pursuing an annular design. Some straightforward examples clearly show the potential of this approach. The tradeoffs associated with annular designs, specifically field of view limitations and reduced mid-level spatial frequencies, are discussed and their impact on the imaging performance evaluated using several imaging examples. Additionally, issues such as detector acceptance angle and the need to balance aberrations with resolution are included in the analysis. With these restrictions, the final results present an excellent approximation of the expected performance of the lens designs presented.

4

5
Table of Contents
Table of Contents ........................................................................................................................ 5 Figures......................................................................................................................................... 5 Tables .......................................................................................................................................... 5 INTRODUCTION ...................................................................................................................... 6 PREVIOUS WORK .................................................................................................................... 6 FIRST ORDER OPTICAL ANALYSIS .................................................................................... 8 ANNULAR DESIGN ............................................................................................................... 10 IMAGING EXAMPLES ........................................................................................................... 13 CONCLUSIONS AND FUTURE WORK ............................................................................... 17 REFERENCES ......................................................................................................................... 17
Figures Figure 1. Post-processing example showing original image, example LR image formed by micro-lens, ensemble of LR images, resulting HR synthesized image and deconvolved output. .... 7 Figure 2. Two-dimensional scan of the surface of a diamond turned annular lens with substrate thickness of 200 m. ........................................................................................................................ 7 Figure 3. Thin lens (first order) description of imaging system .................................................... 8 Figure 4. Folded optical path effectively reduces physical thickness ........................................... 9 Figure 5. Examples illustrating the improved resolution of folded designs. A simple parabolic reflector is shown in (a) while the NA is restricted in (b) to allow for good detector coupling. The lens in (c) adds a fold in the optical path and (d) adds an additional fold. ........................... 10 Figure 6. FOV for annular designs with different numbers of folds. From [Tremblay, et.al.] ... 11 Figure 7. Diffraction limited OTF for several annular pupils with spatial frequencies normalized by the cutoff frequency, fo........................................................................................... 11 Figure 8. Effects of annular pupils. Original image (left) is blurred by the OTF of a 50% and 90% obscured pupil (center) and deblurred using deconvolution operation. Note the higher noise level in the 90% case. .......................................................................................................... 12 Figure 9. MSE vs. Obscuration.................................................................................................... 12 Figure 10. Wesley Sneijder, the Netherlands, versus Andres Iniesta, Spain ............................... 14 Figure 11. Images of player from 200 m thick annular lenses with 2(left) – 6(right) folds. ..... 14 Figure 12. A 4x increase in signal to noise makes the identification of Andres Iniesta much easier. ............................................................................................................................................ 15 Figure 13. Images of a page of text – an application requiring higher resolution and subsequent signal to noise. .............................................................................................................................. 15 Figure 14. Parabolic reflector folded four times and its corresponding MTF ............................. 16 Figure 15. Optimized four fold annular lens with substantially less spatial variation of MTF ... 16 Tables Table 1. Basic first order relationships ......................................................................................... 9 Table 2. Effects of aperture size on obscuration, spot size and effective field of view ................. 13

6
INTRODUCTION The main question being addressed by this late start LDRD is the fundamental imaging capability of an optic with a physical thickness substantially less than 1 mm. Previous analyses have been done on the effectiveness of scaled imaging systems.[1-3] The analysis presented here assumes that post-processing can overcome certain restrictions such as detector pixel size and image degradation due to aberrations.[4-8] This type of post-processing was investigated in a previous LDRD and pertinent results will be reviewed.[9] A first order optical analysis quickly reveals the limitations of even an ideal thin lens to provide sufficient image resolution and provides the justification for pursuing an annular design. Some straightforward examples clearly show the potential of the approach. The tradeoffs associated with annular designs, specifically field of view limitations and reduced mid-level spatial frequencies, will be discussed and their impact on the imaging performance evaluated using several imaging examples. While the imaging examples shown are simulated, care has been taken to include several limitations associated with actual imaging systems. These include detector angular acceptance, reduced MTF of annular pupils, the need to balance resolution with aberrations and the use of the actual optical material that would be employed in a real lens. With these restrictions, the final results present an excellent approximation of the expected performance of the lens designs presented. Finally, many of the results shown assume a particular imaging arrangement. This was done to provide a benchmark of optical requirements that the lenses needed to fulfill. For this project, it has been assumed that the object to be imaged is 25 cm tall and being imaged at 1 meter. PREVIOUS WORK In a previous LDRD, it was shown that detector limited resolution could be overcome using a computational imaging approach. A succinct review of the approach is shown in Figure 1. An image formed using a simple plano-convex microlens produces a low resolution (LR) image with resolution determined by detector pixel size. Taking several LR images with small lateral displacements, a composite high resolution (HR) image is formed using an algorithm know as iterative back projection (IBP). The synthesized image has higher resolution, but also shows the characteristic blur of the lens due to its aberrations. The final panel in Figure 1 shows how a simple inverse filtering approach, or deconvolution, regains most of the original image. This example also shows how noise in the image can be amplified during the deconvolution operation. This aspect of the post-processing will prove to be an important consideration when designing an annular lens. In addition to the development of the IBP and deconvolution algorithms, an effort was made to realize a lens with a physical thickness considerably less than 1mm. A diamond turned lens was made in Zeonex E48R, an optical plastic. Figure 2 shows a two-dimensional scan across the turned surface showing two annular, focusing regions. This work provides confidence that lenses with the sizes being considered can be successfully fabricated.

7
Figure 1. Post-processing example showing original image, example LR image formed by micro-lens, ensemble of LR images, resulting HR synthesized image and deconvolved output
Figure 2. Two-dimensional scan of the surface of a diamond turned annular lens with substrate thickness of 200 m
8
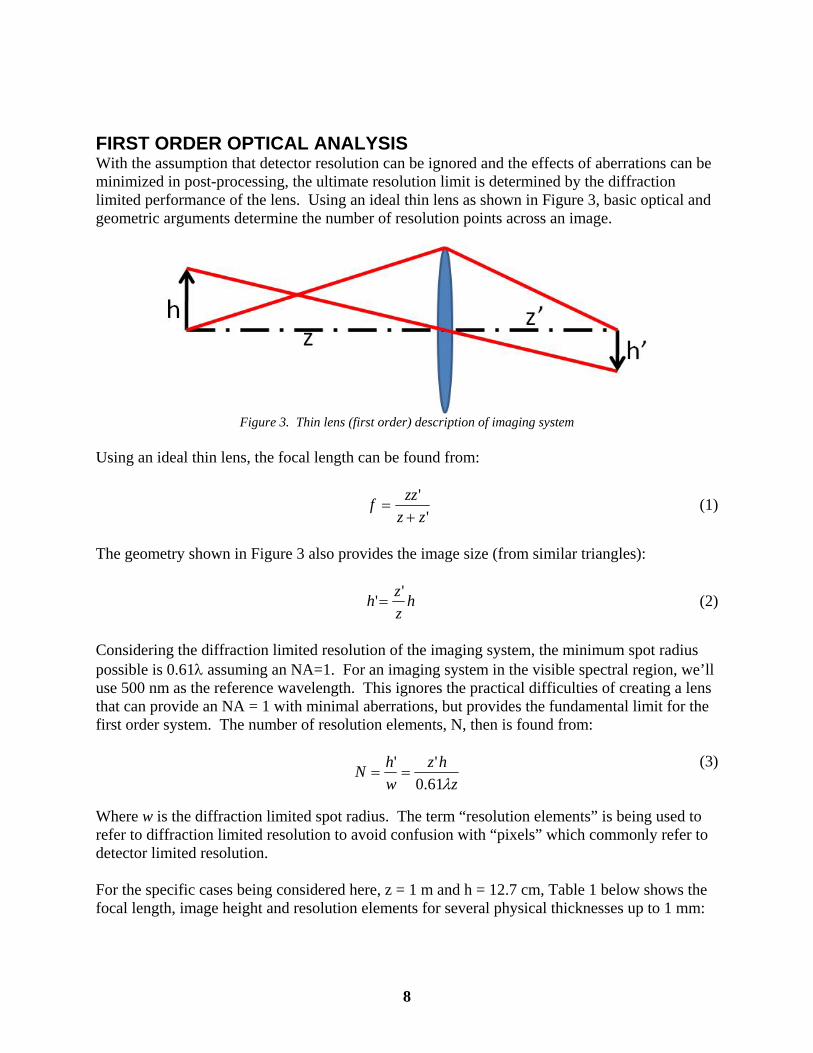
FIRST ORDER OPTICAL ANALYSIS With the assumption that detector resolution can be ignored and the effects of aberrations can be minimized in post-processing, the ultimate resolution limit is determined by the diffraction limited performance of the lens. Using an ideal thin lens as shown in Figure 3, basic optical and geometric arguments determine the number of resolution points across an image.
Figure 3. Thin lens (first order) description of imaging system
Using an ideal thin lens, the focal length can be found from:
'
'
zz
zzf
(1)
The geometry shown in Figure 3 also provides the image size (from similar triangles):
hz
zh
'' (2)
Considering the diffraction limited resolution of the imaging system, the minimum spot radius possible is 0.61assuming an NA=1. For an imaging system in the visible spectral region, we’ll use 500 nm as the reference wavelength. This ignores the practical difficulties of creating a lens that can provide an NA = 1 with minimal aberrations, but provides the fundamental limit for the first order system. The number of resolution elements, N, then is found from:
(3)
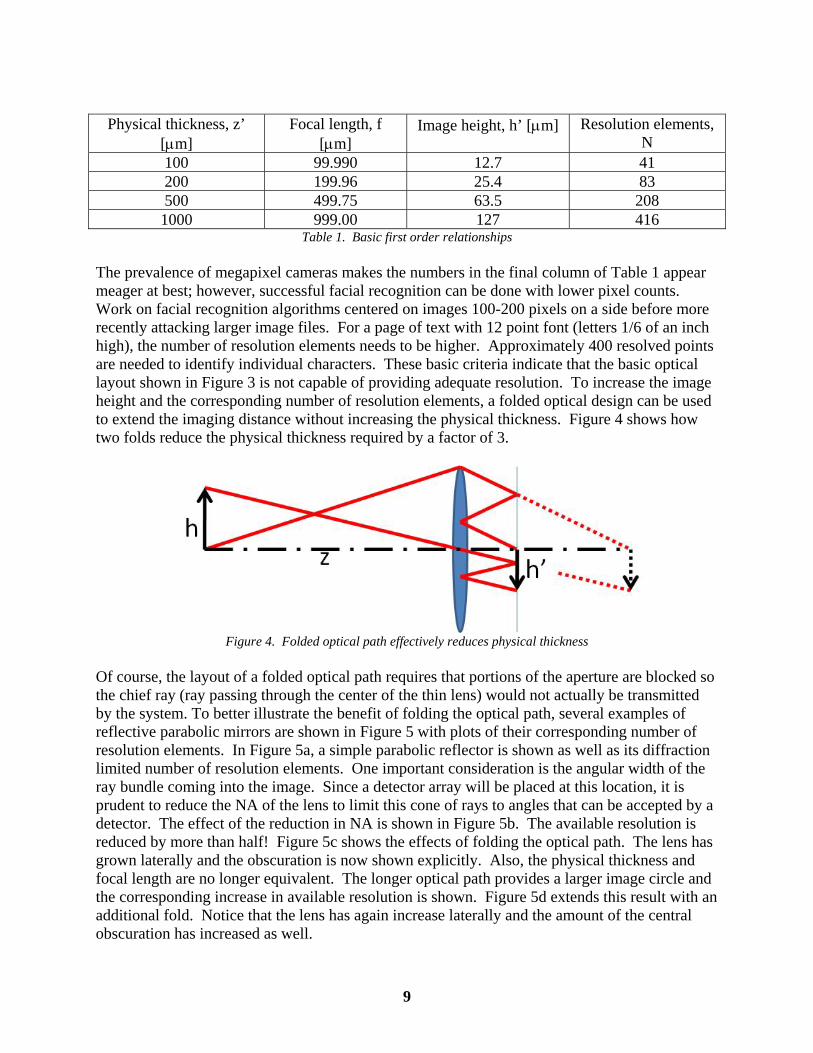
Where w is the diffraction limited spot radius. The term “resolution elements” is being used to refer to diffraction limited resolution to avoid confusion with “pixels” which commonly refer to detector limited resolution. For the specific cases being considered here, z = 1 m and h = 12.7 cm, Table 1 below shows the focal length, image height and resolution elements for several physical thicknesses up to 1 mm:
z
hz
w
hN
61.0
''
9
Physical thickness, z’
[m] Focal length, f
[m] Image height, h’ [m] Resolution elements,
N 100 99.990 12.7 41 200 199.96 25.4 83 500 499.75 63.5 208 1000 999.00 127 416
Table 1. Basic first order relationships The prevalence of megapixel cameras makes the numbers in the final column of Table 1 appear meager at best; however, successful facial recognition can be done with lower pixel counts. Work on facial recognition algorithms centered on images 100-200 pixels on a side before more recently attacking larger image files. For a page of text with 12 point font (letters 1/6 of an inch high), the number of resolution elements needs to be higher. Approximately 400 resolved points are needed to identify individual characters. These basic criteria indicate that the basic optical layout shown in Figure 3 is not capable of providing adequate resolution. To increase the image height and the corresponding number of resolution elements, a folded optical design can be used to extend the imaging distance without increasing the physical thickness. Figure 4 shows how two folds reduce the physical thickness required by a factor of 3.
Figure 4. Folded optical path effectively reduces physical thickness
Of course, the layout of a folded optical path requires that portions of the aperture are blocked so the chief ray (ray passing through the center of the thin lens) would not actually be transmitted by the system. To better illustrate the benefit of folding the optical path, several examples of reflective parabolic mirrors are shown in Figure 5 with plots of their corresponding number of resolution elements. In Figure 5a, a simple parabolic reflector is shown as well as its diffraction limited number of resolution elements. One important consideration is the angular width of the ray bundle coming into the image. Since a detector array will be placed at this location, it is prudent to reduce the NA of the lens to limit this cone of rays to angles that can be accepted by a detector. The effect of the reduction in NA is shown in Figure 5b. The available resolution is reduced by more than half! Figure 5c shows the effects of folding the optical path. The lens has grown laterally and the obscuration is now shown explicitly. Also, the physical thickness and focal length are no longer equivalent. The longer optical path provides a larger image circle and the corresponding increase in available resolution is shown. Figure 5d extends this result with an additional fold. Notice that the lens has again increase laterally and the amount of the central obscuration has increased as well.

10
(a) (b)
(c) (d)
Figure 5. Examples illustrating the improved resolution of folded designs. A simple parabolic reflector is shown in (a) while the NA is restricted in (b) to allow for good detector coupling. The lens in (c) adds a fold in the optical path and (d) adds an additional fold
These examples indicate that providing the extended image distance is a straightforward exercise; however, annular optics have certain drawbacks that need to be considered. Additionally, it is time to consider some of the practical lens design limitations that have been ignored up to this point. ANNULAR DESIGN Annular designs are well known for their application to astronomical systems because they work well with reflective elements (avoiding chromatic aberrations) and small fields of view. For our current analysis, we want to see how far we can extend the performance of an annular based design. To begin, a couple of observations about an annular design less than 1 mm thick provide a useful starting point for the design process. First, the folded optical path will be inside an optical material in contrast to the idealized cases of Figures 4 and 5. This means the effective image distance will be reduced from the simple sum of the folded path length by the higher refractive index. Second, the field of view (FOV) of an annular design is impacted by the geometry of the folded path with additional folds leading to a reduced FOV. Figure 6 shows this trend for several designs with various equivalent (unobstructed) diameters.[10]

11
Figure 6. FOV for annular designs with different numbers of folds [10]
Finally, it is well known that annular pupils suppress intermediate spatial frequencies. The optical transfer function (OTF) for an imaging system is given by the autocorrelation of the pupil function: [11]
ddP
ddfzfz
Pfzfz
P
ff
yxyx
yx
,
2,
22,
2),(Η (4)
Note that the denominator uses P rather than |P|2 because we are assuming a pupil function equal to one or zero only. Figure 7 shows several examples for pupils with varying levels of obscuration defined by the ratio between the diameter of the central obscuration and the full diameter of the lens. Note, that these OTF plots are for a diffraction limited system on axis.
Figure 7. Diffraction limited OTF for several annular pupils with spatial frequencies normalized by the cutoff frequency, fo
12
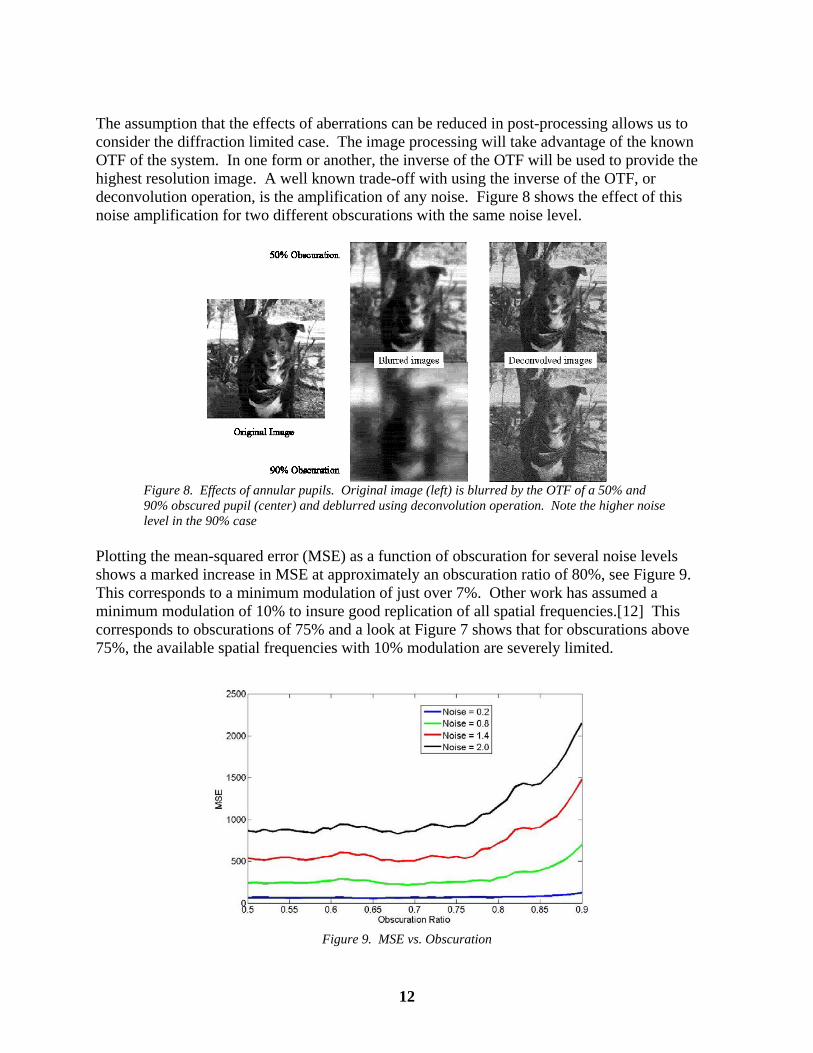
The assumption that the effects of aberrations can be reduced in post-processing allows us to consider the diffraction limited case. The image processing will take advantage of the known OTF of the system. In one form or another, the inverse of the OTF will be used to provide the highest resolution image. A well known trade-off with using the inverse of the OTF, or deconvolution operation, is the amplification of any noise. Figure 8 shows the effect of this noise amplification for two different obscurations with the same noise level.
Figure 8. Effects of annular pupils. Original image (left) is blurred by the OTF of a 50% and 90% obscured pupil (center) and deblurred using deconvolution operation. Note the higher noise level in the 90% case
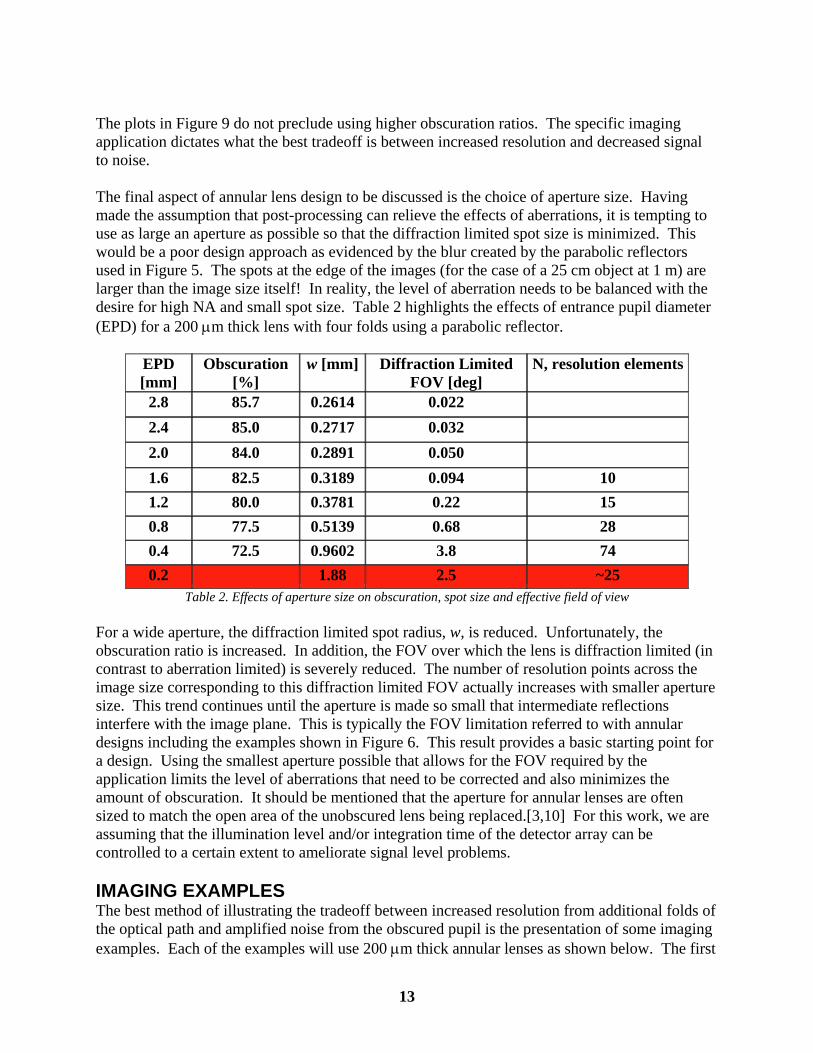
Plotting the mean-squared error (MSE) as a function of obscuration for several noise levels shows a marked increase in MSE at approximately an obscuration ratio of 80%, see Figure 9. This corresponds to a minimum modulation of just over 7%. Other work has assumed a minimum modulation of 10% to insure good replication of all spatial frequencies.[12] This corresponds to obscurations of 75% and a look at Figure 7 shows that for obscurations above 75%, the available spatial frequencies with 10% modulation are severely limited.
Figure 9. MSE vs. Obscuration
13
The plots in Figure 9 do not preclude using higher obscuration ratios. The specific imaging application dictates what the best tradeoff is between increased resolution and decreased signal to noise. The final aspect of annular lens design to be discussed is the choice of aperture size. Having made the assumption that post-processing can relieve the effects of aberrations, it is tempting to use as large an aperture as possible so that the diffraction limited spot size is minimized. This would be a poor design approach as evidenced by the blur created by the parabolic reflectors used in Figure 5. The spots at the edge of the images (for the case of a 25 cm object at 1 m) are larger than the image size itself! In reality, the level of aberration needs to be balanced with the desire for high NA and small spot size. Table 2 highlights the effects of entrance pupil diameter (EPD) for a 200 m thick lens with four folds using a parabolic reflector.
EPD [mm]
Obscuration [%]
w [mm] Diffraction Limited FOV [deg]
N, resolution elements
2.8 85.7 0.2614 0.022
2.4 85.0 0.2717 0.032
2.0 84.0 0.2891 0.050
1.6 82.5 0.3189 0.094 10
1.2 80.0 0.3781 0.22 15
0.8 77.5 0.5139 0.68 28
0.4 72.5 0.9602 3.8 74
0.2 1.88 2.5 ~25 Table 2. Effects of aperture size on obscuration, spot size and effective field of view
For a wide aperture, the diffraction limited spot radius, w, is reduced. Unfortunately, the obscuration ratio is increased. In addition, the FOV over which the lens is diffraction limited (in contrast to aberration limited) is severely reduced. The number of resolution points across the image size corresponding to this diffraction limited FOV actually increases with smaller aperture size. This trend continues until the aperture is made so small that intermediate reflections interfere with the image plane. This is typically the FOV limitation referred to with annular designs including the examples shown in Figure 6. This result provides a basic starting point for a design. Using the smallest aperture possible that allows for the FOV required by the application limits the level of aberrations that need to be corrected and also minimizes the amount of obscuration. It should be mentioned that the aperture for annular lenses are often sized to match the open area of the unobscured lens being replaced.[3,10] For this work, we are assuming that the illumination level and/or integration time of the detector array can be controlled to a certain extent to ameliorate signal level problems. IMAGING EXAMPLES The best method of illustrating the tradeoff between increased resolution from additional folds of the optical path and amplified noise from the obscured pupil is the presentation of some imaging examples. Each of the examples will use 200 m thick annular lenses as shown below. The first
14
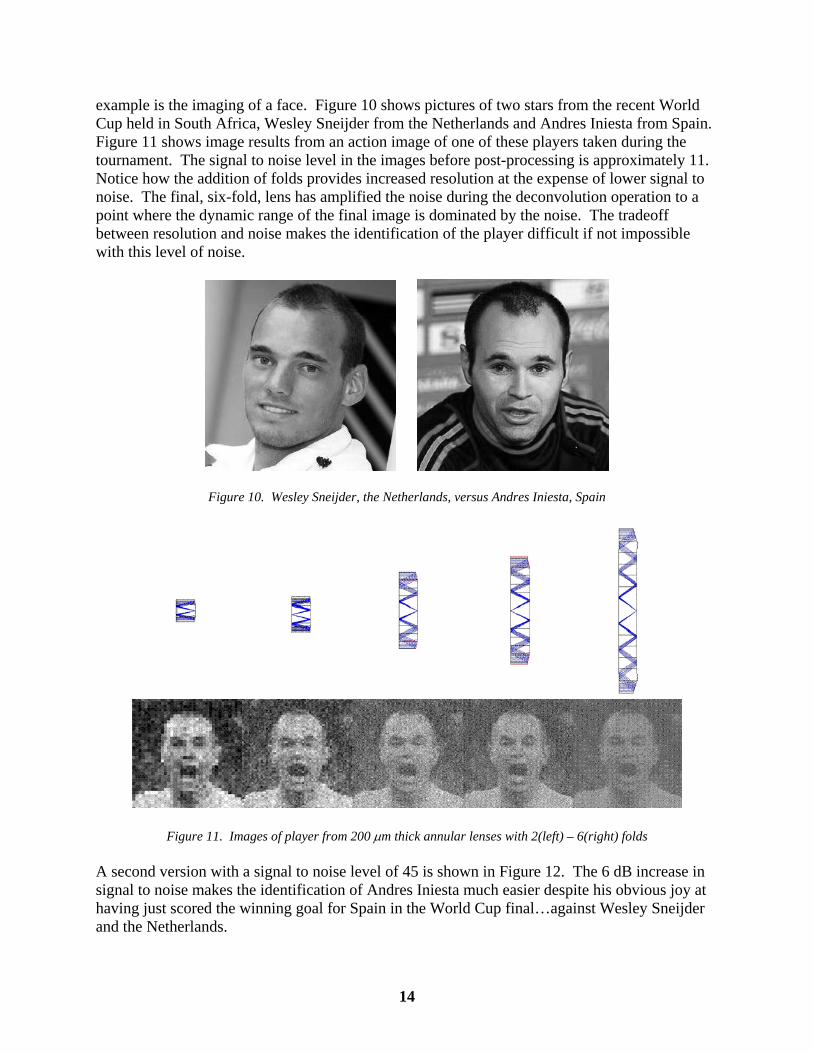
example is the imaging of a face. Figure 10 shows pictures of two stars from the recent World Cup held in South Africa, Wesley Sneijder from the Netherlands and Andres Iniesta from Spain. Figure 11 shows image results from an action image of one of these players taken during the tournament. The signal to noise level in the images before post-processing is approximately 11. Notice how the addition of folds provides increased resolution at the expense of lower signal to noise. The final, six-fold, lens has amplified the noise during the deconvolution operation to a point where the dynamic range of the final image is dominated by the noise. The tradeoff between resolution and noise makes the identification of the player difficult if not impossible with this level of noise.
Figure 10. Wesley Sneijder, the Netherlands, versus Andres Iniesta, Spain
Figure 11. Images of player from 200 m thick annular lenses with 2(left) – 6(right) folds
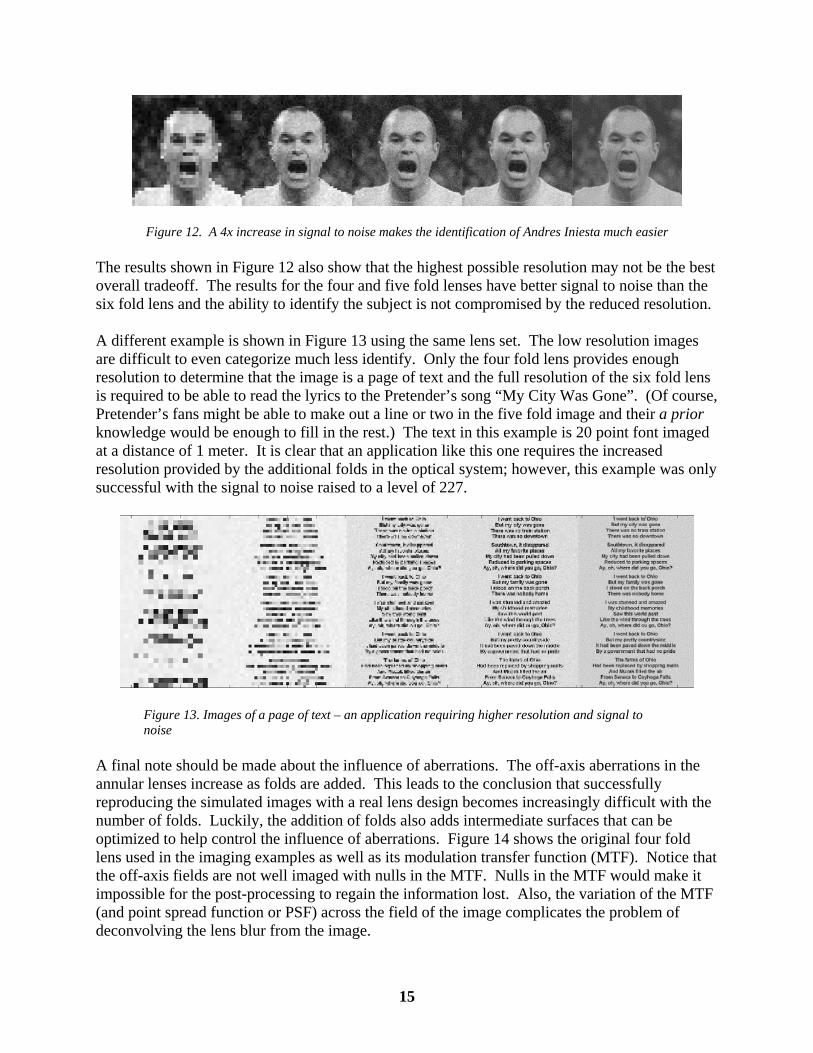
A second version with a signal to noise level of 45 is shown in Figure 12. The 6 dB increase in signal to noise makes the identification of Andres Iniesta much easier despite his obvious joy at having just scored the winning goal for Spain in the World Cup final…against Wesley Sneijder and the Netherlands.
15
Figure 12. A 4x increase in signal to noise makes the identification of Andres Iniesta much easier
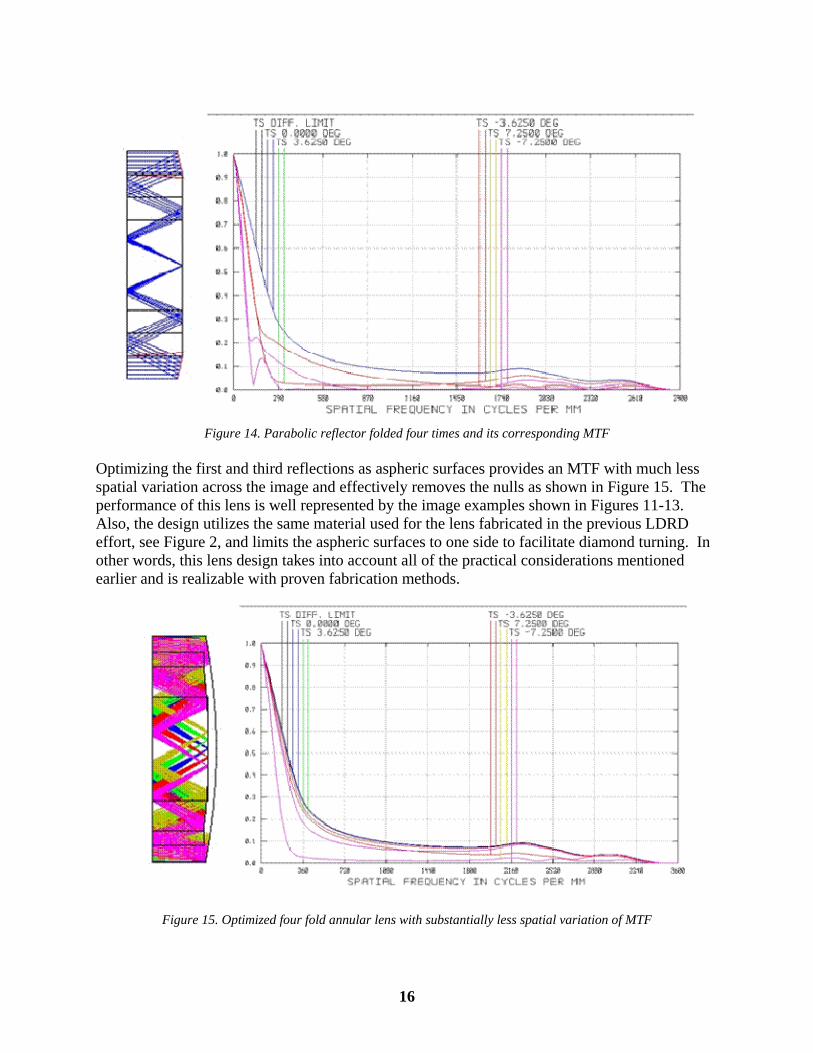
The results shown in Figure 12 also show that the highest possible resolution may not be the best overall tradeoff. The results for the four and five fold lenses have better signal to noise than the six fold lens and the ability to identify the subject is not compromised by the reduced resolution. A different example is shown in Figure 13 using the same lens set. The low resolution images are difficult to even categorize much less identify. Only the four fold lens provides enough resolution to determine that the image is a page of text and the full resolution of the six fold lens is required to be able to read the lyrics to the Pretender’s song “My City Was Gone”. (Of course, Pretender’s fans might be able to make out a line or two in the five fold image and their a prior knowledge would be enough to fill in the rest.) The text in this example is 20 point font imaged at a distance of 1 meter. It is clear that an application like this one requires the increased resolution provided by the additional folds in the optical system; however, this example was only successful with the signal to noise raised to a level of 227.
Figure 13. Images of a page of text – an application requiring higher resolution and signal to noise
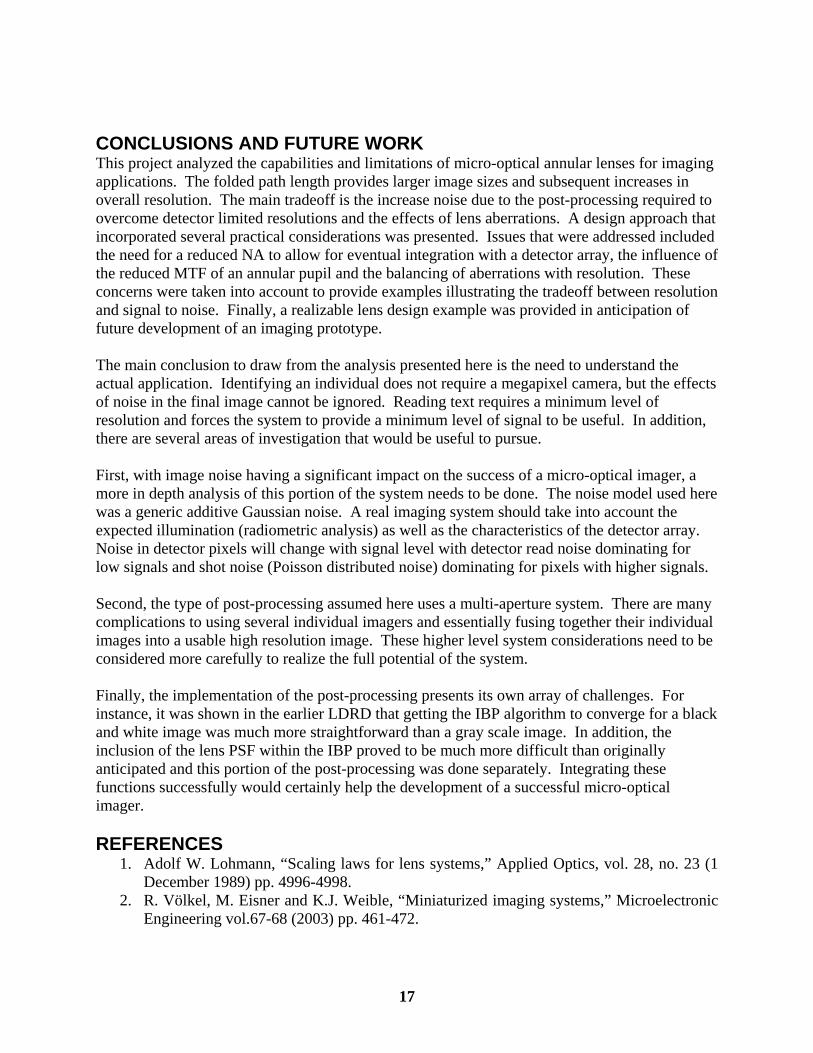
A final note should be made about the influence of aberrations. The off-axis aberrations in the annular lenses increase as folds are added. This leads to the conclusion that successfully reproducing the simulated images with a real lens design becomes increasingly difficult with the number of folds. Luckily, the addition of folds also adds intermediate surfaces that can be optimized to help control the influence of aberrations. Figure 14 shows the original four fold lens used in the imaging examples as well as its modulation transfer function (MTF). Notice that the off-axis fields are not well imaged with nulls in the MTF. Nulls in the MTF would make it impossible for the post-processing to regain the information lost. Also, the variation of the MTF (and point spread function or PSF) across the field of the image complicates the problem of deconvolving the lens blur from the image.
16
Figure 14. Parabolic reflector folded four times and its corresponding MTF
Optimizing the first and third reflections as aspheric surfaces provides an MTF with much less spatial variation across the image and effectively removes the nulls as shown in Figure 15. The performance of this lens is well represented by the image examples shown in Figures 11-13. Also, the design utilizes the same material used for the lens fabricated in the previous LDRD effort, see Figure 2, and limits the aspheric surfaces to one side to facilitate diamond turning. In other words, this lens design takes into account all of the practical considerations mentioned earlier and is realizable with proven fabrication methods.
Figure 15. Optimized four fold annular lens with substantially less spatial variation of MTF
17
CONCLUSIONS AND FUTURE WORK This project analyzed the capabilities and limitations of micro-optical annular lenses for imaging applications. The folded path length provides larger image sizes and subsequent increases in overall resolution. The main tradeoff is the increase noise due to the post-processing required to overcome detector limited resolutions and the effects of lens aberrations. A design approach that incorporated several practical considerations was presented. Issues that were addressed included the need for a reduced NA to allow for eventual integration with a detector array, the influence of the reduced MTF of an annular pupil and the balancing of aberrations with resolution. These concerns were taken into account to provide examples illustrating the tradeoff between resolution and signal to noise. Finally, a realizable lens design example was provided in anticipation of future development of an imaging prototype. The main conclusion to draw from the analysis presented here is the need to understand the actual application. Identifying an individual does not require a megapixel camera, but the effects of noise in the final image cannot be ignored. Reading text requires a minimum level of resolution and forces the system to provide a minimum level of signal to be useful. In addition, there are several areas of investigation that would be useful to pursue. First, with image noise having a significant impact on the success of a micro-optical imager, a more in depth analysis of this portion of the system needs to be done. The noise model used here was a generic additive Gaussian noise. A real imaging system should take into account the expected illumination (radiometric analysis) as well as the characteristics of the detector array. Noise in detector pixels will change with signal level with detector read noise dominating for low signals and shot noise (Poisson distributed noise) dominating for pixels with higher signals. Second, the type of post-processing assumed here uses a multi-aperture system. There are many complications to using several individual imagers and essentially fusing together their individual images into a usable high resolution image. These higher level system considerations need to be considered more carefully to realize the full potential of the system. Finally, the implementation of the post-processing presents its own array of challenges. For instance, it was shown in the earlier LDRD that getting the IBP algorithm to converge for a black and white image was much more straightforward than a gray scale image. In addition, the inclusion of the lens PSF within the IBP proved to be much more difficult than originally anticipated and this portion of the post-processing was done separately. Integrating these functions successfully would certainly help the development of a successful micro-optical imager. REFERENCES
1. Adolf W. Lohmann, “Scaling laws for lens systems,” Applied Optics, vol. 28, no. 23 (1 December 1989) pp. 4996-4998.
2. R. Völkel, M. Eisner and K.J. Weible, “Miniaturized imaging systems,” Microelectronic Engineering vol.67-68 (2003) pp. 461-472.

18
3. Michael W. Haney, “Performance scaling in flat imagers,” Applied Optics, vol. 45, no. 13 (1 May 2006) pp. 2901-2910.
4. Subhasis Chaudhuri, ed., Super-Resolution Imaging, Kluwer Academic Publishers, Boston, 2001.
5. Jun Tanida, Tomoya Kumagai, Kenji Yamada, Shigehiro Miyatake, Kouichi Ishida, Takashi Morimoto, Noriyuki Kondou, Daisuke Miyazaki and Yoshiki Ichioka, “Thin observation module by bound optics (TOMBO): concept and experimental verification,” Applied Optics, vol. 40, no. 11 (10 April 2001) pp. 1806-1813.
6. Premchandra M. Shankar, William C. Hasenplaugh, Rick L. Morrison, Ronald A. Stack and Mark A. Neifeld, “Multiaperture Imaging,” Applied Optics, vol. 45, no. 13 (1 May 2006) pp. 2871-2883.
7. Kouichi Nitta, Rui Shogenji, Shigehiro Miyatake and Jun Tanida, “Image reconstruction for thin observation module by bound optics by using the iterative backprojection method,” Applied Optics, vol. 45, no. 13 (1 May 2006) pp. 2893-2900.
8. A.V. Kanaev, D.A. Scribner, J.R. Ackerman and E.F. Fleet, “Analysis and application of multiframe superresolution processing for conventional imaging systems and lenslet arrays,” Applied Optics, vol. 46, no. 20 (10 July 2007) pp. 4320-4328.
9. Robert R. Boye, Cynthia L. Nelson, Gregory R. Brady, Ronald D. Briggs, Bradley H. Jared and Mial E. Warren, “Ultrathin Optics for Low-Profile Innocuous Imager,” SAND Report 2009-6388.
10. Eric J. Tremblay, Ronald A. Stack, Rick L. Morrison and Joseph E. Ford, “Ultrathin cameras using annular folded optics,” Applied Optics, vol. 46, no. 4 (1 February 2007) pp. 463-471.
11. Joseph W. Goodman, Introduction to Fourier Optics, McGraw-Hill, New York, 1988. 12. Eric J. Tremblay, Joel Rutkowski, Inga Tamayo, Paulo E.X. Silveira, Ronald A. Stack,
Rick L. Morrison, Mark A. Neifeld, Yeshaiyahu Fainman and Joseph E. Ford, “Relaxing the alignment and fabrication tolerances of thin annular folded imaging systems using wavefront coding,” Applied Optics, vol. 46, no. 27 (20 September 2007) pp. 6751-6758.

19
Distribution 1 MS 1082 Robert Boye, 1725 1 MS 0620 Mial Warren, 5644 1 MS 0899 Technical Library, 9536 1 MS 0123 Donna Chavez, LDRD Office, 1011

20