Embed Size (px)
Citation preview

MI/DEQ/WRD-12/006
Michigan National Lakes Assessment Project 2007
Summary of Results

i
Acknowledgements
This report was prepared by Ralph Bednarz, Michigan Department of Environmental Quality (Retired) on assignment as a United States Environmental Protection Agency, Senior Environmental Employment Program, enrollee. The author would like to thank management and staff of the Michigan Department of Environmental Quality, Water Resources Division, and the United States Environmental Protection Agency, National Lake Assessment, program collaborators who contributed to this project. The author is especially appreciative to John Kiddon, United States Environmental Protection Agency, who developed the National Lake Assessment tools (LakeTool and Lake Condition Calculator) used in this project.

ii
Table of Contents
Acknowledgements ..................................................................................................................... i
List of Tables ................................................................................................................................ iii List of Figures .............................................................................................................................. iv List of Appendices ........................................................................................................................ vi List of Acronyms ......................................................................................................................... vii
Introduction ................................................................................................................................. 1
Michigan’s NLA Survey Overview and Report Focus.............................................................. 2
Methods ....................................................................................................................................... 2
The Condition of Michigan Inland Lakes ......................................................................... 5
Biological Condition of Michigan Lakes ............................................................................ 5
Index of Taxa Loss ........................................................................................................... 5 Stressors of Lake Condition ........................................................................................... 7
Recreational Condition of Michigan Lakes ..................................................................... 11
Trophic Condition of Michigan Lakes .............................................................................. 12
Chemical Condition of Michigan Lakes .......................................................................... 15
Morphometric Characteristics of Michigan Inland Lakes ......................................... 18 Organic carbon, color, turbidity, and Secchi transparency ...................................... 20 Nutrients and chlorophyll-a ........................................................................................... 22 Chemical cations and anions ....................................................................................... 24 ANC and pH .................................................................................................................... 29
NES Lake Summary .......................................................................................................... 30
Summary and Conclusions ...................................................................................................... 38
Next Steps ................................................................................................................................. 41
References ................................................................................................................................. 42
iii
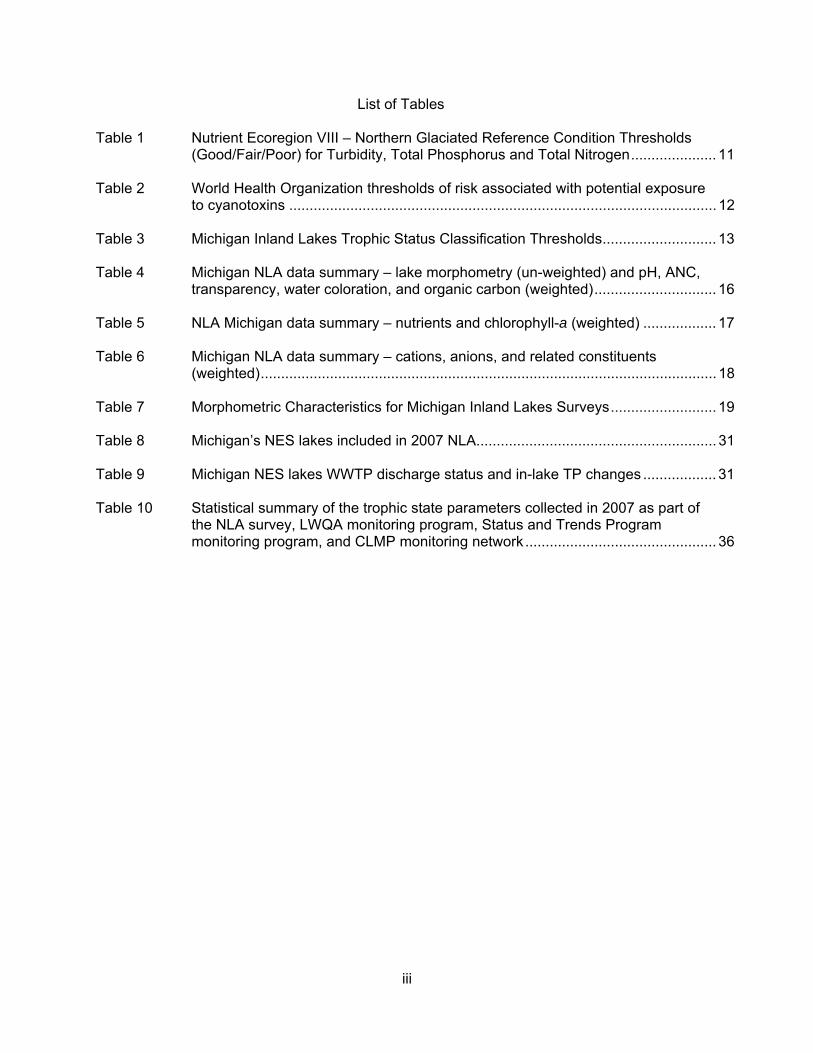
List of Tables Table 1 Nutrient Ecoregion VIII – Northern Glaciated Reference Condition Thresholds
(Good/Fair/Poor) for Turbidity, Total Phosphorus and Total Nitrogen ..................... 11 Table 2 World Health Organization thresholds of risk associated with potential exposure
to cyanotoxins ......................................................................................................... 12 Table 3 Michigan Inland Lakes Trophic Status Classification Thresholds ............................ 13 Table 4 Michigan NLA data summary – lake morphometry (un-weighted) and pH, ANC,
transparency, water coloration, and organic carbon (weighted) .............................. 16 Table 5 NLA Michigan data summary – nutrients and chlorophyll-a (weighted) .................. 17 Table 6 Michigan NLA data summary – cations, anions, and related constituents
(weighted) ................................................................................................................ 18 Table 7 Morphometric Characteristics for Michigan Inland Lakes Surveys .......................... 19 Table 8 Michigan’s NES lakes included in 2007 NLA........................................................... 31 Table 9 Michigan NES lakes WWTP discharge status and in-lake TP changes .................. 31 Table 10 Statistical summary of the trophic state parameters collected in 2007 as part of
the NLA survey, LWQA monitoring program, Status and Trends Program monitoring program, and CLMP monitoring network ............................................... 36

iv
List of Figures Figure 1. NLA Survey – Michigan Lakes ................................................................................ 3 Figure 2 Ecoregions used in the NLA (based on Omernik Level III ecoregions) (Source: USEPA) .................................................................................................... 4 Figure 3 Biological Condition – Index of Taxa Loss (Plankton O/E) ...................................... 6 Figure 4 Biological Condition – LDCI ..................................................................................... 7 Figure 5 Extent of Stressors in Michigan Lakes, NLA 2007 .................................................. 9 Figure 6 Comparison of Michigan, National and UMW Ecoregion Results for Habitat,
NLA 2007 ................................................................................................................ 10 Figure 7 Comparison of Michigan, National and UMW Ecoregion Results for Nutrients
and other Chemical Stressors, NLA 2007 ............................................................... 10 Figure 8 Comparison of Michigan, National and UMW Ecoregion Results for
Recreational Condition, NLA 2007 .......................................................................... 11 Figure 9 Trophic Status – Chlorophyll-a, NLA 2007 .............................................................. 13 Figure 10 Trophic Status – Total Phosphorus, NLA 2007 ....................................................... 14 Figure 11 Trophic Status – Secchi Disk Transparency, NLA 2007 .......................................... 14 Figure 12 UMW ecoregion concentration range distribution and pattern for TOC ................... 20 Figure 13 UMW ecoregion concentration range distribution and pattern for DOC .................. 21 Figure 14 UMW ecoregion concentration range distribution and pattern for Color .................. 21 Figure 15 UMW ecoregion concentration range distribution and pattern for Secchi
Transparency. ......................................................................................................... 22 Figure 16 UMW ecoregion concentration range distribution and pattern for Turbidity ............ 22 Figure 17 UMW ecoregion concentration range distribution and pattern for Total
Phosphorus ............................................................................................................. 23 Figure 18 UMW ecoregion concentration range distribution and pattern for Total Nitrogen .... 24 Figure 19 UMW ecoregion concentration range distribution and pattern for Chlorophyll-a ..... 24 Figure 20 UMW ecoregion concentration range distribution and pattern for Specific
Conductance ........................................................................................................... 25 Figure 21 UMW ecoregion concentration range distribution and pattern for Calcium ............. 26
v
Figure 22 UMW ecoregion concentration range distribution and pattern for Magnesium ........ 26 Figure 23 UMW ecoregion concentration range distribution and pattern for Sodium .............. 27 Figure 24 UMW ecoregion concentration range distribution and pattern for Potassium ......... 27 Figure 25 UMW ecoregion concentration range distribution and pattern for Silica .................. 28 Figure 26 UMW ecoregion concentration range distribution and pattern for Sulfate ............... 28 Figure 27 UMW ecoregion concentration range distribution and pattern for Chloride ............. 29 Figure 28 UMW ecoregion concentration range distribution and pattern for ANC ................... 30 Figure 29 UMW ecoregion trophic status criteria distribution and pattern for pH .................... 30 Figure 30 Long Term Trophic Condition Changes in Michigan NLA/NES Lakes: Carlson
TSI-Total Phosphorus ............................................................................................. 32 Figure 31 Long Term Trophic Condition Changes in Michigan NLA/NES Lakes – Carlson
TSI-Chlorophyll-a .................................................................................................... 32 Figure 32 Long Term Trophic Condition Changes in Michigan NLA/NES Lakes – Carlson
TSI-Transparency .................................................................................................... 33 Figure 33 Long-term total phosphorus levels in Palmer, Brighton, Chemung and
Thornapple Lakes .................................................................................................... 34 Figure 34 Multiple surveys comparison – 2007 summer Secchi transparency ........................ 37 Figure 35 Multiple surveys comparison – 2007 summer epilimnetic total phosphorus. ........... 37 Figure 36 Multiple surveys comparison – 2007 summer chlorophyll-a. ................................... 38

vi
List of Appendices Appendix 1a. NLA-Michigan Lakes: Lake Morphometry Appendix 1b. NLA-Michigan Lakes: Organic carbon, Color, pH, ANC, Secchi, and Turbidity
Appendix 1c. NLA-Michigan Lakes: Nutrients and Chlorophyll-a Appendix 1d. NLA-Michigan Lakes: Conductivity, Cations, and Anions

vii
List of Acronyms
ANC Acid neutralizing capacity
CLMP Cooperative Lakes Monitoring Program
CMI Clean Michigan Initiative
DOC Dissolved Organic Carbon
GLEC Great Lakes Environmental Center
IBI Index of Biotic Integrity
LDCI Lake Diatom Condition Index
LWQA Lake Water Quality Assessment
MDEQ Michigan Department of Environmental Quality
MDNR Michigan Department of Natural Resources
mg/L Milligrams per liter
NES National Eutrophication Study
NLA National Lakes Assessment
NTU Nessler Turbidity Units
O/E Observed/Expected
PCU Platinum-cobalt units
STP Status and Trends Program
S.U. Standard units
TOC Total Organic Carbon
TN Total Nitrogen
TP Total Phosphorus
TSI Trophic State Index
ug/L Micrograms per liter
UMW Upper Midwest
USEPA United States Environmental Protection Agency
WWTP Wastewater Treatment Plant

1
Introduction The United States Environmental Protection Agency (USEPA) is implementing a series of National Aquatic Resource surveys to assess the quality of the nation’s waters. In 2007, the USEPA and its state and tribal partners conducted the first national survey of the nation’s lakes, ponds, and reservoirs. This National Lakes Assessment (NLA) Survey is designed to provide statistically valid regional and national estimates of the condition of lakes as well as statewide assessments for those states who participated in the NLA Survey. Consistent sampling and analytical procedures ensure that the results can be compared across the nation. The goal of the NLA Survey is to address two key questions about the quality of the Nation’s lakes, ponds, and reservoirs:
• What percentage of the nation’s lakes are in good, fair, and poor condition for key indicators of trophic state, ecological health, and recreation?
• What is the relative importance of key stressors such as nutrients, bacteria, and
lakeshore development? The sampling design for the NLA Survey is a probability-based sampling site network that provides statistically valid estimates of the condition of about 50,000 lakes nationwide, with a known degree of confidence. A total of 1,028 lakes in the conterminous United States were included in the 2007 NLA Survey. The sample set was comprised of natural and built freshwater lakes and reservoirs greater than 4 hectares (10 acres) and at least one meter in depth. The lake selection process provided for five size class categories, as well as spatial distribution across the nation and nine aggregated ecoregions. Sample sites were selected at random to represent the condition of the larger population of lakes across the nation and each ecoregion. The design also incorporated a representative subset of the lakes that were included in the lake National Eutrophication Study (NES), conducted by the USEPA in 1972 (USEPA, 1974). Michigan received 29 lakes as part of the original draw of lakes for the national survey and added 21 lakes to the survey design for the state-scale assessment. Four lakes from the suite of national reference lakes selected by the USEPA were also located in Michigan. The typical sampling effort at each site included a variety of samples and measurements collected at a mid-lake index site, which was often at the deepest point in the lake. Samples included a two meter integrated sample for water chemistry, chlorophyll-a, microcystin, and algal identification; oxygen and temperature profiles; zooplankton tow; and sediment core sample for diatom reconstruction of total phosphorus (TP) (based on top and bottom slices from the core) and surface sediment sample for mercury. Michigan added discrete surface and hypolimnetic (sub-themocline) water samples for mercury analysis to the survey indicators. In addition, ten random nearshore sites were qualitatively assessed for various littoral (nearshore) and riparian (shoreline) habitat-related measures. A bacterial indicator (enterococci) sample was collected at one of the nearshore sites. This report presents the findings of the state-scale assessment for Michigan’s lakes. The structure of this report is patterned after the NLA Survey national report (USEPA, 2009) and Minnesota’s NLA Survey state-specific assessment report (Heiskary and Lindon, 2010), which provide a basis for comparing regional and state-level NLA Survey results. More information on

2
the overall NLA Survey, field methods, and the assessment process, as well as the final national report, can be found at: http://water.epa.gov/type/lakes/lakessurvey_index.cfm. Michigan’s NLA Survey Overview and Report Focus Michigan’s 2007 NLA effort was led by the Michigan Department of Environmental Quality (MDEQ). The project was implemented under contract by the Great Lakes Environmental Center (GLEC) (www.glec.com/) with assistance from the USEPA Senior Environment Employment Program enrollees working for the MDEQ. The project was funded with USEPA Section 106 grant resources and Clean Michigan Initiative funds. Initially, 29 randomly selected lakes in Michigan were included as part of the national survey. Michigan included 21 additional lakes from the national draw to provide for the statistically-based estimates of condition statewide (Figure 1). Based on the NLA survey design, 50 randomly selected and sampled lakes was the minimum number needed to apply the results statewide with ±15% margin of error and 95% confidence. In addition to the 50 randomly selected lakes, 4 lakes in Michigan were selected as part of the suite of national reference sites and sampled by the USEPA for the NLA. Appendix 1 includes a listing of all 54 Michigan lakes sampled during the NLA Survey. The purpose of this report is to provide a summary of the findings for trophic status indicators and related water chemistry, ecological integrity indicators, and recreational indicators for Michigan’s lakes based on the NLA Survey data collected during the summer of 2007. Given the NLA Survey statistically-based design, this dataset provides a good basis for describing the typical range of, and interrelationships among, constituents in Michigan’s lakes on a statewide basis. The state-scale assessment is compared with the national and regional findings and there is additional analysis of the subset of eight NES lakes for Michigan included in the sample design. These results also are compared to selected results from the MDEQ Lake Water Quality Assessment (LWQA) monitoring project, the Michigan Department of Natural Resource’s (MDNR) Status and Trends Program (STP), and Michigan’s Cooperative Lakes Monitoring Program (CLMP) volunteer monitoring network. Methods All lakes were sampled once and four lakes were revisited for a second sampling: Bogie Lake (Lake ID: NLA06608-0010), Lake Keewaydin (Lake ID: NLA06608-1998); Crooked Lake (Lake ID: NLA06608-1334); and Lake Gogebic (Lake ID: NLA06608-1358). The results of revisit sampling from these four lakes were excluded from statistical analysis so that all lakes were represented by a single sample event collected in July-September of 2007. The randomly selected 50 lakes were sampled by the GLEC (Michigan Lower Peninsula lakes) and MDEQ Senior Environment Employment enrollees (Michigan Upper Peninsula lakes). The four reference lakes were sampled by USEPA staff.

3
Figure 1. NLA Survey – Michigan Lakes. All laboratory analyses were conducted by the USEPA, or other federal or private laboratories contracted by the USEPA to analyze the various NLA Survey indicator samples. Details on methods and quality assurance may be found at: http://water.epa.gov/type/lakes/lakessurvey_index.cfm. The MDEQ LWQA monitoring program and CLMP volunteer monitoring network results referred to in this report were from samples analyzed by the MDEQ Environmental Laboratory. Relevant details on methods and quality assurance may be found in Bednarz et al. (2008) and Bednarz et al. (2007), respectively. The MDNR STP results were from samples analyzed by the MDEQ Environmental Laboratory; or from TriMatrix Laboratories (www.trimatrixlabs.com), White Water Associates, Inc. (www.white-water-associates.com/), Central Michigan University Michigan Water Resource Center (www.cst.cmich.edu/IGLR/MWRC) or GLEC (www.glec.com) laboratories. Relevant details on methods and quality assurance for the MDNR STP may be found in Wehrly et al. (2012a). The 2007 NLA data are summarized at the state level and compared to the national and regional results. The USEPA NLA Survey results are compared geographically based on aggregated Level 3 ecoregions (Figure 2). All three mapping levels (state, aggregated ecoregion, and nation) are incorporated in this report. Microsoft Excel-based mapping and
1515
• EPA NLA Survey Lakes (MI = 29)Lake Besser, Alpena Co.Fence Lake, Baraga Co.Thornapple Lake, Barry Co. Eight Point Lake, Clare Co.McDonald Lake, Delta Co.Bloomgreen Marsh, Dickinson Co. Pine Lake, Eaton Co.Squaw Lake, Genesee Co.Loon Lake, Gogebic Co.Mud Lake, Houghton Co.Silver Lake, Iron Co.Clark Lake, Jackson Co.Campbell Lake, Kalamazoo Co.Pine Lake, Kent Co.Stoner Lake, Kent Co. Brighton Lake, Livingston Co.Hi-Land Lake, Livingston Co.Lake Chemung, Livingston Co.Dewey Lake, Marquette Co.Keewaydin Lake, Marquette Co.Tallman Lake, Mason Co.Muskegon Lake, Muskegon Co.Martin Lake, Newaygo Co.Bogie Lake, Oakland Co.Mill Lake, Oakland Co.Au Sable Lake, Ogemaw Co.Palmer Lake, St. Joseph Co.Round Lake, Van Buren Co. Belleville Lake, Wayne Co.
• MI State-scale Lakes (+21)Howe Lake, Alger Co. Upper Scott Lake, Allegan Co.Big Lake, Baraga Co.Warner Lake, Barry Co.Donnell Lake, Cass Co.Deer Lake, Charlevoix Co.No Name Lake, Clare Co.Crooked Lake, Emmet Co.Lake Gogebic, Gogebic Co.Bridge Lake, Grand Traverse Co.Tims Lake, Jackson Co.West Lake, Kalamazoo Co.Lake Bailey, Keweenaw Co. Stony Creek Lake, Macomb Co.Forestville Impoundment, Dead River, Marquette Co.Lotto Lake, Marquette Co.Pere Marquette Lake, Mason Co.Blue Lake, Mecosta Co.Wyckoff Lake, Oceana Co.Lake Saddle, Van Buren Co.Ford Lake, Washtenaw Co.
National Lakes Survey- Michigan

4
analysis tools (NLA LakeTool data viewer, NLA Condition Calculator), developed by the USEPA (Kiddon, 2010; 2011a; and 2011b) were used to assist with the data analysis and presentation. These tools provide for NLA data analysis and comparison at the national, ecoregion, and state levels. The tools also allow for user-defined regions (e.g., USEPA Regions or Subregions). The tools let the user select for a weighted or unweighted data analysis, define the scale at which to analyze and present the data, and define three or four thresholds for analyzing each parameter. State-specific trophic status criteria and actual water quality standards are used for the analysis thresholds when available. Otherwise, ecoregion derived thresholds, in particular interquartile ranges (25th and 75th percentiles), are used for data presentation and mapping purposes. Tabulated percentile distributions of the weighted physical and chemical constituent data and graphical illustrations of select ecological, trophic, and recreation condition indicators are used to describe parameter distributions for Michigan, the Upper Midwest (UMW) ecoregion, and the nation based on the sampled lakes. Each lake is weighted to reflect its surface area and proportion in the size-class assessment unit and it provides a balanced estimate of all lakes in the state or region (USEPA, 2009; Kiddon, 2011c). Figure 2. Ecoregions used in the NLA (based on Omernik Level III ecoregions). (Source: USEPA)

5
Results and Discussion The Condition of Michigan Inland Lakes The NLA Survey data analysis used three approaches to assess lake condition (USEPA, 2009). The first approach evaluated whether lakes are able to support healthy aquatic plant and animal communities. The NLA team evaluated key stressors to lake biota, such as chemical and physical habitat attributes, and ranked the stressors in order of importance. The second approach evaluated recreational suitability by assessing the risk of exposure to algal toxins. The third approach evaluated trophic state based on chlorophyll-a levels. This report incorporates these three approaches to assess the condition of Michigan’s lakes and it extends the trophic condition assessment by analyzing Secchi transparency and TP trophic status indicators along with chlorophyll-a. A summary of the water chemistry and related variables for Michigan lakes based on the 2007 NLA data is also presented. Biological Condition of Michigan Lakes A healthy lake generally contains a varied and abundant biological community that is well balanced in terms of species numbers and diversity. The presence, number, and diversity of fish, insects, algae, macrophytes, and other organisms in and around the lake characterize the health and biological productivity of the lake ecosystem. The number and kinds of plant and animal species present in a lake system are a direct measure of the lake’s health. The 2007 NLA Survey’s biological condition assessment is based on information from two biological communities – the phytoplankton and zooplankton assemblages (USEPA, 2009). For the 2007 survey, the primary gauge of biological health is an index of taxa loss, which is applied to the phytoplankton and zooplankton data. The planktonic taxa loss indicator is used as the main measure of overall lake condition since it is based on both plant and animal data. A second method for assessing lake health uses an index of biotic integrity (IBI) based on the sediment diatom data. Both approaches use the biological reference conditions developed from constructed sets of reference lakes as described in the NLA Survey report technical appendix (USEPA, 2010). Since only a portion of the initial reference lakes selected for the NLA survey were found to be of reference quality, the USEPA used the results from these lakes as well as high quality lakes from the random site selection process to establish “least disturbed” condition benchmarks based on statistically derived reference screening criteria. These benchmarks were established for lakes in the aggregate ecoregions as well as nation’s lakes overall. Index of Taxa Loss The 2007 NLA Survey uses a planktonic observed/expected (O/E) taxa loss model to assess the condition of the primary producers (phytoplankton community) and consumers (zooplankton community) in the lake. The O/E model compares taxa found in individual lake samples with those expected to be present in reference lakes. The O/E method is widely used nationally and internationally to assess the condition of aquatic communities. The O/E values are commonly interpreted as the percentage of the expected taxa present based on reference lake assemblages compiled from a regional basis. The higher the percentage of expected taxa present, the healthier the biological condition of the lake. As with all indicators, the O/E values must be interpreted relative to the quality of reference sites
6
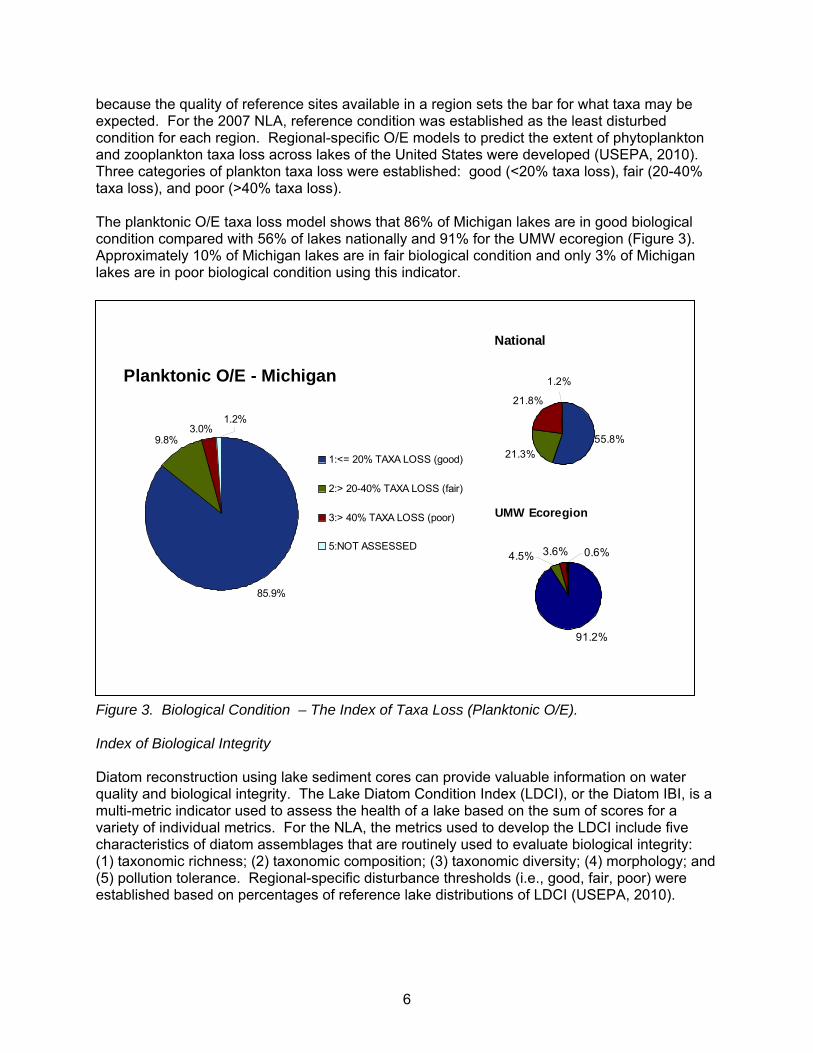
because the quality of reference sites available in a region sets the bar for what taxa may be expected. For the 2007 NLA, reference condition was established as the least disturbed condition for each region. Regional-specific O/E models to predict the extent of phytoplankton and zooplankton taxa loss across lakes of the United States were developed (USEPA, 2010). Three categories of plankton taxa loss were established: good (<20% taxa loss), fair (20-40% taxa loss), and poor (>40% taxa loss). The planktonic O/E taxa loss model shows that 86% of Michigan lakes are in good biological condition compared with 56% of lakes nationally and 91% for the UMW ecoregion (Figure 3). Approximately 10% of Michigan lakes are in fair biological condition and only 3% of Michigan lakes are in poor biological condition using this indicator. Figure 3. Biological Condition – Index of Taxa Loss (Plankton O/E) Figure 3. Biological Condition – The Index of Taxa Loss (Planktonic O/E). Index of Biological Integrity Diatom reconstruction using lake sediment cores can provide valuable information on water quality and biological integrity. The Lake Diatom Condition Index (LDCI), or the Diatom IBI, is a multi-metric indicator used to assess the health of a lake based on the sum of scores for a variety of individual metrics. For the NLA, the metrics used to develop the LDCI include five characteristics of diatom assemblages that are routinely used to evaluate biological integrity: (1) taxonomic richness; (2) taxonomic composition; (3) taxonomic diversity; (4) morphology; and (5) pollution tolerance. Regional-specific disturbance thresholds (i.e., good, fair, poor) were established based on percentages of reference lake distributions of LDCI (USEPA, 2010).
Planktonic O/E - Michigan
85.9%
9.8%3.0%
1.2%
1:<= 20% TAXA LOSS (good)
2:> 20-40% TAXA LOSS (fair)
3:> 40% TAXA LOSS (poor)
5:NOT ASSESSED
National
55.8%21.3%
1.2%
21.8%
UMW Ecoregion
91.2%
3.6% 0.6%4.5%

7
The biological condition of Michigan’s lakes using the LDCI indicates that 86% of the lakes are in least disturbed (good) or intermediate disturbed (fair) condition compared with 74% of lakes nationally and 78% for the UMW ecoregion (Figure 4). Nearly 13% of Michigan lakes are considered to be of poor biological condition using the LDCI. Figure 4. Biological Condition – LDCI. The national results of the planktonic O/E analysis are similar to the national results of the diatom LDCI analysis. This agreement is not the same for lakes in the UMW ecoregion, including Michigan lakes, where a smaller proportion of lakes are assessed as good and a larger proportion of lakes are assessed as fair using the lake diatom IBI, or LDCI. A possible explanation of these differences is that the taxa loss index examines a specific aspect of biological condition, biodiversity loss, for the total phytoplankton and zooplankton community of the lake whereas the IBI analysis combines multiple characteristics of a specific algal assemblage (diatoms) to evaluate overall biological condition (USEPA, 2010). For this instance, the two groups may be responding differently to the stresses impacting lakes or to different stresses. Stressors of Lake Condition In natural environments such as lake ecosystems, a stressor can be anything chemical, biological, or physical that has the potential to alter an organism’s ability to thrive. Drought or rapid draw-down, contaminants (e.g., metals, pesticides, excessive nutrients), and human activities can be stressors. An important dimension of the NLA is to evaluate key chemical and physical stressors of lake quality that have the potential to impact lake biota (USEPA, 2009).
Lake Diatom IBI - Michigan
42.4%
12.8%1.1%
43.6%
1:LEAST DISTURBED (good)
2:INTERMEDIATEDISTURBANCE (fair)
3:MOST DISTURBED (poor)
4:NOT ASSESSED
National
49.2%
24.8%
22.8%3.2%
UMW Ecoregion
48.0%
29.8%
21.9%0.2%

8
Chemical Stressors Eight chemical indicators of lake stress were measured in the NLA. Five of the chemical indicators were evaluated for inclusion in the national report including: (1) TP concentration; (2) total nitrogen (TN) concentration; (3) turbidity; (4) acid neutralizing capacity (ANC); and (5) dissolved oxygen concentration. These five indicators along with conductivity (salinity) and chloride are included in the statewide assessment for Michigan and the UMW ecoregion lakes. Mercury data for sediment and water are still under evaluation and are not included in this report. Physical Stressors Physical impacts to lakeshore and littoral habitats can have a profound effect on lake biological health. Physical habitat condition was assessed based on observations of four indicators: (1) lakeshore habitat; (2) shallow water habitat; (3) physical habitat complexity; and (4) human disturbance, based on extent and intensity of human activity. The lakeshore habitat indicator examines the amount and type of riparian vegetation. This metric is based on observations of three layers of coverage (understory grasses and forbs, mid-story non-woody and woody shrubs, and over-story trees). In general, lakeshores are in better condition when shoreline vegetation cover is lush in all three layers (USEPA, 2010). The shallow water habitat indicator examines the quality of the shallow edge of the lake (littoral zone) by utilizing data on the presence of living and non-living features such as overhanging vegetation, aquatic plants, large woody snags, brush, boulders, and rock ledges. Lakes with greater and more varied shallow water habitat are typically able to more effectively support aquatic life because they have more complex ecological niches (USEPA, 2010). The physical habitat complexity indicator integrates data from the riparian and littoral zones to estimate the amount and variety of all cover types at the water’s edge, providing an index of habitat condition at the land-water interface of lakes (USEPA, 2010). All three of the habitat indicators mentioned above are related to conditions in reference lakes. The values are modified regionally to account for differing expectations of natural condition in reference lakes for a particular region. The lakeshore human disturbance indicator incorporates the extent and intensity of human land use activities that were observed within and adjacent to each physical habitat station. It reflects direct human alteration of the lakeshore ranging from minor changes (such as the removal of trees to develop a picnic area) to major alterations (such as the construction of a large lakeshore residential complex complete with concrete seawalls and artificial beaches) (USEPA, 2010). For the NLA, each of the above indicators or stressors for a lake was classified as either “good,” “fair,” or “poor” relative to the conditions found in the set of reference lakes established for the survey. Specifically, lake results above 25% of the reference range values are considered good; those below 5% of the reference range value are poor; and those between the 5% and 25% range are considered fair (USEPA, 2009). Riparian and nearshore habitat degradation and excess nutrients were the most widespread stressors measured in the NLA nationally (USEPA, 2009). The most wide-spread stressors

9
measured in Michigan lakes are related to habitat. Figure 5 shows the percent of lakes in Michigan that assessed as poor, fair, and good for each of the key stressors collected during the NLA Survey. Figure 5. Extent of Stressors in Michigan Lakes, NLA 2007. According to the survey, loss of lakeshore habitat and physical lakeshore complexity are major stressors for Michigan lakes with nearly 40% of lakes in poor condition for each of these stressors. Nutrients and turbidity account for 3% to 4% of lakes in poor condition for these stressors. Salinity/conductivity, ANC, and dissolved oxygen as measured in the NLA Survey did not account for poor conditions for these stressors in the Michigan lakes measured statewide. Figures 6 and 7 compare the extent of the habitat and chemical stressors in Michigan’s lakes with the results for the lakes in the UMW ecoregion and across the country. The lakeshore habitat and physical lakeshore complexity stressors are higher in Michigan lakes as compared to the nation and the UMW ecoregion. Conversely, a larger percentage of the nation’s lakes and lakes in the UMW ecoregion are in poor condition for nutrients, and to a lesser extent for turbidity stressors as compared to Michigan’s lakes.
Extent of Stressors in Michigan Lakes
0% 10% 20% 30% 40% 50% 60% 70% 80% 90% 100%
Lakeshore Habitat
Physical Habitat Complexity
Lakeshore Disturbance
Shallow Water Habitat
Turbidity
Total Phosphorus
Total Nitrogen
Salinity/Conductivity
Acid Neutralizing Capacity
Dissolved Oxygen (surface)
Percent of Lakes Rated as Poor, Fair, and Good for Each Stressor
PoorFairGoodNot Assessed

10
Figure 6. Comparison of Michigan, National and UMW Ecoregion Results for Habitat, NLA 2007. Figure 7. Comparison of Michigan, National and UMW Ecoregion Results for Nutrients and Other Chemical Stressors, NLA 2007. The ecoregion-specific reference condition thresholds (good/fair/poor) for turbidity, TP, and TN are listed in Table 1.
Percent of Lakes Rated as Most Disturbed(Poor) Condition - Habitat Indicators
0.0% 10.0% 20.0% 30.0% 40.0% 50.0%
Lakeshore Habitat
Physical HabitatComplexity
LakeshoreDisturbance
Shallow WaterHabitat
MichiganNationalUMW Ecoregion
Percent of Lakes Rated as Most Disturbed(Poor) Condition - Other Indicators
0.0% 10.0% 20.0% 30.0% 40.0% 50.0%
Turbidity
Total Phosphorus
Total Nitrogen
Salinity/Conductivity
Dissolved Oxygen
Acid Neutralizing Capacity
MichiganNationalUMW Ecoregion

11
Table 1. Nutrient Ecoregion VIII – Northern Glaciated Reference Condition Thresholds (Good/Fair/Poor) for Turbidity, TP and TN.
Parameter Reference Condition Thresholds Good-Fair Fair-Poor
Turbidity (NTU) 2.75 5.41 Total Phosphorus (ug/L) 16.5 36 Total Nitrogen (ug/L) 674 1174
Recreational Condition of Michigan Lakes An important aspect of lake health includes suitability for public use and recreation. Some microbial organisms, or algal toxins, can adversely impact human health. The second approach to evaluate the health of the nation’s lakes included an assessment of exposure to algal toxins. As part of the NLA, three indicators of potential risk to public use and recreation were evaluated including: (1) microcystins, an algal toxin; (2) cyanobacteria, a type of bluegreen algae that can produce algal toxins; and (3) chlorophyll-a, a measure of all algae present (USEPA, 2009). Results for the bacterial pathogen indicator (enterococci) and for sediment and water mercury are still under evaluation and are not included this report. Results for Michigan show that microcystin levels were present in about the same percent of lakes as they are nationally (approximately 30% for all lakes), but slightly greater than found in the UMW ecoregion lakes (Figure 8). However, for each of the indicators of risk, Michigan lakes showed a lower percentage of lakes in the moderate risk category when compared to the national and UMW ecoregion results (Figure 8) and no lakes in the high risk category. Figure 8. Comparison of Michigan, National and UMW Ecoregion Results for Recreational Condition, NLA 2007.
Recreational Indicators
0.0% 10.0% 20.0% 30.0% 40.0% 50.0%
Microcystins Present(>0.1 ug/L)
Microcystine Risk(moderate)
Cyanobacteria Risk(moderate)
Recreational ChlorophyllRisk (moderate)
Percent of Lakes
Michigan
National
UMW Ecoregion

12
The thresholds (low, moderate, and high risk) associated with each indicator of potential risk are based on the World Health Organization criteria as indicated in Table 2. Table 2. World Health Organization thresholds of risk associated with potential exposure to cyanotoxins.
Indicator (units)
Low Risk of Exposure
Moderate Risk of Exposure
High Risk of Exposure
Chlorophyll-a (ug/L)
< 10 10 - < 50 > 50
Cyanobacteria cell counts (#/L)
< 20,000 20,000 – < 100,000 ≥ 100,000
Microcystin (ug/L)
< 10 10 - ≤ 20 > 20
Trophic Condition of Michigan Lakes The third approach the NLA used to evaluate the condition of lakes was with respect to primary production. Trophic state depicts biological productivity, representing the total weight of living biological material (biomass) in a water body. Lakes with high nutrient levels, high plant production rates, and an abundance of plant life are generally considered eutrophic (high productivity), whereas lakes that have low concentrations of nutrients, low rates of productivity, and generally low biomass are termed oligotrophic (low productivity). Lakes that fall in between are mesotrophic (moderate productivity), and those on the extreme ends of the scale are termed hypereutrophic (excessive productivity) and ultra-oligotrophic (very low productivity). Lakes exist across all trophic categories naturally. However, hypereutrophic lakes are usually the result of excessive human activity and can be an indicator of stress conditions, which may result in impaired biological communities and recreational use. There is no preferred trophic state for lakes as a whole since lakes naturally fall in all of these categories. Additionally, the determination of “ideal” trophic state depends on how the lake is used or managed. For example, an oligotrophic lake is a better source of drinking water than a eutrophic lake because the water is easier or less expensive to treat. Swimmers and recreational users also prefer oligotrophic lakes because of their clarity and aesthetic quality. Property values on lakes generally increase with water clarity and aesthetic quality (Boyle and Bouchard, 2003; Krysel et al., 2003). Eutrophic lakes can be biologically diverse with abundant fish, plants, and wildlife. Anglers typically prefer more eutrophic lakes since increased concentrations of nutrients, algae, or aquatic plant life generally result in higher fish production. However, eutrophic lakes do not support a coldwater fishery that requires high levels of dissolved oxygen below the lake’s thermocline. Eutrophication resulting from nutrient input is a slow, natural part of lake aging. However, human influences today are significantly increasing the amount and rate at which nutrients enter lakes. Human activities such as poorly managed agriculture or septic systems and suburbanization of lakeshores can result in excessive nutrient concentrations reaching lakes. This can lead to accelerated eutrophication and related undesirable effects including nuisance algae, excessive plant growth, decreased water transparency, odor, and fish kills. Many states classify their lakes by trophic state using a variety of thresholds for nutrients (phosphorus or nitrogen), Secchi disk transparency, or chlorophyll-a, depending on the data available. For the NLA, the trophic state is characterized using chlorophyll-a concentration as

13
measured in a composite water sample from the upper two meters of the lake (USEPA, 2009). The NLA analysts consider this indicator as the most relevant and straightforward estimate of trophic state because it is based on direct measurements of live organisms, yet acknowledges that other indicators could be used. For the Michigan assessment, three indicators - Secchi transparency, TP, and chlorophyll-a are used to estimate trophic condition and compare Michigan results to the regional and national results. The trophic status classifications were determined based on Michigan’s trophic state index thresholds for these parameters (Table 3). The chlorophyll thresholds for Michigan differ slightly from those used in the NLA but were applied to the national and regional data for this analysis. Table 3. Michigan Inland Lakes Trophic Status Classification Thresholds. Trophic State Carlson TSI TP
(ug/L) SD-Trans. (ft) SD-Trans.
(m) Chl-a (ug/L)
Oligotrophic ≤38 ≤10 ≥15 ≥4.6 ≤2.2 Mesotrophic 38-48 10-20 7.5-15 2.3-4.6 2.2-6 Eutrophic 48-61 20-50 3-7.5 0.9-2.3 6-22 Hypereutrophic >61 >50 <3 <0.9 >22 Figures 9, 10, and 11 show the results for each indicator based on these thresholds for Michigan lakes and compares them to the lakes in the nation and UMW ecoregion. Figure 9. Trophic Status – Chlorophyll-a, NLA 2007.
Trophic Status - Chlorophyll a
0.0% 10.0% 20.0% 30.0% 40.0% 50.0% 60.0% 70.0% 80.0% 90.0%
Oligotrophic (<= 2.2 ug/L)
Mesotrophic (>2.2-6 ug/L)
Eutrophic (>6-22 ug/L)
Hypereutrophic (>22 ug/L)
Percent of Lakes
MichiganNationalUMW Ecoregion

14
Figure 10. Trophic Status – TP, NLA 2007. Figure 11. Trophic Status – Secchi Disk Transparency, NLA 2007.
Trophic Status - SD Transparency
0.0% 10.0% 20.0% 30.0% 40.0% 50.0% 60.0% 70.0% 80.0%
Oligotrophic (<=0.9 m)
Mesotrophic (>0.9-2.3 m)
Eutrophic (>2.3-4.6 m)
Hypereutrophic (>4.6 m)
Shallow - Clear to Bottom
Percent of Lakes
Michigan
National
UMW Ecoregion
Trophic Status - Total Phosphorus
0.0% 10.0% 20.0% 30.0% 40.0% 50.0% 60.0% 70.0% 80.0%
Oligotrophic (<=10 ug/L)
Mesotrophic (>10-20 ug/L)
Eutrophic (>20-50 ug/L)
Hypereutrophic (>50 ug/L)
Percent of Lakes
Michigan
National
UMW Ecoregion

15
The trophic status distributions are inconsistent based on the individual indicators. For the chlorophyll-a indicator, Michigan’s lake trophic condition distribution is 7% oligotrophic, 67% mesotrophic, 21% eutrophic, and 3% hypereutrophic. Based on TP, the trophic distribution is 54% oligotrophic, 28% mesotrophic, 17% eutrophic, and 0.4% hypereutrophic. The trophic status split based on Secchi transparency is 6.5% oligotrophic, 35% mesotrophic, 32.5% eutrophic, 12% hypereutrophic, and 14% undetermined (shallow-clear to bottom). The TP derived trophic condition distribution for Michigan lakes is greatly skewed to the oligotrophic side of the trophic continuum. This pattern is also found in the TP derived trophic status for the UMW ecoregion lakes but to a lesser degree. These results may be a consequence of the differences in the sampling and sample handling methodology incorporated in the NLA Survey as compared to Michigan’s and other UMW state’s lake sampling protocols. The NLA TP samples were not acidified upon collection and the results for many of these samples (50%) were flagged with holding time codes in the dataset. Chemical Condition of Michigan Lakes Patterns of lake water chemistry have been described in previous monitoring efforts but only for targeted inland lake subpopulations, such as public access lakes (MDNR, 1982; Fuller and Taricska, 2012). The 2007 NLA statistical survey design provides a good basis for describing the typical range of constituents and interrelationships statewide in all Michigan lakes 4 hectares (10 acres) or larger in size and allows for ecoregion-based comparison and descriptions. Percentile distributions, based on weighted data, were developed for the various physical and chemical parameters measured at the mid-lake (deep basin) index site in the 2007 NLA survey. The distributions are presented in tabular format on a statewide, UWM ecoregion, and national basis and distribution patterns are illustrated below. The statistical summary tables are grouped to include: (a) lake morphometry, pH, transparency, color, and organic carbon (Table 4); (b) nutrients and chlorophyll-a (Table 5); and (c) cations and anions (Table 6).

16
Table 4. Michigan NLA data summary – lake morphometry (unweighted) and pH, ANC, transparency, water coloration, and organic carbon (weighted).
Est. Mean Index Site pH- Region Stats Depth Depth Field ANC Secchi Turbidity Color TOC DOC
(m) (m) (SU) (ueq/L) (m) (NTU) (PCU) (mg/L) (mg/L)
Michigan mean 2.8 8.3 7.92 1990 2.3 1.95 17.1 8.26 8.01 (n=50) std dev 1.7 5.2 0.71 1150 1.67 1.46 15.6 4.37 4.22
max 7.0 21.1 9.43 4310 7.95 9.38 65 20.2 19.4 75th 3.9 11.6 8.3 2850 3.52 2.39 20 9.44 9.4 50th 2.5 7.4 8 2250 2.14 1.33 12 6.78 6.34 25th 1.4 4.2 7.6 865 0.8 1.02 7.13 5.43 5.41 min 0.3 1.0 6 12.7 0.58 0.60 0.1 2.38 2.17
UMW mean 3.2 9.5 7.84 1820 1.96 3.53 21.5 9.7 9.07 (n=148) std dev 2.26 6.79 1.1 1370 1.4 9.3 24.3 5.32 4.85
max 11.4 34.1 9.6 5940 7.95 193 125 36.2 27.4 75th 4.4 13.2 8.5 2960 2.61 3.47 26 13.5 12.4 50th 2.6 7.7 8 1640 2.05 1.74 12 8.81 8.29 25th 1.5 4.5 7.3 469 0.85 1.16 9 5.87 5.65 min 0.3 1.0 5.35 12.7 0.1 0.60 0.1 2.04 2.05
Nation mean 3.1 9.4 7.76 2280 1.81 7.98 21.7 10.2 9.29 (n=1028) std dev 3.51 10.53 1.32 3910 1.71 19.5 23 10.7 9.61
max 32.3 97.0 10.3 91600 36.7 574 165 325 291 75th 3.9 11.6 8.52 2860 2.49 8.27 26 13.4 11.8 50th 1.9 5.8 8 1210 1.21 3.05 14.8 6.99 6.51
25th 0.9 2.8 7.2 295 0.674 1.41 8.89 4.32 4.08 min 0.2 0.5 4.1 -63 0.04 0.24 0.1 0.37 0.34

17
Table 5. NLA Michigan data summary – nutrients and chlorophyll-a (weighted).
Region Stats TP TN NO2+NO3 NO3-N NH4-N CHL-a (ug/L) (ug/L) (mg/L) (mg/L) (mg/L) (ug/L)
Michigan mean 13.1 660 0.095 0.093 0.021 5.38 (n=50) std dev 10.5 508 0.504 0.465 0.014 4.92
max 82 3440 3.100 2.860 0.184 30.7 75th 16 721 0.005 0.005 0.026 5.05 50th 8 563 0.005 0.005 0.019 3.32 25th 6 468 0.005 0.005 0.013 2.31 min 3 101 0.005 0.005 0.005 1.1
UMW mean 23.8 759 0.061 0.073 0.029 9.77 (n=148) std dev 35.8 497 0.247 0.246 0.038 21.5
max 1180 15600 3.100 2.860 0.918 936 75th 33 1010 0.005 0.005 0.032 9.44 50th 15 650 0.005 0.005 0.021 4.48 25th 7 492 0.005 0.005 0.013 2.88 min 1 101 0.005 0.005 0.005 1.1
Nation mean 78.7 1010 0.043 0.049 0.038 23.8 (n=1028) std dev 171 1270 0.213 0.205 0.080 47.6
max 4680 25700 6.190 5.410 1.710 936 75th 77.1 1160 0.005 0.005 0.033 20.9 50th 20 586 0.005 0.005 0.019 7.1
25th 10 383 0.005 0.005 0.011 3.17 min 1 5 0.005 0.005 0.005 0.067

18
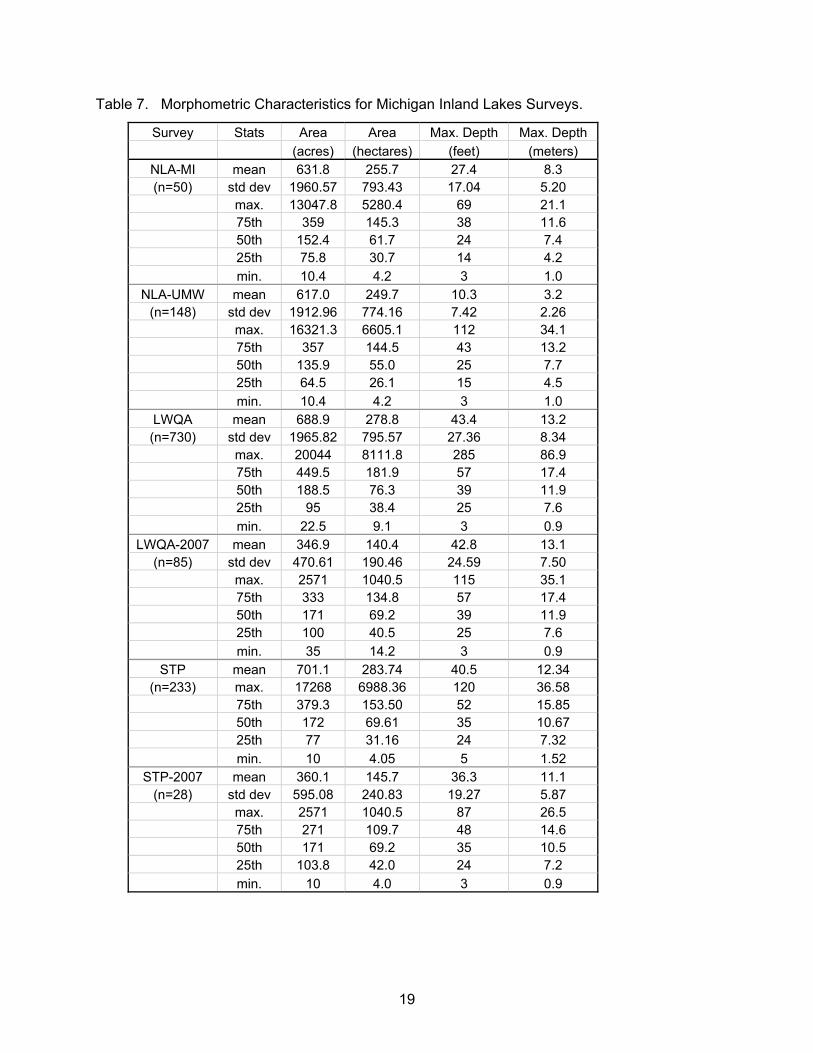
Table 6. Michigan NLA data summary – cations, anions, and related constituents (weighted). Morphometric Characteristics of Michigan Inland Lakes The NLA stratified random design allowed for lakes in five size class categories, as well as spatial distribution across the lower 48 states and 9 aggregated Omernik Level 3 ecoregions to be randomly selected for the survey (USEPA, 2006). Absent this stratification process the NLA would have been represented primarily by very small lakes in lake-rich areas of the country, including Michigan. The percentile distribution of surface area and maximum depth for Michigan’s 50 random lakes as part of the NLA survey are similar to all lakes in the UMW ecoregion (Table 7). When compared to the targeted public access lakes sampled in the MDEQ LWQA monitoring program and the stratified random-selected lakes in the MDNR STP, Michigan’s NLA lakes are generally smaller in surface area and shallower in terms of maximum depth. Both datasets are biased toward larger lakes as compared to the overall population of Michigan lakes 4 hectares (10 acres) or larger in size.
Region Stats Sp. Cond Ca Mg Na K Si SO4 Cl (uS/cm) (mg/L) (mg/L) (mg/L) (mg/L) (mg/L) (mg/L) (mg/L)
Michigan mean 309 26.8 12.6 13.9 1.0 4.5 12.9 28.5 (n=50) std dev 215 16.2 8.4 18.4 0.7 3.9 11.1 36.8
max 738 66.6 26.9 63.9 3.5 27.8 61.4 129 75th 449 35.2 19.1 17.7 1.5 7.7 20.5 32.5 50th 280 29.2 12.2 5.5 0.9 3.4 8.8 10.6 25th 110 13.7 4.6 1.5 0.4 1.5 4.3 2.7 min 14.3 0.9 0.3 0.2 0.1 0.0 0.9 0.2
UMW mean 220 20.6 11.2 5.8 1.5 6.0 7.6 10.7 (n=148) std dev 173 14.7 10.4 11.6 1.6 6.8 10.1 22.3
max 1520 72.3 70.0 233 16.5 34.1 76.8 338 75th 327 30.4 20.0 4.5 1.6 7.7 9.3 8.8 50th 189 19.4 6.7 2.1 0.9 3.6 4.9 2.4 25th 61.2 6.3 2.2 1.1 0.5 0.8 1.9 0.4 min 13.9 0.9 0.3 0.2 0.1 0.0 0.1 0.1
Nation mean 757 24.3 27.7 106.0 8.3 7.7 128 153 (n=1028) std dev 3400 34.9 98.5 681 32.5 9.3 623 1420
max 50600 486 2470 16700 1410 65.3 40100 15800 75th 407 31.3 20.0 13.4 4.2 10.1 17.6 16.7 50th 171 14.5 4.7 4.6 1.6 4.5 5.2 5.7
25th 60.4 5.0 1.6 2.0 0.7 1.3 2.5 1.6 min 4.35 0.2 0.1 0.2 0.1 0.0 0.1 0.1
19
Table 7. Morphometric Characteristics for Michigan Inland Lakes Surveys.
Survey Stats Area Area Max. Depth Max. Depth (acres) (hectares) (feet) (meters)
NLA-MI mean 631.8 255.7 27.4 8.3 (n=50) std dev 1960.57 793.43 17.04 5.20
max. 13047.8 5280.4 69 21.1 75th 359 145.3 38 11.6 50th 152.4 61.7 24 7.4 25th 75.8 30.7 14 4.2 min. 10.4 4.2 3 1.0
NLA-UMW mean 617.0 249.7 10.3 3.2 (n=148) std dev 1912.96 774.16 7.42 2.26
max. 16321.3 6605.1 112 34.1 75th 357 144.5 43 13.2 50th 135.9 55.0 25 7.7 25th 64.5 26.1 15 4.5 min. 10.4 4.2 3 1.0
LWQA mean 688.9 278.8 43.4 13.2 (n=730) std dev 1965.82 795.57 27.36 8.34
max. 20044 8111.8 285 86.9 75th 449.5 181.9 57 17.4 50th 188.5 76.3 39 11.9 25th 95 38.4 25 7.6 min. 22.5 9.1 3 0.9
LWQA-2007 mean 346.9 140.4 42.8 13.1 (n=85) std dev 470.61 190.46 24.59 7.50
max. 2571 1040.5 115 35.1 75th 333 134.8 57 17.4 50th 171 69.2 39 11.9 25th 100 40.5 25 7.6 min. 35 14.2 3 0.9
STP mean 701.1 283.74 40.5 12.34 (n=233) max. 17268 6988.36 120 36.58
75th 379.3 153.50 52 15.85 50th 172 69.61 35 10.67 25th 77 31.16 24 7.32 min. 10 4.05 5 1.52
STP-2007 mean 360.1 145.7 36.3 11.1 (n=28) std dev 595.08 240.83 19.27 5.87
max. 2571 1040.5 87 26.5 75th 271 109.7 48 14.6 50th 171 69.2 35 10.5 25th 103.8 42.0 24 7.2 min. 10 4.0 3 0.9
20
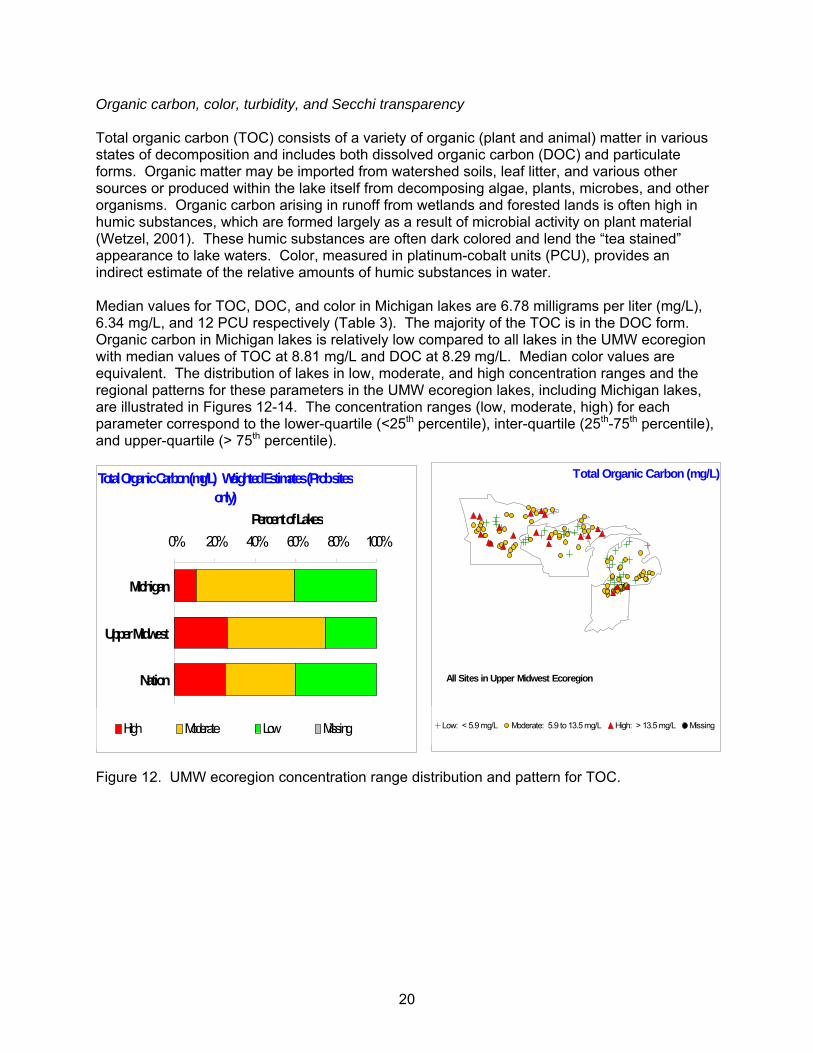
Organic carbon, color, turbidity, and Secchi transparency Total organic carbon (TOC) consists of a variety of organic (plant and animal) matter in various states of decomposition and includes both dissolved organic carbon (DOC) and particulate forms. Organic matter may be imported from watershed soils, leaf litter, and various other sources or produced within the lake itself from decomposing algae, plants, microbes, and other organisms. Organic carbon arising in runoff from wetlands and forested lands is often high in humic substances, which are formed largely as a result of microbial activity on plant material (Wetzel, 2001). These humic substances are often dark colored and lend the “tea stained” appearance to lake waters. Color, measured in platinum-cobalt units (PCU), provides an indirect estimate of the relative amounts of humic substances in water. Median values for TOC, DOC, and color in Michigan lakes are 6.78 milligrams per liter (mg/L), 6.34 mg/L, and 12 PCU respectively (Table 3). The majority of the TOC is in the DOC form. Organic carbon in Michigan lakes is relatively low compared to all lakes in the UMW ecoregion with median values of TOC at 8.81 mg/L and DOC at 8.29 mg/L. Median color values are equivalent. The distribution of lakes in low, moderate, and high concentration ranges and the regional patterns for these parameters in the UMW ecoregion lakes, including Michigan lakes, are illustrated in Figures 12-14. The concentration ranges (low, moderate, high) for each parameter correspond to the lower-quartile (<25th percentile), inter-quartile (25th-75th percentile), and upper-quartile (> 75th percentile). Figure 12. UMW ecoregion concentration range distribution and pattern for TOC.
Total Organic Carbon (mg/L) Weighted Estimates (Prob sites only)
0% 20% 40% 60% 80% 100%
Michigan
Upper Midwest
Nation
Percent of Lakes
High Moderate Low Missing
Total Organic Carbon (mg/L)
All Sites in Upper Midwest Ecoregion
Low: < 5.9 mg/L Moderate: 5.9 to 13.5 mg/L High: > 13.5 mg/L Missing

21
Figure 13. UMW ecoregion concentration range distribution and pattern for DOC. Figure 14. UMW ecoregion concentration range distribution and pattern for Color. Algal biomass (as measured by chlorophyll-a) is most often the primary determinant of Secchi transparency in lakes in the UMW ecoregion, including Michigan lakes. However, water color and organic carbon can play a role at high color levels (i.e., > 30 PCU) and TOC/DOC (i.e., > 15 mg/L) (Heiskary and Lindon, 2010). The median value for Secchi transparency in Michigan lakes is 2.14 meters, which is similar to the median transparency of all lakes in the UMW ecoregion (median = 2.05 meters). However, the interquartile range (25th-75th percentile) is less, with a greater percentage of Michigan lakes with higher transparency compared to all lakes in the UMW ecoregion. Turbidity is generally less in Michigan lakes (median = 1.33 Nessler Turbidity Units [NTU]) as compared to all UMW ecoregion lakes (median = 1.74 NTU). The distribution of lakes in low, moderate, and high concentration ranges and the
Color (PCU) Weighted Estimates (Prob sites only)
0% 20% 40% 60% 80% 100%
Michigan
Upper Midwest
Nation
Percent of Lakes
High Moderate Low Missing
Color (PCU)
All Sites in Upper Midwest Ecoregion
Low: < 9 PCU Moderate: 9 to 26 PCU High: > 26 PCU Missing
Dissolved Organic Carbon (mg/L)
All Sites in Upper Midwest Ecoregion
Low: < 5.65 mg/L Moderate: 5.65 to 12.4 mg/L High: > 12.4 mg/L Missing
Dissolved Organic Carbon (mg/L) Weighted Estimates (Prob sites only)
0% 20% 40% 60% 80% 100%
Michigan
Upper Midwest
Nation
Percent of Lakes
High Moderate Low Missing
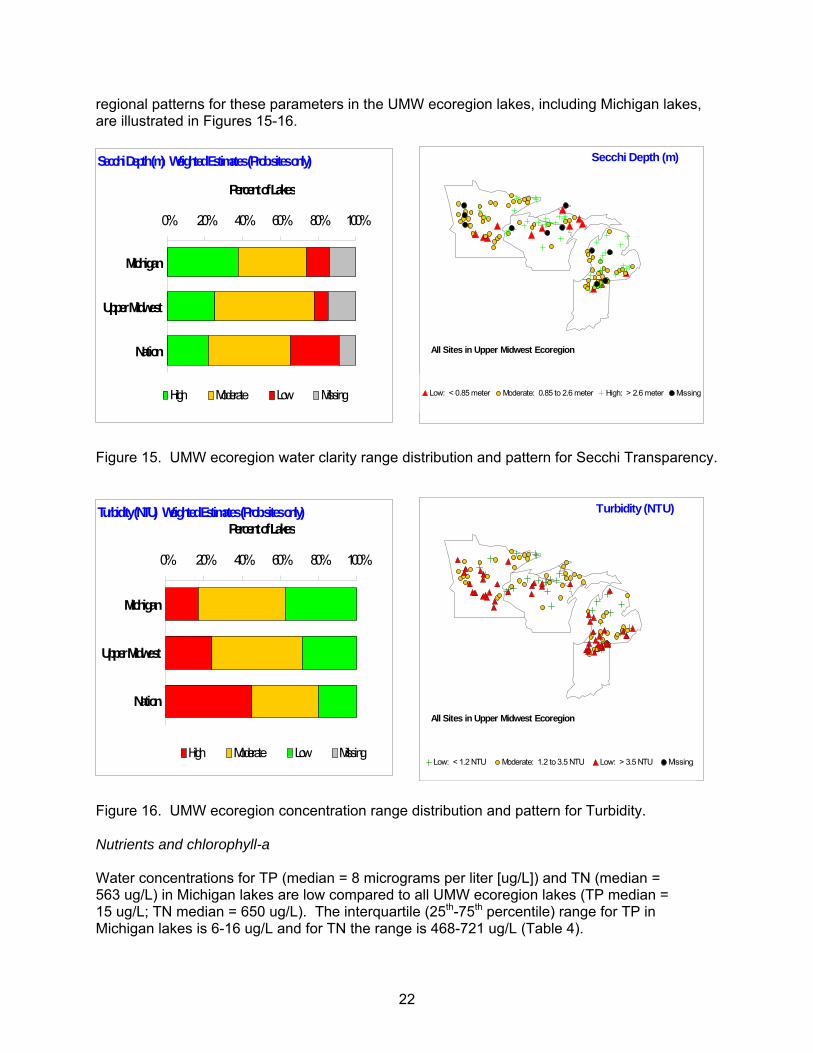
22
regional patterns for these parameters in the UMW ecoregion lakes, including Michigan lakes, are illustrated in Figures 15-16. Figure 15. UMW ecoregion water clarity range distribution and pattern for Secchi Transparency. Figure 16. UMW ecoregion concentration range distribution and pattern for Turbidity. Nutrients and chlorophyll-a Water concentrations for TP (median = 8 micrograms per liter [ug/L]) and TN (median = 563 ug/L) in Michigan lakes are low compared to all UMW ecoregion lakes (TP median = 15 ug/L; TN median = 650 ug/L). The interquartile (25th-75th percentile) range for TP in Michigan lakes is 6-16 ug/L and for TN the range is 468-721 ug/L (Table 4).
Turbidity (NTU) Weighted Estimates (Prob sites only)
0% 20% 40% 60% 80% 100%
Michigan
Upper Midwest
Nation
Percent of Lakes
High Moderate Low Missing
Turbidity (NTU)
All Sites in Upper Midwest Ecoregion
Low: < 1.2 NTU Moderate: 1.2 to 3.5 NTU Low: > 3.5 NTU Missing
Secchi Depth (m) Weighted Estimates (Prob sites only)
0% 20% 40% 60% 80% 100%
Michigan
Upper Midwest
Nation
Percent of Lakes
High Moderate Low Missing
Secchi Depth (m)
All Sites in Upper Midwest Ecoregion
Low: < 0.85 meter Moderate: 0.85 to 2.6 meter High: > 2.6 meter Missing

23
Chlorophyll-a concentrations are also lower in Michigan lakes (median = 3.32 ug/L) as compared to all UMW ecoregion lakes (median = 4.48 ug/L). The interquartile range for chlorophyll-a in Michigan lakes is small, 2.31-5.05 ug/L (Table 4). Regional patterns in nutrients and chlorophyll-a have long been recognized for Michigan lakes (MDNR, 1982). The NLA data serve to reinforce these patterns and the interrelationships among these variables. The transition for more phosphorus-rich to phosphorus-poor lakes from southern to northern Michigan’s Lower Peninsula is evident in the NLA data as well. Michigan’s Upper Peninsula lakes show a more variable nutrient pattern. The concentration range distributions and regional patterns for TP, TN, and chlorophyll-a in the UMW ecoregion lakes, including Michigan lakes, are illustrated in Figures 17-19. The concentration ranges (low, moderate, high) for these parameters correspond to the Michigan inland lakes trophic state index thresholds (Table 2). Figure 17. UMW ecoregion concentration range distribution and pattern for TP.
Total Phosphorus (ugP/L) Weighted Estimates (Prob sites only)
0% 20% 40% 60% 80% 100%
Michigan
Upper Midwest
Nation
Percent of Lakes
Excessive High Moderate Low Missing
Total Phosphorus (ugP/L)
All Sites in Upper Midwest Ecoregion
Low: < 10 ugP/L Moderate: 10 to <20 ugP/L
High: 20 to 50 ugP/L Excessive: > 50 ugP/L
Missing

24
Figure 18. UMW ecoregion trophic concentration range distribution and pattern for TN. Figure 19. UMW ecoregion trophic concentration range distribution and pattern for Chlorophyll-a. Chemical cations and anions The chemical composition of a lake is fundamentally a function of its climate and its basin geology (http://waterontheweb.org/). The ion balance for typical freshwater lakes is usually dominated by four major cations (in order of dominance): calcium (Ca+2), magnesium (Mg+2), sodium (Na+), and potassium (K+) and the major balancing anions (in order of dominance): carbonates (CO3
-2 and HCO3-), sulfate (SO4
-2), and chloride (Cl-). The concentrations of these ions generally constitute over 99% of the total salinity (Wetzel, 2001). Silica occurs in lesser abundance in natural waters and along with sulfate and iron is greatly influenced by biotic
Total Nitrogen (ugN/L) Weighted Estimates (Prob sites only)
0% 20% 40% 60% 80% 100%
Michigan
Upper Midwest
Nation
Percent of Lakes
Excessive High Moderate Low Missing
Total Nitrogen (ugN/L)
All Sites in Upper Midwest EcoregionLow: < 320 ugN/L Moderate: 320 to <640 ugN/L
High: 640 to 1575 ugN/L Excessive: > 1575 ugN/L
Missing
Chlorophyll-a (ug/L) Weighted Estimates (Prob sites only)
0% 20% 40% 60% 80% 100%
Michigan
Upper Midwest
Nation
Percent of Lakes
Excessive High Moderate Low Missing
Chlorophyll-a (ug/L)
All Sites in Upper Midwest Ecoregion
Low: < 2.2 ug/L Moderate: 2.2 to <6 ug/L High: 6 to 22 ug/L
Excessive: > 22 ug/L Missing

25
processes. Chloride is usually not dominant in open lake systems, but pollution sources of chlorides can modify natural concentrations greatly (Wetzel, 2001). The specific conductance of lake water is the measure of the resistance of a solution to electronic flow and in typical carbonate/bicarbonate-type lake water is closely proportional to concentrations of the major ions. Concentrations and forms of Ca, K, SO4, and inorganic carbon are highly dynamic and are influenced markedly by metabolic activities (Wetzel, 2001). Calcium influences growth and population dynamics of freshwater biota, with Ca-deficient soft-water (<10 mg/L) and Ca-rich hard-water (>20 mg/L) species often being referenced. In contrast, concentrations of Mg, Na, and K are relatively conservative and undergo relatively minor changes from biotic utilization (Wetzel, 2001). Magnesium is essential for chlorophyll-bearing plants and algae but Mg demand is often minor compared to its general availability (Wetzel, 2001). Sodium has been noted to be important for blue-green algal growth with reference to 4 mg/L as required for near optimal growth in several species and maximal growth at concentrations up to 40 mg/L (Wetzel, 2001). A typical ion balance for freshwater lakes is: HCO3
- - 73%, Ca+2 – 63%, Mg+2 – 17%, SO4-2 – 16%, Na+ – 15%, Cl- - 10%, and
K+ - 4% (http://waterontheweb.org/). Based on the NLA data, Ca+2 and Mg+2 are the dominant cations and SO4
-2 and Cl- along with HCO3- are the dominant anions in Michigan lakes (Table 4).
The distribution of lakes in low, moderate, and high concentration ranges and the regional patterns for specific conductance and the major cations and anions in the UMW ecoregion lakes, including Michigan lakes, are illustrated in Figures 20-27. The concentration ranges (low, moderate, high) for each parameter correspond to the lower-quartile (<25th percentile), inter-quartile (25th-75th percentile), and upper-quartile (> 75th percentile). Figure 20. UMW ecoregion concentration range distribution and pattern for Specific Conductance.
Conductivity (uS/cm @ 25 C) Weighted Estimates (Prob sites only)
0% 20% 40% 60% 80% 100%
Michigan
Upper Midwest
Nation
Percent of Lakes
High Moderate Low Missing
Conductivity (uS/cm @ 25 C)
All Sites in Upper Midwest Ecoregion
Low: < 61 uS/cm @ 25 C Moderate: 61 to 327 uS/cm @ 25 C
High: > 327 uS/cm @ 25 C Missing

26
Figure 21. UMW ecoregion concentration range distribution and pattern for Calcium. Figure 22. UMW ecoregion concentration range distribution and pattern for Magnesium.
Calcium (mg/L) Weighted Estimates
0% 20% 40% 60% 80% 100%
Michigan
Upper Midwest
Nation
Percent of Lakes
High Moderate Low Missing
Calcium (mg/L)
All Sites in Upper Midwest Ecoregion
Low:< 6.3 mg/L Moderate:6.3 to 30.4 mg/L High:> 30.4 mg/L Missing
Magnesium (mg/L) Weighted Estimates
0% 20% 40% 60% 80% 100%
Michigan
Upper Midwest
Nation
Percent of Lakes
High Moderate Low Missing
Magnesium (mg/L)
All Sites in Upper Midwest Ecoregion
Low:< 2.2 mg/L Moderate:2.2 to 20 mg/L High:> 20 mg/L Missing

27
Figure 23. UMW ecoregion concentration range distribution and pattern for Sodium. Figure 24. UMW ecoregion concentration range distribution and pattern for Potassium.
Sodium (mg/L) Weighted Estimates
0% 20% 40% 60% 80% 100%
Michigan
Upper Midwest
Nation
Percent of Lakes
High Moderate Low Missing
Sodium (mg/L)
All Sites in Upper Midwest Ecoregion
Low:< 1.1 mg/L Moderate:1.1 to 4.5 mg/L High:> 4.5 mg/L Missing
Potassium (mg/L) Weighted Estimates
0% 20% 40% 60% 80% 100%
Michigan
Upper Midwest
Nation
Percent of Lakes
High Moderate Low Missing
Potassium (mg/L)
All Sites in Upper Midwest Ecoregion
Low:< 0.5 mg/L Moderate:0.5 to 1.6 mg/L High:> 1.6 mg/L Missing

28
Figure 25. UMW ecoregion concentration range distribution and pattern for Silica. Figure 26. UMW ecoregion concentration range distribution and pattern for Sulfate.
Sulfate (mgSO4/L) Weighted Estimates
0% 20% 40% 60% 80% 100%
Michigan
Upper Midwest
Nation
Percent of Lakes
High Moderate Low Missing
Sulfate (mgSO4/L)
All Sites in Upper Midwest Ecoregion
Low:< 1.9 mgSO4/L Moderate:1.9 to 9.3 mgSO4/L
High:> 9.3 mgSO4/L Missing
Silica (mgSiO2/L) Weighted Estimates
0% 20% 40% 60% 80% 100%
Michigan
Upper Midwest
Nation
Percent of Lakes
High Moderate Low Missing
Silica (mgSiO2/L)
All Sites in Upper Midwest Ecoregion
Low:< 0.8 mgSiO2/L Moderate:0.8 to 7.7 mgSiO2/L
High:> 7.7 mgSiO2/L Missing

29
Figure 27. UMW ecoregion interquartile distribution and pattern for Chloride. Water concentrations for chloride (median = 10.6 ug/L), sodium (medium = 5.5 ug/L) and sulfate (median = 8.8 ug/L) in Michigan lakes are elevated as compared to all UMW ecoregion lakes (Cl median = 2.4 ug/L; Na median = 2.1 ug/L; SO4 median = 4.9 ug/L). The interquartile (25th-75th percentile) range for chloride in Michigan lakes is 2.7-32.5 ug/L while the interquartile ranges for sodium and sulfate are 1.5-17.7 ug/L and 4.3-20.5 ug/L, respectively (Table 5). Elevated concentrations for these ions are associated with areas of higher population densities, especially in southern Michigan. ANC and pH Alkalinity is traditionally the term that referred to the buffering capacity of the carbonate-bicarbonate system in water and is now used interchangeably with ANC (Wetzel, 2001). Bicarbonates and carbonates provide most of this buffering capacity in Michigan waters. Alkalinity is often expressed as mg/L CaCO3 but is more accurately expressed as equivalents per liter (1 mg/L = 20 microequivalence per liter [ueq/L] or 0.02 milliequivalence per liter [meq/L]). Michigan’s dominant limestone geology in the Lower Peninsula and the eastern Upper Peninsula contributes to the vast majority of Michigan lakes being carbonate-bicarbonate dominant and lakes in the western Upper Peninsula having lower alkalinity and thus lesser buffering capacity. The carbonate-bicarbonate buffering system highly influences the pH in Michigan’s lakes. The concentration range (low, moderate, high) distribution and regional pattern for ANC is illustrated in Figure 28. The concentration ranges (low, moderate, high) for each parameter correspond to the lower-quartile (<25th percentile), inter-quartile (25th-75th percentile), and upper-quartile (> 75th percentile). The distribution and regional pattern for pH is illustrated in Figure 29 with the threshold values set at 6.5 and 9.0 standard units (S.U.); the Michigan water quality standard range for pH (hydrogen ion concentration range).
Chloride (mg/L) Weighted Estimates
0% 20% 40% 60% 80% 100%
Michigan
Upper Midwest
Nation
Percent of Lakes
High Moderate Low Missing
Chloride (mg/L)
All Sites in Upper Midwest Ecoregion
Low:< 0.4 mg/L Moderate:0.4 to 8.8 mg/L High:> 8.8 mg/L Missing

30
Figure 28. UMW ecoregion concentration range distribution and pattern for ANC. Figure 29. UMW ecoregion trophic status criteria distribution and pattern for pH. NES Lake Summary Between 1972 and 1976, the USEPA conducted the NES (USEPA, 1974). This study was designed to assess the trophic condition (defined as nutrient enrichment) of lakes influenced by domestic wastewater treatment plants (WWTPs). While national in scope, the NES lake selection design was unlike the NLA in that it was not probability-based; rather it targeted a specific set of 800 wastewater impacted lakes. As part of the 2007 NLA, a subset of 200 randomly selected NES lakes was resampled to allow for a statistical assessment for that specific population of lakes. Although some design
Acid Neutralizing Capacity (ueq/L) Weighted Estimates
0% 20% 40% 60% 80% 100%
Michigan
Upper Midwest
Nation
Percent of Lakes
Low Moderate High Missing
Acid Neutralizing Capacity (ueq/L)
All Sites in Upper Midwest Ecoregion
High: > 2960 ueq/L Moderate:469 to 2960 ueq/L Low: < 469 ueq/L Missing
pH units Weighted Estimates
0% 20% 40% 60% 80% 100%
Michigan
Upper Midwest
Nation
Percent of Lakes
High Moderate Low Missing
pH units
All Sites in Upper Midwest Ecoregion
Low:< 6.5 pH units Moderate:6.5 to 9 pH units High:> 9 pH units Missing

31
differences between the two studies are recognized, the NLA analysts looked at changes in the NES lakes over the 30-plus years by comparing concentration levels of key indicators and by examining trophic status. Comparing historical (circa 1972) to current (2007) TP levels in the NES lakes, they found 50% decreased, 26% increased, and 24% had no change. Trophic status based on chlorophyll-a also changed with trophic status improving in 26% (184) of the lakes, remaining unchanged in over half (51% or 408 lakes), and degrading in 23% (208) of the NES lakes (USEPA, 2009). Michigan had eight NES lakes included in the 2007 NLA. Pertinent water quality data for these lakes from the NLA are summarized in Table 8. Changes in point source discharges and TP levels since the NES are noted in Table 9. Table 8. Michigan’s NES lakes included in 2007 NLA. Table 9. Michigan NES lakes WWTP discharge status and in-lake TP changes. Based on a simple comparison of trophic state indicators (TP, chlorophyll-a, and transparency) represented as Carlson Trophic State Index (TSI) values, two of the eight lakes (Palmer and Brighton) exhibited trophic condition improvement for two of the indicators (Figures 30-32). The
Lake Mean Secchi SpecArea Sample Depth TP TN Chl-a Depth Cond Na SO4 Cl
(hectars) Date (meters) (ug/L) (ug/L) (ug/L) (meters) (umhos) (mg/L) (mg/L) (mg/L)NLA06608-0363 Palmer Lake ST JOSEPH SMNIDP 291.7 7/21/2007 4.3 18 567 11.7 1.70 475 6.8 61.4 22.4NLA06608-0463 Belleville Lake WAYNE SMNIDP 272.8 8/19/2007 1.9 82 1031 30.7 0.58 716.6 41.9 39.1 101.7NLA06608-0938 Muskegon Lake MUSKEGON SMNIDP 1889.3 8/7/2007 6.3 34 519 11.9 1.46 387.7 17.6 20.3 24.4NLA06608-1014 Lake Chemung LIVINGSTON SMNIDP 120.1 9/13/2007 7.0 15 568 9.8 4.20 683.3 58.0 19.3 108.2NLA06608-1130 Thornapple Lake BARRY SMNIDP 177.5 8/21/2007 3.1 65 634 23.7 1.08 555 9.4 42.9 24.6NLA06608-1487 Ford Lake WASHTENAW SMNIDP 384.9 8/20/2007 3.3 61 1071 14.6 1.93 737.5 44.4 43.1 111.6NLA06608-1626 Pere Marquette Lake MASON SMNIDP 238.2 8/8/2007 4.3 30 623 14.8 1.95 390.6 10.6 20.4 22.9NLA06608-1782 Lake Brighton LIVINGSTON SMNIDP 63.8 9/13/2007 1.0 32 606 17.4 0.95 696 54.6 15.3 110.4
NLA Site ID Lake Name County Ecoregion
NES TP NLA TPug/L ug/L
(1972) (2007)NLA06608-0363 Palmer Lake ST JOSEPH 123 18 Discharge from Bronson WWTP, secondary treatment upgrade in 1973, advanced treatment in 1994NLA06608-0463 Belleville Lake WAYNE 118 82 Discharge from Ypsilanti Township WWTP removed. Indirect input from Ann Arbor, Ypsilanti, Scio-Webster,
and Dexter WWTP; TMDL established in 2004NLA06608-0938 Muskegon Lake MUSKEGON 48 34 Muskegon and Roosevelt Park WWSL and land disposal system within watershedNLA06608-1014 Lake Chemung LIVINGSTON 15 15 No WWTP discharge to lake, riparian property septic tank/drainfield treatment systemsNLA06608-1130 Thornapple Lake BARRY 46 65 Discharge from Nashville WWTP, WWSL and spray irrigation replacement system in 1981NLA06608-1487 Ford Lake WASHTENAW 71 61 Discharge from Ann Arbor, Dexter, Scio-Webster, and Ypsilanti WWTP; TMDL established in 2004NLA06608-1626 Pere Marquette Lake MASON 23 30 Discharge from Ludington WWTP and Scottville and Custer WWSLNLA06608-1782 Lake Brighton LIVINGSTON 642 32 Discharge from Brighton WWTP, phosphorus removal since 1970, point source discharge elimination in 1988
NLA Site ID Lake Name CountyPoint Source Discharge Status

32
other six lakes did not show a shift in trophic conditions. Bellville, Ford, and Thornapple are man-made lake reservoirs with large watersheds. Muskegon and Pere Marquette are drowned river mouth lakes with outlets to Lake Michigan. Chemung is a natural lake with no WWTP discharge, but may be influenced by the individual septic tanks of the shoreline dwellings. It should be noted that the 1972 NES chlorophyll-a data may have an error up to ± 20% because of instrumentation problems during the 1972 sampling. Figure 30. Long-term Trophic Condition Changes in Michigan NLA/NES Lakes: Carlson TSI-TP. Figure 31. Long-term Trophic Condition Changes in Michigan NLA/NES Lakes – Carlson TSI-Chlorophyll-a.
H y p e re u tro p h ic
M e s o t ro ph ic
O l ig o tro p h ic
E u tro p h ic
0
1 0
2 0
3 0
4 0
5 0
6 0
7 0
8 0
9 0
10 0
L o n g- P a lm e rL a k e
B e lle v ille La k e M u s k e g onL a k e
L a k eC h e m u n g
T h o rn a p p leLa k e
F o rd L a k e P ereM a r q ue t te
L ak e
La k e B rig h to n
Car
lson
Tro
phic
Sta
te In
dex
N E S - T S I_ C H L N LA - T S I_C H L
H y p e r e u tr o p h i c
M e s o tr o p h i c
O l i g o t r o p h ic
E u t r o p h ic
0
1 0
2 0
3 0
4 0
5 0
6 0
7 0
8 0
9 0
1 0 0
L o n g - P a lm e rL a k e
B e l le v i l le L a k e M u s k e g o nL a k e
L a k eC h e m u n g
T h o r n a p p leL a k e
F o r d L a k e P e r eM a r q u e t te
L a k e
L a k e B r ig h to n
Car
lson
Tro
phic
Sta
te In
dex
N E S - T S I _ T P N L A -T S I_ T P

33
Figure 32. Long-term Trophic Condition Changes in Michigan NLA/NES Lakes – Carlson TSI-Transparency. Figure 33 illustrates historical phosphorus levels for Brighton, Palmer, Thornapple, and Chemung as examples of long-term changes or trends in the NES lakes. Palmer Lake exhibited significant reduction in TP after the Bronson WWTP secondary treatment upgrade in 1973. Lake Brighton TP levels dropped substantially after phosphorus removal was established at the Brighton WWTP in 1970 and the outfall was removed and relocated downstream in 1988. Lake Chemung does not receive direct treated domestic wastewater input and it exhibits consistent low TP levels over time. Thornapple Lake, a reservoir lake with a large watershed, shows variable TP levels but a decreasing trend since the Nashville WWTP was replaced with a Wastewater Sewage Lagoon (WWSL) and spray irrigation system in 1981. These examples demonstrate the value of a long-term data record to assess changes or trends and the lake-specific response to point source nutrient load reductions.
H y p e re u t ro p h ic
M e s ot ro p h ic
O ligo t ro p h ic
E u t ro p h ic
0
1 0
2 0
3 0
4 0
5 0
6 0
7 0
8 0
9 0
10 0
L o n g-P a lm e rL a ke
B e lle v ille L ak e M u s ke g o nLa ke
L ak eC he m u n g
Th o rn ap p leL a k e
Fo rd La k e P e reM arq u e tte
L a k e
L a ke B r ig h to n
Car
lson
Tro
phic
Sta
te In
dex
N E S -T S I_ S D N L A -T S I_ S D

34
Figure 33. Long-term TP levels in Palmer, Brighton, Chemung, and Thornapple Lakes (note: different scales used for Total Phosporus [y-axis]) Comparison of 2007 NLA Data with MDEQ and MDNR Data As indicated previously, Michigan’s state lake monitoring programs were ongoing at the time of the 2007 NLA Survey, specifically the MDEQ LWQA monitoring program and the MDNR STP. Additionally, the MDEQ CLMP, Michigan’s statewide volunteer lakes monitoring program, annually collects trophic state indicator data on over 200 lakes. The MDEQ and U.S. Geological Survey-Michigan Water Science Center jointly redesigned and implemented the LWQA monitoring program in 2001 (MDEQ, 2001). Under the current program, a set of 730 public access lakes larger than 25 acres in surface area were targeted for sampling by 2010. During 2007, 85 lakes were sampled as part of the LWQA monitoring program. An interim five-year project report was published in 2008 (Fuller and Minnerick, 2008) with a final report targeted for early 2012 (Fuller and Taricska, 2012). The MDNR, Fisheries Division, implemented the STP in 2002 (Hayes et al., 2003). The objective of the STP is to collect and synthesize data needed by fisheries managers, policy-makers, and the public to maintain an inventory of inland habitat and fish community characteristics statewide; develop reference points for local, regional, and statewide management needs; and assess the status of, and detect changes to, aquatic habitats and fish communities across Michigan. The STP uses a stratified random design to determine what lakes to survey. This design ensures that sampling effort is distributed across the state and across a range of lake types, including all public lakes ten acres and larger in size. The initial
Lake Brighton (Livingston Co.)
0
100
200
300
400
500
600
700
19701973
19761979
19821985
19881991
19941997
20002003
20062009
Year
Tota
l Pho
spho
rus
(ug/
L)
Palmer Lake (St. Joseph Co.)
0
20
40
60
80
100
120
140
19701973
19761979
19821985
19881991
19941997
20002003
20062009
2012
Year
Tota
l Pho
spho
rus
(ug/
L)
Lake Chemung (Livingston Co.)
05
101520253035404550
19701973
19761979
19821985
19881991
19941997
20002003
20062009
2012
Tota
l Pho
spho
rus
(ug/
L)
Thornapple Lake (Barry Co.)
0102030405060708090
100
19701973
19761979
19821985
19881991
19941997
20002003
2006
Tota
l Pho
spho
rus
(ug/
L)

35
STP report covering the first six years, 2002-2007, and a total of 233 lakes sampled, is targeted for early 2012 (Wehrly et al., 2012b). Twenty-eight lakes were sampled for the STP in 2007. The CLMP has been an important component of Michigan’s inland lakes monitoring program for over 38 years (https://micorps.net/ ). The primary purpose of this cooperative program is to help citizen volunteers monitor indicators of water quality in their lake and document changes in lake quality over time. During 2007, 91 lakes enrolled in the CLMP were sampled for the primary trophic status indicators. Table 10 summarizes the trophic condition indicator (Secchi transparency, TP, and chlorophyll-a) data that were collected independently in 2007 as part of the four statewide monitoring programs. These data (unweighted) are presented graphically as box and whiskers plots in Figures 34-36. Secchi transparency is lower for the NLA results with an unweighted median of 2.31 meters (2.14 meters - weighted data) compared to 3.2, 3.2, and 3.5 meters for the LWQA, STP, and CLMP, respectively. Conversely, the chlorophyll-a results for the NLA are higher with an unweighted median of 3.82 ug/L (3.32 ug/L – weighted data) compared to 2.8, 2.65, and 2.9 ug/L for the LWQA, STP, and CLMP, respectively. The epilimnetic TP results for the state agency monitoring programs are similar to the unweighted NLA results with median values of 11, 10, and 10 ug/L for the LWQA, STP, and CLMP, respectively, compared to 10.5 ug/L for the NLA. However, when the NLA results are adjusted for the lake size distribution categories and weighted accordingly, the statewide median TP concentration is 8 ug/L.

36
Table 10. Statistical summary of the trophic state parameters collected in 2007 as part of the NLA survey, LWQA monitoring program, STP, and CLMP monitoring network.
Survey Stats Total Phosphorus Secchi Transparency Chlorophyll-a (2007) (ug/L) (m) (ug/L)
NLA mean 13.1 2.3 5.38
(weighted) std dev 10.5 1.67 4.92 (n=50) max 82 7.95 30.7
75th 16 3.52 5.05 50th 8 2.14 3.32 25th 6 0.8 2.31 min 3 0.58 1.1
NLA mean 17 2.65 7 (unweighted) std dev 16.5 1.54 6.61
(n=50) max 82 7.95 30.7 75th 19.5 3.64 9.97 50th 10.5 2.31 3.82 25th 7 1.43 2.98 min 3 0.58 1.1
LWQA mean 14.4 3.5 4.98 (n=85) std dev 11.06 1.51 9.93
max 73 7.3 90 75th 16 4.3 5.25 50th 11 3.2 2.8 25th 8 2.4 1.8 min <5 0.3 <1
STP mean 11.9 3.37 3.35 (n=28) std dev 6.13 1.28 2.35
max 26 6.1 11 75th 15.5 4.22 3.7 50th 10 3.2 2.65 25th 7 2.29 2.1 min 4 1.52 <1
CLMP mean 12.4 3.69 3.91 (n=91) std dev 8.23 1.5 3.36
max 48 8.7 19 75th 16 4.5 4.5 50th 10 3.5 2.9
25th 7 2.7 1.9 min <5 0.6 <1

37
NLA_MI-(50)^DNR_STP-(28)DEQ_LWQA-(85)DEQ_CLMP-(91)
90
80
70
60
50
40
30
20
10
0
2007 SURVEYS
Tota
l Pho
spho
rus
(ug/
L)
10.5101110
2007 Summer Epilimnetic Total Phosphorus
unweighted data (weighted median = 8 ug/L)
Figure 34. Multiple surveys comparison – 2007 summer Secchi transparency.
Figure 35. Multiple surveys comparison – 2007 summer epilimnetic TP.
NLA_MI-(50)^DNR_STP-(28)DEQ_LWQA-(85)DEQ_CLMP-(91)
9
8
7
6
5
4
3
2
1
0
2007 SURVEYS
SD T
rans
pare
ncy
(m)
2.3
3.23.23.5
2007 Summer Secchi Transparency (meters)
^ unweighted data (weighted median = 2.1 meters)

38
Figure 36. Multiple surveys comparison – 2007 summer chlorophyll-a. Summary and Conclusions Michigan’s 2007 NLA Survey effort was led by the MDEQ with contractual support from the GLEC. The MDEQ and GLEC cooperated on the initial planning of the survey and GLEC staff conducted the sampling of Michigan’s Lower Peninsula lakes included in the survey and coordinated sample processing and shipping. The MDEQ Senior Environment Employment staff sampled Michigan’s Upper Peninsula lakes. Michigan received 29 lakes as a part of the original NLA draw of lakes and added 21 lakes to the survey to achieve the 50 lakes minimum needed for statistically-based statewide estimates of condition (Figure 1). Four lakes from the suite of national reference lakes selected by the USEPA were also located in Michigan. Applying the appropriate weighting factors to the data collected from this random set of lakes provides for a robust dataset for evaluating ecological and recreational condition of Michigan’s lakes and for examining statewide and regional patterns in trophic status indicators and related water chemistry parameters included in the NLA. The biological condition of Michigan’s lakes is good based on the assessment of the zooplankton and phytoplankton assemblages. The planktonic O/E taxa loss analysis shows that 86% of the lakes are in good condition (≤ 20% taxa loss), which is similar to all lakes in the UMW ecoregion at 91%. Only 3% of Michigan lakes are considered poor (> 40% taxa loss) for these two biological communities. Based on the LDCI, 86% of Michigan’s lakes are in least disturbed (good) or intermediate disturbed (fair) condition as compared to 78% for the UMW ecoregion.
NLA_MI-(50)^DNR_STP-(28)DEQ_LWQA-(85)*DEQ_CLMP-(91)
35
30
25
20
15
10
5
0
2007 SURVEYS
Chlo
roph
yll a
(ug
/L)
3.82.652.82.9
2007 Summer Chlorophyll-a (ug/L)
* DEQ_LWQA-(85) extreme data value 90.0 not shown ^ unweighted data (weighted median = 3.3 ug/L)
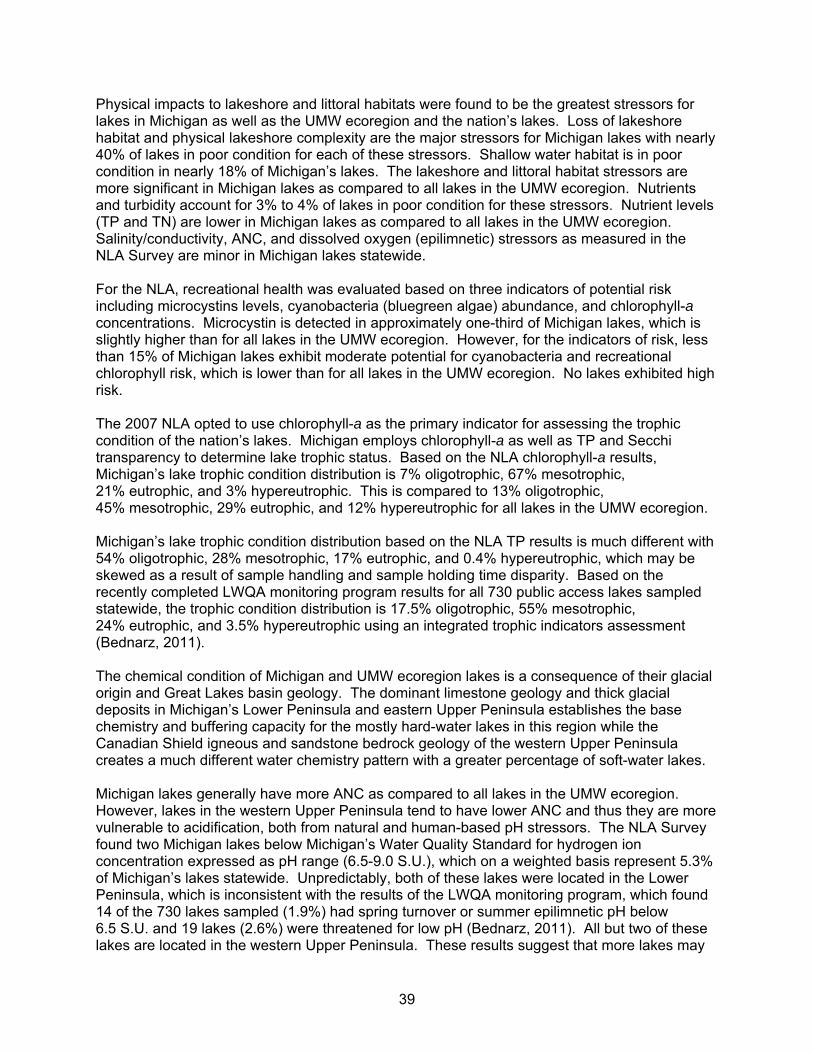
39
Physical impacts to lakeshore and littoral habitats were found to be the greatest stressors for lakes in Michigan as well as the UMW ecoregion and the nation’s lakes. Loss of lakeshore habitat and physical lakeshore complexity are the major stressors for Michigan lakes with nearly 40% of lakes in poor condition for each of these stressors. Shallow water habitat is in poor condition in nearly 18% of Michigan’s lakes. The lakeshore and littoral habitat stressors are more significant in Michigan lakes as compared to all lakes in the UMW ecoregion. Nutrients and turbidity account for 3% to 4% of lakes in poor condition for these stressors. Nutrient levels (TP and TN) are lower in Michigan lakes as compared to all lakes in the UMW ecoregion. Salinity/conductivity, ANC, and dissolved oxygen (epilimnetic) stressors as measured in the NLA Survey are minor in Michigan lakes statewide. For the NLA, recreational health was evaluated based on three indicators of potential risk including microcystins levels, cyanobacteria (bluegreen algae) abundance, and chlorophyll-a concentrations. Microcystin is detected in approximately one-third of Michigan lakes, which is slightly higher than for all lakes in the UMW ecoregion. However, for the indicators of risk, less than 15% of Michigan lakes exhibit moderate potential for cyanobacteria and recreational chlorophyll risk, which is lower than for all lakes in the UMW ecoregion. No lakes exhibited high risk. The 2007 NLA opted to use chlorophyll-a as the primary indicator for assessing the trophic condition of the nation’s lakes. Michigan employs chlorophyll-a as well as TP and Secchi transparency to determine lake trophic status. Based on the NLA chlorophyll-a results, Michigan’s lake trophic condition distribution is 7% oligotrophic, 67% mesotrophic, 21% eutrophic, and 3% hypereutrophic. This is compared to 13% oligotrophic, 45% mesotrophic, 29% eutrophic, and 12% hypereutrophic for all lakes in the UMW ecoregion. Michigan’s lake trophic condition distribution based on the NLA TP results is much different with 54% oligotrophic, 28% mesotrophic, 17% eutrophic, and 0.4% hypereutrophic, which may be skewed as a result of sample handling and sample holding time disparity. Based on the recently completed LWQA monitoring program results for all 730 public access lakes sampled statewide, the trophic condition distribution is 17.5% oligotrophic, 55% mesotrophic, 24% eutrophic, and 3.5% hypereutrophic using an integrated trophic indicators assessment (Bednarz, 2011). The chemical condition of Michigan and UMW ecoregion lakes is a consequence of their glacial origin and Great Lakes basin geology. The dominant limestone geology and thick glacial deposits in Michigan’s Lower Peninsula and eastern Upper Peninsula establishes the base chemistry and buffering capacity for the mostly hard-water lakes in this region while the Canadian Shield igneous and sandstone bedrock geology of the western Upper Peninsula creates a much different water chemistry pattern with a greater percentage of soft-water lakes. Michigan lakes generally have more ANC as compared to all lakes in the UMW ecoregion. However, lakes in the western Upper Peninsula tend to have lower ANC and thus they are more vulnerable to acidification, both from natural and human-based pH stressors. The NLA Survey found two Michigan lakes below Michigan’s Water Quality Standard for hydrogen ion concentration expressed as pH range (6.5-9.0 S.U.), which on a weighted basis represent 5.3% of Michigan’s lakes statewide. Unpredictably, both of these lakes were located in the Lower Peninsula, which is inconsistent with the results of the LWQA monitoring program, which found 14 of the 730 lakes sampled (1.9%) had spring turnover or summer epilimnetic pH below 6.5 S.U. and 19 lakes (2.6%) were threatened for low pH (Bednarz, 2011). All but two of these lakes are located in the western Upper Peninsula. These results suggest that more lakes may

40
need to be added to the NLA state-scale survey design to accurately determine distribution patterns for these parameters in Michigan lakes given the dissimilar water chemistry characteristics of the western Upper Peninsula lakes compared to the Lower Peninsula lakes. Calcium and sodium are the dominant anions and sulfate and chloride, along with carbonate-bicarbonate, are the dominant anions. Concentrations of these ions in Michigan lakes are higher as compared to all lakes in the UMW ecoregion. The highest chloride and sulfate concentrations are generally associated with areas of higher population density and transportation corridors in southeast Michigan. Organic carbon in Michigan lakes is relatively low compared to all lakes in the UMW ecoregion. Platinum-cobalt color levels are similar for Michigan lakes compared to lakes in the UMW ecoregion. The median value for Secchi transparency in Michigan lakes is similar to all lakes in the UMW ecoregion although a greater percentage of Michigan lakes are in the higher transparency category (75th percentile) when compared to all lakes in the UMW ecoregion. Turbidity is generally less in Michigan lakes as compared to all UMW ecoregion lakes. Water concentration of TP in Michigan lakes is low as compared to all UMW ecoregion lakes while TN concentration is similar but slightly higher. Chlorophyll-a levels are also lower for Michigan lakes as compared to all lakes in the UMW ecoregion. The relative phosphorus-rich to phosphorus-poor south to north lakes distribution pattern previously reported for the Lower Peninsula is reinforced by the NLA Survey results. Michigan’s Upper Peninsula lakes show a more variable pattern for nutrients. These patterns are mirrored by the chlorophyll-a results. Michigan’s subset of NES lakes exhibited trophic condition improvement in two of the eight lakes sampled. The improved conditions in these lakes resulted from treatment upgrades or removal of WWTP discharges to the lakes. The six NES lakes that showed little or no improvement are either man-made reservoir lakes on large watersheds, drowned river mouth lakes to Lake Michigan, or a lake with individual septic systems for the shoreline dwellings but no WWTP discharge. When comparing NLA results to the LWQA, STP, and CLMP results for the 2007 monitoring cycle, the NLA findings for Secchi transparency was lower and chlorophyll-a higher than measured in the agency monitoring programs. For TP, the unweighted NLA value was similar but the weighted value was lower as compared to the LWQA, STP, and CLMP results. The NLA randomly selected lake dataset provides a valuable complement to data collected from the MDEQ targeted lake monitoring programs and the MDNR fishery condition-based lake STP. The NLA state-scale assessment allows for extrapolation to the entire state, and defined regions, for all lakes 4 hectares (10 acres) or larger. This can provide context for data collected from other monitoring programs, help identify the most significant statewide lake management needs, and provide a basis for assessing effectiveness of lake management and pollution control activities on Michigan’s inland lakes. It also allows management agencies to target resources and additional monitoring where they may be needed to protect, preserve, and restore water quality. The NLA ecoregional assessments reveal broad-scale patterns in lake condition across state lines. The UMW ecoregion assessment and state-scale results for Michigan, Wisconsin, and Minnesota provide a basis for comparing and evaluating lake management strategies and outcomes across jurisdictional boundaries.

41
The NLA biological condition indicators and the quantitative physical habitat metrics added an additional dimension to Michigan’s lake quality assessment process. The 2007 NLA-Michigan found that 86% of Michigan’s lakes support healthy planktonic communities when compared to least disturbed reference sites. But lakeshore habitats and physical lakeshore complexity are found to be the major stressors for Michigan lakes, which may impact overall lake condition long-term. These results point to the importance of expanding and establishing protective lakes management programs, such as the Michigan Natural Shoreline Partnership (http://www.mishorelinepartnership.org/), and supporting “grass-root” lake protection and preservation initiatives in Michigan.
The state-scale results establish a baseline for future monitoring efforts on Michigan lakes, which may be used to track statewide trends in lake condition. Continued state-scale participation in the NLA will allow for more detailed assessment of temporal differences in the data and trend analysis for Michigan’s lakes. Adding more lakes to the state-scale assessments is recommended to allow for more refined analysis of the distribution patterns for the water quality parameters.
Next Steps
The next round of the NLA Survey is scheduled for summer 2012. The MDEQ will again participate in the Survey and conduct a state-scale assessment to add to the 2007 NLA-Michigan findings.
Future direction for Michigan’s lake monitoring and assessment programs is being discussed by a joint MDEQ-MDNR water collaboration team. The directive of this team is to explore opportunities for collaboration between the MDNR, Fisheries Division, and the MDEQ, Water Resources Division, monitoring programs. The NLA statistical survey design and assessment process likely will be part of future collaborative lake monitoring and assessment initiatives in Michigan.

42
References Bednarz, R., R. Lawson, H. Wandell, and P. Bonnell 2007. Cooperative Lakes Monitoring
Program Quality Assurance Plan. Michigan Department of Environmental Quality, Water Bureau and the Michigan Clean Water Corps Partnership. January 2002 (Updated Janurary 2007), 38 pp.
Bednarz, R., S. Blumer, R. Minnerick, and S. Beeler. 2008. Michigan’s Lake
Water Quality Assessment Program Quality Assurance Plan. Michigan Department of Environmental Quality, Water Bureau, and the U.S. Geological Survey, Michigan Water Science Center. July 2001 (Updated June 2008), 28 pp.
Bednarz, R. 2011. Unpublished Internal Data Assessment, Michigan Department of
Environment Quality, Water Resources Division. Boyle, K. and R. Bouchard. 2003. “Water Quality Effects on Property Prices in Northern New
England,” LakeLine Vol 23(3), pp. 24-27. Fuller, L. M. and R.J. Minnerick. 2008. State and Regional Water-Quality Characteristics and
Trophic Conditions of Michigan’s Inland Lakes, 2001-2005.U.S. Geological Survey Scientific Investigations Report 2008-5188, 58 pp.
Fuller, L. M., and C.K. Taricska. 2012 (in press). Water-Quality Characteristics of Michigan’s
Inland Lakes, 2001-2010.U.S. Geological Survey Scientific Investigations Report 2011-XXXX39, 45 pp., and appendices.
Hayes, D., E. Baker, R. Bednarz, D. Borgeson, Jr., J. Braunscheidel, J. Breck, A. Harrington,
R. Hay, R. Lockwood, A. Nuhfer, J. Schneider, P. Seelbach, J. Waybrant, and T. Zorn. 2003. Developing a Standardized Sampling Program: the Michigan Experience. Fisheries 28, pp. 18-25.
Heiskary, S. and M. Lindon. 2010. Minnesota National Lakes Assessment Project: An
Overview of Water Chemistry in Minnesota Lakes. Minnesota Pollution Control Agency, Environmental analysis and outcomes Division, WQ-NLAP-05. October 2010, 55 pp.
Kiddon, J. 2010. NLA Data Viewer. U.S. Environmental Protection Agency, National Health
and Environmental Effects Research Laboratory, Atlantic Ecological Division. Kiddon, J. 2011a. NLA LakeTool. U.S. Environmental Protection Agency, National Health and
Environmental Effects Research Laboratory, Atlantic Ecological Division. Kiddon, J. 2011b. NLA Condition Calculator. U.S. Environmental Protection Agency, National
Health and Environmental Effects Research Laboratory, Atlantic Ecological Division. Kiddon, J. 2011c. U.S. Environmental Protection Agency, National Health and Environmental
Effects Research Laboratory, Atlantic Ecological Division, personal communication. Krysel, C., E. Boyer, C. Parson, P. Welle. 2003. “Lakeshore Property Values and Water
Quality: Evidence from Property Sales in the Mississippi Headwaters Region.” Mississippi Headwaters Board and Bemidji State University, 59 pp.

43
MDEQ. 2001. The Michigan Department of Environmental Quality’s Lake Water Quality Monitoring Program for Michigan’s Inland Lakes. Michigan Department of Environmental Quality, Land and Water Management Division, and U.S. Geological Survey, Water Resources Division, Michigan District. May 2001, 53 pp.
MDNR. 1982. Michigan Inland Lake Project – Identification, Survey, and Classification: Clean
Lakes Agreement No. S 005511-01, 20 pp., and Appendices. USEPA. 1974. National Eutrophication Survey Methods for Lakes Sampled in 1972. U.S.
Environmental Protection Agency National Eutrophication Survey Working Paper No. 1. U.S. Environmental Protection Agency, Pacific Northwest Environmental Research Laboratory – Corvallis, Oregon and National Environmental Research Center – Las Vegas, Nevada. October 1974, 40 pp.
USEPA. 2006. National Lakes Assessment Technical Fact Sheet: Site Selection for the
Survey of the Nation’s Lakes. EPA 841-F-06-002. U.S. Environmental Protection Agency, Office of Water and Office of Research and Development, Washington, D.C. April 2006, 2 pp.
USEPA. 2009. National Lakes Assessment: A collaborative Survey of the Nation’s Lakes.
EPA 841-R-09-001. U.S. Environmental Protection Agency, Office of Water and Office of Research and Development, Washington, D.C. April 2010, 103 pp.
USEPA. 2010. National Lakes Assessment: Techical Appendix. EPA 841-R-09-001a.
U.S. Environmental Protection Agency, Office of Water and Office of Research and Development, Washington, D.C. January 2010, 63 pp.
Wehrly, K. E., G. S. Carter, and J. E. Breck. 2012a (in press). Standardized Sampling Methods
for the Inland Lakes Status and Trends Program. Chapter XX in Manual of Fisheries Survey Methods. Michigan Department of Natural Resources Internal Document, Ann Arbor, Michigan, 43 pp.
Wehrly, K.E., D.B. Hayes, T.C. Wills. 2012b (in press). Status and Trends of Michigan Inland
Lake Resources, 2002-2007. Michigan Department of Natural Resources, Institute for Fisheries Research Internal Document, Ann Arbor, Michigan, 256 pp.
Wetzel, R.G. 2001. Limnology – Lake and River Ecosystems (3rd edition). San Diego,
California, Academic Press, 1006 pp.

*Ecoregion Key NCHF – North Central Hardwood Forests NLF – Northern Lakes and Forests SMNIDP – Southern Michigan/Northern Indiana Drift Plains
NLA Site ID Lake Name Visit # Type County Ecoregion* Area Sample Est. Mean Index Site
(ha) Date Depth (m) Depth (m)
NLA06608-0010 Bogie Lake 1 PROB_Lake OAKLAND SMNIDP 30 7/17/2007 3.9 11.7
NLA06608-0010 Bogie Lake 2 PROB_Lake OAKLAND SMNIDP 30 8/18/2007 3.7 11
NLA06608-0170 Tallman Lake 1 PROB_Lake MASON NLF 51 9/21/2007 1.1 3.4
NLA06608-0234 Pine Lake 1 PROB_Lake KENT SMNIDP 21 8/23/2007 2.3 6.8
NLA06608-0286 Silver Lake 1 PROB_Lake IRON NLF 56 8/8/2007 5.9 17.8
NLA06608-0330 Lake Besser 1 PROB_Lake ALPENA NLF 115 9/5/2007 1.7 5
NLA06608-0363 Palmer Lake 1 NES_Lake ST JOSEPH SMNIDP 292 7/21/2007 4.3 13
NLA06608-0399 Hiland Lake 1 PROB_Lake LIVINGSTON SMNIDP 16 7/16/2007 1.2 3.5
NLA06608-0426 Eight Point Lake 1 PROB_Lake CLARE NLF 160 9/17/2007 2.6 7.7
NLA06608-0462 Loon Lake 1 PROB_Lake GOGEBIC NLF 150 8/20/2007 4.1 12.2
NLA06608-0463 Belleville Lake 1 NES_Lake WAYNE SMNIDP 273 8/19/2007 1.9 5.8
NLA06608-0502 Squaw Lake 1 PROB_Lake GENESEE SMNIDP 30 8/18/2007 3.6 10.7
NLA06608-0619 Campbell Lake 1 PROB_Lake KALAMAZOO SMNIDP 60 7/18/2007 3.7 11.1
NLA06608-0630 Dewey Lake 1 PROB_Lake MARQUETTE NLF 21 7/30/2007 0.8 2.5
NLA06608-0734 Mud Lake 1 PROB_Lake HOUGHTON NLF 69 7/24/2007 1.1 3.2
NLA06608-0874 Martin Lake 1 PROB_Lake NEWAYGO SMNIDP 23 8/30/2007 3.9 11.8
NLA06608-0875 Pine Lake 1 PROB_Lake EATON SMNIDP 46 9/14/2007 2.1 6.3
NLA06608-0938 Muskegon Lake 1 NES_Lake MUSKEGON SMNIDP 1889 8/7/2007 6.3 19
NLA06608-0974 Fence Lake 1 PROB_Lake BARAGA NLF 94 7/16/2007 1.6 4.9
NLA06608-1003 Round Lake 1 PROB_Lake VAN BUREN SMNIDP 82 7/23/2007 2.7 8.2
NLA06608-1014 Lake Chemung 1 NES_Lake LIVINGSTON SMNIDP 120 9/13/2007 7.0 21.1
NLA06608-1034 Mill Lake 1 PROB_Lake OAKLAND SMNIDP 11 8/16/2007 3.0 9
NLA06608-1130 Thornapple Lake 1 NES_Lake BARRY SMNIDP 178 8/21/2007 3.1 9.4
NLA06608-1162 Lake Au Sable 1 PROB_Lake OGEMAW NLF 106 9/6/2007 5.0 15
NLA06608-1167 Clark Lake 1 PROB_Lake JACKSON SMNIDP 233 9/20/2007 5.2 15.5
NLA06608-1206 McDonald 1 PROB_Lake DELTA NLF 12 8/2/2007 0.7 2.2
NLA06608-1258 Stoner Lake 1 PROB_Lake KENT SMNIDP 30 8/22/2007 0.5 1.5
NLA06608-1334 Crooked Lake 1 PROB_Lake EMMET NLF 1396 7/31/2007 5.0 15
NLA06608-1334 Crooked Lake 2 PROB_Lake EMMET NLF 1396 8/14/2007 6.0 18
NLA06608-1358 Lake Gogebic 1 PROB_Lake GOGEBIC NLF 5280 8/28/2007 2.2 6.7
NLA06608-1358 Lake Gogebic 2 PROB_Lake GOGEBIC NLF 5280 9/18/2007 2.2 6.7
NLA06608-1370 Wyckoff Lake 1 PROB_Lake OCEANA SMNIDP 15 8/31/2007 2.0 6
NLA06608-1387 West Lake 1 PROB_Lake KALAMAZOO SMNIDP 132 7/20/2007 0.9 2.7
NLA06608-1398 Howe Lake 1 PROB_Lake ALGER NLF 36 8/17/2007 0.3 1
NLA06608-1434 Deer Lake 1 PROB_Lake CHARLEVOIX NLF 184 8/1/2007 1.8 5.5
NLA06608-1450 Blue Lake 1 PROB_Lake MECOSTA SMNIDP 89 7/24/2007 5.0 15
NLA06608-1487 Ford Lake 1 NES_Lake WASHTENAW SMNIDP 385 8/20/2007 3.3 10
NLA06608-1515 Upper Scott 1 PROB_Lake ALLEGAN SMNIDP 38 8/29/2007 0.6 1.8
NLA06608-1626 Pere Marquette Lake 1 NES_Lake MASON SMNIDP 238 8/8/2007 4.3 13
NLA06608-1643 Warner Lake 1 PROB_Lake BARRY SMNIDP 16 7/19/2007 3.7 11.2
NLA06608-1654 Forestville Basin 1 PROB_Lake MARQUETTE NLF 36 7/9/2007 2.4 7.2
NLA06608-1679 Tims Lake 1 PROB_Lake JACKSON SMNIDP 41 7/15/2007 2.5 7.5
NLA06608-1690 Bridge Lake 1 PROB_Lake GRAND TRAVERSE NCHF 13 9/10/2007 3.7 11
NLA06608-1706 Clark Co. Lake 1 PROB_Lake CLARE SMNIDP 4 9/17/2007 1.3 4
NLA06608-1707 Donnell Lake 1 PROB_Lake CASS SMNIDP 96 7/22/2007 6.4 19.2
NLA06608-1742 Big Lake 1 PROB_Lake BARAGA NLF 50 7/18/2007 3.1 9.2
NLA06608-1758 Bailey Lake 1 PROB_Lake KEWEENAW NLF 78 7/23/2007 0.3 1
NLA06608-1771 Saddle Lake 1 PROB_Lake VAN BUREN SMNIDP 109 8/28/2007 3.0 9
NLA06608-1782 Lake Brighton 1 NES_Lake LIVINGSTON SMNIDP 64 9/13/2007 1.0 3
NLA06608-1802 Stony Creek Lake 1 PROB_Lake MACOMB SMNIDP 192 9/12/2007 2.1 6.3
NLA06608-1910 Blomgren 1 PROB_Lake DICKINSON NLF 32 7/11/2007 0.6 1.8
NLA06608-1998 Keewaydin Lake 1 PROB_Lake MARQUETTE NLF 53 8/6/2007 2.3 6.9
NLA06608-1998 Keewaydin Lake 2 PROB_Lake MARQUETTE NLF 53 9/11/2007 2.1 6.2
NLA06608-2078 Lotto Lake 1 PROB_Lake MARQUETTE NLF 43 8/24/2007 1.6 4.8
NLA06608-ELS:2B2-008 Hall Lake 1 REF_Lake HOUGHTON NLF 6 8/21/2007 4.6 13.7
NLA06608-MI:7007 Sullivan Lake 1 REF_Lake WASHTENAW SMNIDP 10 8/1/2007 2.2 6.7
NLA06608-R5:KATHRYN St. Kathryn 1 REF_Lake IRON NLF 65 8/22/2007 3.0 9.1
NLA06608-R5:OTTAWA Lake Ottawa 1 REF_Lake IRON NLF 214 8/23/2007 8.6 25.9
Appendix 1a. NLA-Michigan Lakes: Lake Morphometry.
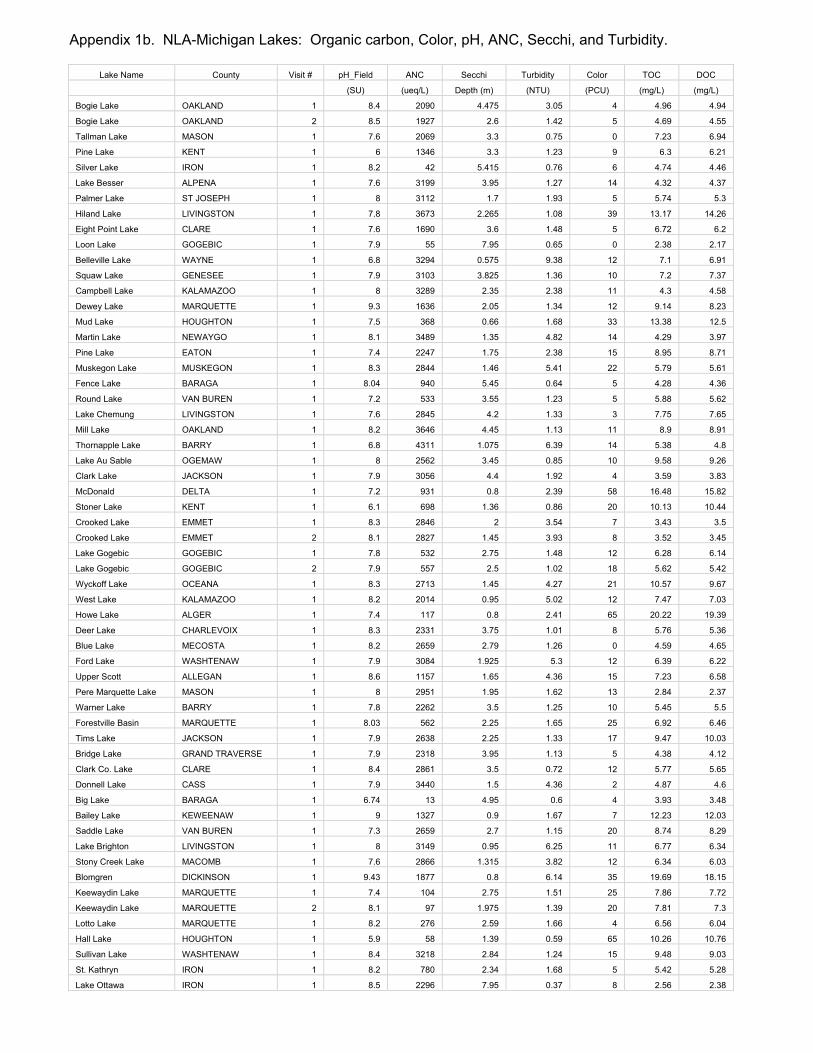
Lake Name County Visit # pH_Field ANC Secchi Turbidity Color TOC DOC
(SU) (ueq/L) Depth (m) (NTU) (PCU) (mg/L) (mg/L)
Bogie Lake OAKLAND 1 8.4 2090 4.475 3.05 4 4.96 4.94
Bogie Lake OAKLAND 2 8.5 1927 2.6 1.42 5 4.69 4.55
Tallman Lake MASON 1 7.6 2069 3.3 0.75 0 7.23 6.94
Pine Lake KENT 1 6 1346 3.3 1.23 9 6.3 6.21
Silver Lake IRON 1 8.2 42 5.415 0.76 6 4.74 4.46
Lake Besser ALPENA 1 7.6 3199 3.95 1.27 14 4.32 4.37
Palmer Lake ST JOSEPH 1 8 3112 1.7 1.93 5 5.74 5.3
Hiland Lake LIVINGSTON 1 7.8 3673 2.265 1.08 39 13.17 14.26
Eight Point Lake CLARE 1 7.6 1690 3.6 1.48 5 6.72 6.2
Loon Lake GOGEBIC 1 7.9 55 7.95 0.65 0 2.38 2.17
Belleville Lake WAYNE 1 6.8 3294 0.575 9.38 12 7.1 6.91
Squaw Lake GENESEE 1 7.9 3103 3.825 1.36 10 7.2 7.37
Campbell Lake KALAMAZOO 1 8 3289 2.35 2.38 11 4.3 4.58
Dewey Lake MARQUETTE 1 9.3 1636 2.05 1.34 12 9.14 8.23
Mud Lake HOUGHTON 1 7.5 368 0.66 1.68 33 13.38 12.5
Martin Lake NEWAYGO 1 8.1 3489 1.35 4.82 14 4.29 3.97
Pine Lake EATON 1 7.4 2247 1.75 2.38 15 8.95 8.71
Muskegon Lake MUSKEGON 1 8.3 2844 1.46 5.41 22 5.79 5.61
Fence Lake BARAGA 1 8.04 940 5.45 0.64 5 4.28 4.36
Round Lake VAN BUREN 1 7.2 533 3.55 1.23 5 5.88 5.62
Lake Chemung LIVINGSTON 1 7.6 2845 4.2 1.33 3 7.75 7.65
Mill Lake OAKLAND 1 8.2 3646 4.45 1.13 11 8.9 8.91
Thornapple Lake BARRY 1 6.8 4311 1.075 6.39 14 5.38 4.8
Lake Au Sable OGEMAW 1 8 2562 3.45 0.85 10 9.58 9.26
Clark Lake JACKSON 1 7.9 3056 4.4 1.92 4 3.59 3.83
McDonald DELTA 1 7.2 931 0.8 2.39 58 16.48 15.82
Stoner Lake KENT 1 6.1 698 1.36 0.86 20 10.13 10.44
Crooked Lake EMMET 1 8.3 2846 2 3.54 7 3.43 3.5
Crooked Lake EMMET 2 8.1 2827 1.45 3.93 8 3.52 3.45
Lake Gogebic GOGEBIC 1 7.8 532 2.75 1.48 12 6.28 6.14
Lake Gogebic GOGEBIC 2 7.9 557 2.5 1.02 18 5.62 5.42
Wyckoff Lake OCEANA 1 8.3 2713 1.45 4.27 21 10.57 9.67
West Lake KALAMAZOO 1 8.2 2014 0.95 5.02 12 7.47 7.03
Howe Lake ALGER 1 7.4 117 0.8 2.41 65 20.22 19.39
Deer Lake CHARLEVOIX 1 8.3 2331 3.75 1.01 8 5.76 5.36
Blue Lake MECOSTA 1 8.2 2659 2.79 1.26 0 4.59 4.65
Ford Lake WASHTENAW 1 7.9 3084 1.925 5.3 12 6.39 6.22
Upper Scott ALLEGAN 1 8.6 1157 1.65 4.36 15 7.23 6.58
Pere Marquette Lake MASON 1 8 2951 1.95 1.62 13 2.84 2.37
Warner Lake BARRY 1 7.8 2262 3.5 1.25 10 5.45 5.5
Forestville Basin MARQUETTE 1 8.03 562 2.25 1.65 25 6.92 6.46
Tims Lake JACKSON 1 7.9 2638 2.25 1.33 17 9.47 10.03
Bridge Lake GRAND TRAVERSE 1 7.9 2318 3.95 1.13 5 4.38 4.12
Clark Co. Lake CLARE 1 8.4 2861 3.5 0.72 12 5.77 5.65
Donnell Lake CASS 1 7.9 3440 1.5 4.36 2 4.87 4.6
Big Lake BARAGA 1 6.74 13 4.95 0.6 4 3.93 3.48
Bailey Lake KEWEENAW 1 9 1327 0.9 1.67 7 12.23 12.03
Saddle Lake VAN BUREN 1 7.3 2659 2.7 1.15 20 8.74 8.29
Lake Brighton LIVINGSTON 1 8 3149 0.95 6.25 11 6.77 6.34
Stony Creek Lake MACOMB 1 7.6 2866 1.315 3.82 12 6.34 6.03
Blomgren DICKINSON 1 9.43 1877 0.8 6.14 35 19.69 18.15
Keewaydin Lake MARQUETTE 1 7.4 104 2.75 1.51 25 7.86 7.72
Keewaydin Lake MARQUETTE 2 8.1 97 1.975 1.39 20 7.81 7.3
Lotto Lake MARQUETTE 1 8.2 276 2.59 1.66 4 6.56 6.04
Hall Lake HOUGHTON 1 5.9 58 1.39 0.59 65 10.26 10.76
Sullivan Lake WASHTENAW 1 8.4 3218 2.84 1.24 15 9.48 9.03
St. Kathryn IRON 1 8.2 780 2.34 1.68 5 5.42 5.28
Lake Ottawa IRON 1 8.5 2296 7.95 0.37 8 2.56 2.38
Appendix 1b. NLA-Michigan Lakes: Organic carbon, Color, pH, ANC, Secchi, and Turbidity.

Lake Name County Visit
# TP TN NO2+NO3 NO3-N NH4-N CHL-a
(ug/L) (ug/L) (ug/L) (ug/L) (ug/L) (ug/L)
Bogie Lake OAKLAND 1 10 473 0 0 1.2 4.4
Bogie Lake OAKLAND 2 10 485 0 0 0.3 3.3
Tallman Lake MASON 1 8 780 0 0 1.9 1.4
Pine Lake KENT 1 14 584 0.015 0.009 2.6 4.8
Silver Lake IRON 1 5 413 0 0 0.4 2.2
Lake Besser ALPENA 1 13 289 0.012 0.008 1.6 1.1
Palmer Lake ST JOSEPH 1 18 567 0 0 0.9 11.7
Hiland Lake LIVINGSTON 1 13 586 0.01 0 2.4 3.4
Eight Point Lake CLARE 1 5 574 0 0 1.1 3.1
Loon Lake GOGEBIC 1 3 194 0 0 0.1
Belleville Lake WAYNE 1 82 1031 0.014 0.01 6.9 30.7
Squaw Lake GENESEE 1 5 648 0 0 0.4 2.3
Campbell Lake KALAMAZOO 1 7 733 0.229 0.281 4 3.0
Dewey Lake MARQUETTE 1 8 771 0 0 1.9 2.6
Mud Lake HOUGHTON 1 16 364 0 0 1.1 3.2
Martin Lake NEWAYGO 1 29 3441 3.097 2.855 2.4 14.2
Pine Lake EATON 1 16 720 0.005 0 4.7 6.1
Muskegon Lake MUSKEGON 1 34 519 0.028 0.115 2.4 11.9
Fence Lake BARAGA 1 4 101 0 0 1 1.7
Round Lake VAN BUREN 1 12 524 0 0 0.9 3.8
Lake Chemung LIVINGSTON 1 15 568 0.004 0 1 9.8
Mill Lake OAKLAND 1 5 563 0 0 0.9 2.0
Thornapple Lake BARRY 1 65 634 0.01 0.007 5.8 23.7
Lake Au Sable OGEMAW 1 8 541 0.007 0.002 1.3 3.1
Clark Lake JACKSON 1 5 461 0.002 0 1 2.6
McDonald DELTA 1 17 834 0 0 2.1 3.0
Stoner Lake KENT 1 16 712 0.006 0.003 2.6 4.3
Crooked Lake EMMET 1 7 388 0 0 0.4 3.0
Crooked Lake EMMET 2 7 314 0 0 0.7 2.8
Lake Gogebic GOGEBIC 1 11 288 0.005 0 0.6
Lake Gogebic GOGEBIC 2 7 359 0.011 0.023 1.4 4.6
Wyckoff Lake OCEANA 1 39 1063 0.008 0.056 1.2 16.2
West Lake KALAMAZOO 1 25 994 0 0 1.4 10.0
Howe Lake ALGER 1 24 624 0 0 0.2 7.9
Deer Lake CHARLEVOIX 1 5 458 0 0 0.6 2.3
Blue Lake MECOSTA 1 10 469 0.017 0.023 1.3 2.9
Ford Lake WASHTENAW 1 61 1071 0.107 0.2 13.1 14.6
Upper Scott ALLEGAN 1 33 845 0 0 0.6 11.6
Pere Marquette Lake MASON 1 30 623 0.212 0.286 1.6 14.8
Warner Lake BARRY 1 5 488 0 0 1 3.2
Forestville Basin MARQUETTE 1 6 354 0.063 0.078 1.6 4.5
Tims Lake JACKSON 1 8 366 0 0 1.7 3.1
Bridge Lake GRAND TRAVERSE 1 7 317 0.007 0 0.8 4.6
Clark Co. Lake CLARE 1 6 563 0 0 1.4
Donnell Lake CASS 1 8 723 0.302 0.432 1.6 3.3
Big Lake BARAGA 1 7 244 0 0 1.6 3.4
Bailey Lake KEWEENAW 1 8 892 0 0 2.3 3.1
Saddle Lake VAN BUREN 1 10 603 0 0 0 4.0
Lake Brighton LIVINGSTON 1 32 606 0 0 0.8 17.4
Stony Creek Lake MACOMB 1 18 536 0.007 0.02 1.4 5.3
Blomgren DICKINSON 1 37 830 0 0 2 22.2
Keewaydin Lake MARQUETTE 1 13 430 0.001 0 1.1 3.3
Keewaydin Lake MARQUETTE 2 8 326 0.002 0 0.9 5.3
Lotto Lake MARQUETTE 1 7 569 0 0 1.1 8.6
Hall Lake HOUGHTON 1 8 299 0 0 0.6 4.0
Sullivan Lake WASHTENAW 1 9 828 0 0 1.9 2.7
St. Kathryn IRON 1 7 405 0 0 0.4 4.1
Lake Ottawa IRON 1 3 148 0 0 0.4 1.0
Appendix 1c. NLA-Michigan Lakes: Nutrients and Chlorophyll-a.

Appendix 2a. 2007 NLA Survey data (un-weighted) summary – Total Phosphorus (ug/L)
Lake Name County Visit # Sp. Cond. Ca Mg Na K SiO2 SO4 Cl
(uS/cm) (mg/L) (mg/L) (mg/L) (mg/L) (mg/L) (mg/L) (mg/L)
Bogie Lake OAKLAND 1 650.1 25.6 20.0 63.9 1.5 3.1 20.7 128.6
Bogie Lake OAKLAND 2 648.6 25.5 21.2 60.8 1.6 3.6 19.3 128.8
Tallman Lake MASON 1 239.1 21.3 14.0 2.3 0.7 7.7 5.0 7.2
Pine Lake KENT 1 271.5 19.8 5.5 17.8 1.0 0.5 2.4 38.2
Silver Lake IRON 1 22.17 1.6 0.5 0.6 0.6 0.2 4.4 0.8
Lake Besser ALPENA 1 333.5 38.9 15.3 5.5 0.5 9.1 9.2 6.9
Palmer Lake ST JOSEPH 1 475 56.1 19.5 6.8 1.6 16.2 61.4 22.4
Hiland Lake LIVINGSTON 1 460.7 61.3 17.0 9.7 2.1 7.7 27.4 25.4
Eight Point Lake CLARE 1 206.2 25.0 6.7 3.5 0.6 0.4 5.3 8.5
Loon Lake GOGEBIC 1 14.28 1.4 0.4 0.2 0.3 0.0 2.4 0.2
Belleville Lake WAYNE 1 716.6 56.2 21.2 41.9 3.2 8.9 39.1 101.7
Squaw Lake GENESEE 1 612.4 41.9 22.2 37.7 2.8 1.8 13.4 92.1
Campbell Lake KALAMAZOO 1 429.3 38.7 24.3 9.4 1.0 8.3 30.9 20.5
Dewey Lake MARQUETTE 1 153.1 15.3 10.3 0.6 0.2 3.1 2.4 0.4
Mud Lake HOUGHTON 1 55.55 5.7 1.9 1.2 0.6 1.7 5.2 0.5
Martin Lake NEWAYGO 1 421.8 42.1 24.1 5.0 2.6 2.9 22.1 15.3
Pine Lake EATON 1 294.2 29.5 11.0 9.3 1.0 4.4 4.3 19.0
Muskegon Lake MUSKEGON 1 387.7 42.1 13.2 17.6 1.3 4.4 20.3 24.4
Fence Lake BARAGA 1 100.3 13.4 3.7 1.2 1.0 8.4 4.7 0.3
Round Lake VAN BUREN 1 83.8 7.9 3.2 2.1 0.1 0.3 5.9 4.4
Lake Chemung LIVINGSTON 1 683.3 41.6 16.1 58.0 3.5 1.7 19.3 108.2
Mill Lake OAKLAND 1 631.2 60.0 19.2 37.7 2.0 4.5 16.3 81.8
Thornapple Lake BARRY 1 555 66.6 26.9 9.4 1.8 12.8 42.9 24.6
Lake Au Sable OGEMAW 1 279 34.8 13.1 3.0 0.7 5.6 8.9 5.5
Clark Lake JACKSON 1 429.5 35.5 22.2 10.2 1.2 27.8 26.1 23.3
McDonald DELTA 1 121.8 14.0 4.6 2.1 0.2 1.5 2.5 5.3
Stoner Lake KENT 1 100.2 9.1 4.6 2.0 0.8 0.2 2.2 6.5
Crooked Lake EMMET 1 299.1 35.5 13.3 4.8 0.7 7.0 8.5 8.0
Crooked Lake EMMET 2 302.4 38.5 14.1 4.0 0.5 7.9 9.3 8.2
Lake Gogebic GOGEBIC 1 79.23 9.2 2.5 2.4 0.6 11.0 4.6 3.4
Lake Gogebic GOGEBIC 2 80.57 8.7 2.4 2.2 0.5 12.2 4.8 3.5
Wyckoff Lake OCEANA 1 314.4 30.3 18.4 5.7 1.7 7.7 10.6 15.1
West Lake KALAMAZOO 1 437.1 33.7 18.4 21.2 1.1 0.4 45.3 47.0
Howe Lake ALGER 1 38.65 2.8 1.9 1.0 0.3 1.4 6.0 0.4
Deer Lake CHARLEVOIX 1 287.2 31.7 10.9 7.4 0.8 6.2 11.7 13.7
Blue Lake MECOSTA 1 301.6 32.3 14.4 5.7 0.7 9.2 8.4 11.9
Ford Lake WASHTENAW 1 737.5 55.5 22.0 44.4 3.3 8.9 43.1 111.6
Upper Scott ALLEGAN 1 171.2 17.5 6.6 5.0 0.4 2.5 10.7 10.7
Pere Marquette Lake MASON 1 390.6 46.4 13.5 10.6 1.1 5.8 20.4 22.9
Warner Lake BARRY 1 246.6 29.0 12.3 1.5 0.6 1.9 11.2 2.9
Forestville Basin MARQUETTE 1 76.29 10.7 2.0 1.7 0.5 5.6 5.2 2.7
Tims Lake JACKSON 1 316.4 33.5 16.8 6.7 0.9 8.0 11.3 18.0
Bridge Lake GRAND TRAVERSE 1 280.2 34.1 8.8 5.6 0.9 5.9 8.3 10.4
Clark Co. Lake CLARE 1 640.8 35.4 25.2 47.6 1.6 7.7 32.6 89.7
Donnell Lake CASS 1 379.5 39.2 19.5 6.1 1.3 7.6 16.2 12.0
Big Lake BARAGA 1 14.87 0.9 0.3 0.5 0.4 0.1 3.2 0.8
Bailey Lake KEWEENAW 1 151.7 23.4 2.8 2.3 0.1 2.2 5.4 2.7
Saddle Lake VAN BUREN 1 302.4 35.4 11.7 6.8 1.0 3.4 8.4 11.8
Lake Brighton LIVINGSTON 1 696 45.1 19.3 54.6 1.8 6.0 15.3 110.4
Stony Creek Lake MACOMB 1 533.6 35.9 22.8 28.9 1.4 3.9 21.4 63.3
Blomgren DICKINSON 1 186.1 20.7 12.9 0.4 0.1 2.7 5.9 0.3
Keewaydin Lake MARQUETTE 1 23.05 2.2 0.7 0.6 0.4 0.1 2.9 0.3
Keewaydin Lake MARQUETTE 2 23.79 2.2 0.7 0.5 0.4 0.4 2.9 0.3
Lotto Lake MARQUETTE 1 33.39 3.2 1.4 0.2 0.5 0.6 0.9 0.4
Hall Lake HOUGHTON 1 16.88 1.8 0.4 0.3 0.3 0.2 1.8 0.2
Sullivan Lake WASHTENAW 1 349.5 44.1 13.4 4.6 1.3 8.7 10.9 9.3
St. Kathryn IRON 1 85.33 11.6 2.7 0.8 0.3 2.5 2.6 0.4
Lake Ottawa IRON 1 231.1 30.2 10.7 1.5 0.6 7.8 6.0 0.6
Appendix 1d. NLA-Michigan Lakes: Conductivity, Cations, and Anions.


![Great Lakes. The Five Great Lakes Lake Michigan [ touches Michigan] Lake Michigan [ touches Michigan] Lake Erie [touches Michigan] Lake Erie [touches](https://img.pdfslide.us/doc/110x75/56649dca5503460f94ac1371/great-lakes-the-five-great-lakes-lake-michigan-touches-michigan-lake-michigan.jpg)