Embed Size (px)
Citation preview

8/3/2019 Michel.paul.110907 1436.Toronto TR 2011 037 Finalrev
http://slidepdf.com/reader/full/michelpaul110907-1436toronto-tr-2011-037-finalrev 1/54
Sleep and Modeled Performance of ArcticPatrollers during Operation Nunalivut 2010
Michel A. Paul
Fethi Bouak
Defence R&D Canada
Technical Memorandum
DRDC Toronto TM 2011-037
July 2011

8/3/2019 Michel.paul.110907 1436.Toronto TR 2011 037 Finalrev
http://slidepdf.com/reader/full/michelpaul110907-1436toronto-tr-2011-037-finalrev 2/54
8/3/2019 Michel.paul.110907 1436.Toronto TR 2011 037 Finalrev
http://slidepdf.com/reader/full/michelpaul110907-1436toronto-tr-2011-037-finalrev 3/54
Sleep and Modeled Performance of ArcticPatrollers during Operation Nunalivut 2010
Michel A. Paul
Fethi Bouak
Defence R&D Canada – TorontoTechnical Report
DRDC Toronto TR 2011-037
July 2011

8/3/2019 Michel.paul.110907 1436.Toronto TR 2011 037 Finalrev
http://slidepdf.com/reader/full/michelpaul110907-1436toronto-tr-2011-037-finalrev 4/54
Principal Author
Michel A. PaulDefence Scientist
Approved by
Stephen Boyne
Head, Individual Behaviour and Performance Section
Approved for release by
Dr. Stergios Stergiopoulos
Acting Chair, Knowledge and Information Management Committee
Acting Chief Scientist
In conducting the research described in this report, the investigators adhered to the policies and procedures set out in the Tri-Council Policy Statement: Ethical conduct for research involvinghumans, National Council on Ethics in Human Research, Ottawa, 1998 as issued jointly by theCanadian Institutes of Health Research, the Natural Sciences and Engineering Research Council
of Canada and the Social Sciences and Humanities Research Council of Canada.
© Her Majesty the Queen in Right of Canada, as represented by the Minister of National Defence, 2011
© Sa Majesté la Reine (en droit du Canada), telle que représentée par le ministre de la Défense nationale,
2011

8/3/2019 Michel.paul.110907 1436.Toronto TR 2011 037 Finalrev
http://slidepdf.com/reader/full/michelpaul110907-1436toronto-tr-2011-037-finalrev 5/54
DRDC Toronto TR 2011-037 i
Abstract ……..
Background: The goal of this work was to monitor sleep (via wrist actigraphs) in Arctic patrollers and generate cognitive effectiveness models for each patroller using a program called
Fatigue Avoidance Scheduling Tool (FAST
TM
). Methods: Actigraphic data were collected from23 Arctic patrollers of whom 3 were Inuit Rangers (who ranged from 25 to 62 years of age), fromone ranger instructor (48 years of age) and from 19 troops who were freshly deployed from
various regions across southern Canada (who ranged from 21 to 54 years of age). The patrolsranged from 5 to 14 days in duration. Sleep data were recorded for several days at Canadian
Forces Station Alert prior to departing on patrol and throughout the patrols. The following sleep parameters (primary sleep period minutes, total daily sleep minutes, number of daily naps, dailynap minutes, sleep latency in minutes, number of sleep episodes in the primary sleep period, andWASO (Wake After Sleep Onset) in minutes) were recorded and graphed for each day as well asaveraged over 16 days. Total daily sleep minutes along with daily work periods were inputted to
FASTTM to generate models of cognitive effectiveness for each of the 23 Arctic patrollers.Results and Discussion: Inuit Rangers obtained more sleep in their primary sleep periods, have
fewer sleep episodes and have less wake time within their primary sleep periods than their freshlydeployed counterparts. On several days the FAST
TMmodels for 2 of the 3 Inuit Rangers predicted
levels of performance equivalent to a blood alcohol content of 0.05%. The FASTTM models for 14
freshly deployed soldiers predicted more work periods spent at 0.05% and at 0.08% blood alcoholcontent than their Inuit Ranger counterparts. Conclusions: All Arctic patrollers require sufficient
sleep to avoid impaired performance. Planners who set the Operational Tempo for Arcticexercises should understand the impact that insufficient sleep can have on operational readiness,and plan accordingly, to the extent possible.
Résumé ….....
Contexte : Les présents travaux visaient à surveiller le sommeil (à l’aide de braceletsactigraphes) chez des patrouilleurs de l’Arctique et à produire des modèles de l’efficacitécognitive pour chaque patrouilleur en utilisant un programme appelé Fatigue Avoidance
Scheduling Tool (FASTTM). Méthodes : Les données actigraphiques de 23 patrouilleurs del’Arctique, qui comprenaient 3 Rangers inuits (âgés de 25 à 62 ans), un instructeur ranger (âgé de
48 ans) et 19 soldats (âgés de 21 à 54 ans) nouvellement déployés depuis diverses régions dans lesud du Canada, ont été recueillies. Les patrouilles se sont échelonnées sur une période 5 à 14
jours. Les données sur le sommeil ont été consignées pendant plusieurs jours à la station des
Forces canadiennes Alerte avant le départ pour la patrouille et pendant les patrouilles. Les paramètres suivants sur le sommeil ont été consignés et reproduits sous forme de graphiques pour
chaque journée, et les moyennes ont été établies sur 16 jours : principales périodes de sommeil en
minutes, durée totale du sommeil quotidien en minutes, nombre de siestes quotidiennes, durée dessiestes quotidiennes en minutes, latence du sommeil en minutes, nombre d’épisodes de sommeildans la principale période de sommeil et temps d’éveil en minutes. La durée totale de sommeilquotidien en minutes ainsi que les périodes de travail quotidiennes ont été saisies dans le logiciel
FASTTM afin de produire des modèles de l’efficacité cognitive pour chacun des 23 patrouilleursde l’Arctique. Résultats et analyses : Les Rangers inuits ont dormi davantage dans leurs

8/3/2019 Michel.paul.110907 1436.Toronto TR 2011 037 Finalrev
http://slidepdf.com/reader/full/michelpaul110907-1436toronto-tr-2011-037-finalrev 6/54
ii DRDC Toronto TR 2011-037
principales périodes de sommeil, ils avaient moins d’épisodes de sommeil et un temps d’éveilmoindre dans leurs principales périodes de sommeil que leurs vis-à-vis nouvellement déployés.Sur plusieurs jours, les modèles FASTTM pour 2 des 3 Rangers inuits prédisent des niveaux derendement équivalent à un taux d’alcoolémie de 0,05 %. Les modèles FASTTM pour 14 soldats
nouvellement déployés prédisent davantage de périodes de travail effectuées avec un tauxd’alcoolémie de 0,05 % et de 0,08 % que leurs vis-à-vis Rangers inuits. Conclusions : Tous les
patrouilleurs de l’Arctique doivent dormir suffisamment pour éviter une baisse de rendement. Les planificateurs qui établissent le rythme opérationnel pour les exercices dans l’Arctique doiventcomprendre les répercussions du manque de sommeil sur l’état de préparation opérationnelle et
planifier en conséquence, dans la mesure du possible.

8/3/2019 Michel.paul.110907 1436.Toronto TR 2011 037 Finalrev
http://slidepdf.com/reader/full/michelpaul110907-1436toronto-tr-2011-037-finalrev 7/54
DRDC Toronto TR 2011-037 iii
Executive summary
Sleep and Modeled Performance of Arctic Patrollers duringOperation Nunalivut 2010:
Michel A. Paul; Fethi Bouak; DRDC Toronto TR 2011-037; Defence R&D Canada – Toronto; July 2011.
Introduction: The goal of this work was to monitor sleep (via wrist actigraphs) in Arctic patrollers and generate cognitive effectiveness models for each patroller using a program calledFatigue Avoidance Scheduling Tool (FASTTM). Actigraphic data were collected from 23 Arctic
patrollers of whom 3 were Inuit Rangers, one was a Ranger instructor and 19 were troops freshly
deployed from various regions across southern Canada. The patrols ranged from 5 to 14 days induration. Sleep data were recorded for several days at Canadian Forces Station Alert prior todeparting on patrol and throughout the patrols.
Results: Inuit Rangers obtained more sleep in their primary sleep periods, have fewer sleepepisodes and have less wake time within their primary sleep periods than their freshly deployedcounterparts. On several days, the FASTTM models for 2 of the 3 Inuit Rangers predicted levels of
performance equivalent to a blood alcohol content of 0.05%. The FASTTM models for 14 freshlydeployed soldiers predicted more work periods spent at 0.05% and at 0.08% blood alcohol
content than their Inuit Ranger counterparts.
Significance: All Arctic patrollers require sufficient sleep to avoid impaired performance. In
some cases, the Operational Tempo of Arctic Exercises may preclude sufficient sleep.
Future plans: Planners who set the Operational Tempo for Arctic exercises should understandthe impact that insufficient sleep can have on operational readiness, and plan accordingly, to the
extent possible. To improve Arctic operational readiness, it is highly desirable that defence
scientists be invited to participate in the planning stages for all Arctic operations. This will allowthe Canadian Forces to exploit scientific opportunities for improvement of Arctic operationalreadiness.

8/3/2019 Michel.paul.110907 1436.Toronto TR 2011 037 Finalrev
http://slidepdf.com/reader/full/michelpaul110907-1436toronto-tr-2011-037-finalrev 8/54
iv DRDC Toronto TR 2011-037
Sommaire .....
Modélisation du rendement des patrouilleurs de l'Arctiquependant l'opération Nunalivut 2010 :
Michel A. Paul; Fethi Bouak; DRDC Toronto TR 2011-037; R & D pour la défenseCanada – Toronto; Juillet 2011.
Introduction ou contexte: Les présents travaux visaient à surveiller le sommeil (à l’aide de bracelets actigraphes) chez des patrouilleurs de l’Arctique et à produire des modèles del’efficacité cognitive pour chaque patrouilleur en utilisant un programme appelé FatigueAvoidance Scheduling Tool (FASTTM). Les données actigraphiques de 23 patrouilleurs de
l’Arctique, qui comprenaient 3 Rangers inuits, un instructeur ranger et 19 soldats nouvellementdéployés depuis diverses régions dans le sud du Canada, ont été recueillies. Les patrouilles se sontéchelonnées sur une période de 5 à 14 jours. Les données sur le sommeil ont été consignées
pendant plusieurs jours à la station des Forces canadiennes Alerte avant le départ pour la patrouille et pendant les patrouilles.
Résultats: Les Rangers inuits ont dormi davantage dans leurs principales périodes de sommeil,ils avaient moins d’épisodes de sommeil et un temps d’éveil moindre dans leurs principales
périodes de sommeil que leurs vis-à-vis nouvellement déployés. Sur plusieurs jours, les modèles
FASTTM pour 2 des 3 Rangers inuits prédisent des niveaux de rendement équivalent à un tauxd’alcoolémie de 0,05 %. Les modèles FAST
TM pour 14 soldats nouvellement déployés prédisent
davantage de périodes de travail effectuées avec un taux d’alcoolémie de 0,05 % et de 0,08 % queleurs vis-à-vis Rangers inuits.
Importance: Tous les patrouilleurs de l’Arctique doivent dormir suffisamment pour éviter une baisse de rendement. Dans certains cas, le rythme opérationnel pour les exercices dans l’Arctique peut prévenir le manque de sommeil chez les patrouilleurs.
Perspectives: Les planificateurs qui établissent le rythme opérationnel pour les exercices dansl’Arctique doivent comprendre les répercussions du manque de sommeil sur l’état de préparation
opérationnelle et planifier en conséquence, dans la mesure du possible. Afin d’améliorer l’état de préparation opérationnelle dans l’Arctique, il est fortement souhaitable que les scientifiques duMDN soient invités à participer aux phases de planification de toutes les opérations dans
l’Arctique. Cela permettra aux FC d’exploiter les occasions scientifiques d’améliorer l’état de préparation opérationnelle dans l’Arctique.

8/3/2019 Michel.paul.110907 1436.Toronto TR 2011 037 Finalrev
http://slidepdf.com/reader/full/michelpaul110907-1436toronto-tr-2011-037-finalrev 9/54
DRDC Toronto TR 2011-037 v
Table of contents
Abstract …….. ................................................................................................................................. i
Résumé …..... ................................................................................................................................... i
Executive summary ........................................................................................................................ iii
Sommaire ..... .................................................................................................................................. iv
Table of contents ............................................................................................................................. v
List of figures ................................................................................................................................. vi
1 Background ............................................................................................................................... 1
2 Methods .................................................................................................................................... 2
2.1 Arctic patroller participants ........................................................................................... 2
2.1.1 Patroller age demographics ............................................................................. 2
2.1.2 Number of days on patrol ................................................................................ 2
2.2 FAST TM modeling program .......................................................................................... 3
3 Results....................................................................................................................................... 4
3.1 Wrist actigraphically-measured sleep ............................................................................ 4
3.1.1 Graphs of sleep parameters over 16 days ........................................................ 4
3.1.2 Graphs of daily sleep parameters averaged over 16 days ............................... 8
3.2 Modeled Cognitive Performance with FASTTM .......................................................... 11
3.2.1 Modeled performance of each of the 3 High Arctic Ranger subjects ........... 12
3.2.2 Modeled performance of the Instructor ......................................................... 13
3.2.3 Model performance of each of the Freshly deployed soldiers ...................... 14
4 Discussion ............................................................................................................................... 24
5
Conclusions............................................................................................................................. 26
References ..... ............................................................................................................................... 27
Annex A ..Sleep, Activity, Fatigue and Task Effectiveness (SAFTE) Model .............................. 29
A.1 Fatigue Avoidance Scheduling Tool ( FAST TM) ........................................................... 29
References ................................................................................................................... 33
List of symbols .............................................................................................................................. 35
Distribution list .............................................................................................................................. 37

8/3/2019 Michel.paul.110907 1436.Toronto TR 2011 037 Finalrev
http://slidepdf.com/reader/full/michelpaul110907-1436toronto-tr-2011-037-finalrev 10/54
vi DRDC Toronto TR 2011-037
List of figures
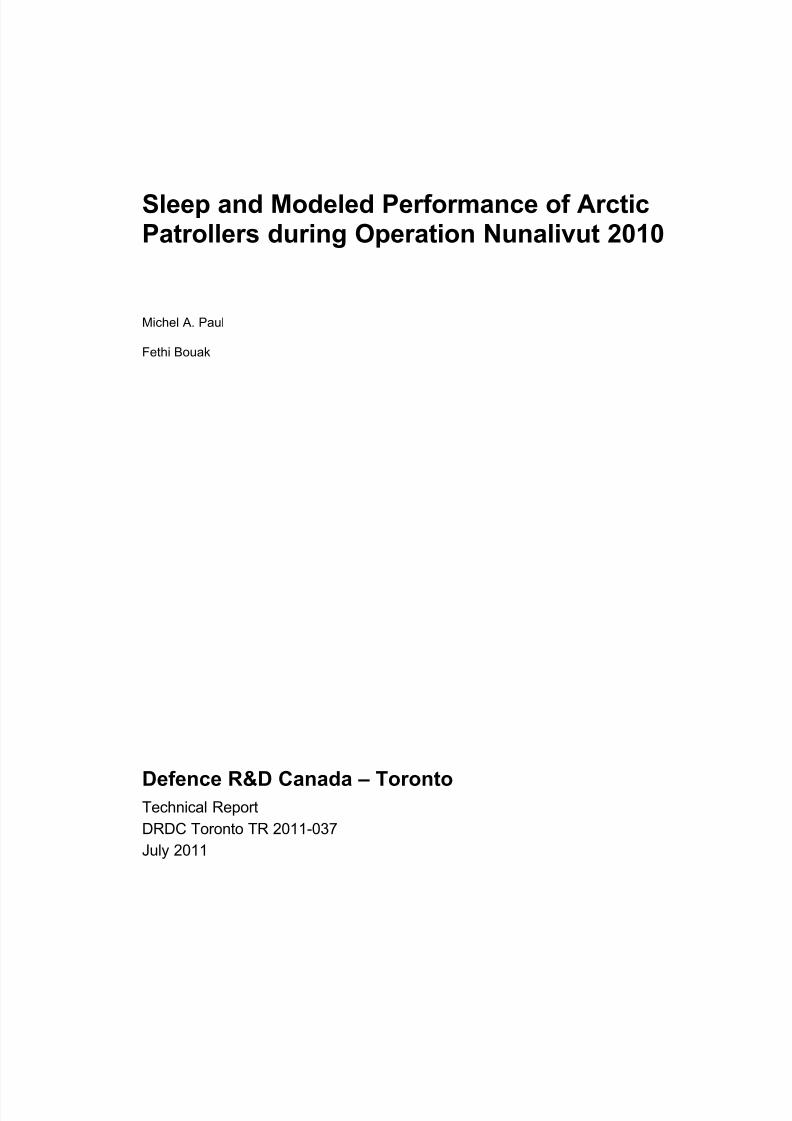
Figure 1: Average sleep minutes during main daily sleep period over 16 days across Rangers,Instructor, and freshly deployed soldiers). On Days 9, 10, and 11, all three subject
types appear to obtain similar sleep patterns during the main sleep period.However, during other days, differences in sleep minutes are evident between thethree subject types. ........................................................................................................ 4
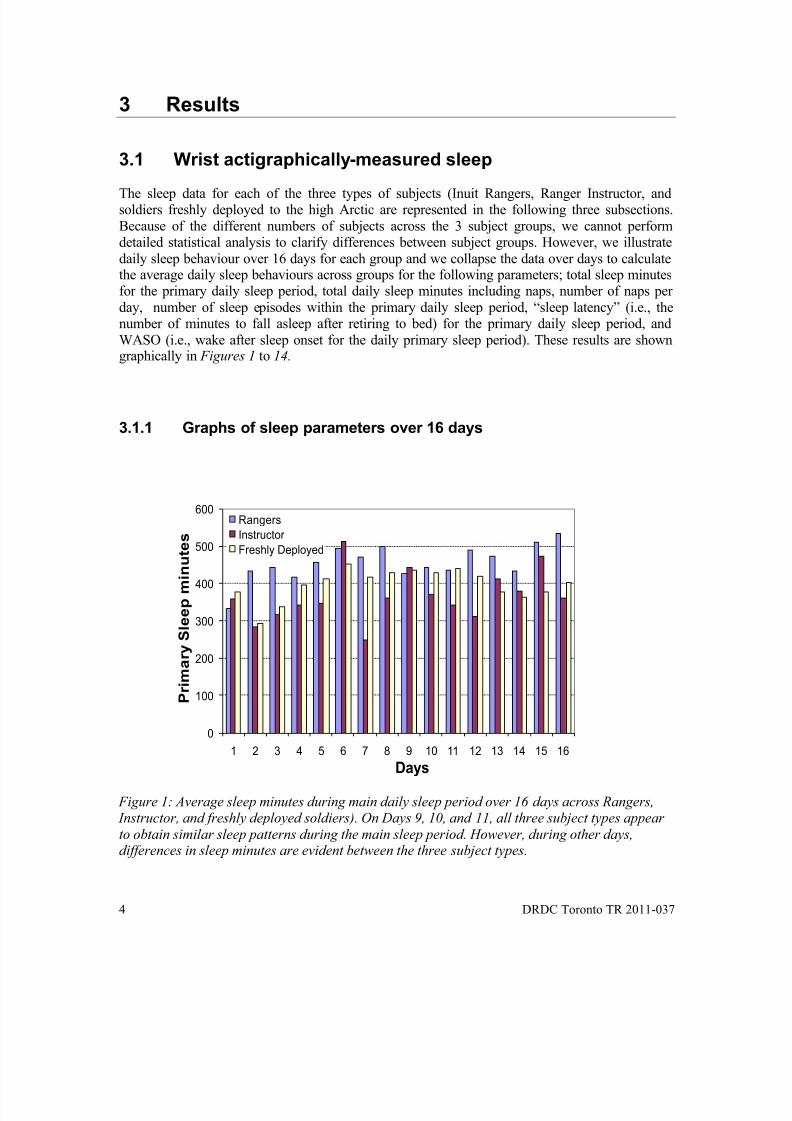
Figure 2: Average total daily sleep (i.e., main sleep period + naps) over 16 days across the 3subject types. On Day 8, all subjects obtain similar total sleep. Otherwise, thereare differences across the subject types (Rangers, Instructor and freshly deployedsoldiers). ........................................................................................................................ 5
Figure 3: Average number of daily naps over 16 days across the 3 subject types. On Days 1
and 7, only the freshly deployed soldiers napped. On Days 2, 3, 6 and 13 allsubjects napped. ............................................................................................................ 5
Figure 4: Average number of daily nap minutes over 16 days across the 3 subject types. On
Days 1 and 7, only the freshly deployed soldiers napped. On Days 2, 3, 6 and 13,all subjects napped. ....................................................................................................... 6
Figure 5: Average sleep latency (i.e., number of minutes to fall asleep after retiring to bed)over 16 days across the 3 subject types. ........................................................................ 6
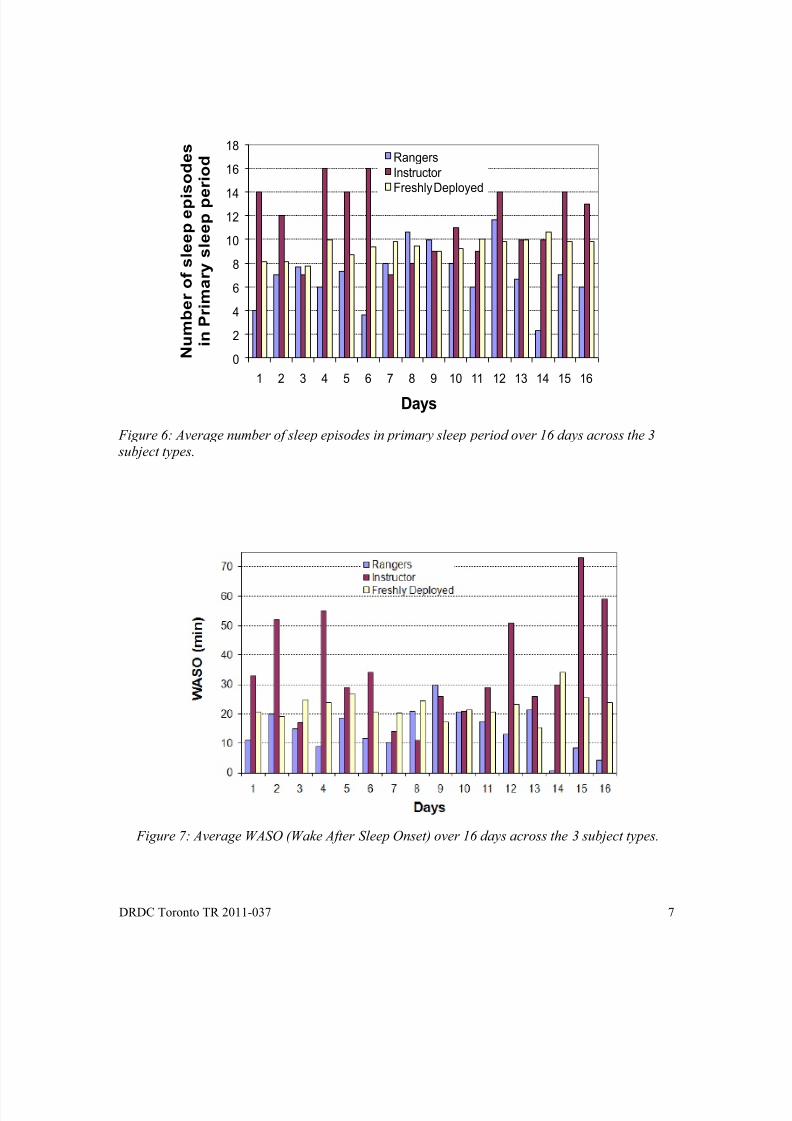
Figure 6: Average number of sleep episodes in primary sleep period over 16 days across the 3subject types. ................................................................................................................. 7
Figure 7: Average WASO (Wake After Sleep Onset) over 16 days across the 3 subject types. ..... 7
Figure 8: Average primary sleep minutes during main daily sleep period across Rangers,Instructor, and freshly deployed soldiers. ..................................................................... 8
Figure 9: Average total daily sleep minutes (i.e, primary sleep plus naps) across Rangers,
Instructor, and freshly deployed soldiers. ..................................................................... 8
Figure 10: Average total number of daily naps across Rangers, Instructor, and freshlydeployed soldiers. .......................................................................................................... 9
Figure 11: Average total daily nap minutes across Rangers, Instructor, and freshly deployedsoldiers. ......................................................................................................................... 9
Figure 12: Average total daily sleep latency (i.e., number of minutes to fall asleep after
retiring to bed) across Rangers, Instructor, and freshly deployed soldiers. ................ 10
Figure 13: Average total daily number of sleep episodes across Rangers, Instructor, andfreshly deployed soldiers. ............................................................................................ 10
Figure 14: Average total daily WASO across Rangers, Instructor, and freshly deployedsoldiers. ....................................................................................................................... 11
Figure 15: This Ranger (Subject 1) had better sleep hygiene and therefore better modeled performance after leaving CFS Alert for patrol duties relative to before patrol inCFS Alert. He averaged 7 hours and 57 minutes of sleep per day. His mean

8/3/2019 Michel.paul.110907 1436.Toronto TR 2011 037 Finalrev
http://slidepdf.com/reader/full/michelpaul110907-1436toronto-tr-2011-037-finalrev 11/54
DRDC Toronto TR 2011-037 vii
cognitive effectiveness during work ranged from 85.8% to 98.2% and averaged93.4%. ......................................................................................................................... 12
Figure 16: This Ranger (Subject 3) averaged 7 hours and 47 minutes of sleep per day. Hismean cognitive effectiveness during work ranged from 72.0 % to 98.5% andaveraged 89.6%. However, 4 days into his patrol, his work performance reached a
nadir of about 68% (BAC higher than 0.08%), and he spent 95% of his work timeon that day below criterion for blood alcohol equivalent to 0.05%. ........................... 12
Figure 17: This Ranger (Subject 4) averaged 6 hours and 47 minutes of sleep per day. Hismean cognitive effectiveness during work ranged from 80.9 % to 98.2% andaveraged 88.2%. In the three days at CFS Alert prior to patrol duties, he shows alinearly decreasing pattern of daily sleep and performance, then sleep and
performance slowly recovers over the next 3 days. Performance started to fall
again over the next 5 days and slowly recovered over the subsequent 5 days, alldue to changes in sleep hygiene. ................................................................................. 13
Figure 18: This Instructor (Subject 6) obtained an average of 6 hours and 6 minutes of sleep per day. His limited and irregular sleep reflects his role as a patrol leader who was
responsible for ensuring a smoothly running patrol including communicatingsitreps and receiving taskings by radio (from personal communications with thisInstructor). He spent 100% of 3 days of work periods below criterion for a BAC
level of 0.05% and reached equivalence to a BAC level of 0.08% on 4 days............. 13
Figure 19: This freshly deployed soldier (Subject 7) obtained an average of 6 hours and 15minutes of sleep per day. His mean cognitive effectiveness during work periodsranged from 75.4 % to 100 % and averaged 84.7%. His worst work period wassplit between April 21st (48% of the work period spent a performance levels below
criterion for intoxication to a BAC of 0.05% and 3.5% of the time below BAC =0.08%) and April 22nd (62.4% of the work period spent at performance levels
below criterion for intoxication to a BAC level of 0.05% and 17% below criterionfor BAC= 0.08%). ....................................................................................................... 14
Figure 20: This freshly deployed soldier (Subject 8) obtained an average of 8 hours and 17minutes of sleep per day. His mean cognitive effectiveness during work periodsranged from 89.2 % to 98.3 % and averaged 93.6%. He did not spend any
significant time at performance levels equivalent to intoxicated levels of BAC. ....... 14
Figure 21: Subject 9 did not participate in a patrol and remained at CFS Alert for the durationof the exercise. He obtained an average of 6 hours and 1 minute of sleep per day.His mean cognitive effectiveness during work periods ranged from 78.0% to 97.7and averaged 83.3%. He did not spend any significant time at performance levels
equivalent to intoxicated levels of BAC. During 4 days, his performance attained61% to 65% during which time he was performing as though he were intoxicatedwell beyond a BAC equivalent of 0.08%. ................................................................... 15
Figure 22: Subject 11 obtained an average of 7 hours and 8 minutes of sleep per day. Hismean cognitive effectiveness during work hours ranged from 75.1 % to 98.1 %
and averaged 88.1 %. He had 4 work days where his cognitive effectiveness wasequivalent to BAC of 0.05% or higher. On his worst day (April 18), 91.8% of his
first work period of the day was spent at a BAC equivalent of 0.05% or higher. ....... 15

8/3/2019 Michel.paul.110907 1436.Toronto TR 2011 037 Finalrev
http://slidepdf.com/reader/full/michelpaul110907-1436toronto-tr-2011-037-finalrev 12/54
viii DRDC Toronto TR 2011-037
Figure 23: Subject 12 obtained an average of 9 hours and 8 minutes of sleep per day. Hismean cognitive effectiveness during work hours ranged from 82.7 % to 98.3 %and averaged 92.4 %. He had 2 work days where his cognitive effectiveness wasequivalent to BAC of 0.05% or higher. On his worst day (April 11), 15.47% of his
work period was spent at a BAC equivalent of 0.05% or higher and 8.3 % of thatwork period was spent at a BAC equivalent of 0.08% or higher. ............................... 16
Figure 24: Subject 13 obtained an average of 7 hours and 31 minutes of sleep per day. His
mean cognitive effectiveness during work hours ranged from 86.0% to 98.1% andaveraged 91.6%. None of his work periods involved performance equivalent to
intoxicated levels of blood alcohol. ............................................................................. 16
Figure 25: Subject 14 obtained an average of 7 hours and 7 minutes of sleep per day. Hismean cognitive effectiveness during work hours ranged from 65.3% to 98.0% and
averaged 86.0%. He had 7 work periods where his performance was impairedequivalent to various BAC levels. One hundred percent of duration of the firstwork period of April 23rd
and the first 2 work periods of April 25th
were spent at performance equivalent to a BAC of 0.08 or higher. .................................................. 17
Figure 26: Subject 16 obtained an average of 8 hours and 29 minutes of sleep per day. Hismean cognitive effectiveness during work hours ranged from 79.4% to 98.2% andaveraged 91.7%. His performance did not fall to levels equivalent to significant
BAC levels. On his 3rd day at CFS Alert (April 10), he had multiple short sleep periods and therefore very broken sleep. .................................................................... 17
Figure 27: Subject 17 obtained an average of 7 hours and 4 minutes of sleep per day. Hismean cognitive effectiveness during work hours ranged from 76.3% to 98.2% andaveraged 87.9%. He had 7 work periods where his performance fell to levels
equivalent to a BAC of 0.05%. During 4 of those 7 work periods, his performancedropped to levels equivalent to a BAC of 0.08%. On his 3 rd day at CFS Alert
(April 10 - 11), this subject also had multiple short sleep periods and thereforevery broken sleep. ....................................................................................................... 18
Figure 28: Subject 18 obtained an average of 7 hours and 17 minutes of sleep per day. Hismean cognitive effectiveness during work hours ranged from 73.8% to 98.2% andaveraged 86.6%. He had 7 work periods where his performance fell to levels
equivalent to BAC of 0.05%. During one of these work periods (April 22nd), his performance fell to 57% (beyond the limit of the BAC scale of FAST
TM). At this
level of performance, no one can perform well on any task. On his 3rd
day at CFSAlert (April 10 - 11), this subject also had multiple short sleep periods andtherefore very broken sleep. ........................................................................................ 18
Figure 29: Subject 19 obtained an average of 7 hours and 17 minutes of sleep per day. Hismean cognitive effectiveness during work hours ranged from 78.7% to 98.2% andaveraged 88.3%. He had 7 work periods where his performance fell to levels
equivalent to a BAC of 0.05%. During two of these work periods (April 15th
and22nd), his performance fell to the pink zone of this graph (i.e., beyond the limit of
the BAC scale of FAST TM). At this level of performance, no one can performwell on any task. This subject also shows evidence of broken sleep at CFS Alert
on the night of April 10 - 11. ....................................................................................... 19

8/3/2019 Michel.paul.110907 1436.Toronto TR 2011 037 Finalrev
http://slidepdf.com/reader/full/michelpaul110907-1436toronto-tr-2011-037-finalrev 13/54
DRDC Toronto TR 2011-037 ix
Figure 30: Subject 20 obtained an average of 7 hours and 27 minutes of sleep per day. Hismean cognitive effectiveness during work hours ranged from 76.7% to 98.2% andaveraged 89.2%. He had 4 work periods where his performance fell to levelsequivalent to a BAC of 0.05%. During the morning work period of April 22nd his
performance fell to an equivalence of BAC of 0.08%. This subject also showsevidence of broken sleep at CFS Alert on the night of April 10 - 11. ......................... 19
Figure 31: Subject 21 obtained an average of 7 hours and 53 minutes of sleep per day. His
mean cognitive effectiveness during work hours ranged from 82.2% to 98.2% andaveraged 93.1%. None of his work periods were carried at performance levelsassociated with significant levels of BAC. .................................................................. 20
Figure 32: Subject 22 obtained an average of 6 hours and 47 minute3s of sleep per day. Hismean cognitive effectiveness during work hours ranged from 79.3% to 92.7% and
averaged 87.3%.He had 3 work periods (pre patrol on April 4th, and during patrolon each of April 12th, and April 21st) during which modeled performance reached
levels equivalent to a BAC level of 0.05%. ............................................................... 20
Figure 33: Subject 23 obtained an average of 7 hours and 35 minutes of sleep per day. Hismean cognitive effectiveness during work hours ranged from 81.7% to 98.4% andaveraged 90.7%.He had a single work period on patrol (April 21st), during whichmodeled performance reached levels equivalent to a BAC of 0.05%. ........................ 21
Figure 34: Subject 24 obtained an average of 7 hours and 23 minutes of sleep per day. Hismean cognitive effectiveness during work hours ranged from 87.3% to 97.8% and
averaged 91.8%. He had a single period on patrol on April 22nd
during whichmodeled performance reached levels equivalent to a BAC of 0.05%. ........................ 21
Figure 35: Subject 25 obtained an average of 8 hours and 7 minutes of sleep per day. Hismean cognitive effectiveness during work hours ranged from 88.1% to 98.4% andaveraged 93.8%. None of his work periods involved modeled performance
equivalent to significant BAC levels. .......................................................................... 22
Figure 36: Subject 26 obtained an average of 6 hours and 56 minutes of sleep per day. Hismean cognitive effectiveness during work hours ranged from 62.3% to 98.2% andaveraged 81.4%. On 3 occasions, his performance dropped into the pink zonereaching 58% to 60 % cognitive effectiveness where no one can perform well on
any task. Of 37 total work periods, he spent 18 at a performance level equivalentto a BAC of 0.05% or higher and in 9 of those work periods his performancereached levels associated with BAC of 0.08% and worse........................................... 22
Figure 37: Subject 27 obtained an average of 6 hours and 6 minutes of sleep per day. Hismean cognitive effectiveness during work hours ranged from 61.6% to 98.1% and
averaged 80.3%. During patrol, on 4 occasions, his performance dropped into the pink zone reaching 43% to 57% cognitive effectiveness where no one can performwell on any task. Of 37 total work periods, he spent 18 at a performance
equivalent to a BAC level of 0.05% or higher, and in 6 of those work periods, his performance reach levels associated with a BAC of 0.08% or worse. ........................ 23

8/3/2019 Michel.paul.110907 1436.Toronto TR 2011 037 Finalrev
http://slidepdf.com/reader/full/michelpaul110907-1436toronto-tr-2011-037-finalrev 14/54
x DRDC Toronto TR 2011-037
This page intentionally left blank.

8/3/2019 Michel.paul.110907 1436.Toronto TR 2011 037 Finalrev
http://slidepdf.com/reader/full/michelpaul110907-1436toronto-tr-2011-037-finalrev 15/54

8/3/2019 Michel.paul.110907 1436.Toronto TR 2011 037 Finalrev
http://slidepdf.com/reader/full/michelpaul110907-1436toronto-tr-2011-037-finalrev 16/54
2 DRDC Toronto TR 2011-037
2 Methods
2.1 Arctic patroller participants
A total of 27 participants agreed to wear a wrist actigraph (to measure their daily sleep) during Op Nunalivut and to maintain daily entries into a sleep log to protect against actigraph failure. An
actigraph is a small accelerometer about the size of a wrist watch and is worn on the wrist. Basedon a reduction algorithm, an actigraph provides a motion-based estimate of daily sleep
quantitatively to the nearest minutes for weeks at a time.
Of the 27 patrollers, 4 were native Inuit, 1 was a CF Ranger instructor who had been in the Arcticfor at least one year, and 22 were soldiers freshly deployed to the Arctic (mainly reservists, butalso 2 regular force Search and Rescue Technicians (SAR Techs)) from various bases acrossCanada.
Of the 4 native Inuit patrollers, 1 removed his actigraph after 2 days. One of the freshly deployed
soldiers wore his actigraph intermittently over several days and then stopped wearing italtogether. The actigraph of another freshly deployed soldier failed to function. What little data
are available from these 4 individuals is not part of this report. The remaining 23 participants aresplit across the 3 subject types as follows: 3 Inuit Rangers, 1 Ranger Instructor, and 19 personnelfreshly deployed from various bases across Canada.
2.1.1 Patroller age demographics
The 3 Inuit Rangers who completed the data collection ranged from 25 to 62 years of age andmean ± standard deviation was 45.3 ± 18.7 years of age.
The Ranger instructor who participated was 48 years of age. Of the 19 freshly deployed soldiers,
one declined to provide us his age and another soldier could not be reached for his date of birth.The remaining 17 freshly deployed soldiers whose ages we could obtain, ranged from 21 to 54years of age with a mean age ± standard deviation 28.9 ± 8.6 years.
2.1.2 Number of days on patrol
Of the 3 Inuit Rangers, 2 were on patrol for 11 days and the other for 12 days. The Ranger Instructor was on patrol for 14 days. Of the freshly deployed soldiers, 1 was on patrol for 5 days,4 were on patrol for 6 days, 3 were on patrol for 7 days, one was on patrol for 10 days, one was
on patrol for 11 days, 7 were on patrol for 12 days, one was on patrol for 13 days and one soldier remained at CFS Alert without going on patrol.

8/3/2019 Michel.paul.110907 1436.Toronto TR 2011 037 Finalrev
http://slidepdf.com/reader/full/michelpaul110907-1436toronto-tr-2011-037-finalrev 17/54
DRDC Toronto TR 2011-037 3
2.2 FAST TM modeling program
The wrist actigraphically-derived sleep data were used as inputs into a cognitive effectiveness
modeling program called Fatigue Avoidance Scheduling Tool (FAST)TM
to develop models of cognitive performance for each of the 23 participants.
A description of FASTTM is provided in Annex A. Some details regarding the graphs of thesemodels are as follows:
• The vertical axis on the left side of the FASTTM graphs represents human cognitive
performance effectiveness as a percentage of optimal performance (100%). Effectivenesshas a range from 100 (normal best) to 0 (worst case). The oscillating line in the diagramrepresents average performance (cognitive effectiveness) as determined by time of day,
biological rhythms, time spent awake, and amount of sleep.
• The dotted line which is below the cognitive effectiveness curve and follows a similar
oscillating pattern as the cognitive effectiveness curve represents the 10th percentile of cognitive effectiveness.
• The green band (from 90% to 100%) represents acceptable cognitive performanceeffectiveness for workers conducting safety sensitive jobs (flying, driving, weaponsoperation, command and control, etc.).
• The yellow performance band (from 65% to 90% cognitive effectiveness) indicates caution.
Personnel engaged in skilled performance activities such as aviation should not be allowed
to operate within this performance band.
• The area from the dotted line to the pink area represents the cognitive effectiveness
equivalent to the circadian nadir and a second day without sleep.
• The pink performance band (below 65%) represents performance effectiveness after 2 days
and a night of sleep deprivation. Under these conditions, no one can be expected to function
well on any task.
• A value of 77% cognitive effectiveness corresponds to a blood alcohol content (BAC) of
0.05% (legally impaired in some jurisdictions). A value of 70% cognitive effectivenesscorresponds to a BAC of 0.08% (legally impaired in most jurisdictions). These BACequivalency levels associated with sleep deprivation/fatigue are based on three important
studies [8-10].
• The abscissa (x-axis) illustrates periods of work (red bars), sleep (blue bars), darkness (gray
bars) and time of day in hours.
• The red triangles labelled C1 located just above the abscissa are event markers indicating
when each patroller departed from CFS Alert on Arctic Patrol.
8/3/2019 Michel.paul.110907 1436.Toronto TR 2011 037 Finalrev
http://slidepdf.com/reader/full/michelpaul110907-1436toronto-tr-2011-037-finalrev 18/54
8/3/2019 Michel.paul.110907 1436.Toronto TR 2011 037 Finalrev
http://slidepdf.com/reader/full/michelpaul110907-1436toronto-tr-2011-037-finalrev 19/54
DRDC Toronto TR 2011-037 5
0
100
200
300
400
500
600
700
1 2 3 4 5 6 7 8 9 10 11 12 13 14 15 16
T o t a l D a i l y S l e e p m i n
u t e s
Days
RangersInstructor Freshly Deployed
Figure 2: Average total daily sleep (i.e., main sleep period + naps) over 16 days across the 3 subject types. On Day 8, all subjects obtain similar total sleep. Otherwise, there are differencesacross the subject types (Rangers, Instructor and freshly deployed soldiers).
Figure 3: Average number of daily naps over 16 days across the 3 subject types. On Days 1 and 7, only the freshly deployed soldiers napped. On Days 2, 3, 6 and 13, all subjects napped.

8/3/2019 Michel.paul.110907 1436.Toronto TR 2011 037 Finalrev
http://slidepdf.com/reader/full/michelpaul110907-1436toronto-tr-2011-037-finalrev 20/54
6 DRDC Toronto TR 2011-037
0.00
20.00
40.00
60.00
80.00
100.00
120.00140.00
160.00
180.00
200.00
1 2 3 4 5 6 7 8 9 10 11 12 13 14 15 16
D a i l y n a p m i n u
t e s
Days
Rangers
Instructors
Freshly Deployed
Figure 4: Average number of daily nap minutes over 16 days across the 3 subject types. On Days1 and 7, only the freshly deployed soldiers napped. On Days 2, 3, 6 and 13, all subjects napped.
0.00
10.00
20.00
30.00
40.00
50.00
60.00
1 2 3 4 5 6 7 8 9 10 11 12 13 14 15 16
S l e e p L a t e n c y ( m i n )
Days
Rangers
Instructor
Freshly deployed
Figure 5: Average sleep latency (i.e., number of minutes to fall asleep after retiring to bed) over
16 days across the 3 subject types.
8/3/2019 Michel.paul.110907 1436.Toronto TR 2011 037 Finalrev
http://slidepdf.com/reader/full/michelpaul110907-1436toronto-tr-2011-037-finalrev 21/54
DRDC Toronto TR 2011-037 7
0
2
4
6
8
10
12
14
16
18
1 2 3 4 5 6 7 8 9 10 11 12 13 14 15 16
N u m b e r o f s l e e p e p i s o d e s
i n P r i m a r y s l e e p p e
r i o d
Days
Rangers
Instructor Freshly Deployed
Figure 6: Average number of sleep episodes in primary sleep period over 16 days across the 3
subject types.
Figure 7: Average WASO (Wake After Sleep Onset) over 16 days across the 3 subject types.

8/3/2019 Michel.paul.110907 1436.Toronto TR 2011 037 Finalrev
http://slidepdf.com/reader/full/michelpaul110907-1436toronto-tr-2011-037-finalrev 22/54
8 DRDC Toronto TR 2011-037
3.1.2 Graphs of daily sleep parameters averaged over 16 days
250
300
350
400
450
500
P r i m a r y S l e e p m i n u t e s
Rangers Instructor Freshly
Deployed
Rangers
Instructor
Freshly Deployed
Figure 8: Average primary sleep minutes during main daily sleep period across Rangers,
Instructor, and freshly deployed soldiers.
300
350
400
450
500
T o t a l S l e e p m i n u
t e s
Rangers Instructor FreshlyDeployed
Rangers
Instructor
Freshly Deployed
Figure 9: Average total daily sleep minutes (i.e, primary sleep plus naps) across Rangers, Instructor, and freshly deployed soldiers.

8/3/2019 Michel.paul.110907 1436.Toronto TR 2011 037 Finalrev
http://slidepdf.com/reader/full/michelpaul110907-1436toronto-tr-2011-037-finalrev 23/54
DRDC Toronto TR 2011-037 9
Figure 10: Average total number of daily naps across Rangers, Instructor, and freshly deployed soldiers.
0
10
20
30
40
50
60
70
D a i l y n a p m i n u t e s
Rangers Instructor FreshlyDeployed
RangersInstructor
Freshly Deployed
Figure 11: Average total daily nap minutes across Rangers, Instructor, and freshly deployed
soldiers.

8/3/2019 Michel.paul.110907 1436.Toronto TR 2011 037 Finalrev
http://slidepdf.com/reader/full/michelpaul110907-1436toronto-tr-2011-037-finalrev 24/54
10 DRDC Toronto TR 2011-037
0
5
10
15
20
25
S l e e p L a t e n c y ( m i n
)
Rangers Instructor Freshly
Deployed
Rangers
Instructor Freshly Deployed
Figure 12: Average total daily sleep latency (i.e., number of minutes to fall asleep after retiring tobed) across Rangers, Instructor, and freshly deployed soldiers.
Figure 13: Average total daily number of sleep episodes across Rangers, Instructor, and freshlydeployed soldiers.

8/3/2019 Michel.paul.110907 1436.Toronto TR 2011 037 Finalrev
http://slidepdf.com/reader/full/michelpaul110907-1436toronto-tr-2011-037-finalrev 25/54
DRDC Toronto TR 2011-037 11
0
5
10
15
20
25
30
35
W A S O ( m i n )
Rangers Instructor Freshly
Deployed
RangersInstructor Freshly Deployed
Figure 14: Average total daily WASO across Rangers, Instructor, and freshly deployed soldiers.
3.2 Modeled Cognitive Performance with FASTTM
The sleep data for each of the three types of subjects, along with their work periods are the twodata streams inputted to FAST TM. Because we did not have access to the subjects either during or after Op Nunalivut we do not have their exact daily work periods. However, we decided to
commence all work periods one hour after awakening from the daily primary sleep period, andend all work periods one hour before commencing the daily primary sleep period. We also
commenced work periods 30 minutes after awakening from any nap and ended work periods 30minutes before any nap. A follow-up conversation with a Ranger Instructor confirmed that our
decisions around primary sleep and naps for “work-start” and “work-end” were appropriate.
The red triangle marked as C1 on the x-axis of the FAST TMmodels in Figures 15 to 37 represents
the date and time that each subject left CFS Alert for patrol duties.

8/3/2019 Michel.paul.110907 1436.Toronto TR 2011 037 Finalrev
http://slidepdf.com/reader/full/michelpaul110907-1436toronto-tr-2011-037-finalrev 26/54
12 DRDC Toronto TR 2011-037
3.2.1 Modeled performance of each of the 3 High Arctic Ranger subjects
Figure 15: This Ranger (Subject 1) had better sleep hygiene and therefore better modeled
performance after leaving CFS Alert for patrol duties relative to before patrol in CFS Alert. Heaveraged 7 hours and 57 minutes of sleep per day. His mean cognitive effectiveness during work
ranged from 85.8% to 98.2% and averaged 93.4%.
Figure 16: This Ranger (Subject 3) averaged 7 hours and 47 minutes of sleep per day. His meancognitive effectiveness during work ranged from 72.0 % to 98.5% and averaged 89.6%. However,4 days into his patrol, his work performance reached a nadir of about 68% (BAC higher than
0.08%), and he spent 95% of his work time on that day below criterion for blood alcohol equivalent to 0.05%.

8/3/2019 Michel.paul.110907 1436.Toronto TR 2011 037 Finalrev
http://slidepdf.com/reader/full/michelpaul110907-1436toronto-tr-2011-037-finalrev 27/54

8/3/2019 Michel.paul.110907 1436.Toronto TR 2011 037 Finalrev
http://slidepdf.com/reader/full/michelpaul110907-1436toronto-tr-2011-037-finalrev 28/54
14 DRDC Toronto TR 2011-037
3.2.3 Model performance of each of the Freshly deployed soldiers
Figure 19: This freshly deployed soldier (Subject 7) obtained an average of 6 hours and 15
minutes of sleep per day. His mean cognitive effectiveness during work periods ranged from 75.4% to 100 % and averaged 84.7%. His worst work period was split between April 21 st (48% of the
work period spent a performance levels below criterion for intoxication to a BAC of 0.05% and 3.5% of the time below BAC = 0.08%) and April 22nd (62.4% of the work period spent at
performance levels below criterion for intoxication to a BAC level of 0.05% and 17% belowcriterion for BAC= 0.08%).
Figure 20: This freshly deployed soldier (Subject 8) obtained an average of 8 hours and 17 minutes of sleep per day. His mean cognitive effectiveness during work periods ranged from 89.2% to 98.3 % and averaged 93.6%. He did not spend any significant time at performance levels
equivalent to intoxicated levels of BAC.

8/3/2019 Michel.paul.110907 1436.Toronto TR 2011 037 Finalrev
http://slidepdf.com/reader/full/michelpaul110907-1436toronto-tr-2011-037-finalrev 29/54
DRDC Toronto TR 2011-037 15
Figure 21: Subject 9 did not participate in a patrol and remained at CFS Alert for the duration of
the exercise. He obtained an average of 6 hours and 1 minute of sleep per day. His meancognitive effectiveness during work periods ranged from 78.0% to 97.7 and averaged 83.3%. He
did not spend any significant time at performance levels equivalent to intoxicated levels of BAC. During 4 days, his performance attained 61% to 65% during which time he was performing asthough he were intoxicated well beyond a BAC equivalent of 0.08%.
Figure 22: Subject 11 obtained an average of 7 hours and 8 minutes of sleep per day. His meancognitive effectiveness during work hours ranged from 75.1 % to 98.1 % and averaged 88.1 %. He had 4 work days where his cognitive effectiveness was equivalent to BAC of 0.05% or higher.
On his worst day (April 18), 91.8% of his first work period of the day was spent at a BAC equivalent of 0.05% or higher.

8/3/2019 Michel.paul.110907 1436.Toronto TR 2011 037 Finalrev
http://slidepdf.com/reader/full/michelpaul110907-1436toronto-tr-2011-037-finalrev 30/54
16 DRDC Toronto TR 2011-037
Figure 23: Subject 12 obtained an average of 9 hours and 8 minutes of sleep per day. His mean
cognitive effectiveness during work hours ranged from 82.7 % to 98.3 % and averaged 92.4 %. He had 2 work days where his cognitive effectiveness was equivalent to BAC of 0.05% or higher.On his worst day (April 11), 15.47% of his work period was spent at a BAC equivalent of 0.05%or higher and 8.3 % of that work period was spent at a BAC equivalent of 0.08% or higher.
Figure 24: Subject 13 obtained an average of 7 hours and 31 minutes of sleep per day. His meancognitive effectiveness during work hours ranged from 86.0% to 98.1% and averaged 91.6%. None of his work periods involved performance equivalent to intoxicated levels of blood alcohol.

8/3/2019 Michel.paul.110907 1436.Toronto TR 2011 037 Finalrev
http://slidepdf.com/reader/full/michelpaul110907-1436toronto-tr-2011-037-finalrev 31/54
DRDC Toronto TR 2011-037 17
Figure 25: Subject 14 obtained an average of 7 hours and 7 minutes of sleep per day. His meancognitive effectiveness during work hours ranged from 65.3% to 98.0% and averaged 86.0%. Hehad 7 work periods where his performance was impaired equivalent to various BAC levels. One
hundred percent of duration of the first work period of April 23rd and the first 2 work periods of April 25th were spent at performance equivalent to a BAC of 0.08 or higher.
Figure 26: Subject 16 obtained an average of 8 hours and 29 minutes of sleep per day. His meancognitive effectiveness during work hours ranged from 79.4% to 98.2% and averaged 91.7%. His performance did not fall to levels equivalent to significant BAC levels. On his 3
rd day at CFS
Alert (April 10), he had multiple short sleep periods and therefore very broken sleep.

8/3/2019 Michel.paul.110907 1436.Toronto TR 2011 037 Finalrev
http://slidepdf.com/reader/full/michelpaul110907-1436toronto-tr-2011-037-finalrev 32/54

8/3/2019 Michel.paul.110907 1436.Toronto TR 2011 037 Finalrev
http://slidepdf.com/reader/full/michelpaul110907-1436toronto-tr-2011-037-finalrev 33/54
DRDC Toronto TR 2011-037 19
Figure 29: Subject 19 obtained an average of 7 hours and 17 minutes of sleep per day. His mean
cognitive effectiveness during work hours ranged from 78.7% to 98.2% and averaged 88.3%. Hehad 7 work periods where his performance fell to levels equivalent to a BAC of 0.05%. During
two of these work periods (April 15th
and 22nd
), his performance fell to the pink zone of this graph(i.e., beyond the limit of the BAC scale of FAST TM ). At this level of performance, no one can perform well on any task. This subject also shows evidence of broken sleep at CFS Alert on the
night of April 10 - 11.
Figure 30: Subject 20 obtained an average of 7 hours and 27 minutes of sleep per day. His meancognitive effectiveness during work hours ranged from 76.7% to 98.2% and averaged 89.2%. Hehad 4 work periods where his performance fell to levels equivalent to a BAC of 0.05%. During
the morning work period of April 22nd his performance fell to an equivalence of BAC of 0.08%.This subject also shows evidence of broken sleep at CFS Alert on the night of April 10 - 11.

8/3/2019 Michel.paul.110907 1436.Toronto TR 2011 037 Finalrev
http://slidepdf.com/reader/full/michelpaul110907-1436toronto-tr-2011-037-finalrev 34/54
20 DRDC Toronto TR 2011-037
Figure 31: Subject 21 obtained an average of 7 hours and 53 minutes of sleep per day. His meancognitive effectiveness during work hours ranged from 82.2% to 98.2% and averaged 93.1%.
None of his work periods were carried at performance levels associated with significant levels of
BAC.
Figure 32: Subject 22 obtained an average of 6 hours and 47 minute3s of sleep per day. His meancognitive effectiveness during work hours ranged from 79.3% to 92.7% and averaged 87.3%.He
had 3 work periods (pre patrol on April 4th , and during patrol on each of April 12th , and April 21
st ) during which modeled performance reached levels equivalent to a BAC level of 0.05%.

8/3/2019 Michel.paul.110907 1436.Toronto TR 2011 037 Finalrev
http://slidepdf.com/reader/full/michelpaul110907-1436toronto-tr-2011-037-finalrev 35/54
DRDC Toronto TR 2011-037 21
Figure 33: Subject 23 obtained an average of 7 hours and 35 minutes of sleep per day. His meancognitive effectiveness during work hours ranged from 81.7% to 98.4% and averaged 90.7%.Hehad a single work period on patrol (April 21
st ), during which modeled performance reached
levels equivalent to a BAC of 0.05%.
Figure 34: Subject 24 obtained an average of 7 hours and 23 minutes of sleep per day. His meancognitive effectiveness during work hours ranged from 87.3% to 97.8% and averaged 91.8%. Hehad a single period on patrol on April 22nd during which modeled performance reached levels
equivalent to a BAC of 0.05%.

8/3/2019 Michel.paul.110907 1436.Toronto TR 2011 037 Finalrev
http://slidepdf.com/reader/full/michelpaul110907-1436toronto-tr-2011-037-finalrev 36/54
22 DRDC Toronto TR 2011-037
Figure 35: Subject 25 obtained an average of 8 hours and 7 minutes of sleep per day. His meancognitive effectiveness during work hours ranged from 88.1% to 98.4% and averaged 93.8%. None of his work periods involved modeled performance equivalent to significant BAC levels.
Figure 36: Subject 26 obtained an average of 6 hours and 56 minutes of sleep per day. His meancognitive effectiveness during work hours ranged from 62.3% to 98.2% and averaged 81.4%. On
3 occasions, his performance dropped into the pink zone reaching 58% to 60 % cognitiveeffectiveness where no one can perform well on any task. Of 37 total work periods, he spent 18 at
a performance level equivalent to a BAC of 0.05% or higher and in 9 of those work periods his performance reached levels associated with a BAC of 0.08% and worse.

8/3/2019 Michel.paul.110907 1436.Toronto TR 2011 037 Finalrev
http://slidepdf.com/reader/full/michelpaul110907-1436toronto-tr-2011-037-finalrev 37/54
DRDC Toronto TR 2011-037 23
Figure 37: Subject 27 obtained an average of 6 hours and 6 minutes of sleep per day. His mean
cognitive effectiveness during work hours ranged from 61.6% to 98.1% and averaged 80.3%. During patrol, on 4 occasions, his performance dropped into the pink zone reaching 43% to 57%
cognitive effectiveness where no one can perform well on any task. Of 37 total work periods, he spent 18 at a performance equivalent to a BAC level of 0.05% or higher, and in 6 of those work periods, his performance reached levels associated with a BAC of 0.08% or worse.

8/3/2019 Michel.paul.110907 1436.Toronto TR 2011 037 Finalrev
http://slidepdf.com/reader/full/michelpaul110907-1436toronto-tr-2011-037-finalrev 38/54

8/3/2019 Michel.paul.110907 1436.Toronto TR 2011 037 Finalrev
http://slidepdf.com/reader/full/michelpaul110907-1436toronto-tr-2011-037-finalrev 39/54
DRDC Toronto TR 2011-037 25
equivalence of 0.05% on 3 occasions and to a 0.08% BAC level on two occasions. The remainingRanger (Subject 4) achieved an average of 1 hour less daily sleep than Subject 3 and had four work periods where his modeled performance reached levels associated with a BAC level of 0.05% but did not reach the equivalence to a BAC of 0.08%.
The Instructor only attained an average daily sleep of just over 6 hours due to exercising his
responsibility as a patrol leader. This limited amount of sleep resulted in 100% of 3 work periods being spent at a 0.05% BAC equivalence. He also briefly attained equivalence to a BAC level of
0.08% on four occasions.
Of the 19 freshly deployed soldiers, 4 (Subjects 8, 13, 16, and 21) had sufficient sleep to avoid
impacted performance equivalent to intoxicated levels of BAC. The average daily sleep of these 4individuals ranged from 7 hours and 31 minutes to 8 hours and 29 minutes. Of the 19 freshlydeployed troops, 17 reached levels of performance equivalent to a BAC of 0.05%, 16 attained
performance associated with a BAC of 0.08%, and 11 dropped well beyond a BAC of 0.08% andreached the “pink” zone of the FASTTM model graphs (i.e., less than 65% cognitive effectiveness
which is a level of performance where no one can function well on any task). While Subject 12had an average daily sleep of 9 hours and 8 minutes, on several occasions during his patrol, he
had limited sleep and attained levels of performance equivalent to BAC levels of 0.05%, 0.08%and beyond to the “pink” zone (i.e., less than 65% cognitive effectiveness). Essentially, in spite of very adequate average daily sleep, on several occasions, he was not immune to the debilitating
effects of limited sleep.

8/3/2019 Michel.paul.110907 1436.Toronto TR 2011 037 Finalrev
http://slidepdf.com/reader/full/michelpaul110907-1436toronto-tr-2011-037-finalrev 40/54
26 DRDC Toronto TR 2011-037
5 Conclusions
All Arctic patrollers require sufficient sleep to avoid impaired performance. In some, cases theOperational Tempo of Arctic work may preclude sufficient sleep. Planners who set the
Operational Tempo should understand the impact that insufficient sleep can have on operationalreadiness, and plan accordingly, to the extent possible.
DRDC Toronto Technical Report TR 2010-056 “General Recommendations on Fatigue Risk
Management for the Canadian Forces” includes specific information on the management of fatigue. While it is directed primarily towards an aviation environment, many of the generalrecommendations are equally applicable to a land force environment and could provide usefulguidance to planners and commanders in the management of fatigue.
Given the very limited number of Arctic exercises, it is very desirable that defence researchershave an opportunity to participate in the planning stages of Arctic operations to maximize the
benefits available from limited Arctic troop deployments.

8/3/2019 Michel.paul.110907 1436.Toronto TR 2011 037 Finalrev
http://slidepdf.com/reader/full/michelpaul110907-1436toronto-tr-2011-037-finalrev 41/54
DRDC Toronto TR 2011-037 27
References .....
[1] Paul, M. A., Gray, G. W., Lieberman, H. R., Love, R. J., Miller, J. C., and Arendt, J. (2010).Management of circadian desynchrony (jetlag and shiftlag) in cf air operations. TR 2010-002,
DRDC Toronto.
[2] Paul, M. A., Gray, G. W., and Miller, J. C. (2007). Fighter pilot cognitive effectivenessduring exercise wolf safari. (TR 2007-020). TR 2007-020. DRDC Toronto.
[3] Paul, M. A., Gray, G. W., and Miller, J. C. (2007). Cognitive effectiveness of cf-18 instructor pilots during routine training. (TR 2007-028). TR 2007-028. DRDC Toronto.
[4] Paul, M. A., Gray, G. W., Nesthus, T. E., and Miller, J. C. (2008). An assessment of the cf submarine watch schedule variants for impact on modeled crew performance. TR 2008-007,DRDC Toronto.
[5] Paul, M. A., Hursh, S. R., and Miller, J. C. (2010). Alternative submarine watch schedules:
Recommendations for a new cf watch schedule. TR 2010-001, DRDC Toronto.
[6] Paul, M. A. and Miller, J. C. (2004). Fatigue assessment in camp mirage cc130 aircrew:Recommendations for pharmacologic intervention. (TR 2004-021). TR 2004-021. DRDC
Toronto.
[7] Paul, M. A. and Miller, J. C. (2005). Consideration of 5 canadian forces fire-fighter shiftschedules. (TR 2005-027).
[8] Arnedt, J. T., Wilde, G. J. S., Munt, P. W., and MacLean, A. W. (2001). How do prolongedwakefulness and alcohol compare in the decrements they produce on a simulated drivingtask? Accident Analylsis and Prevention, 33, 337-344.
[9] Dawson, D. and Reid, K. (1997). Fatigue, alcohol and performance impairment. Nature, 388,
235.
[10] Lamond, N. and Dawson, D. (1999). Quantifying the performance impairment associatedwith fatigue. Journal of Sleep Research, 8 (no. 4), 255-262.

8/3/2019 Michel.paul.110907 1436.Toronto TR 2011 037 Finalrev
http://slidepdf.com/reader/full/michelpaul110907-1436toronto-tr-2011-037-finalrev 42/54
28 DRDC Toronto TR 2011-037
This page intentionally left blank.

8/3/2019 Michel.paul.110907 1436.Toronto TR 2011 037 Finalrev
http://slidepdf.com/reader/full/michelpaul110907-1436toronto-tr-2011-037-finalrev 43/54
DRDC Toronto TR 2011-037 29
Annex A Sleep, Activity, Fatigue and Task Effectiveness(SAFTE) Model
A.1 Fatigue Avoidance Scheduling Tool (FAST TM)
The Sleep, Activity, Fatigue and Task Effectiveness (SAFTE) model integrates quantitativeinformation about (1) circadian rhythms in metabolic rate, (2) cognitive performance recoveryrates associated with sleep, and cognitive performance decay rates associated with wakefulness,
and (3) cognitive performance effects associated with sleep inertia to produce a 3-process modelof human cognitive effectiveness.
The SAFTE model has been under development by Dr. Steven Hursh for more than a decade. Dr.
Hursh, formerly a research scientist with the US Army, is employed by SAIC (ScienceApplications International Corporation) and Johns Hopkins University and is currently under contract to the WFC (Warfighter Fatigue Countermeasures) R&D Group and NTI, Inc. to modifyand expand the model.
The general architecture of the SAFTE model is shown in Figure 1. A circadian processinfluences both cognitive effectiveness and sleep regulation. Sleep regulation is dependent uponhours of sleep, hours of wakefulness, current sleep debt, the circadian process and sleep
fragmentation (awakenings during a sleep period). Cognitive effectiveness is dependent upon thecurrent balance of the sleep regulation process, the circadian process, and sleep inertia.

8/3/2019 Michel.paul.110907 1436.Toronto TR 2011 037 Finalrev
http://slidepdf.com/reader/full/michelpaul110907-1436toronto-tr-2011-037-finalrev 44/54

8/3/2019 Michel.paul.110907 1436.Toronto TR 2011 037 Finalrev
http://slidepdf.com/reader/full/michelpaul110907-1436toronto-tr-2011-037-finalrev 45/54
DRDC Toronto TR 2011-037 31
Table A-1. SAFTE model essential features.
KEY FEATURES ADVANTAGES
Model is homeostatic. Gradual decreases in sleep debtdecrease sleep intensity. Progressive increases in sleepdebt produced by extended periods of less than optimallevels of sleep lead to increased sleep intensity.
Predicts the normal decline in sleep intensity during thesleep period.
Predicts the normal equilibrium of performance under less than optimal schedules of sleep.
Model delays sleep accumulation at the start of eachsleep period.
Predicts the detrimental effects of sleep fragmentationand multiple interruptions in sleep.
Model incorporates a multi-oscillator circadian process. Predicts the asymmetrical cycle of performance aroundthe clock.
Circadian process and Sleep-Wake Cycle are additive topredict variations in performance.
Predicts the mid-afternoon dip in performance, as wellas the more predominant nadir in performance thatoccurs in the early morning.
Model modulates the intensity of sleep according to thetime of day.
Predicts circadian variations in sleep quality.
Predicts limits on performance under schedules thatarrange daytime sleep.
Model includes a factor to account for the initial lag inperformance upon awakening.
Predicts sleep inertia that is proportional to sleep debt.
Model incorporates adjustment to new time zones or shift schedules
Predicts temporary “jet-lag” effects and adjustment toshift work
The Fatigue Avoidance Scheduling Tool ( FAST TM) is based upon the SAFTE model. FAST TM,
developed by NTI, Inc. as an AF SBIR (Air Force, Small Business Innovative Research) product,
is a Windows program that allows planners and schedulers to estimate the average effects of various schedules on human performance. It allows work and sleep data entry in graphic and text
formats. A work schedule comprised of three 36-hr missions each separated by 12 hours isshown as red bands on the time line across the bottom of the graphic presentation format inFigure 2. Average performance effectiveness for work periods may be extracted and printed asshown in the table below the figure.

8/3/2019 Michel.paul.110907 1436.Toronto TR 2011 037 Finalrev
http://slidepdf.com/reader/full/michelpaul110907-1436toronto-tr-2011-037-finalrev 46/54
32 DRDC Toronto TR 2011-037
AWAKE WORK
Start Duration Mean
Day - Hr (Minutes) Effectiveness
Start Duration Mean
Day - Hr (Minutes) Effectiveness
0 - 06:00 300 98.97 0 - 20:00 1079 81.14
0 - 14:00 2580 76.42 1 - 14:00 1080 63.97
2 - 17:00 2400 64.78 2 - 20:00 1079 71.23
4 - 18:00 2340 64.58 3 - 14:00 1080 54.51
6 - 19:00 1741 72.23 4 - 20:00 1079 72.00
5 - 14:00 1080 54.92
Figure 2: Sample FAST tm display. The triangles represent waypoint changes that control theamount of light available at awakening and during various phases of the circadian rhythm. The
table shows the mission split into two work intervals, first half and second half.

8/3/2019 Michel.paul.110907 1436.Toronto TR 2011 037 Finalrev
http://slidepdf.com/reader/full/michelpaul110907-1436toronto-tr-2011-037-finalrev 47/54
DRDC Toronto TR 2011-037 33
Sleep periods are shown as blue bands across the time line, below the red bands.
The vertical axis of the diagram represents composite human performance on a number of
associated cognitive tasks. The axis is scaled from zero to 100%. The oscillating line in thediagram represents expected group average performance on these tasks as determined by time of day, biological rhythms, time spent awake, and amount of sleep. We would expect the predicted
performance of half of the people in a group to fall below this line.
The green area on the chart ends at the time for normal sleep, ~90% effectiveness.
The yellow indicates caution.
The area from the dotted line to the red area represents performance level during the nadir and
during a 2nd day without sleep.
The red area represents performance effectiveness after 2 days and a night of sleep deprivation.
The expected level of performance effectiveness is based upon the detailed analysis of data from
participants engaged in the performance of cognitive tasks during several sleep deprivationstudies conducted by the Army, Air Force and Canadian researchers. The algorithm that createsthe predictions has been under development for two decades and represents the most advancedinformation available at this time.
References
[1] Eddy DR, Hursh SR (2001). Fatigue Avoidance Scheduling Tool (FAST). AFRL-HE-BR-TR-2001-0140, SBIR Phase I Final Report, Human Effectiveness Directorate Biodynamicsand Protection Division, Flight Motion Effects Branch, Brooks AFB TX 78235-5105.
[2] Hursh SR, Redmond DP, Johnson ML, Thorne DR, Belenky G, Balkin TJ, Storm WF,
Miller JC, Eddy DR. (2003). Fatigue models for applied research in warfighting.
Supplement to Aviation, Space and Environmental Medicine, in review.
[3] Hursh SR (1998). Modeling Sleep and Performance within the Integrated Unit SimulationSystem (IUSS). Technical Report Natick/TR-98/026L. Science and Technology
Directorate, Natick Research, Development and Engineering Center, United States ArmySoldier Systems Command, Natick, Massachusetts 01760-5020.
[4] Hursh SR, Redmond DP, Johnson ML, Thorne DR, Belenky G, Balkin TJ, Miller JC, EddyDR, Storm WF (2003). The DOD Sleep, Activity, Fatigue and Task Effectiveness Model. Proceedings of the 12th Conference on Behavior Representation in Modeling and Simulation (BRIMS 2003), 03-BRIMS-001, 14-15 May 2003, Mesa, Arizona.

8/3/2019 Michel.paul.110907 1436.Toronto TR 2011 037 Finalrev
http://slidepdf.com/reader/full/michelpaul110907-1436toronto-tr-2011-037-finalrev 48/54
34 DRDC Toronto TR 2011-037
This page intentionally left blank.
8/3/2019 Michel.paul.110907 1436.Toronto TR 2011 037 Finalrev
http://slidepdf.com/reader/full/michelpaul110907-1436toronto-tr-2011-037-finalrev 49/54

8/3/2019 Michel.paul.110907 1436.Toronto TR 2011 037 Finalrev
http://slidepdf.com/reader/full/michelpaul110907-1436toronto-tr-2011-037-finalrev 50/54
36 DRDC Toronto TR 2011-037
This page intentionally left blank.

8/3/2019 Michel.paul.110907 1436.Toronto TR 2011 037 Finalrev
http://slidepdf.com/reader/full/michelpaul110907-1436toronto-tr-2011-037-finalrev 51/54
8/3/2019 Michel.paul.110907 1436.Toronto TR 2011 037 Finalrev
http://slidepdf.com/reader/full/michelpaul110907-1436toronto-tr-2011-037-finalrev 52/54
UNCLASSIFIED
DOCUMENT CONTROL DATA(Security classification of the title, body of abstract and indexing annotation must be entered when the overall document is classified)
13. ABSTRACT (A brief and factual summary of the document. It may also appear elsewhere in the body of the document itself. It is highly desirable that the abstract
of classified documents be unclassified. Each paragraph of the abstract shall begin with an indication of the security classification of the information in the paragraph(unless the document itself is unclassified) represented as (S), (C), (R), or (U). It is not necessary to include here abstracts in both official languages unless the text is
bilingual.)
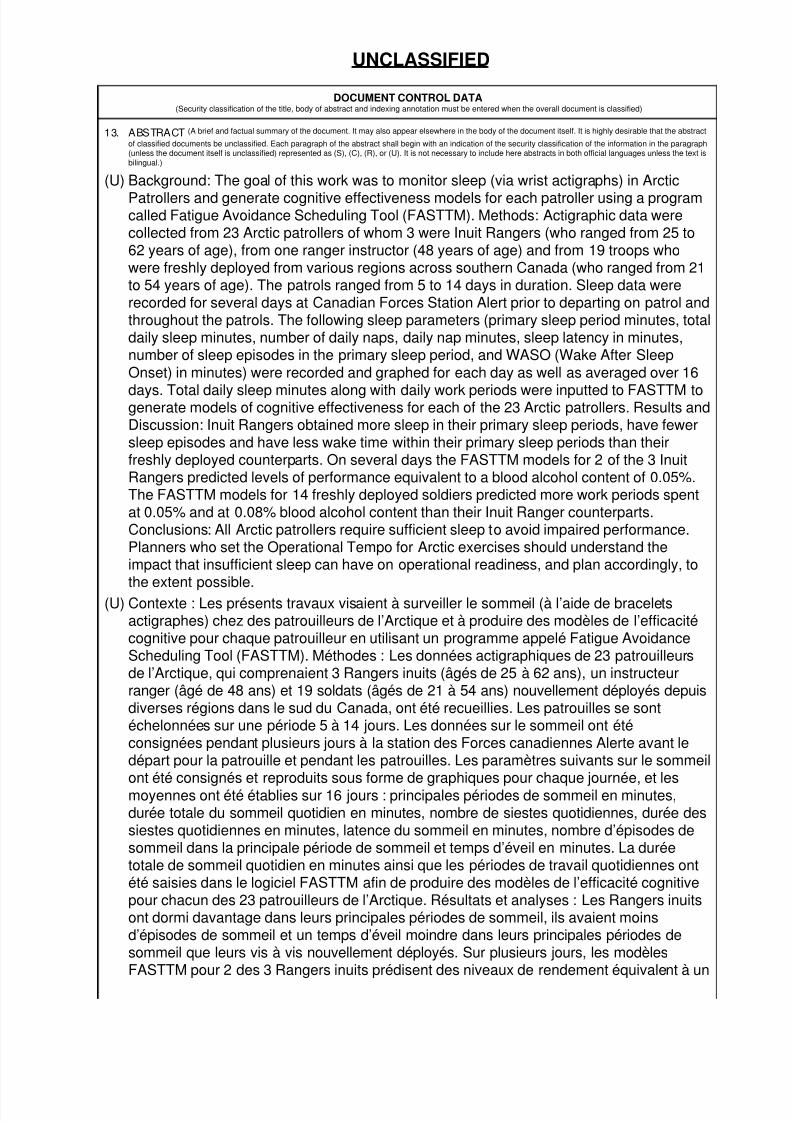
(U) Background: The goal of this work was to monitor sleep (via wrist actigraphs) in Arctic
Patrollers and generate cognitive effectiveness models for each patroller using a programcalled Fatigue Avoidance Scheduling Tool (FASTTM). Methods: Actigraphic data werecollected from 23 Arctic patrollers of whom 3 were Inuit Rangers (who ranged from 25 to62 years of age), from one ranger instructor (48 years of age) and from 19 troops whowere freshly deployed from various regions across southern Canada (who ranged from 21to 54 years of age). The patrols ranged from 5 to 14 days in duration. Sleep data wererecorded for several days at Canadian Forces Station Alert prior to departing on patrol andthroughout the patrols. The following sleep parameters (primary sleep period minutes, totaldaily sleep minutes, number of daily naps, daily nap minutes, sleep latency in minutes,number of sleep episodes in the primary sleep period, and WASO (Wake After SleepOnset) in minutes) were recorded and graphed for each day as well as averaged over 16
days. Total daily sleep minutes along with daily work periods were inputted to FASTTM togenerate models of cognitive effectiveness for each of the 23 Arctic patrollers. Results andDiscussion: Inuit Rangers obtained more sleep in their primary sleep periods, have fewersleep episodes and have less wake time within their primary sleep periods than theirfreshly deployed counterparts. On several days the FASTTM models for 2 of the 3 InuitRangers predicted levels of performance equivalent to a blood alcohol content of 0.05%.The FASTTM models for 14 freshly deployed soldiers predicted more work periods spentat 0.05% and at 0.08% blood alcohol content than their Inuit Ranger counterparts.Conclusions: All Arctic patrollers require sufficient sleep to avoid impaired performance.Planners who set the Operational Tempo for Arctic exercises should understand theimpact that insufficient sleep can have on operational readiness, and plan accordingly, to
the extent possible.(U) Contexte : Les présents travaux visaient à surveiller le sommeil (à l’aide de bracelets
actigraphes) chez des patrouilleurs de l’Arctique et à produire des modèles de l’efficacitécognitive pour chaque patrouilleur en utilisant un programme appelé Fatigue AvoidanceScheduling Tool (FASTTM). Méthodes : Les données actigraphiques de 23 patrouilleursde l’Arctique, qui comprenaient 3 Rangers inuits (âgés de 25 à 62 ans), un instructeurranger (âgé de 48 ans) et 19 soldats (âgés de 21 à 54 ans) nouvellement déployés depuisdiverses régions dans le sud du Canada, ont été recueillies. Les patrouilles se sontéchelonnées sur une période 5 à 14 jours. Les données sur le sommeil ont étéconsignées pendant plusieurs jours à la station des Forces canadiennes Alerte avant ledépart pour la patrouille et pendant les patrouilles. Les paramètres suivants sur le sommeil
ont été consignés et reproduits sous forme de graphiques pour chaque journée, et lesmoyennes ont été établies sur 16 jours : principales périodes de sommeil en minutes,durée totale du sommeil quotidien en minutes, nombre de siestes quotidiennes, durée dessiestes quotidiennes en minutes, latence du sommeil en minutes, nombre d’épisodes desommeil dans la principale période de sommeil et temps d’éveil en minutes. La duréetotale de sommeil quotidien en minutes ainsi que les périodes de travail quotidiennes ontété saisies dans le logiciel FASTTM afin de produire des modèles de l’efficacité cognitivepour chacun des 23 patrouilleurs de l’Arctique. Résultats et analyses : Les Rangers inuitsont dormi davantage dans leurs principales périodes de sommeil, ils avaient moinsd’épisodes de sommeil et un temps d’éveil moindre dans leurs principales périodes desommeil que leurs vis à vis nouvellement déployés. Sur plusieurs jours, les modèlesFASTTM pour 2 des 3 Rangers inuits prédisent des niveaux de rendement équivalent à un

8/3/2019 Michel.paul.110907 1436.Toronto TR 2011 037 Finalrev
http://slidepdf.com/reader/full/michelpaul110907-1436toronto-tr-2011-037-finalrev 53/54
taux d’alcoolémie de 0,05 %. Les modèles FASTTM pour 14 soldats nouvellementdéployés prédisent davantage de périodes de travail effectuées avec un taux d’alcoolémiede 0,05 % et de 0,08 % que leurs vis à vis Rangers inuits. Conclusions : Tous lespatrouilleurs de l’Arctique doivent dormir suffisamment pour éviter une baisse derendement. Les planificateurs qui établissent le rythme opérationnel pour les exercicesdans l’Arctique doivent comprendre les répercussions du manque de sommeil sur l’état depréparation opérationnelle et planifier en conséquence, dans la mesure du possible.
14. KEYWORDS, DESCRIPTORS or IDENTIFIERS (Technically meaningful terms or short phrases that characterize a document and could be helpful in
cataloguing the document. They should be selected so that no security classification is required. Identifiers, such as equipment model designation, trade name,
military project code name, geographic location may also be included. If possible keywords should be selected from a published thesaurus, e.g. Thesaurus ofEngineering and Scientific Terms (TEST) and that thesaurus identified. If it is not possible to select indexing terms which are Unclassified, the classification of each
should be indicated as with the title.)
(U) sleep hygienemodeled performanceArctic patrollers
UNCLASSIFIED

8/3/2019 Michel.paul.110907 1436.Toronto TR 2011 037 Finalrev
http://slidepdf.com/reader/full/michelpaul110907-1436toronto-tr-2011-037-finalrev 54/54


![IIM Lko. ppt. for IPS 110907[1]](https://img.pdfslide.us/doc/110x75/577d2a7f1a28ab4e1ea958fe/iim-lko-ppt-for-ips-1109071.jpg)