Embed Size (px)
Citation preview
Michell Truss : Shape Optimization vs. Analytical Solution
Shiro YOSHIDA*1
*1 SHONAN, R&D, Inc.
#402 Shonan Homes, 3-19-17 Katase-Kaigan, Fujisawa, 251-0035 Japan
The ultimate goal of the shape optimization is that standard deviation of the stress distribution becomes zero (each
members in a structure has the stress of the same level). The shape optimization software is developed towards this goal and
popularized steadily. Meanwhile, Michell truss is, because of its nature, an appropriate subject for the code verification and
calculation verification. In this context, Michell truss is modeled by BAR, SHELL, 3/D SOLID elements, and trend of stress
distribution is investigated.
Key Words : Michell Truss Shape Optimization Morphing
1. Preface
According to Herbert Simon (1978 Nobel Prize in Economics), decision-making is the act of trying to
find the best solution in certain circumstances, in order to achieve a particular goal, from multiple
alternatives [1].
The goal of decision-making is, making a rational choice, (i) comparing the collection of necessary
information, (ii) recognition of the right goal, (iii) the strategy proposal for the goals, (iv) planning of
the execution plan selection, and (v) the best course of action.
(a)Limit of rationality:
Simon assumes Human as decision maker to try to decide as rationally as possible. But, due to the limit
in the rationality, the decision-making cannot be perfectly reasonable.
The limits of rationality include:
i) Limit in decision-making : It is impossible to collect all the necessary information (limit in the
information gathering capabilities)
ii) Limit in judgment ability : It is impossible to prospect completely all the results of the action
based on the decision-making
(b) Decision-making process:
According to Simon, decision-making process includes:
i) Information collection : Information analysis follows Problem definition.
ii) Searching alternatives : Explore alternatives for problem solving that was discovered in the
previous step. But, because there is a limit in the information gathering capability, all
alternatives cannot be sought.
iii) Alternative evaluations : Predict the outcome of each alternative that has been searched, which
follows the comparison and evaluation. But, due to the limit in the evaluation capability, it is
impossible to completely forecast and evaluate all outcomes.
iv) Alternative selection : After anticipating the results of each alternative, by comparison and
evaluation, select relatively best alternative which meet a certain level of goal, on the basis of
the evaluation. However, due to the limit in the rationality, a relatively best alternative must be
selected among the limited number of choices. *1 SHONAN R&D,Inc. (#1201 SHONAN Towers, 1-2-9 Katase-Kaigan, 251-0035 JAPAN), E-mail: [email protected]
v) Alternative implementations : Execute the selected alternative, and ensure a certain
achievement.
vi) Feedback : Evaluate and analyze the results of the execution, and feedback their lesson to the
next decision-making.
By applying the above-mentioned procedure to the actual new product developing process, the
following activities can be found:
i) Information gathering : Case study of the product of competing companies.
ii) Information collection : The performance improvement through the size and shape change.
iii) Alternative evaluations : Evaluation by experiments and analysis.
iv) Alternative selection : Select the relatively best alternative according to the level of evaluation
indicators.
v) Alternative implementations : implementation of prototyping, testing, simulation.
vi) Feedback : Design changes such as alternative exchange.
(3) Prerequisites of alternative evaluation
In order to evaluate the alternatives reasonably, the following prerequisites are required:
i) There is more than one alternative.
ii) Sufficient knowledgeable to predict the effect of each alternative.
iii) There exists value system that can evaluate the effect of alternative.
(4) Evaluation criteria of alternative
An alternative is optimal when the following condition is satisfied:
i) all the available alternatives available has been found.
ii) a set of comparable various scale (utility function) exists.
iii) An alternative is superior to all the other alternatives in view of various scales.
However, the field of new product development, in many cases, is under the following circumstances:
i) It is impossible to identify all the alternatives that are feasible.
ii) It is difficult to set the suitable scale necessary to compare alternatives.
Meanwhile, it is difficult to reproduce the environment such as the "zero gravity", "cryogenic", "
vacuum" on the ground, but CAE, based on the finite element method, plays an important role in
providing a comparable scale.
Therefore, CAE can verify the various design patterns in the initial design stage, where the design
specification has not yet solidified. However CAE, based on the finite element method, is not useful for
alternatives search.
On the contrary, in order to automate the alternatives search phase, shape optimization software is
developed.
2. Shape Optimization : BAR Element Model
Historically speaking, the phase and shape optimization software of the structure was originated by the
presentation of Schmit of 1960. Though the software is supported by a rigorous mathematical theory,
there was leap of resultant shape, when compared to conventional mechanical parts. As a result, when
viewed from the eyes of design engineers with long experience, the results were reluctantly accepted.
Because of this historical background, phase and shape optimization software has not spreaded easily.
But as a result of long engineering effort, in recent years, the software begins to collect the attention in a
real manufacturing field.
(1) Part shape optimization
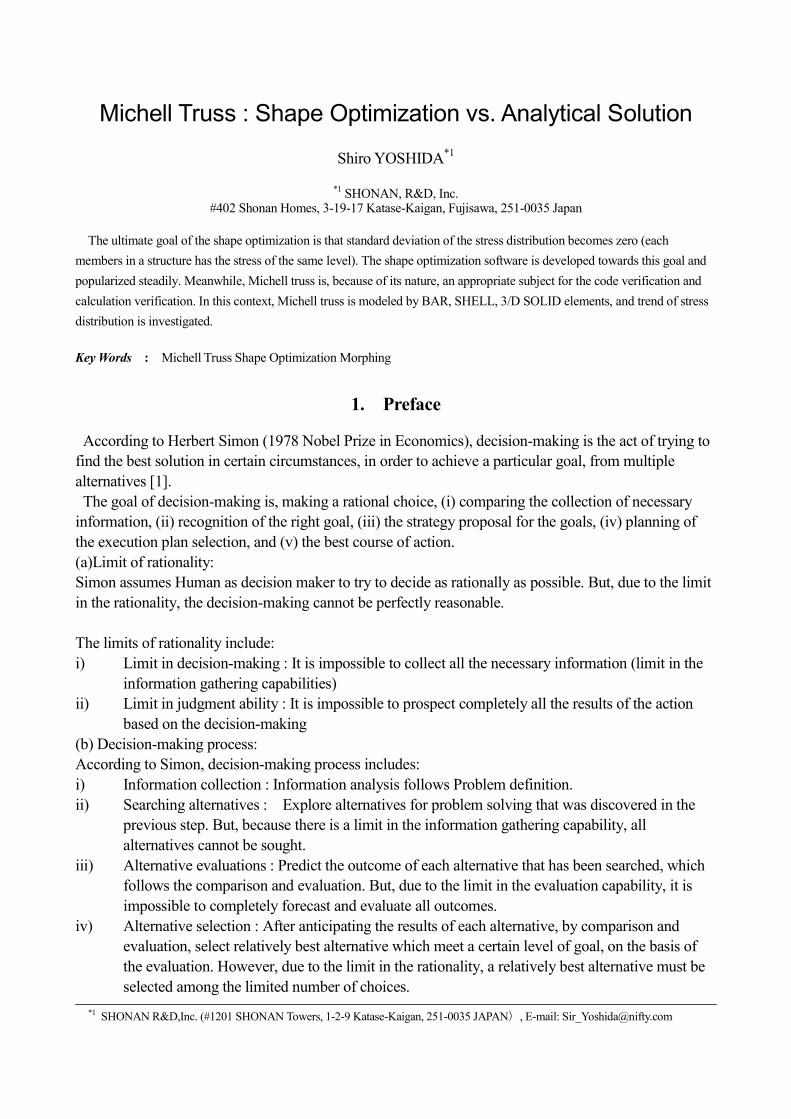
In 1904, Michell formulated the stress distribution of cantilever structure as shown in Fig.1, which is
composed of tensile members and compressive members, intersecting at right angles each other[2][3].
This formulation corresponds to the slip line, where the maximum shear stress is generated, in
2-dimensional press forming process. Namely, slip lines and shape optimization are mathematically
equivalent, and can be expressed in the same formulation.
On the other hand, Bendsoe proposed the process of optimization to maximize stiffness, varying the
density, which generates a similar shape with Michell’s theory[4].
Fig.1 Michell Truss
With the procedure as shown in Fig.1, members are equally placed as shown in Fig.2;
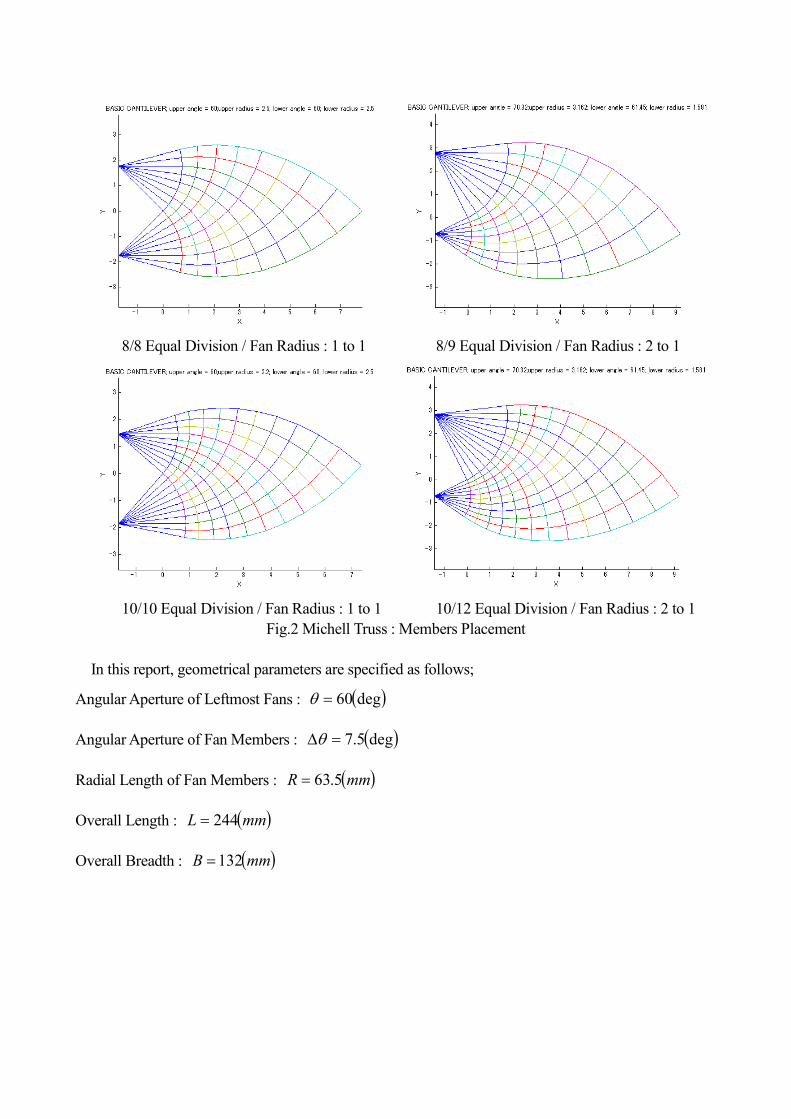
8/8 Equal Division / Fan Radius : 1 to 1 8/9 Equal Division / Fan Radius : 2 to 1
10/10 Equal Division / Fan Radius : 1 to 1 10/12 Equal Division / Fan Radius : 2 to 1
Fig.2 Michell Truss : Members Placement
In this report, geometrical parameters are specified as follows;
Angular Aperture of Leftmost Fans : ( )deg60=θ
Angular Aperture of Fan Members : ( )deg5.7=∆θ
Radial Length of Fan Members : ( )mmR 5.63=
Overall Length : ( )mmL 244=
Overall Breadth : ( )mmB 132=
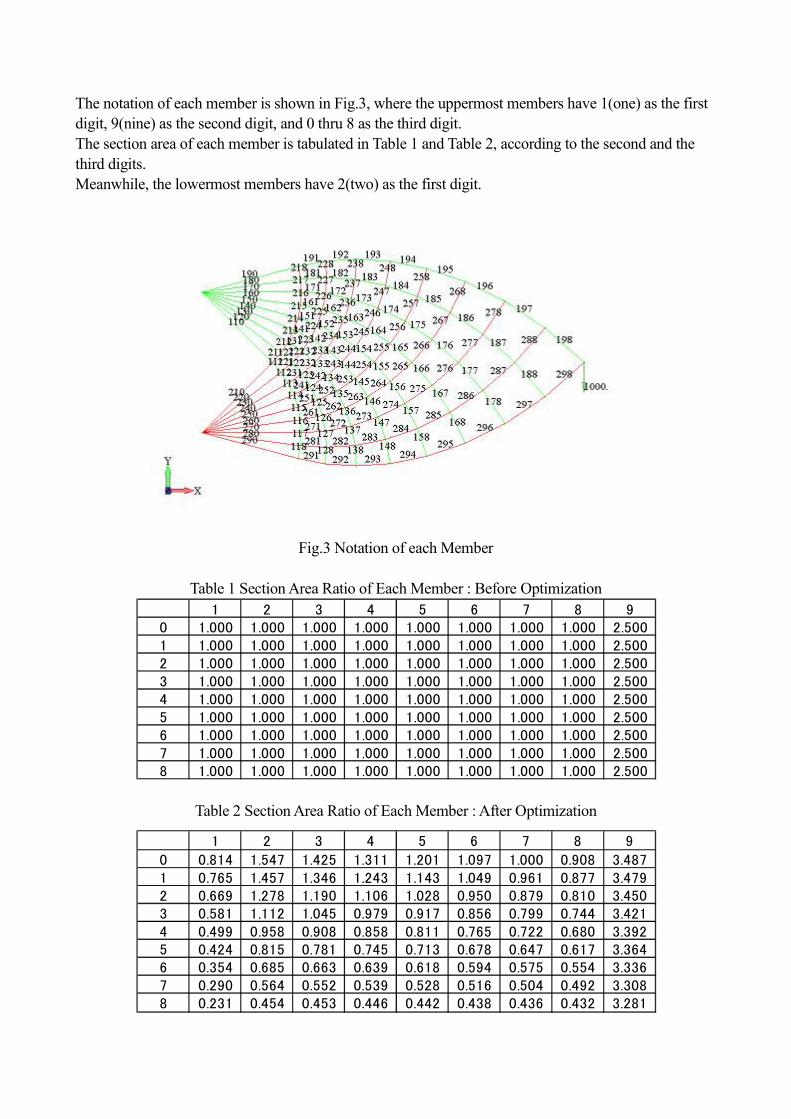
The notation of each member is shown in Fig.3, where the uppermost members have 1(one) as the first
digit, 9(nine) as the second digit, and 0 thru 8 as the third digit.
The section area of each member is tabulated in Table 1 and Table 2, according to the second and the
third digits.
Meanwhile, the lowermost members have 2(two) as the first digit.
Fig.3 Notation of each Member
Table 1 Section Area Ratio of Each Member : Before Optimization
Table 2 Section Area Ratio of Each Member : After Optimization
1 2 3 4 5 6 7 8 90 1.000 1.000 1.000 1.000 1.000 1.000 1.000 1.000 2.5001 1.000 1.000 1.000 1.000 1.000 1.000 1.000 1.000 2.5002 1.000 1.000 1.000 1.000 1.000 1.000 1.000 1.000 2.5003 1.000 1.000 1.000 1.000 1.000 1.000 1.000 1.000 2.5004 1.000 1.000 1.000 1.000 1.000 1.000 1.000 1.000 2.5005 1.000 1.000 1.000 1.000 1.000 1.000 1.000 1.000 2.5006 1.000 1.000 1.000 1.000 1.000 1.000 1.000 1.000 2.5007 1.000 1.000 1.000 1.000 1.000 1.000 1.000 1.000 2.5008 1.000 1.000 1.000 1.000 1.000 1.000 1.000 1.000 2.500
1 2 3 4 5 6 7 8 9
0 0.814 1.547 1.425 1.311 1.201 1.097 1.000 0.908 3.4871 0.765 1.457 1.346 1.243 1.143 1.049 0.961 0.877 3.4792 0.669 1.278 1.190 1.106 1.028 0.950 0.879 0.810 3.4503 0.581 1.112 1.045 0.979 0.917 0.856 0.799 0.744 3.4214 0.499 0.958 0.908 0.858 0.811 0.765 0.722 0.680 3.3925 0.424 0.815 0.781 0.745 0.713 0.678 0.647 0.617 3.3646 0.354 0.685 0.663 0.639 0.618 0.594 0.575 0.554 3.3367 0.290 0.564 0.552 0.539 0.528 0.516 0.504 0.492 3.3088 0.231 0.454 0.453 0.446 0.442 0.438 0.436 0.432 3.281
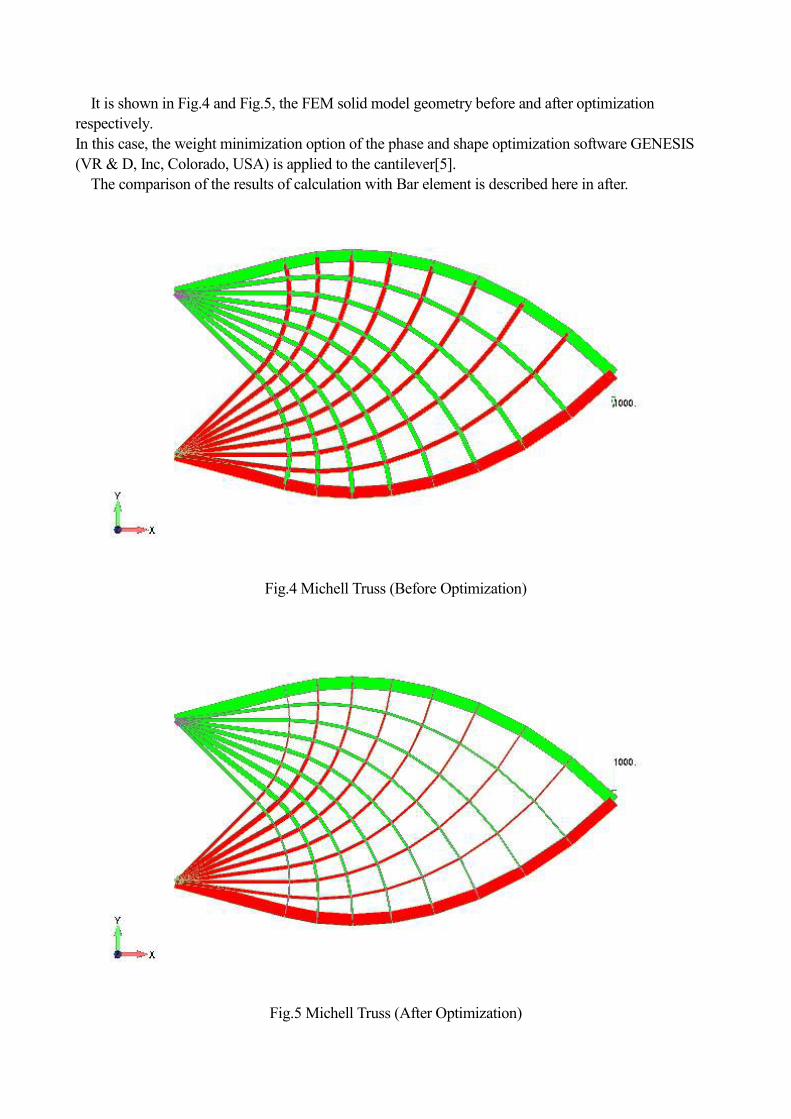
It is shown in Fig.4 and Fig.5, the FEM solid model geometry before and after optimization
respectively.
In this case, the weight minimization option of the phase and shape optimization software GENESIS
(VR & D, Inc, Colorado, USA) is applied to the cantilever[5].
The comparison of the results of calculation with Bar element is described here in after.
Fig.4 Michell Truss (Before Optimization)
Fig.5 Michell Truss (After Optimization)
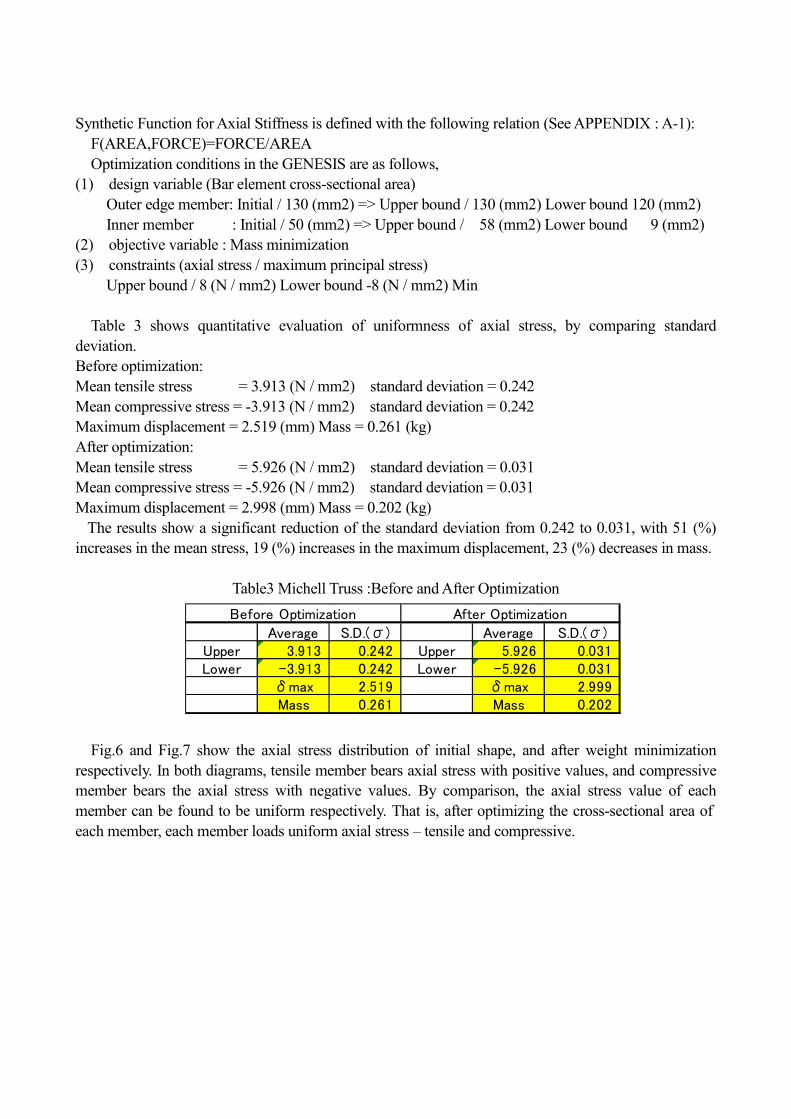
Synthetic Function for Axial Stiffness is defined with the following relation (See APPENDIX : A-1):
F(AREA,FORCE)=FORCE/AREA
Optimization conditions in the GENESIS are as follows,
(1) design variable (Bar element cross-sectional area)
Outer edge member: Initial / 130 (mm2) => Upper bound / 130 (mm2) Lower bound 120 (mm2)
Inner member : Initial / 50 (mm2) => Upper bound / 58 (mm2) Lower bound 9 (mm2)
(2) objective variable : Mass minimization
(3) constraints (axial stress / maximum principal stress)
Upper bound / 8 (N / mm2) Lower bound -8 (N / mm2) Min
Table 3 shows quantitative evaluation of uniformness of axial stress, by comparing standard
deviation.
Before optimization:
Mean tensile stress = 3.913 (N / mm2) standard deviation = 0.242
Mean compressive stress = -3.913 (N / mm2) standard deviation = 0.242
Maximum displacement = 2.519 (mm) Mass = 0.261 (kg)
After optimization:
Mean tensile stress = 5.926 (N / mm2) standard deviation = 0.031
Mean compressive stress = -5.926 (N / mm2) standard deviation = 0.031
Maximum displacement = 2.998 (mm) Mass = 0.202 (kg)
The results show a significant reduction of the standard deviation from 0.242 to 0.031, with 51 (%)
increases in the mean stress, 19 (%) increases in the maximum displacement, 23 (%) decreases in mass.
Table3 Michell Truss :Before and After Optimization
Fig.6 and Fig.7 show the axial stress distribution of initial shape, and after weight minimization
respectively. In both diagrams, tensile member bears axial stress with positive values, and compressive
member bears the axial stress with negative values. By comparison, the axial stress value of each
member can be found to be uniform respectively. That is, after optimizing the cross-sectional area of
each member, each member loads uniform axial stress – tensile and compressive.
Average S.D.(σ) Average S.D.(σ)Upper 3.913 0.242 Upper 5.926 0.031Lower -3.913 0.242 Lower -5.926 0.031
δmax 2.519 δmax 2.999Mass 0.261 Mass 0.202
Before Optimization After Optimization
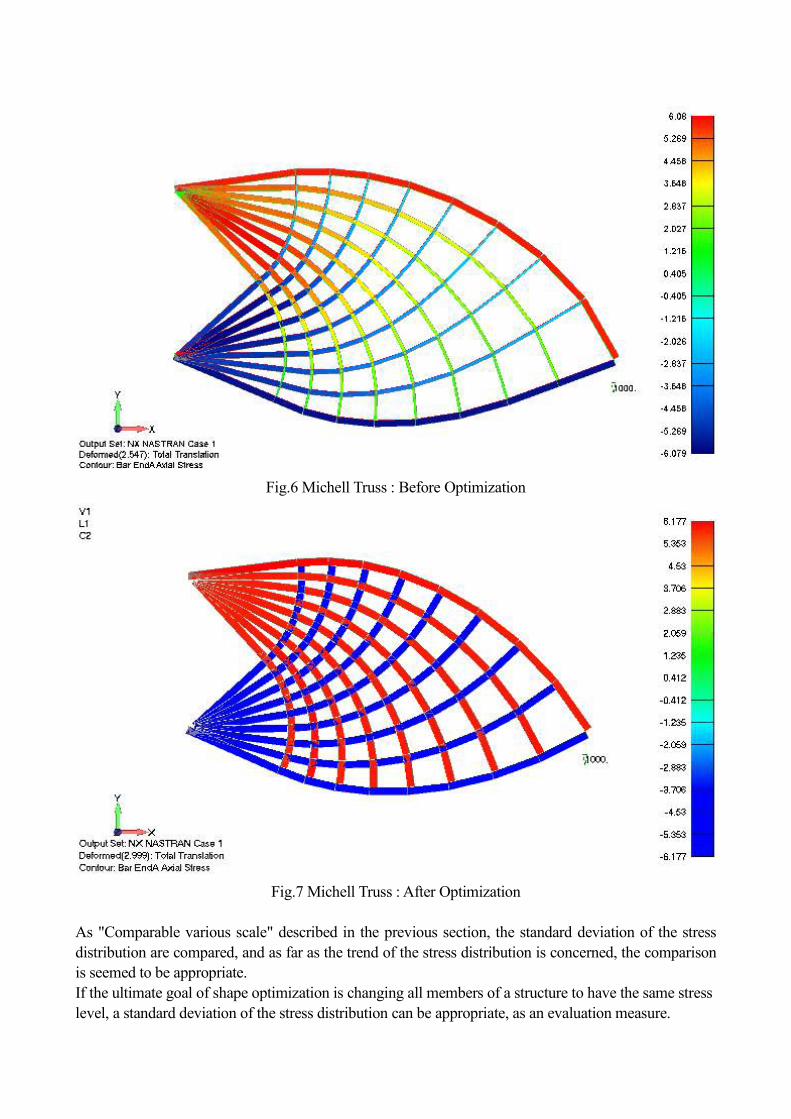
Fig.6 Michell Truss : Before Optimization
Fig.7 Michell Truss : After Optimization
As "Comparable various scale" described in the previous section, the standard deviation of the stress
distribution are compared, and as far as the trend of the stress distribution is concerned, the comparison
is seemed to be appropriate.
If the ultimate goal of shape optimization is changing all members of a structure to have the same stress
level, a standard deviation of the stress distribution can be appropriate, as an evaluation measure.
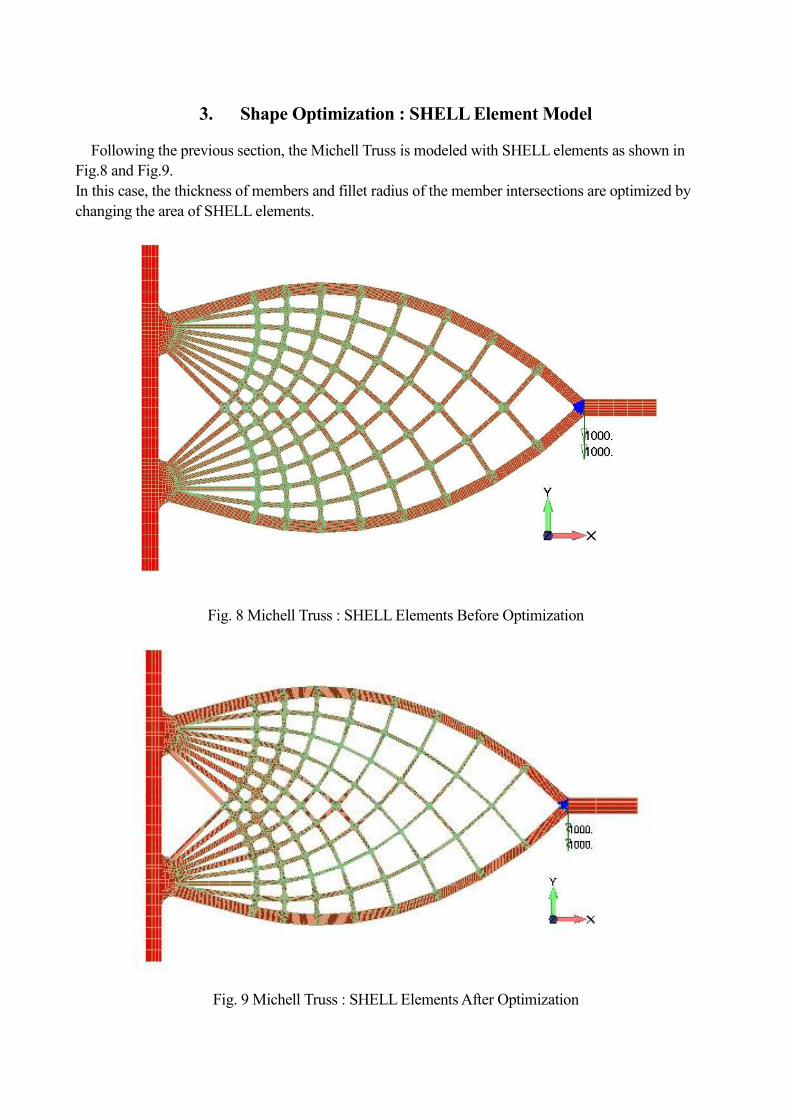
3. Shape Optimization : SHELL Element Model
Following the previous section, the Michell Truss is modeled with SHELL elements as shown in
Fig.8 and Fig.9.
In this case, the thickness of members and fillet radius of the member intersections are optimized by
changing the area of SHELL elements.
Fig. 8 Michell Truss : SHELL Elements Before Optimization
Fig. 9 Michell Truss : SHELL Elements After Optimization
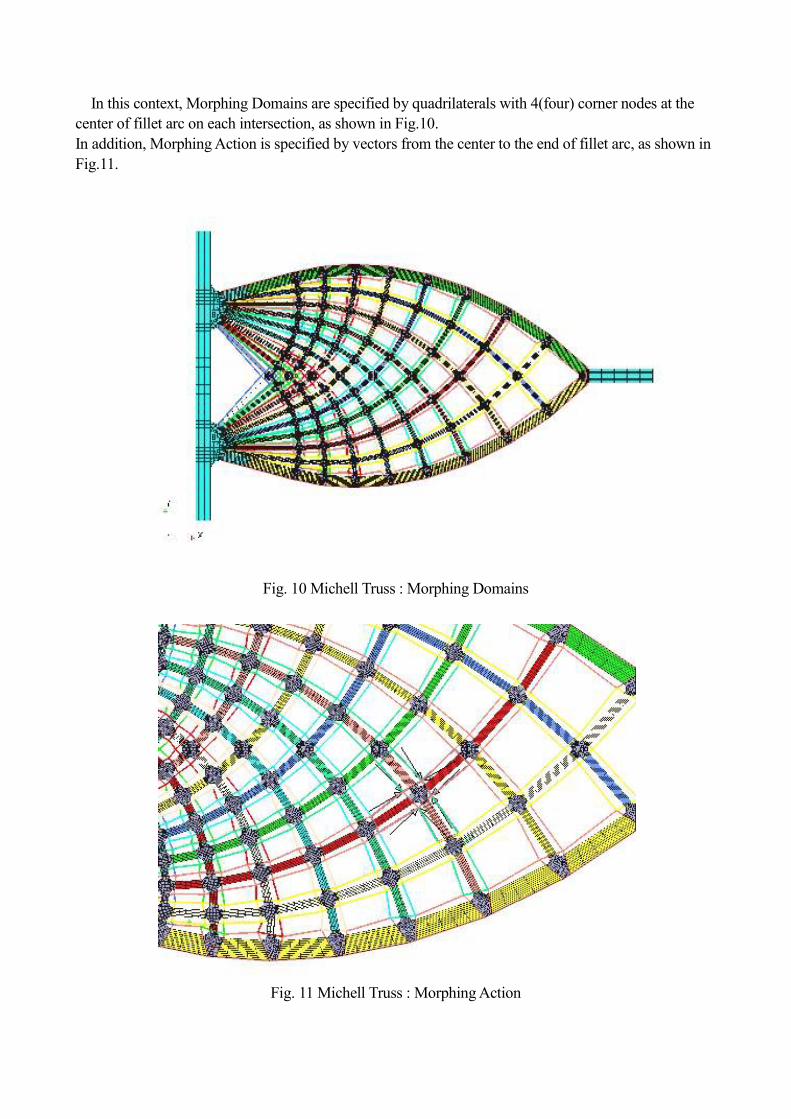
In this context, Morphing Domains are specified by quadrilaterals with 4(four) corner nodes at the
center of fillet arc on each intersection, as shown in Fig.10.
In addition, Morphing Action is specified by vectors from the center to the end of fillet arc, as shown in
Fig.11.
Fig. 10 Michell Truss : Morphing Domains
Fig. 11 Michell Truss : Morphing Action
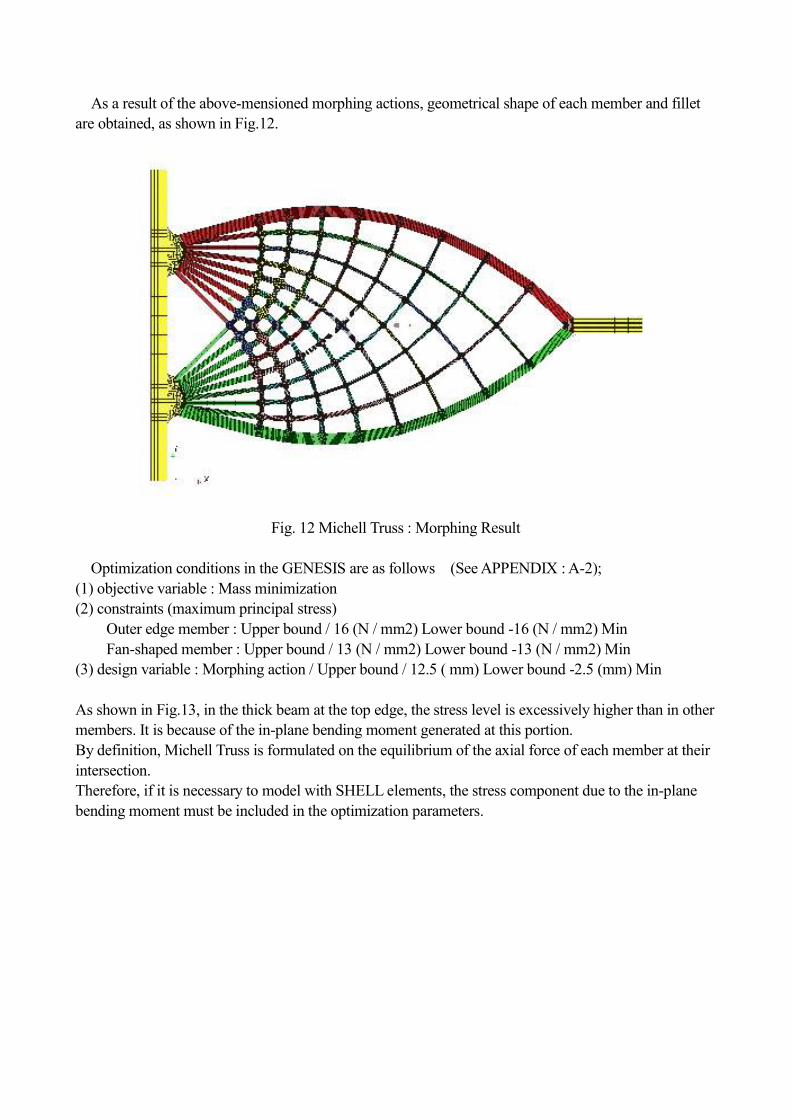
As a result of the above-mensioned morphing actions, geometrical shape of each member and fillet
are obtained, as shown in Fig.12.
Fig. 12 Michell Truss : Morphing Result
Optimization conditions in the GENESIS are as follows (See APPENDIX : A-2);
(1) objective variable : Mass minimization
(2) constraints (maximum principal stress)
Outer edge member : Upper bound / 16 (N / mm2) Lower bound -16 (N / mm2) Min
Fan-shaped member : Upper bound / 13 (N / mm2) Lower bound -13 (N / mm2) Min
(3) design variable : Morphing action / Upper bound / 12.5 ( mm) Lower bound -2.5 (mm) Min
As shown in Fig.13, in the thick beam at the top edge, the stress level is excessively higher than in other
members. It is because of the in-plane bending moment generated at this portion.
By definition, Michell Truss is formulated on the equilibrium of the axial force of each member at their
intersection.
Therefore, if it is necessary to model with SHELL elements, the stress component due to the in-plane
bending moment must be included in the optimization parameters.
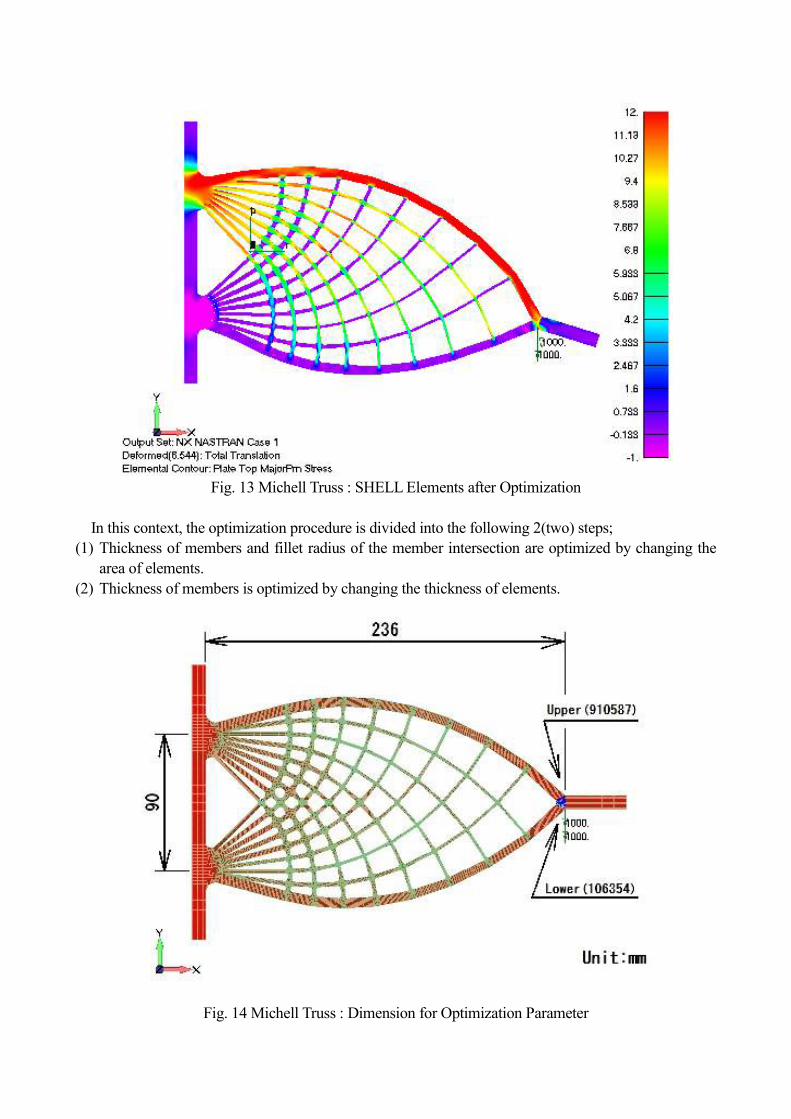
Fig. 13 Michell Truss : SHELL Elements after Optimization
In this context, the optimization procedure is divided into the following 2(two) steps;
(1) Thickness of members and fillet radius of the member intersection are optimized by changing the
area of elements.
(2) Thickness of members is optimized by changing the thickness of elements.
Fig. 14 Michell Truss : Dimension for Optimization Parameter
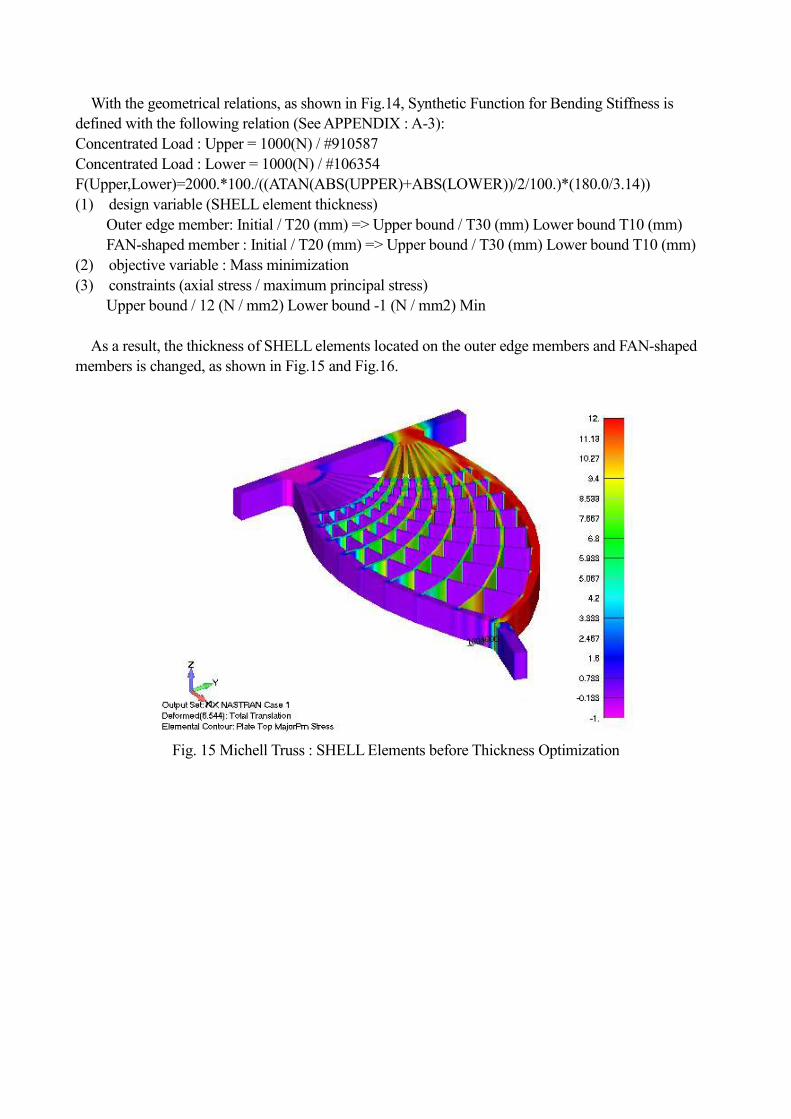
With the geometrical relations, as shown in Fig.14, Synthetic Function for Bending Stiffness is
defined with the following relation (See APPENDIX : A-3):
Concentrated Load : Upper = 1000(N) / #910587
Concentrated Load : Lower = 1000(N) / #106354
F(Upper,Lower)=2000.*100./((ATAN(ABS(UPPER)+ABS(LOWER))/2/100.)*(180.0/3.14))
(1) design variable (SHELL element thickness)
Outer edge member: Initial / T20 (mm) => Upper bound / T30 (mm) Lower bound T10 (mm)
FAN-shaped member : Initial / T20 (mm) => Upper bound / T30 (mm) Lower bound T10 (mm)
(2) objective variable : Mass minimization
(3) constraints (axial stress / maximum principal stress)
Upper bound / 12 (N / mm2) Lower bound -1 (N / mm2) Min
As a result, the thickness of SHELL elements located on the outer edge members and FAN-shaped
members is changed, as shown in Fig.15 and Fig.16.
Fig. 15 Michell Truss : SHELL Elements before Thickness Optimization
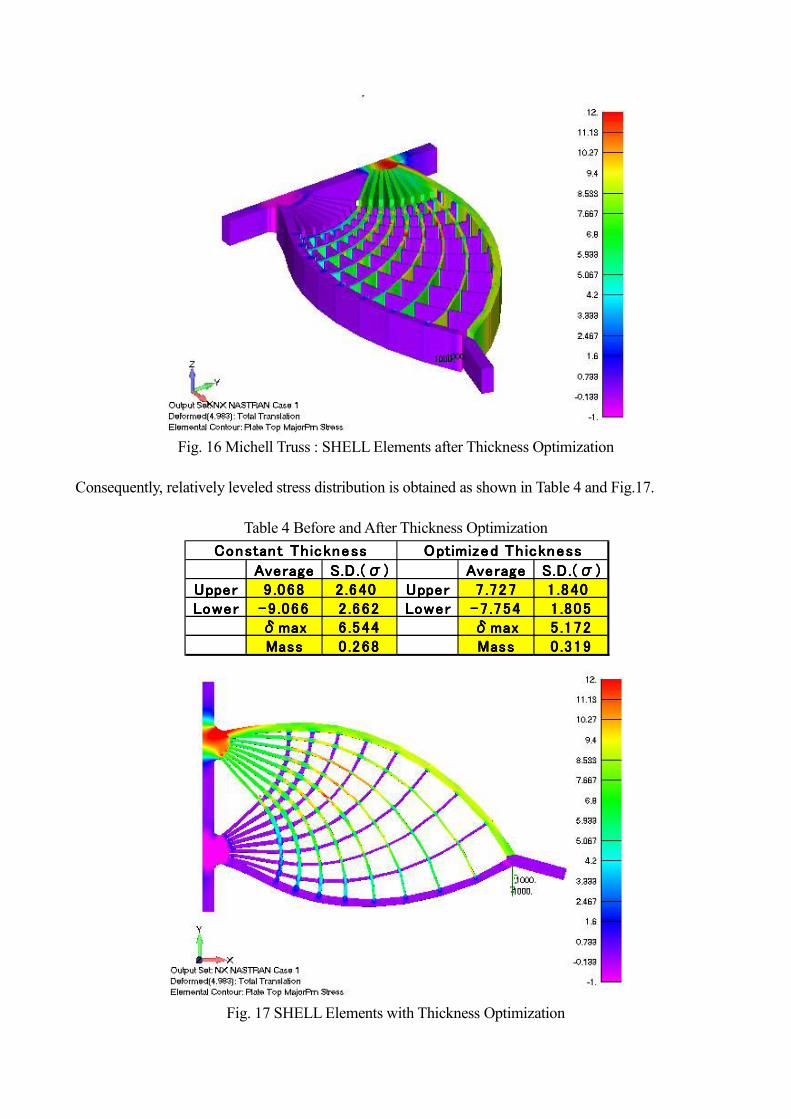
Fig. 16 Michell Truss : SHELL Elements after Thickness Optimization
Consequently, relatively leveled stress distribution is obtained as shown in Table 4 and Fig.17.
Table 4 Before and After Thickness Optimization
Fig. 17 SHELL Elements with Thickness Optimization
AverageAverageAverageAverage S.D.(σ)S.D.(σ)S.D.(σ)S.D.(σ) AverageAverageAverageAverage S.D.(σ)S.D.(σ)S.D.(σ)S.D.(σ)UpperUpperUpperUpper 9 .0689 .0689 .0689 .068 2.6402.6402.6402.640 UpperUpperUpperUpper 7 .7277 .7277 .7277 .727 1 .8401 .8401 .8401 .840LowerLowerLowerLower -9.066-9.066-9.066-9.066 2 .6622 .6622 .6622 .662 LowerLowerLowerLower -7.754-7.754-7.754-7.754 1 .8051 .8051 .8051 .805
δmaxδmaxδmaxδmax 6.5446 .5446 .5446 .544 δmaxδmaxδmaxδmax 5.1725 .1725 .1725 .172MassMassMassMass 0 .2680 .2680 .2680 .268 MassMassMassMass 0 .3190 .3190 .3190 .319
Constant ThicknessConstant ThicknessConstant ThicknessConstant Thickness Optimized ThicknessOptimized ThicknessOptimized ThicknessOptimized Thickness
4. Considerations
(1) Michell Truss
Michell Truss is composed of tensile members and compressive members, intersecting at right angles
each other.
It corresponds to the slip line, where the maximum shear stress is generated, in 2-dimensional press
forming process. Namely, slip lines and shape optimization are mathematically equivalent, and can be
expressed in the same formulation.
(2) BAR Element Model
When the Michell Truss is modeled by BAR elements, with the following parameters,
(a) design variable (Bar element cross-sectional area)
Outer edge member: Initial / 130 (mm2) => Upper bound / 130 (mm2) Lower bound 120 (mm2)
Inner member : Initial / 50 (mm2) => Upper bound / 58 (mm2) Lower bound 9 (mm2)
(b) objective variable : Mass minimization
(c) constraints (axial stress / maximum principal stress)
Upper bound / 10 (N / mm2) Lower bound -1 (N / mm2) Min
Then, the results show a significant reduction of the standard deviation of axial stress, from 0.242 to
0.003, with 52 (%) increases in the mean stress, 18 (%) increases in the maximum displacement, 23 (%)
decreases in mass.
By definition, the Michell Truss is truss structure, which is composed of tensile members and
compressive members, intersecting at right angles each other.
BAR element model directly corresponds to the structural nature of the Michell Truss, and the FEM
results show this optimization effect clearly.
(3) SHELL Element Model (Changing the area of SHELL elements)
When the Michell Truss is modeled by SHELL elements, with the following parameters,
(a) objective variable : Mass minimization
(b) constraints (maximum principal stress)
Outer edge member: Upper bound / 16 (N / mm2) Lower bound -16 (N / mm2) Min
Fan-shaped member : Upper bound / 13 (N / mm2) Lower bound -13 (N / mm2) Min
(c) design variable : Morphing action / Upper bound / 12.5 ( mm) Lower bound -2.5 (mm) Min
Then, in the thick beam at the top edge, the stress level is excessively higher than in other members.
It is because of the in-plane bending moment generated at this portion. By definition, Michell Truss is
formulated on the equilibrium of the axial force of each member at their intersection.
Therefore, when it is modeled with SHELL elements, the stress component due to the in-plane bending
moment must be included in the optimization parameters.
(4) SHELL Element Model (Changing the thickness of SHELL elements)
When the Michell Truss is modeled by SHELL elements, with the following parameters,
F(Upper,Lower)=2000.*100./((ATAN(ABS(UPPER)+ABS(LOWER))/2/100.)*(180.0/3.14))
(a) design variable (SHELL element thickness)
Outer edge member: Initial / T20 (mm) => Upper bound / T30 (mm) Lower bound T10 (mm)
FAN-shaped member : Initial / T20 (mm) => Upper bound / T30 (mm) Lower bound T10 (mm)
(b) objective variable : Mass minimization
(c) constraints (axial stress / maximum principal stress)
Upper bound / 12 (N / mm2) Lower bound -1 (N / mm2) Min
Then, the thickness of SHELL elements located on the outer edge members and FAN-shaped
members is changed, and the standard deviation of principal stress is improved from 2.66 to 1.80.
When this result are compared with that of the BAR element model, the effect of optimization is not so
good.
Because the optimization parameters are defined as follows,
(a) Synthetic Function is defined only by global bending stiffness
(b) Design variable (Element Thickness) is intentionally defined only on the outer edge members and
FAN-shaped members
Therefore, an ultimate optimization goal is not obtained yet.
It brings us to do a simultaneous optimization of
(a) In-Plane optimization of the thickness of members and fillet radius of the member intersections
(b) Out-of-Plane thickness optimization of members
using 3/D SOLID elements.
5. Summary
(1) CAE can verify the various design patterns in the initial design stage, where the design specification
has not yet solidified. However CAE, based on the finite element method, is not useful for alternatives
search.
(2) On the contrary, in order to automate the alternatives search phase, shape optimization software is
developed.
(3) When the Michell Truss is modeled by BAR elements, the results show a significant reduction of the
standard deviation of axial stress.
(4) It is because the BAR element model directly corresponds to the structural nature of the Michell
Truss, and the FEM results show this optimization effect clearly.
(5) When the Michell Truss is modeled by SHELL elements, in the thick beam at the top edge, the
stress level is excessively higher than in other members,
(6) It is because of the in-plane bending moment generated at this portion.
(7) By definition, Michell Truss is formulated on the equilibrium of the axial force of each member at
their intersection.
(8) When the Michell Truss is modeled by SHELL elements, the thickness of SHELL elements located
on the outer edge members and FAN-shaped members are changed, and the standard deviation of
principal stress is improved, but the effect of optimization is not so good.
(9) It brings us to do a simultaneous optimization of In-Plane optimization of the thickness of
members and fillet radius of the member intersections Out-of-Plane thickness optimization of members
using 3/D SOLID elements.
References
[1] "Decision Making Process Detail",
[online] Available at:
<http://www2.toyo.ac.jp/~fujita-h/UT/keieisoshiki_03.pdf >
[Accessed Mar.14 2014].
[2] T. P. Kicher, W. M. Morrow, L. A. SCchmit
"Structural synthesis capability for integrally stiffened waffle plates",
AIAA Journal, Vol.1, No.12, 1963.
[3] The Design of Michell Optimum Structures,
[online] Available at:
< http://naca.central.cranfield.ac.uk/reports/arc/rm/3303.pdf>
[Accessed Oct. 17 2013].
[4] M. P. Bendsoe, O. Sigmund,
"Topology Optimization", Springer, 2003.
[5] Software for Structural Analysis and Optimization,
[online] Available at:<https://www.vrand.com/Genesis.html>
[Accessed Sep. 04 2013].


![Michell, G, 1985. In, Vijayanagara Progress of Research ... Articles, PDFs [SK 091225]/Michell 1985 'A... · in 1856. Until very recently (Michell and Filliozat Mackenzie maps. and](https://img.pdfslide.us/doc/110x75/5b9d093e09d3f2443d8b58d9/michell-g-1985-in-vijayanagara-progress-of-research-articles-pdfs-sk-091225michell.jpg)


![Designing Volumetric Truss Structures · cal structural elements to de•ne a truss, and formulate its design as a •−ing problem for these elements. Michell [Michell 1904] laid](https://img.pdfslide.us/doc/110x75/5e2775246bf33e7b0639f5e4/designing-volumetric-truss-structures-cal-structural-elements-to-deane-a-truss.jpg)


![MSI07 Force in a Statically Determinate Cantilever Truss[1]](https://img.pdfslide.us/doc/110x75/55cf904d550346703ba4aef6/msi07-force-in-a-statically-determinate-cantilever-truss1.jpg)