Embed Size (px)
Citation preview

ATLSS is a National Center for Engineering Research on Advanced Technology for Large Structural Systems
117 ATLSS Drive
Bethlehem, PA 18015-4729
Phone: (610)758-3525 www.atlss.lehigh.edu Fax: (610)758-5902 Email: [email protected]
FIELD TESTING AND EVALUATION OF
ELECTROSLAG WELDS ON THE COMMODORE BARRY BRIDGE
Final Report
by
Ian C. Hodgson
Ben T. Yen
Carl Bowman
Prepared for: DMJM Harris
Philadelphia, PA
ATLSS Report No. 08-04 May 2008

ATLSS is a National Center for Engineering Research on Advanced Technology for Large Structural Systems
117 ATLSS Drive
Bethlehem, PA 18015-4729
Phone: (610)758-3525 www.atlss.lehigh.edu Fax: (610)758-5902 Email: [email protected]
FIELD TESTING AND EVALUATION OF
ELECTROSLAG WELDS ON THE COMMODORE BARRY BRIDGE
Final Report
by
Ian C. Hodgson Research Engineer
ATLSS Engineering Research Center
Ben T. Yen Professor Emeritus
ATLSS Engineering Research Center
Carl Bowman Instrumentation Technician
ATLSS Engineering Research Center
Prepared for: DMJM Harris
Philadelphia, PA
ATLSS Report No. 08-04 May 2008

Field Testing and Evaluation of Electroslag Welds on the Commodore Barry Bridge Final Report
i
Table of Contents
1. Introduction................................................................................................................... 1
2. Instrumentation Plan and Data Acquisition .............................................................. 1 2.1 Strain Gages ............................................................................................................. 1
2.2 Data Acquisition ...................................................................................................... 2
2.3 Instrumented Members............................................................................................. 4
3. Test Program – Summary............................................................................................ 6 3.1 Phase 1 Monitoring .................................................................................................. 6
3.2 Phase 2 Monitoring .................................................................................................. 6
4. Results of Long-term Monitoring................................................................................ 7 4.1 Pennsylvania Back Span .......................................................................................... 7
4.2 New Jersey Back Span............................................................................................. 8
5. Ultrasonic Testing Results............................................................................................ 9
6. Fracture Mechanics Evaluation................................................................................. 12
7. Findings........................................................................................................................ 15
8. Recommendations ....................................................................................................... 15
9. References.................................................................................................................... 16
Appendix A – Instrumentation Plans
Appendix B – Development of Stress-range Histograms used to Calculate Fatigue Life
Appendix C – UT Inspection Reports

Field Testing and Evaluation of Electroslag Welds on the Commodore Barry Bridge Final Report
1
1. Introduction The Commodore Barry Bridge is cantilever truss bridge and spans the Delaware
River connecting Bridgeport, New Jersey and Chester, Pennsylvania. The bridge has a main span of 1,644 feet and side spans of 822 feet, and carries five lanes of traffic. Originally opened to traffic in 1974, the bridge is owned by the Delaware River Port Authority (DRPA).
This work is part of an inspection and evaluation of eight electroslag welds that have previously been identified as having the potential for crack growth. Lehigh University’s ATLSS Center was contracted by the firm of DMJM Harris of Philadelphia, the prime consultant, to perform instrumentation and monitoring of selected truss members to measure the in-situ stresses at the selected welded connections.
2. Instrumentation Plan and Data Acquisition The following section describes the sensors and instrumentation plan used during
the controlled-load testing and long-term monitoring program. Detailed instrumentation plans can be found in Appendix A.
2.1 Strain Gages Strain gages were placed at locations known to be fatigue sensitive and/or to
provide insight into the global load distribution characteristics and general behavior of the bridge.
All strain gages installed in the field were model LWK-06-W250B-350 produced by Measurements Group Inc. These gages are uniaxial weldable resistance-type strain gages with a gage length of 0.25 inches. The gage resistance is 350 ohms and an excitation voltage of 10 volts was used.
Weldable-type strain gages were selected due to the ease of installation in a variety of weather conditions. The “welds” are point or spot resistance welds about the size of a pin prick. The probe is powered by a battery and only touches the foil that the strain gage is mounted on by the manufacturer. This fuses the foil to the steel surface. It takes forty or more of these small “welds” to attach the gage to the steel surface. There are no arc strikes or heat affected zones that are discernible. There is no preheat or any other preparation involved other than the preparation of the local metal surface by grinding and then cleaning before the gage is attached to the component with the welding unit. There has never been an instance of adverse behavior associated with the use of weldable strain gages including their installation on extremely brittle material such as A615 Gr75 steel reinforcing bars. Figure 2.1 shows a photograph of the installation of a weldable strain gage at Weld A_448.

Field Testing and Evaluation of Electroslag Welds on the Commodore Barry Bridge Final Report
2
Figure 2.1 – Installation of weldable strain gage adjacent to Weld A_448
2.2 Data Acquisition Two Campbell Scientific CR9000 data loggers were used for the collection of
data during the long-term monitoring. The CR9000 data logger is a high speed, multi-channel 16-bit data acquisition system. This data logger was configured with digital and analog filters to assure noise-free signals. Real-time data were viewed while on site by connecting the logger directly to a laptop computer. This was done to ensure that all sensors were functioning properly.
One CR9000 data logger was located at Panel Point 6 on the west side of the bridge (north truss). The other data logger was located at Panel Point 66 on the east side of the bridge (south truss). Each data logger was enclosed in a weather-tight box, as seen in Figure 2.2. Figure 2.3 contains a photograph of the inside of the box. In addition to the CR9000 data logger, there were communications equipment and a power supply inside the box.

Field Testing and Evaluation of Electroslag Welds on the Commodore Barry Bridge Final Report
3
Figure 2.2 – Weather-tight box containing data acquisition system located on the west-
bound walkway at Panel Point 6
Figure 2.3 – Interior of weather-tight box containing data acquisition system
Remote communications with the data logger was established using a wireless modem. Data download was performed nightly via a server located in the ATLSS laboratory in Bethlehem, PA. This link was also used to upload new programs as needed.

Field Testing and Evaluation of Electroslag Welds on the Commodore Barry Bridge Final Report
4
2.3 Instrumented Members Field-measured stresses were measured at the following eight welds:
1. 244
2. 273
3. 291
4. 302
5. 44
6. 418
7. 444
8. 448
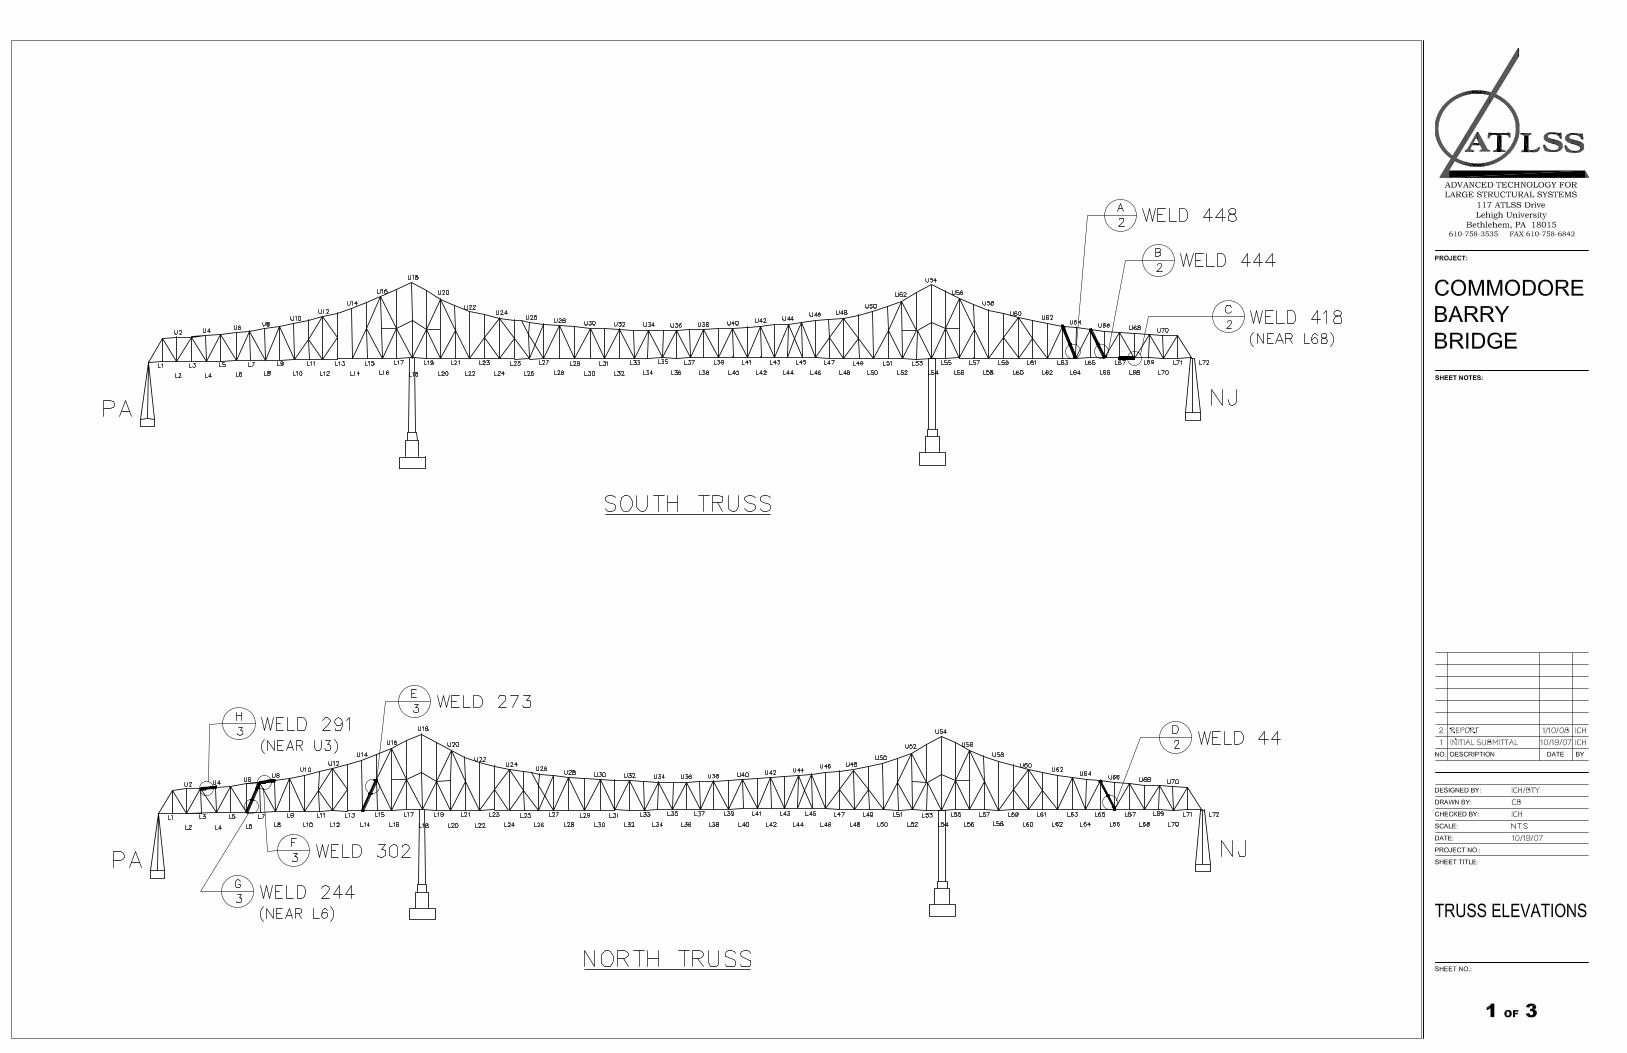
Shown in Figure 2.4 is a view of the Pennsylvania back span of the bridge indicating the instrumented truss members. Note that all four of the truss members are on the upstream truss.
Figure 2.4 – View of Pennsylvania back span looking upstream showing instrumented truss members (green = upstream; yellow = downstream)
229911 224444
330022
227733
Pennsylvania back span
New Jersey back span
Field Testing and Evaluation of Electroslag Welds on the Commodore Barry Bridge Final Report
5
Figure 2.5 shows a photograph of the New Jersey back span of the truss. Three of the instrumented truss members are on the down stream truss (418, 444, and 448). The fourth instrumented truss member is on the upstream truss (44).
Figure 2.5 – View of New Jersey back span looking upstream showing instrumented truss members (green = upstream; yellow = downstream)
At each location, two strain gages were installed on the thinner of the two joined plates. Each gage was oriented longitudinally with respect to the truss member, and located 1 inch from the side of the plate, and 1 inch from the edge of the weld (see Appendix A for further detail).
4444
441188
444444
444488

Field Testing and Evaluation of Electroslag Welds on the Commodore Barry Bridge Final Report
6
3. Test Program – Summary In order to measure the in-situ live load stresses in the truss members of interest, a
long-term monitoring program was implemented. There were two periods of monitoring.
3.1 Phase 1 Monitoring Phase 1 monitoring commenced on October 17, 2007 and ran until November 28,
2007. During this period, stress time-history data were not collected continuously. Data were only recorded when the measured stress at selected gages exceeded predefined triggers. The trigger gage and trigger value are selected solely to reduce the amount of time-history data recorded during the monitoring period. These data can be used to validate the highest stress cycles recorded in the stress range histogram (which is recorded constantly over the monitoring period). Once the strain value for the “trigger” gage reached the predefined limit, the logger began recording data for a predefined period of time. It should be noted that the trigger value of stress is not meant to be correlated to a stress caused by a particular vehicle. The value is selected so an appropriate quantity of data is recorded. Data were sampled at a rate of 50 Hz.
Simultaneously, stress-range histograms were developed continuously at each location monitored using the rainflow cycle-counting method. For each strain gage, this method considers 10 minutes of time-history data at a time and pairs up peaks in the response in this 10 minute segment to determine a tally of stress range cycles (number and magnitude). Every 10 minutes, the “tally” is updated, while the time-history data used to develop the tally is discarded. This process continued for the duration of the long-term monitoring period. Using these histograms, estimates of the effective stress-range and number of cycles can be made. Utilizing these results and knowing the detail category at the sensor location, and making the assumption that the stresses measured during the monitoring period are representative of the life of the bridge, an estimate of the remaining fatigue life can be made. A complete description of this procedure including a description of the rainflow cycle-counting algorithm is presented in Appendix B.
Unfortunately, there was a large amount of spurious signals (i.e., noise) in the data which corrupted the data. These spurious signals are believed to be the result of electromagnetic interference. Though manual review of the data is still possible, the noise precluded the use of algorithms used to reduce and analyze the data. For this reason, a second phase of monitoring was performed.
3.2 Phase 2 Monitoring Phase 2 monitoring began on November 28, 2007 and ran until December 7,
2007, at which point the equipment was removed from the bridge. During this period, data were collected from all sensors continuously at a rate of 10 Hz. A reduced sampling rate was used since the response of the bridge was observed to be significantly slower than initially assumed. The rainflow cycle counting was carried out after the data had been collected using a PC running MATLAB. Digital signal processing techniques were used to remove spurious signals from the data that were observed in the first period of monitoring. The reliability of the Phase 2 data set is believed to be improved over the Phase 1 data. Therefore, this data has been used to construct the stress-range histograms

Field Testing and Evaluation of Electroslag Welds on the Commodore Barry Bridge Final Report
7
presented in this report. All further references to field measured data in this report refers to data collected during Phase 2.
4. Results of Long-term Monitoring This section of the report presents the results of the long-term monitoring phase of
this project.
4.1 Pennsylvania Back Span Eight strain gages (four welds) were installed on Pennsylvania back span
members. The measured stress range histograms are presented in Table 4.1. The maximum recorded stress ranges, SRmax, are shown at the bottom of the table. The histogram shown is presented with all cycles (not truncated).
Stress Range (ksi) Number of Cycles
Min Max A_244 B_244 A_273 B_273 A_291 B_291 A_302 B_302
0.00 0.25 354,175 357,572 495,999 504,554 405,940 419,762 466,277 491,246
0.25 0.50 10,862 11,380 7,173 7,239 7,129 6,842 3,664 4,895
0.50 0.75 3,789 3,412 2,720 2,733 3,008 2,793 1,717 2,111
0.75 1.00 1,866 2,091 604 637 1,587 1,325 871 1,066
1.00 1.25 1,163 861 153 131 606 426 350 472
1.25 1.50 193 133 38 32 205 122 130 207
1.50 1.75 36 31 4 7 63 37 52 67
1.75 2.00 6 7 3 6 41 16 19 44
2.00 2.25 1 2 1 1 20 7 7 13
2.25 2.50 0 0 0 0 8 1 8 12
2.50 2.75 0 0 0 0 1 0 1 1
2.75 3.00 0 0 0 0 0 0 0 1
3.00 3.25 0 0 0 0 0 0 0 0
3.25 3.50 0 0 0 0 0 0 0 0
3.50 3.75 0 0 0 0 0 0 0 0
3.75 4.00 0 0 0 0 0 0 0 0
4.00 4.25 0 0 0 0 0 0 0 0
4.25 4.50 0 0 0 0 0 0 0 0
4.50 4.75 0 0 0 0 0 0 0 0
4.75 5.00 0 0 0 0 0 0 0 0
SRmax (ksi) = 2.25 2.25 2.25 2.25 2.75 2.50 2.75 3.00
Table 4.1 – Stress-range histogram for Pennsylvania back span members
Field Testing and Evaluation of Electroslag Welds on the Commodore Barry Bridge Final Report
8
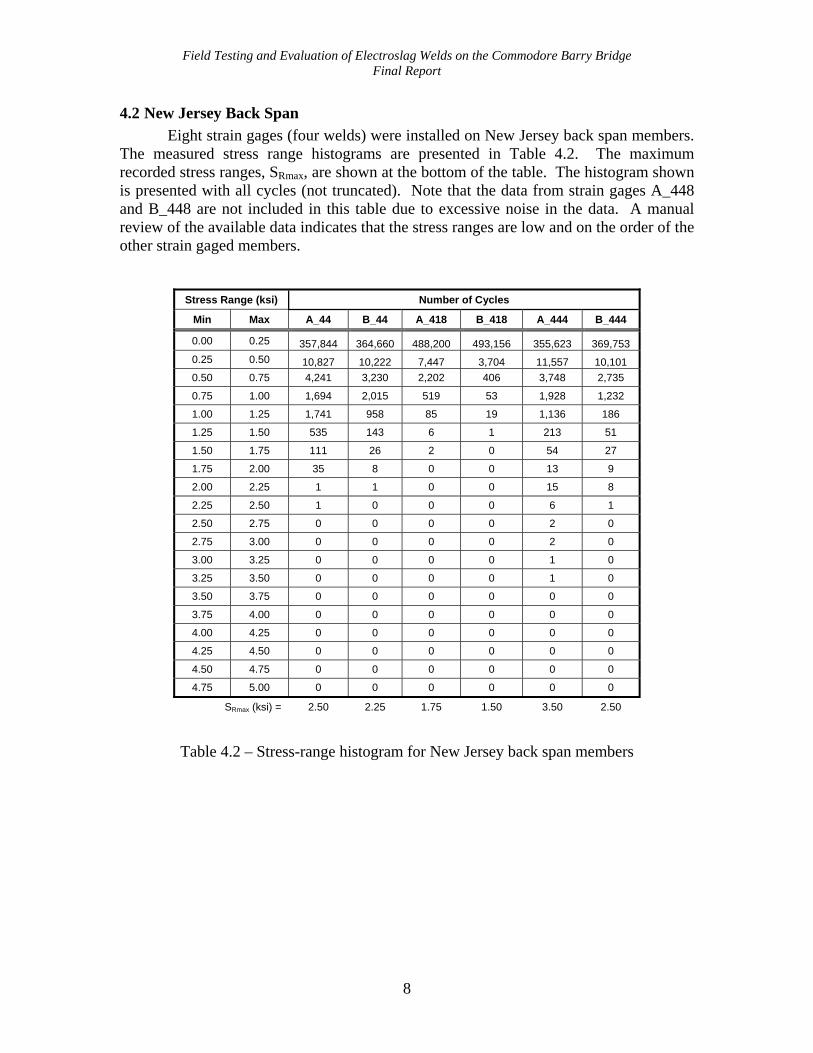
4.2 New Jersey Back Span Eight strain gages (four welds) were installed on New Jersey back span members.
The measured stress range histograms are presented in Table 4.2. The maximum recorded stress ranges, SRmax, are shown at the bottom of the table. The histogram shown is presented with all cycles (not truncated). Note that the data from strain gages A_448 and B_448 are not included in this table due to excessive noise in the data. A manual review of the available data indicates that the stress ranges are low and on the order of the other strain gaged members.
Stress Range (ksi) Number of Cycles
Min Max A_44 B_44 A_418 B_418 A_444 B_444
0.00 0.25 357,844 364,660 488,200 493,156 355,623 369,753 0.25 0.50 10,827 10,222 7,447 3,704 11,557 10,101 0.50 0.75 4,241 3,230 2,202 406 3,748 2,735
0.75 1.00 1,694 2,015 519 53 1,928 1,232
1.00 1.25 1,741 958 85 19 1,136 186
1.25 1.50 535 143 6 1 213 51
1.50 1.75 111 26 2 0 54 27
1.75 2.00 35 8 0 0 13 9
2.00 2.25 1 1 0 0 15 8
2.25 2.50 1 0 0 0 6 1
2.50 2.75 0 0 0 0 2 0
2.75 3.00 0 0 0 0 2 0
3.00 3.25 0 0 0 0 1 0
3.25 3.50 0 0 0 0 1 0
3.50 3.75 0 0 0 0 0 0
3.75 4.00 0 0 0 0 0 0
4.00 4.25 0 0 0 0 0 0
4.25 4.50 0 0 0 0 0 0
4.50 4.75 0 0 0 0 0 0
4.75 5.00 0 0 0 0 0 0
SRmax (ksi) = 2.50 2.25 1.75 1.50 3.50 2.50
Table 4.2 – Stress-range histogram for New Jersey back span members

Field Testing and Evaluation of Electroslag Welds on the Commodore Barry Bridge Final Report
9
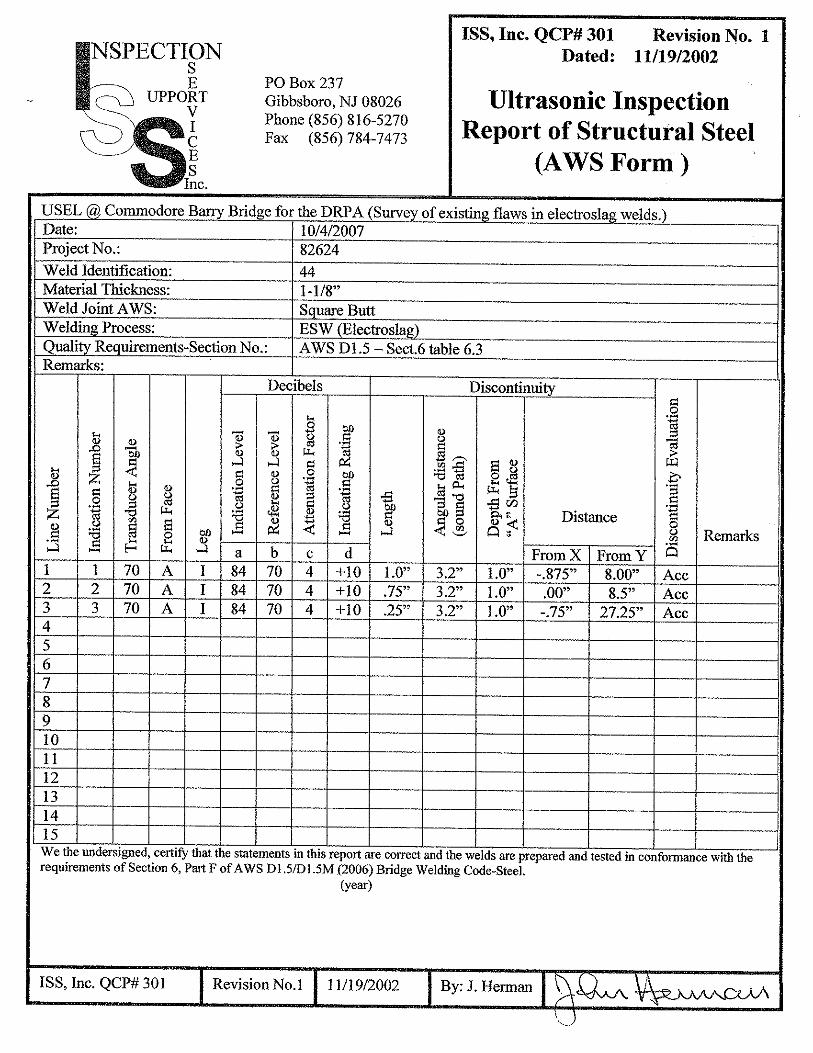
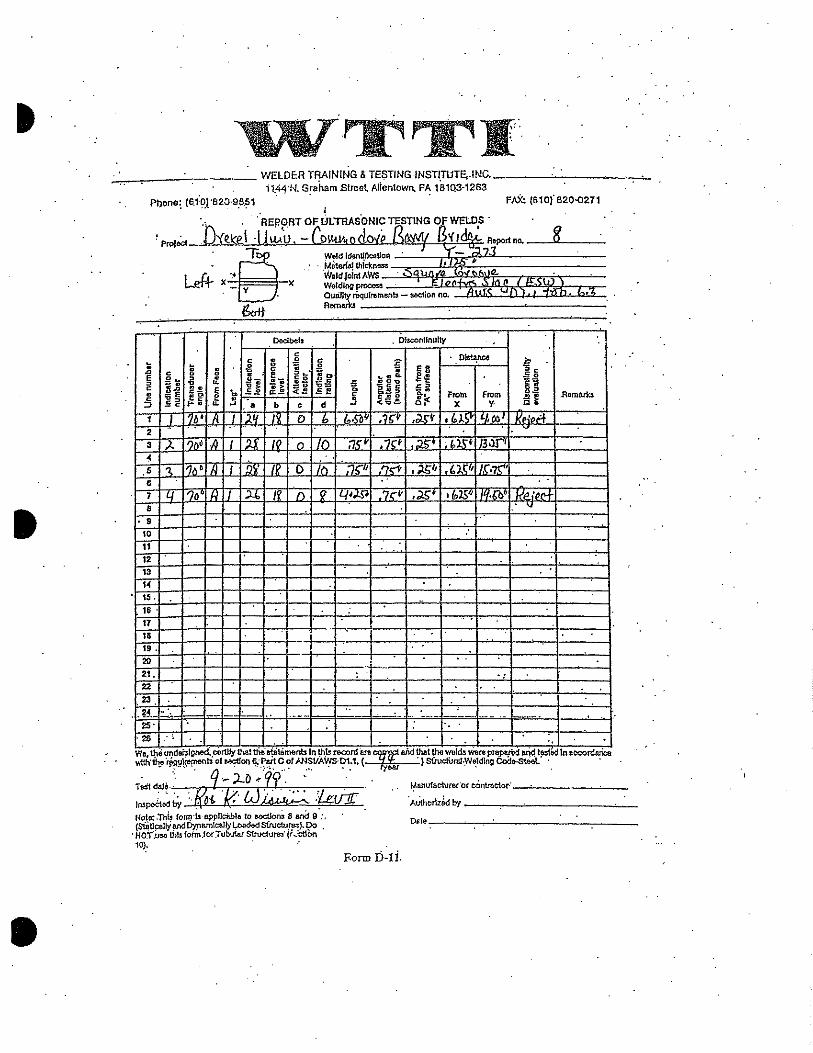
5. Ultrasonic Testing Results This section of the report presents a review of the current and past ultrasonic
testing (UT) on the eight electroslag welds under investigation. Since the original Weidlinger investigation in 1988 [1], three UT inspections have been performed on the eight electroslag welds identified by Weidlinger.
The first UT inspection was performed by WTTI in 1999 [2] under the direction of Drexel University. The second inspection was performed by Pennoni Associates in 2006 [3]. Finally, in conjunction with the field testing discussed in this report, a third UT inspection was performed by Bureau Veritas North America in 2007 [4]. The inspection reports for each of these three inspections are included in Appendix C.
A summary of the three inspections is presented in Table 5.1. For each inspection, all defects found are listed along with the dB indication rating and flaw length. It can be seen that there is significant discrepancy between the 1999 inspection and the subsequent inspections. However, there is good agreement between the 2006 and 2007 inspections.
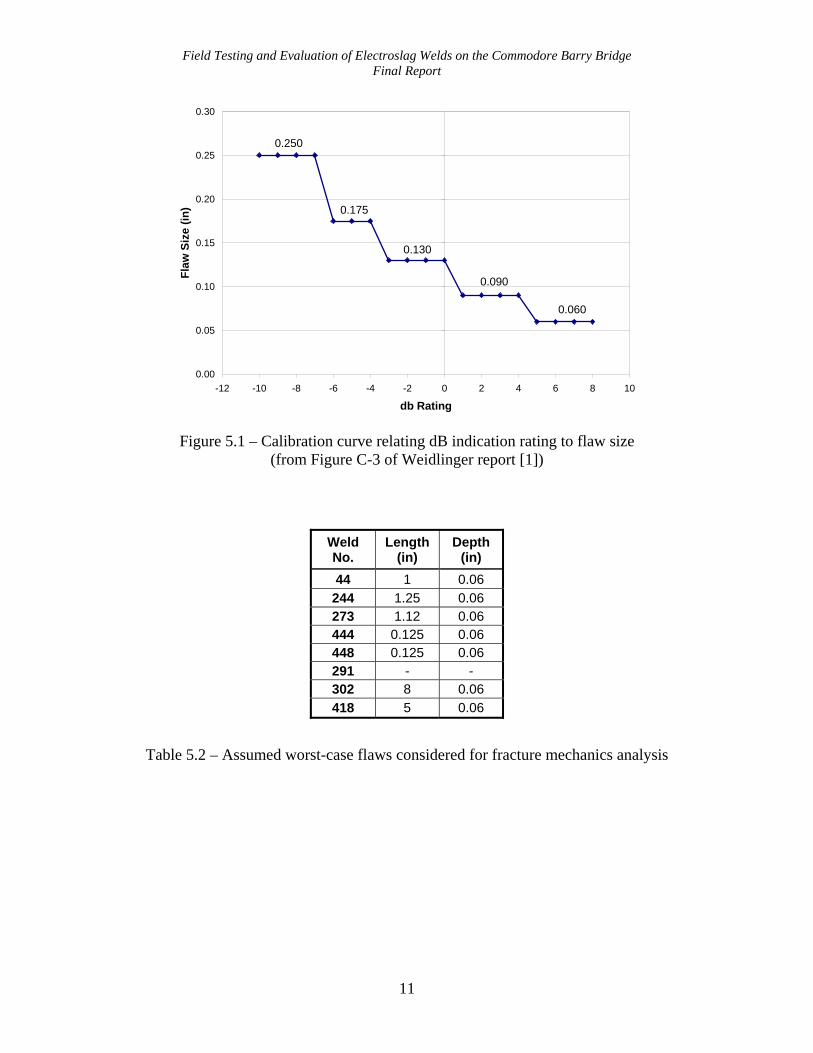
The results from the latest UT inspection are used for the subsequent fracture mechanics analysis presented in Section 6. In the 1988 Weidlinger study, a calibration between flaw size and dB indication rating was made by physically measuring flaws in core samples removed from the bridge. The calibration is presented in graphical form in Figure 5.1.
It can be seen that some welds have multiple flaws. For the purposes of the fracture mechanics analysis, the most severe flaw in each weld is considered. These flaw sizes are presented in Table 5.2.

Field Testing and Evaluation of Electroslag Welds on the Commodore Barry Bridge Final Report
10
1999 (WTTI) 2006 (Pennoni) 2007 (BV) Weld No.
Flaw No. dB
rating length
(in) dB
rating length
(in) dB
rating length
(in) 1 6 0.25 9 0.25 10 1 2 8 0.25 2 0.5 10 0.75 3 8 0.25 10 0.25
44
4 10 0.25 1 9 2 4 1.25 5 1.25 2 9 5 4 0.5 5 0.5 244 3 3 3.5 1 6 6.5 10 1.25 10 1.12 2 10 0.75 3 10 0.75
273
4 8 4.25 1 3 0.125 15 0.125 15 0.125 2 6 0.125 444 3 10 0.125 1 6 0.25 14 0.125 14 0.125 2 6 0.25 3 6 0.25
448
4 10 0.125 1 10 0.125 2 10 0.125 3 10 0.125 4 10 0.125 5 4 0.125 6 10 0.125 7 6 0.125 8 4 1 9 4 0.125
291
10 10 0.25
none none
1 6 2.5 13 3 13 3 302 2 6 10 11 8 11 8 1 3 0.25 11 0.5 11 5 418 2 0 0.25 7 0.5 7 5
Table 5.1 – Summary of UT results for the eight welds under investigation, red shading denotes rejectable flaw, green denotes acceptable flaw
Field Testing and Evaluation of Electroslag Welds on the Commodore Barry Bridge Final Report
11
0.060
0.090
0.130
0.175
0.250
0.00
0.05
0.10
0.15
0.20
0.25
0.30
-12 -10 -8 -6 -4 -2 0 2 4 6 8 10
db Rating
Flaw
Siz
e (in
)
Figure 5.1 – Calibration curve relating dB indication rating to flaw size
(from Figure C-3 of Weidlinger report [1])
Weld No.
Length (in)
Depth (in)
44 1 0.06 244 1.25 0.06 273 1.12 0.06 444 0.125 0.06 448 0.125 0.06 291 - - 302 8 0.06 418 5 0.06
Table 5.2 – Assumed worst-case flaws considered for fracture mechanics analysis

Field Testing and Evaluation of Electroslag Welds on the Commodore Barry Bridge Final Report
12
6. Fracture Mechanics Evaluation The full penetration welded detail with thickness transition is considered a fatigue
Category B per AASHTO, with a CAFL of 16 ksi. However, AASHTO requires that the weld soundness be established by NDT. Per the latest UT inspection, only one of these welds (number 244) has rejectable flaws and therefore cannot be considered Category B.
The peak stress range observed at any strain gage was 3.5 ksi, significantly less than this CAFL. Therefore, for all welds other than 244, fatigue cracking is not expected per the AASTHO requirements.
To evaluate Weld 244, a fracture mechanics approach is used. Using the measured stress range histograms and the estimated flaw size based on the results of the UT inspection, the potential for fatigue crack growth is evaluated. Though only Weld 244 has rejectable flaw, other welds have acceptable flaws. The fracture mechanics approach is used to evaluate these welds as well.
The range of stress intensity at the crack tip is calculated using standard fracture mechanics equation [5]:
aSFFFFK Rgews π=Δ (Eqn. 6.1) Where: Fs = free surface correction factor Fw = back free surface correction factor Fe = crack shape correction factor Fg = non-uniform stress correction factor SR = stress range (ksi) a = crack size (in) ΔK = applied range of stress intensity at the crack tip (ksi√in) Fatigue crack growth can be expected if the applied range of stress intensity, ΔK,
exceeds the fatigue threshold intensity, known as ΔKth. A conservative lower bound for the steel used on this bridge of 2.75 ksi√in is considered. For each weld tested, an estimate of ΔK will be made and compared to ΔKth.
No surface cracks were found in any of the welds under investigation. Therefore, the flaws are embedded within the weld. It has been conservatively assumed that the flaw are located within a plane perpendicular to the applied stress. The lengths and depths of the flaws were estimated using the results from the UT inspection and a calibration between UT dB reading and flaw size performed in the 1988 Weidlinger report.
An embedded elliptical crack model is considered for this evaluation. The cracks have been idealized as shown in Figure 6.1. Note that the plate thickness is equal to 2w. The dimension “b” is taken from the 2007 UT inspection report (noted as flaw length on the report). The dimension “a” is determined by the calibration chart provided in the 1988 Weidlinger report, which plots UT dB indication on the horizontal axis and flaw size in inches on the vertical axis. This relation was determined from core samples taken from welds that were evaluated with UT in the field. The size of the flaws were obtained

Field Testing and Evaluation of Electroslag Welds on the Commodore Barry Bridge Final Report
13
by examining the cores. For simplicity, the flaws have been assumed to exist at mid-thickness.
Figure 6.1 – Illustration of fracture mechanics model used to evaluate weld flaws
(embedded elliptical crack)
Based on the model shown above, the correction factors can be calculated as
follows:
0.1=sF (free surface correction factor) 0.1=gF (non-uniform stress correction factor)
⎟⎠⎞
⎜⎝⎛=
waFw 2
sec π (back free surface correction factor) (Eqn. 6.2)
)(
1kE
Fe = (crack shape correction factor) (Eqn. 6.3)
E(k) is equal to the complete elliptic integral of the second kind. It should be noted that the equation for Fe is given for the end of the minor axis of the ellipse, yielding the maximum value of ΔK. It is given by:
∫ −=2/
0
22 sin1)(π
ϕϕdkkE (Eqn. 6.4)
or expressed as a power series:
n
knnkE
n
n n 21!2)!2(
2)(
22
0 22 −⎥⎦⎤
⎢⎣⎡= ∑∞
=
π (Eqn. 6.5)
w w
a a
σ
σ
a a
b
b 1 1
Section 1-1

Field Testing and Evaluation of Electroslag Welds on the Commodore Barry Bridge Final Report
14
where,
2
1 ⎟⎠⎞
⎜⎝⎛−=
bak (Eqn. 6.6)
The above equations were used to calculate the applied ΔK at each weld. The results are summarized in Table 6.1 below. As a very conservative assumption, all cycles were assumed to be equal to the maximum measured stress range (i.e., all measured cycles at the maximum value),
Weld No.
t = 2w (in)
a (in)
b (in)
SR,max (ksi) k Fe Fw
ΔK (ksi√in)
44 1.125 0.03 0.5 2.50 0.996 0.987 1.002 0.76 244 1.125 0.03 0.625 2.25 0.998 0.991 1.002 0.69 273 1.625 0.03 0.56 2.25 0.997 0.989 1.001 0.68 444 1.125 0.03 0.0625 3.50 0.770 0.768 1.002 0.83 448 1.5 0.03 0.0625 3.50 0.770 0.768 1.001 0.83 291 1.25 No discernible flaws from UT evaluation 302 1.375 0.03 4 2.75 1.000 0.997 1.001 0.84 418 1.5 0.03 2.5 1.75 1.000 0.997 1.001 0.54
Table 6.1 – Summary of calculated ΔK values for each weld. (SR,max for Weld 448 set equal to maximum observed stress range from other welds)
As noted in the table, the applied stress intensities, ΔK, calculated assuming all cycles have a magnitude equal to the maximum measured stress range are significantly less than the threshold stress intensity, ΔKth of 2.75 ksi√in. In fact, the maximum ΔK is
equal to 0.84 ksi√in, or 30% of the threshold. At Weld 244 (the only weld with
rejectable discontinuities), ΔK is equal to 0.69 ksi√in (25% of the threshold). As a result, fatigue crack growth is not expected at any of the eight welds.

Field Testing and Evaluation of Electroslag Welds on the Commodore Barry Bridge Final Report
15
7. Findings The measured stress ranges at all strain gaged locations are low. The full
penetration welded detail with thickness transition is considered a fatigue Category B per AASHTO, with a CAFL of 16 ksi. However, AASHTO requires that the weld soundness be established by NDT. Only one of these welds (Weld 244) has rejectable flaws and therefore cannot be considered Category B.
The peak stress range observed at any strain gage was 3.5 ksi, significantly less than this CAFL. Therefore, for all welds other than 244, fatigue cracking is not expected per the AASTHO requirements.
The effect on the fatigue performance of the weldments in question as a result of the presence of flaws has been evaluated using a fracture mechanics approach. This analysis has shown that in all cases, the applied stress range intensity (ΔK) is significantly less than the threshold (ΔKth). In the worst case, (ΔK /ΔKth) was 30%. At Weld 244 (the only weld with rejectable discontinuites) (ΔK /ΔKth) was 25%.
Therefore, fatigue crack growth is not expected at any of the eight weldments under the current traffic loading conditions. Future field evaluations should be performed to evaluate the effect of a potential increase in traffic load.
8. Recommendations Based on the results and findings presented above, the following
recommendations are made:
1. Each of the eight critical welds identified above should be UT tested during the next biannual cycle of inspection in 2008 or the following cycle in 2010.
2. If there is no significant change in the UT results, further UT testing need not be repeated in the future, except as noted in recommendation number 3 below. A decrease in a dB reading of more than 4 dB or a dB reading of less than +5dB should be considered a significant change.
3. Field monitoring of stresses and UT testing of each of the eight critical welds should be repeated when the ADTT increases by more than 50% from its current value (4,000), when the posted or maximum legal load for the bridge is increased, or in 20 years, whichever occurs first.

Field Testing and Evaluation of Electroslag Welds on the Commodore Barry Bridge Final Report
16
9. References
1. Weidlinger Associates, “Commodore Barry Bridge, Electroslag Welds Investigation, Final Report,” May 1988.
2. Welder Training and Testing Institute, Inc., “Report of Ultrasonic Testing of Welds, Commodore Barry Bridge,” August 1999.
3. Pennoni Associates, Inc., “Ultrasonic Examination Report, Commodore Barry Bridge,” September 2006.
4. Bureau Veritas North America, Inc., “Ultrasonic Inspection Report of Structural Steel, Commodore Barry Bridge,” October 2007.
5. Zettlemoyer, N. and Fisher, John W., “Stress Gradient and Crack Shape Effects on Stress Intensity at Welded Details,” Welding Research Supplement, August 1978.

APPENDIX A
Instrumentation Plans


APPENDIX B
Development of Stress-range Histograms used to Calculate Fatigue Life

Field Testing and Evaluation of Electroslag Welds on the Commodore Barry Bridge Final Report
B-2
B.1 Stress-Range Histograms Stress-range histogram data were developed from the continuous time-history
data collected during Phase 2 of the long-term monitoring. This histograms represent the random variable-amplitude stress-range spectrum for the selected strain gages. It has been shown that a variable-amplitude stress-range spectrum can be represented by an equivalent constant-amplitude stress range equal to the cube root of the mean cube (rmc) of all stress ranges (i.e., Miner’s rule) [1] (i.e., Sreff = [ΣαiSri
3]1/3). During the long-term monitoring program, stress-range histograms were
developed using the rainflow cycle counting method [2]. Although several other methods have been developed to convert a random-amplitude stress-range response into a stress-range histogram, the rainflow cycle counting method is widely used and accepted for use in most structures.
The rainflow cycle counting method considers a fixed period (10 minutes was used for this project) of time-history data (i.e., stress versus time). First, the tensile and compressive peaks are determined. Then the peaks are paired up to determine the number and magnitude of stress range cycles which are totaled to form a stress-range histogram for that particular period of time. This process is repeated for the next segment of time. The histograms are summed in order to develop a cumulative stress-range histogram. It should be noted that since the peaks are paired up within a block of time (e.g., 10 min.), one stress cycle may not necessarily be the result of one vehicle. For instance if one truck causes tensile stress in a detail while crossing in the eastbound lanes, and a similar truck causes compressive stress at the same detail while crossing in the westbound lanes (both crossings occur within the same 10 minute block of time), the stress range would be the peak-to-peak stress caused by the two trucks (assuming no other vehicles cross the bridge in this time period).

Field Testing and Evaluation of Electroslag Welds on the Commodore Barry Bridge Final Report
B-3
References:
1. Miner, M.A., “Cumulative Damage in Fatigue,” Journal of Applied Mechanics,
Vol. 1, No.1, Sept., 1945. 2. Downing S.D., Socie D.F., “Simple Rainflow Counting Algorithms,”
International Journal of Fatigue, January 1982.

APPENDIX C
UT Inspection Reports
Bureau Veritas, 2007 (8 pages) Pennoni Associates, 2006 (8 pages)
WTTI, 1999 (8 pages)


![Client Print [Read-Only]virginiadot.org/projects/resources/I-81-fluorpresentation.pdfthe Fluor nAdvantus Strategies n Anderson & Associates, Inc. n Bear Stearns n DMJM+HARRIS n Granite](https://img.pdfslide.us/doc/110x75/5f64d231767586654b748c25/client-print-read-only-the-fluor-nadvantus-strategies-n-anderson-associates.jpg)