Embed Size (px)
Citation preview
Michael Irlacher:
Multi-Product Firms, Endogenous Sunk Costs, andGains from Trade through Intra-Firm Adjustments
Munich Discussion Paper No. 2014-31
Department of EconomicsUniversity of Munich
Volkswirtschaftliche FakultätLudwig-Maximilians-Universität München
Online at http://epub.ub.uni-muenchen.de/21023/

Multi-Product Firms, Endogenous Sunk Costs, and
Gains from Trade through Intra-Firm Adjustments�
Michael Irlacher
University of Munichy
June 25, 2014
Abstract
In this paper, I investigate welfare gains associated with trade induced intra-�rm ad-
justments of multi-product �rms. To disentangle the welfare gains, I split up the R&D
portfolio of a multi-product �rm into three di¤erent channels: i) product innovation, ii)
investments in the degree of product di¤erentiation, and iii) process innovation. Trade
integration enables �rms to exploit economies of scale as innovation requires upfront
development costs and encourages �rms to spend more on R&D. I derive the indirect
utility function and show that consumers bene�t from this behavior through a larger
product range (love of variety) which is also more di¤erentiated (love of diversity).
Furthermore, a larger market is associated with technology upgrading. The resulting
cost savings are passed on to consumers, leading to welfare gains from lower prices.
Keywords: International Trade, Multi-Product Firms, Gains from Trade, R&D,
Cannibalization E¤ect, Product Di¤erentiation
JEL Classi�cation: F12, F61, L25
�I am grateful to Swati Dhingra, Carsten Eckel, Florian Unger, and participants at Workshop "Interna-tionale Wirtschaftsbeziehungen" in Goettingen, 2013, ETSG Conference in Birmingham, 2013, and IO-TradeSeminar Munich for their helpful comments.
yDepartment of Economics, D-80539 Muenchen, Germany; tel.: (+49) 2180 - 2754 e-mail:[email protected]; internet: http://www.intecon.vwl.uni-muenchen.de/.
i
1 Introduction
In 1942, Joseph Schumpeter argued that innovation activity is carried out by large �rms, for
whom R&D is endogenous. R&D projects often go hand in hand with high development costs
and, therefore, a su¢ ciently large scale of �rm sales is required to cover these costs. Trade
liberalization increases the e¤ective size of the market which induces innovation activities
through economies of scale. These �ndings are validated by recent empirical studies. For
Canadian and Argentinian �rms, Lileeva and Tre�er (2010) and Bustos (2011) document that
reductions in tari¤s lead to investments in productivity-enhancing activities by exporting
�rms. After trade liberalization, exporters who bene�t from the larger market are more
technology intensive than nonexporters.
Recent contributions in international trade emphasize the fact that most industries are
dominated by �rms that produce more than one product.1 In this paper, I address the R&D
portfolio of a multi-product �rm (MPF) whereby the focus is to analyze separately di¤erent
types of research. Firms may invest in product innovation and product di¤erentiation besides
investments in production processes. Unbundling these di¤erent strands of innovation helps
to distinguish between di¤erent welfare channels. In contrast to models with single-product
�rms where gains from trade originate at the industry-level through entry or exit of �rms
and "between-�rm" reallocations of market shares, I highlight intra-�rm adjustments as a
source for welfare improvements.
Globalization increases the market but also reinforces competition in these markets. The
large literature on heterogeneous �rms has shown that the latter e¤ect dominates for low-
performing �rms. I consider large MPFs, therefore I focus on the market size e¤ect of
globalization. Rising sales volumes in a larger market raise the returns to the di¤erent types
of innovation through economies of scale. In my model, a �rm weighs the marginal bene�t
of each type of innovation against the �xed upfront development costs and as the marginal
bene�t of innovating is increasing in the market size, more investments are encouraged.
A main element of my theory are demand linkages stressed in recent contributions to
the international trade literature on MPFs (see for instance: Eckel and Neary (2010) and
Dhingra (2013)). In these papers, �rms internalize a cannibalization e¤ect when introducing
additional varieties to their product portfolio. This means, if varieties within an MPF are
horizontally di¤erentiated, adding a new product will create a negative demand externality
on all other products of this �rm. In my framework, the innovating �rm can dampen this
negative externality of product innovation by investing in the degree of product di¤erentia-
1Bernard et al. (2010) report the dominance of MPFs. Although MPFs represent a minority of 39 percentof �rms, these �rms account for 87 percent of output. In a trade context, Bernard et al. (2007) documentfor the year 2000 that �rms that export multiple products account for 99.6 percent of export value.
1

tion. It is natural to assume that the strength of the cannibalization e¤ect depends on the
substitutability of products within the product range of a �rm. Adding products di¤ering
only slightly from each other, will have a strong cannibalizing impact on existing varieties.
However, a product range that spans products which are highly di¤erentiated is less suscep-
tible to cannibalization. To avoid cannibalization among products, �rms can invest in new
blueprints or product speci�c attributes such as di¤erences in functional features or design.
Furthermore, promotion activities such as advertisement or marketing campaigns help to
showcase the di¤erences between products. All these measures come along with �xed costs,
however they are implemented to satisfy the consumers desire to choose from a broad and
diversi�ed product range.
The key result of the model is that a larger market or trade cost reductions enhance
the pro�t maximizing product range of an MPF and optimal spending in both product
di¤erentiation and process innovation. An MPF that widens its product range loses market
shares of its existing products through cannibalization. This makes additional spending in
product di¤erentiation worthwhile. Furthermore, sunk costs for product di¤erentiation and
process innovation are determined endogenously and depend on the level of investment and
not on scale and scope of production. Thus, a rising market size enables �rms to exploit
economies of scale in innovation and gives rise to increasing optimal investment levels as
investment costs can be spread over more units of output. Beyond this, I show that returns
to both product di¤erentiation and process innovation do not just depend on the size of
the market but also on the e¢ ciency of research input utilization. The Global Innovation
Index (2013) reports disparities and persistent innovation di¤erences among regions.2 This
is indicative of di¤erences in the scope for product di¤erentiation and the opportunities
to reduce production costs between �rms in di¤erent industries or in developed and less
developed countries. The more e¢ cient research input is transformed into research output,
the higher will be the equilibrium investment levels and the larger will be the adjustments to
globalization. This insight is important to keep in mind when discussing consumers welfare
in the context of my model.
On the demand side, I specify quadratic preferences à la Melitz and Ottaviano (2008)
and compute the indirect utility function as an appropriate measure for welfare. Consumers
bene�t from more variety (love of variety), lower prices, and, notably, from the degree of
product di¤erentiation. I refer to this property of the utility function as love of diversity.
The latter means that consumers value a given product range more when products are more
2The Global Innovation Index is published by the business school INSEAD and the World IntellectualProperty Organization (WIPO), a specialized agency of the United Nations. It ranks 141 economies on thebasis of their innovation capabilities and results.
2
di¤erentiated or rephrasing it, the marginal utility of each newly introduced product is in-
creasing in the degree of product di¤erentiation. Having disentangled these three individual
welfare channels, I discuss the gains from trade liberalization arising from intra-�rm adjust-
ments. Globalization induces an MPF to enlarge and diversify its product range. Given
the love of variety and love of diversity properties of the utility function, this improves con-
sumer welfare. Furthermore, a larger market is associated with technology upgrading. The
resulting cost savings are passed on to consumers, leading to welfare gains from lower prices.
However, as indicated above, I show that the gains from trade depend on the e¢ ciency of
the investments. Conducting the thought experiment of �rms innovating in two di¤erent
scenarios - a developed and a less developed country -, I argue that trade liberalization will
improve welfare more when innovation input is converted e¢ ciently in valuable output.
This model is related to the growing trade literature on MPFs with quadratic preferences
for di¤erentiated varieties. In Eckel et al. (2011), MPFs invest in the quality of their prod-
ucts. Because of the assumption of �exible manufacturing, �rms will invest most in their core
product which is sold at the largest scale. Dhingra (2013) analyzes the impact of trade policy
on product and process innovation, keeping the degree of product di¤erentiation exogenous.
Similar to my model, economies of scale increase optimal spending for process innovation.
Separating between internal and external competition, she shows that, in response to trade
liberalization, �rms will reduce their product range to dampen the cannibalization e¤ect.
Firms in my model also try to mitigate cannibalization, however, as I allow for investments
in product di¤erentiation, the channel stressed here is a di¤erent one.
To model product di¤erentiation, I build on recent contributions with single-product �rms
by Lin and Saggi (2002), Rosenkranz (2003), and Bastos and Straume (2012). These authors
also assume quadratic preferences and derive optimal investment strategies for single-product
�rms.3 Firms invest to horizontally di¤erentiate their products from those produced by their
rivals. Therefore, the motive for the investment is di¤erent in comparison to this paper with
MPFs. Lin and Saggi (2002) explicitly point out that in a framework with two single-
product �rms, investing more in product di¤erentiation also has a negative strategic e¤ect.
From a consumer�s perspective, also the rival�s product seems more di¤erentiated when a
�rm increases its spending for product di¤erentiation. The resulting increase in the other
�rm�s output hurts the investing �rm. Having the same two products produced by one MPF,
the MPF internalizes the externality from the investment and, therefore, will di¤erentiate its
3Ferguson (2011) proposes a model with monopolistic competition and CES preferences. In his model,single-product �rms invest in horizontal product di¤erentiation to di¤erentiate their product from the prod-ucts of their rivals. Similar to my model, the author investigates how the size of the market a¤ects the extentof endogenous product di¤erentiation.
3

products more to avoid cannibalization.4 In a multi-product Dixit-Stiglitz framework, Lorz
and Wrede (2009) endogenize the degree of product di¤erentiation.5 In a notably di¤erent
theoretical setup, these authors also evaluate how �rms respond to globalization in terms of
product variety and diversity. However, the focus of my paper is di¤erent, as I split up the
R&D portfolio of an MPF to disentangle the welfare gains from globalization.
The remainder of the article is organized as follows: In the next section, I present the
theoretical model where I start with the optimal consumer behavior in section 2.1. Section
2.2 introduces the second stage of the model where a �rm decides on its optimal scale and
scope of production. In the �rst stage in section 2.3, a �rm chooses optimal spending in
both product di¤erentiation and process optimization. I assume that the �rm perfectly
anticipates the outcome of the second stage. In section 2.4, I conduct a comparative statics
exercise where the focus is on the e¤ects of globalization. Finally, in section 2.5, I disentangle
the implications of globalization on consumer welfare. Section 3 concludes and summarizes
results. I provide all mathematical derivations in the Appendix.
2 The Model
In this part of the paper, I introduce a two stage model of MPFs. In the �rst stage, an
MPF chooses its spending on product di¤erentiation and process innovation, anticipating the
e¤ects on optimal scale and scope in the following stage. By investing in process innovation,
an MPF can simply lower its production costs. As I have already noted in the introduction,
investments in product di¤erentiation mean investing in new blueprints for distinct product
features and designs or marketing expenses. These investments make sure that from a
consumer�s point of view the product portfolio o¤ers a huge variety of unique products.
From a �rm�s perspective, however, these investments are made to reduce cannibalization
within its own product range. Both types of investments are costly and require upfront
endogenous sunk costs. In the second stage, the �rm simultaneously chooses the quantity
produced of each good and the number of products produced. Production incurs variable
costs and a �xed capacity cost for each new production line.
The economy under consideration involves a homogeneous goods industry and a di¤er-
entiated goods industry. Production in the homogeneous industry is subject to constant
4In the Appendix of this paper, I provide a formal analysis for this result. In a simpli�ed version of themain model, I show how the incentives to innovate in product di¤erentiation di¤er between single-product�rms and MPFs.
5In the related industrial organization literature, Lambertini and Mantovani (2009) develop a dynamicmodel of MPFs and investigate whether there exists complementarity or substituability between investmentsin product and process innovation.
4

returns to scale with a unit cost requirement and there is no contingence of R&D. For the
sake of simplicity, I characterize the di¤erentiated industry by one active monopoly MPF.6
I begin this section with the analysis of consumer preferences and derive optimal demand.
Then, the focus is on the optimal behavior of an MPF in the di¤erentiated industry. Solving
the two-stage model via backwards induction, I start deriving optimal scale and scope of the
�rm. Subsequent, in the �rst stage of the game, I derive two conditions for optimal spending
in product di¤erentiation and process innovation. In a comparative statics exercise, I focus
on the e¤ects of globalization on optimal R&D expenditures. In particular, I investigate how
decreasing transport costs or an increasing market size a¤ect optimal �rm behavior. The
model is rounded down by a section on the gains from trade arising from the within-�rm
adjustments. For that purpose, I derive the indirect utility function associated with the
underlying preference structure and discuss consumer welfare.
2.1 Consumer Behavior: Preferences and Consumer Demand
In this economy, L consumers maximize their utility de�ned over the consumption of a
homogeneous and a di¤erentiated product. Within the di¤erentiated sector, I further assume
that consumers buy a set out of a potential set e of the di¤erentiated product. The
preference structure of a representative consumer follows a quasi-linear speci�cation:7
U = q0 + u1; (1)
where q0 is the consumption of the homogeneous good which is sold at a price p0 = 1. The
latter serves as numeraire and absorbs any income e¤ects. Therefore, the following analysis
occurs in a partial equilibrium setting. u1 de�nes utility in the di¤erentiated sector and
displays a standard quadratic form:
u1 = aQ�1
2b
�(1� e (s))
Zi2e q(i)
2di+ e (s)Q2�. (2)
In this speci�cation, a and b represent non-negative preference parameters and q(i) denotes
per variety consumption with i 2 e. Total consumption by the representative consumeris given by Q �
Ri2e q(i)di. The parameter e (s) 2 [0; 1] is an inverse measure of product
di¤erentiation and is of central interest, as it can be chosen endogenously by a �rm. The
6I focus on intra-�rm adjustments, so competition between �rms plays only a second-order role. For anextension of a similar framework to oligopoly, the interested reader is referred to the Appendix in Eckel etal. (2011).
7These preferences combine the continuum quadratic approach to symmetric horizontal product di¤eren-tiation of Ottaviano, Tabuchi, and Thisse (2002) with the preferences in Neary (2009).
5

value of e (s) is determined by the level of investment s that an MPF spends on product
di¤erentiation. Further assumptions on e (s) will be discussed later on in the model. At this
point, however, it is important to notice that lower values of e (s) imply that products are
more di¤erentiated and hence less substitutable. The extreme case of e (s) = 1 denotes that
consumers have no taste for diversity in products and demand depends on aggregate output
only.
Consumers maximize utility subject to the budget constraint q0 +Ri2e p(i)q(i)di = I,
where p (i) denotes the price for variety i and I is individual income. Utility maximization
yields the following linear inverse individual demand function:
�p(i) = a� b [(1� e (s))q(i) + e (s)Q] , (3)
where � is the marginal utility of income, the Lagrange multiplier attached to the budget
constraint. Given the quasi-linear upper-tier utility, there is no income e¤ect, thereby im-
plying that � = 1. Market-clearing imposes that an MPF faces a market demand x(i) that
consists of the aggregated demand of all consumers Lq(i) for variety i. For the inverse market
demand, I derive
p(i) = a� b0 [(1� e (s))x(i) + e (s)X] , (4)
where a is the consumers�maximum willingness to pay, b0 � bLis an inverse measure for
the market size, and �nally, X �Ri2 x(i)di represents total demand in the di¤erentiated
industry. Eq. (4) reveals the price p (i) a consumer is willing to pay for variety i as negatively
dependent on a weighted average of the sales of variety i and total output of all available
varieties. From Eq. (4), I derive direct demand for variety i as:
x (i) =a
b0 (1� e (s) + e (s) �) �1
b0 (1� e (s))p (i) +e (s) �
b0 (1� e (s) + e (s) �) (1� e (s))p, (5)
where � describes the mass of consumed varieties in . The average price of di¤erentiated
varieties in the economy is given by p = 1=�Ri2 p (i) di.
In the model I present hereafter, a �rm can invest in the degree of product di¤erentiation
which a¤ects the cross elasticity between any two varieties. The cross elasticity of variety i
with respect to any other variety j is given by:
"i;j ����� @x (i)@x (j)
x (j)
x (i)
���� = e (s)
(1� e (s))x (j)
x (i). (6)
It is straightforward to see that investments in the degree of product di¤erentiation (lower
values of e (s)) reduce the cross elasticity "i;j and hence weaken the strength of the cannibal-
6
ization e¤ect within a �rms�portfolio. The lower is the substitutability between varieties,
the less does the output of any additional variety reduce the demand for the other products
within the portfolio.8 From a demand perspective, this is the reason why MPFs will invest
in the degree of product di¤erentiation in my model.
Lemma 1 By investing in the degree of product di¤erentiation, an MPF can lower the mag-nitude of the cannibalization e¤ect through a lower cross elasticity of demand between vari-
eties.
To conclude this section on preferences, I follow Melitz and Ottaviano (2008) and derive
the indirect utility function associated with the quadratic preferences as an appropriate
measure for welfare
U = I +�
2b (1� e (s) + e (s) �) (a� p)2 +
�
2b (1� e (s))�2p. (7)
The term �2p =1�
R �0(p (i)� p)2 di represents the variance of prices. The demand system
exhibits "love of variety", as welfare increases in the product range �, holding p and �2pconstant. Furthermore, welfare decreases in the average price and increases in the variance
of prices. In section 2.5, further important properties of Eq. (7) are discussed in detail.
2.2 Firm Behavior: Optimal Scale and Scope of the MPF
As already mentioned above, I start analyzing the optimal �rm behavior at the second stage
of the model. The �rm�s objective in this section is to maximize pro�ts by choosing both the
scale and scope of production. By doing this, a �rm considers R&D investments as given.
I assume a cost function c (i; k) for producing variety i, which depends on the technology
level k the �rm has chosen. I further suppose that each MPF has access to a continuum
of potential varieties, however, due to a �xed cost for new production lines it does not
necessarily produce all of them. Denoting the scope of the product portfolio by �, total
pro�ts are given by
� =
Z �
0
[p(i)� c(i; k)� t]x(i)di� �r�, (8)
8Furthermore, investments in the degree of product di¤erentiation also a¤ect the price elasticity ofdemand. Referring to Melitz and Ottaviano (2008), I express the price elasticity of demand as "i �j(@x (i) =@p (i)) (p (i) =x (i))j = p (i) = (pmax � p (i)), where pmax � (1�e(s))a+e(s)�p
(1�e(s)+e(s)�) is the choke price of thelinear demand system. Investments in the degree of product di¤erentiation a¤ect the choke price thusthe price elasticity. For a given average price p and product range �, investments in product di¤erenti-ation reduce the price elasticity and hence relax the �rms� internal "competition" between varieties as:@pmax
@e jp;�=const= � �(a�p)(1�e(s)+e(s)�)2 < 0.
7

where t is a uniform trade cost payable by the �rm on all the varieties it sells. r� represents
the �xed cost the �rm has to pay for each new production line. Firms simultaneously choose
the quantity produced of each good (optimal scale) and the mass of goods produced (optimal
scope).
Optimal Scale: Maximizing pro�ts in Eq. (8) with respect to x (i) implies the �rst-order
condition for scale:
@�
@x(i)= p(i)� c(i; k)� t� b0 [(1� e (s))x(i) + e (s)X] = 0, (9)
that leads to the optimal output of a single variety
x(i) =a� c(i; k)� t� 2b0e (s)X
2b0(1� e (s)) , (10)
with X �R �0x (i) di denoting total �rm scale.9 The negative impact of total �rm scale X on
the output of a single variety displays the cannibalization e¤ect:
@x(i)
@X= � e (s)
(1� e (s)) < 0. (11)
The strength of the cannibalization e¤ect depends on the substitutability of the varieties
within the product portfolio of the �rm, i.e. the parameter e (s). It is easily veri�ed, that
the magnitude of the cannibalization e¤ect in Eq. (11) is increasing in the value of e (s).
For the sake of simplicity and without loss of generality, I impose symmetry on the
production costs: c (i; k) = c (j; k) = c (k).10 Therefore, I rewrite Eq. (10) as:
x =a� c (k)� t
2b0 (1� e (s) + e (s) �) . (12)
Total �rm output is then simply given by:
X =� (a� c (k)� t)
2b0 (1� e (s) + e (s) �) . (13)
9The second-order condition for this maximization problem is given by: @2�@x(i)2
= @p(i)@x(i) � b
0 (1� e) �b0e @X
@x(i) < 0.
10Eckel and Neary (2010) assume a technology that embodies �exible manufacturing. A �rm possesses acore competence and marginal costs for any other variety rise in the distance to the core product. The ideathat �rms posses one core product is also featured in recent models by Arkolakis and Muendler (2010), Qiuand Zhou (2013), and Mayer et al. (2014).
8

Note that total output X in Eq. (13) rises in the product range �, however, output of
each variety x is decreasing in � due to the cannibalization e¤ect. Put it di¤erently, the
relationship between total �rm output X and the product range � is a concave function,
whereby the slope depends on the degree of product di¤erentiation e (s). Assuming perfectly
di¤erentiated products, i.e. e (s) = 0, the relation turns out to be linear.11
To derive the optimal price, I combine Eq. (12) with the inverse demand function Eq.
(4) and get:
p =a+ c (k) + t
2. (14)
Prices are increasing functions of both production and transportation costs.
Optimal Scope: I proceed and consider the �rm�s choice of its pro�t maximizing product
range. Besides the �xed costs r�, the extension of the product portfolio is also limited through
the additional cannibalization associated with the launching of further products. I rewrite
total pro�ts in Eq. (8) as follows
� =� (a� c (k)� t)2
4b0 (1� e (s) + e (s) �) � �r�, (15)
where operative pro�ts must be positive, i.e.
r� <(a� c (k)� t)2
4b0 (1� e (s) + e (s) �) . (16)
Maximizing Eq. (15) with respect to � implies the respective �rst-order condition for scope:12
@�
@�=(1� e (s)) (a� c (k)� t)2
4b0 (1� e (s) + e (s) �)2� r� = 0. (17)
From Eqs. (12) and (13), it follows that per variety output decreases but total �rm output
increases in additional products. An MPF optimally solves this trade-o¤ and adds new
varieties until the marginal return of an additional variety equals the �xed cost r� of an
investment in additional capacity. From inspection of Eq. (17), it is straightforward to see
that the marginal return of new varieties is decreasing in the number of products �. Solving
11Total �rm outputX is an increasing function of the product range � as: @X@� =(1�e(s))(a�c(k)�t)2b0(1�e(s)+e(s)�)2 > 0. The
second derivative is negative: @2X@�2
= � e(s)(1�e(s))(a�c(k)�t)b0(1�e(s)+e(s)�)3 < 0, which implies a concave relation between
the variables X and �.12The second-order condition is given by: @
2�@�2
= � e(s)(1�e(s))(a�c(k)�t)22b0(1�e(s)+e(s)�)3 < 0:
9

for the optimal product range yields:
� =
(a� c (k)� t)r�
(1�e(s))b0r�
�� 2 (1� e (s))
2e (s). (18)
The condition on r� stated in Eq. (16) ensures that the product range takes positive values.
The optimal product range rises with falling �xed costs r� and falling variable costs c (k).
Furthermore, I am interested in the e¤ects of globalization on the product range of an MPF.
In my model, globalization is captured through falling trade costs t or a rising market size
L (i.e. lower values of b0 � bL). Inspecting Eq. (18) reveals the multiplicative structure
of the �xed costs for product innovation r� and the inverse measure for the market size b0.
Therefore, an increase in the market size L has the same e¤ect as decreasing �xed costs r�.
I interpret the term b0r� as the perceived costs of product innovation which are lower in a
larger market.
In the �rst stage of the model, the �rm can invest in the degree of product di¤erenti-
ation. Therefore, it is of further interest how this investment a¤ects the optimal product
range of an MPF. It can be shown that a larger scope for product di¤erentiation induces the
�rm to enlarge its product range �. The reason for this is that lower values of e(s) imply
more investments in blueprints for product speci�c features or marketing which reduce can-
nibalization among varieties. These investments create a broader spectrum of technological
opportunities within a �rm can establish more varieties. I summarize these results in the
following proposition.
Proposition 1 Lower values of trade costs t or a larger market size L increase the pro�tmaximizing product range of an MPF, i.e.
d�
dt< 0 and
d�
dL> 0. (19)
Furthermore, a rising degree of product di¤erentiation (lower values of e (s)) dampens the
cannibalization e¤ect and, hence, induces an extension of the product range, i.e.
d�
de< 0. (20)
All derivatives are presented in the Appendix.
10
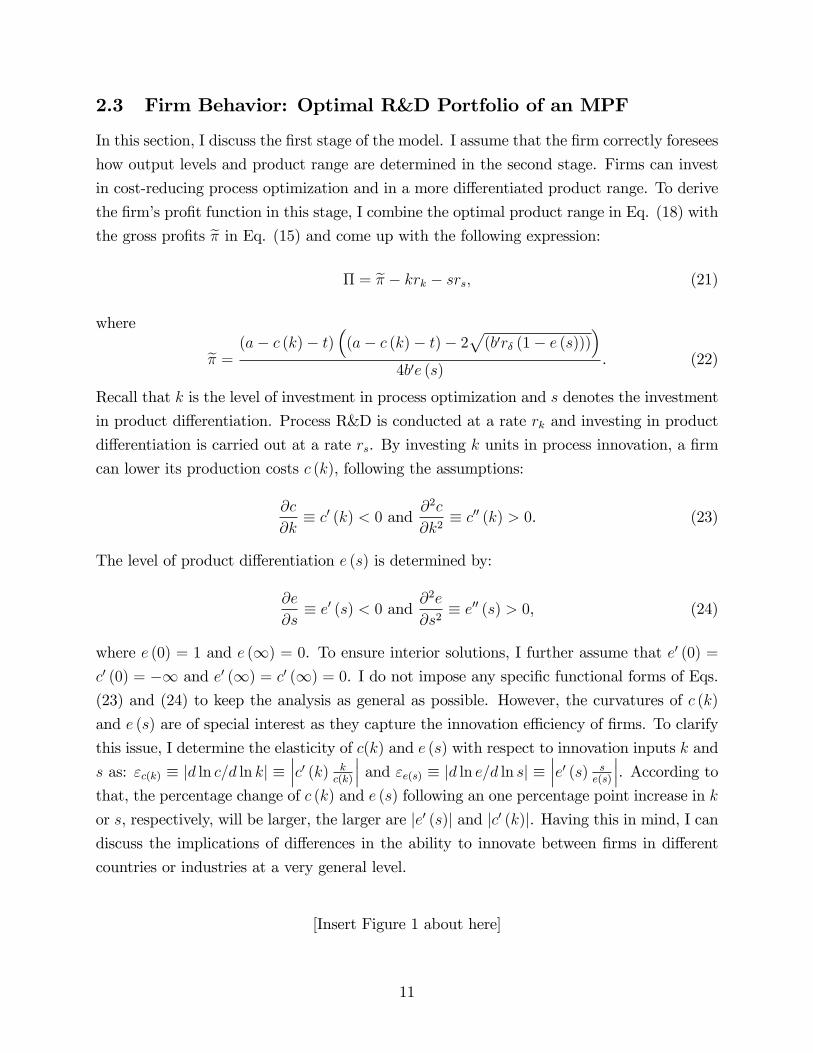
2.3 Firm Behavior: Optimal R&D Portfolio of an MPF
In this section, I discuss the �rst stage of the model. I assume that the �rm correctly foresees
how output levels and product range are determined in the second stage. Firms can invest
in cost-reducing process optimization and in a more di¤erentiated product range. To derive
the �rm�s pro�t function in this stage, I combine the optimal product range in Eq. (18) with
the gross pro�ts e� in Eq. (15) and come up with the following expression:� = e� � krk � srs; (21)
where
e� = (a� c (k)� t)�(a� c (k)� t)� 2
p(b0r� (1� e (s)))
�4b0e (s)
. (22)
Recall that k is the level of investment in process optimization and s denotes the investment
in product di¤erentiation. Process R&D is conducted at a rate rk and investing in product
di¤erentiation is carried out at a rate rs. By investing k units in process innovation, a �rm
can lower its production costs c (k), following the assumptions:
@c
@k� c0 (k) < 0 and @
2c
@k2� c00 (k) > 0. (23)
The level of product di¤erentiation e (s) is determined by:
@e
@s� e0 (s) < 0 and @
2e
@s2� e00 (s) > 0, (24)
where e (0) = 1 and e (1) = 0. To ensure interior solutions, I further assume that e0 (0) =c0 (0) = �1 and e0 (1) = c0 (1) = 0. I do not impose any speci�c functional forms of Eqs.(23) and (24) to keep the analysis as general as possible. However, the curvatures of c (k)
and e (s) are of special interest as they capture the innovation e¢ ciency of �rms. To clarify
this issue, I determine the elasticity of c(k) and e (s) with respect to innovation inputs k and
s as: "c(k) � jd ln c=d ln kj ����c0 (k) k
c(k)
��� and "e(s) � jd ln e=d ln sj � ���e0 (s) se(s)
���. According tothat, the percentage change of c (k) and e (s) following an one percentage point increase in k
or s, respectively, will be larger, the larger are je0 (s)j and jc0 (k)j. Having this in mind, I candiscuss the implications of di¤erences in the ability to innovate between �rms in di¤erent
countries or industries at a very general level.
[Insert Figure 1 about here]
11
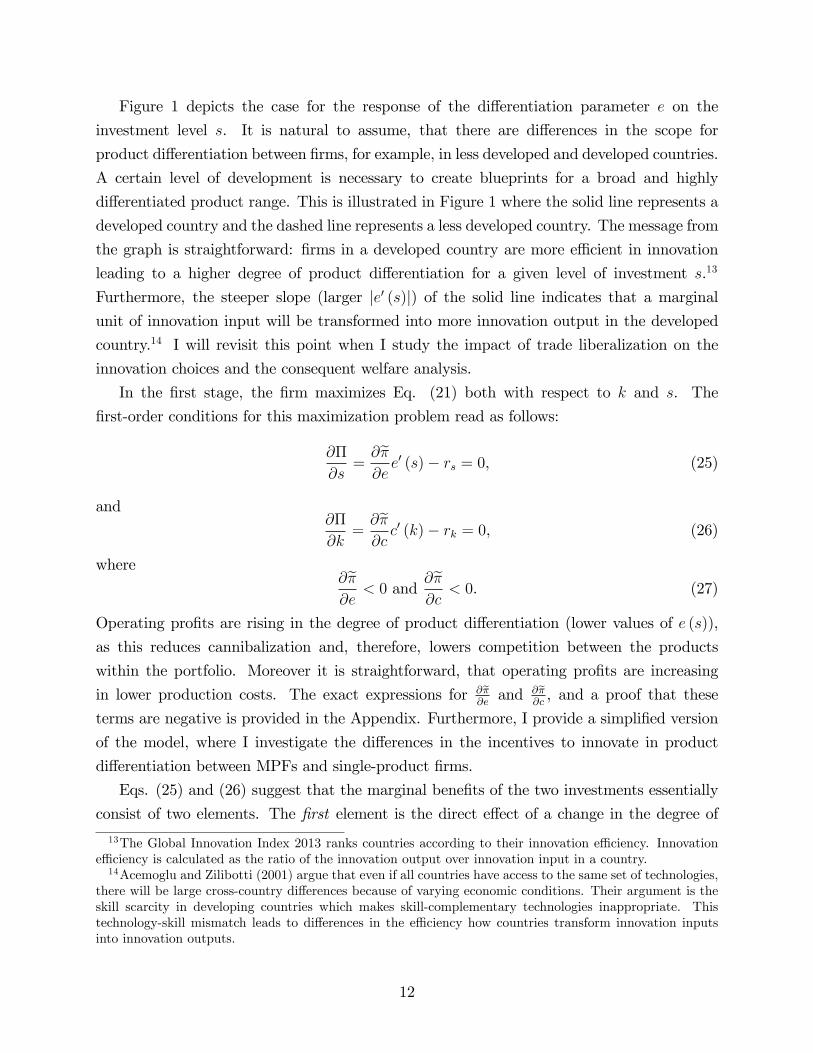
Figure 1 depicts the case for the response of the di¤erentiation parameter e on the
investment level s. It is natural to assume, that there are di¤erences in the scope for
product di¤erentiation between �rms, for example, in less developed and developed countries.
A certain level of development is necessary to create blueprints for a broad and highly
di¤erentiated product range. This is illustrated in Figure 1 where the solid line represents a
developed country and the dashed line represents a less developed country. The message from
the graph is straightforward: �rms in a developed country are more e¢ cient in innovation
leading to a higher degree of product di¤erentiation for a given level of investment s.13
Furthermore, the steeper slope (larger je0 (s)j) of the solid line indicates that a marginalunit of innovation input will be transformed into more innovation output in the developed
country.14 I will revisit this point when I study the impact of trade liberalization on the
innovation choices and the consequent welfare analysis.
In the �rst stage, the �rm maximizes Eq. (21) both with respect to k and s. The
�rst-order conditions for this maximization problem read as follows:
@�
@s=@e�@ee0 (s)� rs = 0, (25)
and@�
@k=@e�@cc0 (k)� rk = 0, (26)
where@e�@e< 0 and
@e�@c< 0. (27)
Operating pro�ts are rising in the degree of product di¤erentiation (lower values of e (s)),
as this reduces cannibalization and, therefore, lowers competition between the products
within the portfolio. Moreover it is straightforward, that operating pro�ts are increasing
in lower production costs. The exact expressions for @e�@eand @e�
@c, and a proof that these
terms are negative is provided in the Appendix. Furthermore, I provide a simpli�ed version
of the model, where I investigate the di¤erences in the incentives to innovate in product
di¤erentiation between MPFs and single-product �rms.
Eqs. (25) and (26) suggest that the marginal bene�ts of the two investments essentially
consist of two elements. The �rst element is the direct e¤ect of a change in the degree of
13The Global Innovation Index 2013 ranks countries according to their innovation e¢ ciency. Innovatione¢ ciency is calculated as the ratio of the innovation output over innovation input in a country.14Acemoglu and Zilibotti (2001) argue that even if all countries have access to the same set of technologies,
there will be large cross-country di¤erences because of varying economic conditions. Their argument is theskill scarcity in developing countries which makes skill-complementary technologies inappropriate. Thistechnology-skill mismatch leads to di¤erences in the e¢ ciency how countries transform innovation inputsinto innovation outputs.
12

product di¤erentiation or the cost parameter on the operating pro�ts e� demonstrated inEq. (27). Most importantly, the magnitude of the direct e¤ect depends on the �rm size.
This is related to early �ndings by Schumpeter, who argued that only �rms with su¢ ciently
large sales can cover the high �xed costs associated with R&D projects. The second element
embodies the responsiveness of the di¤erentiation and the cost parameter with respect to
investments: e0 (s) and c0 (k). According to this, the marginal bene�t of an investment also
depends on the e¢ ciency of transforming research input into output. The larger je0 (s)j andjc0 (k)j, respectively, the greater is the impact of the marginal unit of investment.
Lemma 2 The marginal bene�t of an investment depends on (i) the total �rm size (deter-
mined by scale and scope) and (ii) the e¢ ciency of research input utilization.
The �rst-order conditions in Eqs. (25) and (26) suggest that it is optimal to invest in
process innovation and product di¤erentiation, respectively, until the marginal bene�ts equal
the marginal costs of the investment. Figure 2 illustrates the optimal behavior for the case
of investments in product di¤erentiation. The shape of the marginal bene�t curve is concave
due to the assumptions made on e (s). The optimal investment level s� is determined at the
point where the slope of the investment cost curve is just equal to the slope of the marginal
bene�t curve. In this point, total pro�ts � are maximized. Furthermore, it can be seen in
the graph that the equilibrium investment levels s� and k� increase in the responsiveness of
the functions e (s) and c (k), i.e. in their respective slopes e0 (s) and c0 (k). Eqs. (25) and (26)
implicitly determine the equilibrium levels of product di¤erentiation s� = s� (k; rs; t; r�; b0)
and process innovation k� = k� (s; rk; t; r�; b0). In the next section, I present comparative
statics results with respect to the variables in brackets.
[Insert Figure 2 about here]
2.4 Comparative Statics
Having characterized the equilibrium R&D levels, I derive several comparative statics results
of the model. I start with the e¤ects of an exogenous change in the investment costs (rsand rk) and the capacity costs r� followed up with the cross-e¤ects of process innovation
on product di¤erentiation and vice versa. Afterwards, the focus is on the e¤ects of eco-
nomic integration on the equilibrium R&D e¤orts. As mentioned above, globalization can
be captured by both an increase in market size L and a reduction in transportation costs t.
To derive the comparative statics results, I totally di¤erentiate Eqs. (25) and (26). The
explicit mathematical expressions for all derivatives are provided in the Appendix. In the
13

following subsections, I will employ the graphical tool provided in Figure 2 and discuss the
results intuitively.
Change in Investment Costs and Capacity Costs: It is straightforward to determine
the e¤ects of rising innovation costs on the equilibrium levels of s� and k�. Rising rates rsand rk increase the costs of R&D and, therefore, reduce equilibrium levels of both process
innovation and product di¤erentiation. In Figure 2, this can be illustrated by a rising slope
of the investment cost curve in the upper part of the diagram. Consequently, the optimal
investment level is shifted to the left hand side.
The e¤ects of varying capacity costs r� on the investment levels can be interpreted like
the e¤ects of a changing product range. From Eq. (18), it follows that rising capacity
costs r� will reduce the pro�t maximizing product range. The latter reduces total �rm size.
Keeping this coherence in mind, it is obvious that rising �xed costs r� reduce both the optimal
levels of product di¤erentiation and process innovation as the gains from these investments
are reduced. More precisely, investments in di¤erentiation are cut back, as within a smaller
product range, the cannibalization e¤ect is less �erce. Furthermore, due to a lower �rm-
level output, the bene�ts from a better technology level are reduced, leading to less process
innovation. Expressed in Figure 2, this means a lower slope of the marginal bene�t curve
which again shifts the optimal investment level to the left hand side. I summarize these
�ndings in the following proposition.
Proposition 2 Rising investment costs (rs and rk) and capacity costs (r�) reduce optimallevels of investment in both product di¤erentiation and process innovation, i.e.
ds�
drs< 0;
dk�
drk< 0, (28)
andds�
dr�< 0;
dk�
dr�< 0. (29)
Cross - E¤ects: In the next step, I investigate the interaction between process innovation
and product di¤erentiation. As in the related industrial organization literature with single
product �rms (see for example Lin and Saggi (2002)), I �nd a two-way complementarity in
which the investment in one branch of research makes the other more attractive. On the one
hand, Eq. (18) shows that a better technology induces an MPF to add more products to
its portfolio. The latter intensi�es cannibalization and incentivizes a higher level of product
di¤erentiation. On the other hand, more di¤erentiated products enable a higher sales volume
and, therefore, enhance the incentives to invest in a better technology.
14
Proposition 3 Firms invest more in product di¤erentiation when they can undertake processinnovation and vice versa, i.e.
ds�
dk> 0 and
dk�
ds> 0. (30)
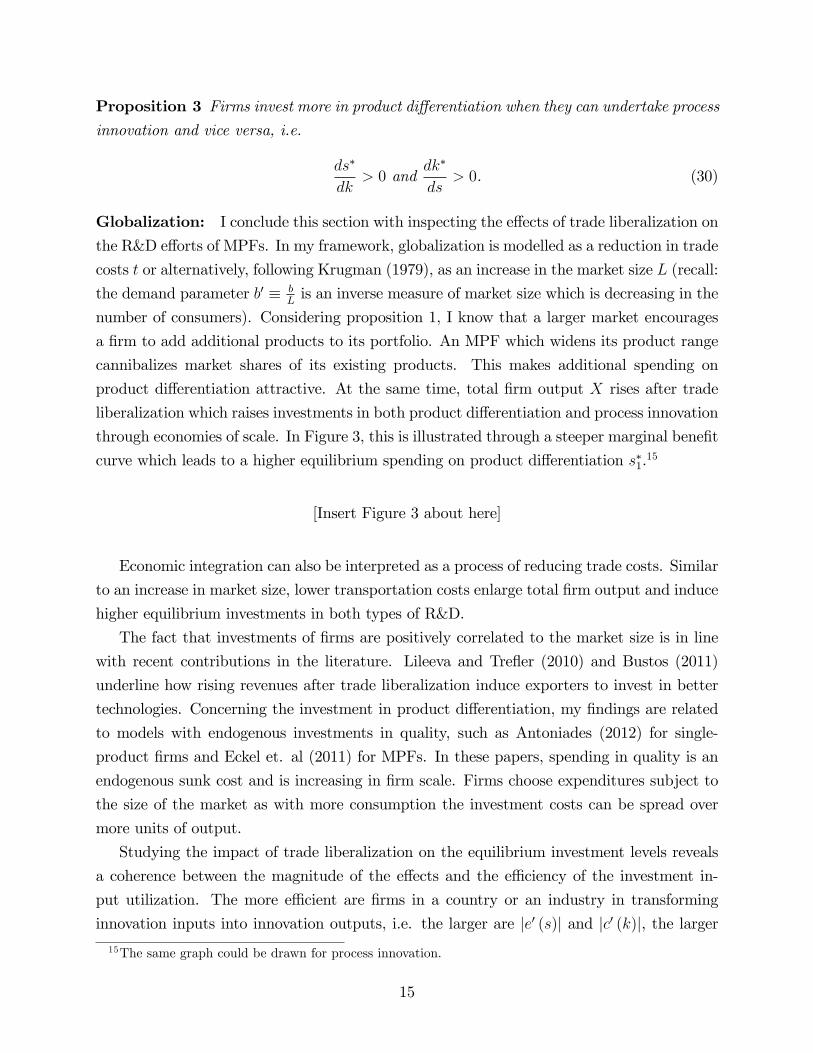
Globalization: I conclude this section with inspecting the e¤ects of trade liberalization on
the R&D e¤orts of MPFs. In my framework, globalization is modelled as a reduction in trade
costs t or alternatively, following Krugman (1979), as an increase in the market size L (recall:
the demand parameter b0 � bLis an inverse measure of market size which is decreasing in the
number of consumers). Considering proposition 1, I know that a larger market encourages
a �rm to add additional products to its portfolio. An MPF which widens its product range
cannibalizes market shares of its existing products. This makes additional spending on
product di¤erentiation attractive. At the same time, total �rm output X rises after trade
liberalization which raises investments in both product di¤erentiation and process innovation
through economies of scale. In Figure 3, this is illustrated through a steeper marginal bene�t
curve which leads to a higher equilibrium spending on product di¤erentiation s�1.15
[Insert Figure 3 about here]
Economic integration can also be interpreted as a process of reducing trade costs. Similar
to an increase in market size, lower transportation costs enlarge total �rm output and induce
higher equilibrium investments in both types of R&D.
The fact that investments of �rms are positively correlated to the market size is in line
with recent contributions in the literature. Lileeva and Tre�er (2010) and Bustos (2011)
underline how rising revenues after trade liberalization induce exporters to invest in better
technologies. Concerning the investment in product di¤erentiation, my �ndings are related
to models with endogenous investments in quality, such as Antoniades (2012) for single-
product �rms and Eckel et. al (2011) for MPFs. In these papers, spending in quality is an
endogenous sunk cost and is increasing in �rm scale. Firms choose expenditures subject to
the size of the market as with more consumption the investment costs can be spread over
more units of output.
Studying the impact of trade liberalization on the equilibrium investment levels reveals
a coherence between the magnitude of the e¤ects and the e¢ ciency of the investment in-
put utilization. The more e¢ cient are �rms in a country or an industry in transforming
innovation inputs into innovation outputs, i.e. the larger are je0 (s)j and jc0 (k)j, the larger15The same graph could be drawn for process innovation.
15

is the magnitude of the e¤ects of globalization. I summarize these results in the following
proposition.
Proposition 4 Rising market size L and falling trade costs t enhance the equilibrium levelsof both types of investments, i.e
ds�
dL> 0;
dk�
dL> 0, (31)
andds�
dt< 0;
dk�
dt< 0. (32)
The magnitude of these e¤ects is ampli�ed when innovation inputs are in e¢ cient use.
2.5 Welfare
This section builds on the comparative static results concerning globalization and studies
the impact on consumer welfare. Following Melitz and Ottaviano (2008), the indirect utility
stated in Eq. (7) serves as an appropriate measure for welfare. In the simpli�ed model setup
with symmetric varieties, indirect utility is reduced as follows:
V = I +�
2b (1� e (s) + e (s) �) (a� p)2 . (33)
I start the welfare analysis by discussing important properties of the indirect utility function
in Eq. (33). By doing this, I identify the distinct channels through which innovation a¤ects
consumers welfare. Having unbundled the di¤erent welfare channels, I focus again on the
variables concerning globalization and discuss the welfare gains from trade.
Properties of the Indirect Utility Function At a �rst glance and not strikingly, welfare
is higher the lower is the price level p. Furthermore, as already mentioned, the indirect utility
function displays "love of variety", i.e.
@V
@�jp;e=const=
(1� e (s))2b (1� e (s) + e (s) �)2
(a� p)2 > 0: (34)
For a given price and degree of product di¤erentiation, consumer welfare is increasing in the
number of available products �. As the degree of product di¤erentiation is endogenously
chosen by a �rm in my model, I am interested in the role of product di¤erentiation for
consumer welfare. It is straightforward to show that the marginal utility of an additional
16

product is increasing in the degree of product di¤erentiation:
@V
@�@e= �(2� e (s)) � � (1� e (s))
2b (1� e (s) + e (s) �)3(a� p)2 < 0. (35)
Furthermore, I can show that for a given product range �, utility is increasing when products
are more di¤erentiated:16
@V
@ejp;�=const= �
� (� � 1)2b (1� e (s) + e (s) �)2
(a� p)2 < 0. (36)
I call this attribute of the utility function "love of diversity". In addressing the question to
what extent globalization matters for consumer welfare in my framework, this property of
the utility function is central. From previous discussion, it is obvious that consumers value
a given product range more when products are more di¤erentiated.
Lemma 3 Welfare increases in the number of available products ("love of variety"), thedegree of product di¤erentiation ("love of diversity"), and decreases in the price level.
Welfare Gains from Trade With the properties of the welfare function fully character-
ized, I proceed discussing some of the key implications of the theory. In the previous section,
I have analyzed the impact of trade liberalization on the product range and the endogenous
choice of R&D expenditures. I recap the key comparative statics results and highlight their
implications for consumer welfare.
My theoretical model suggests an extension of the product range following an increase
in the market size or alternatively lower trade costs. Qualitatively, this result is in line with
trade models with single-product �rms such as Krugman (1980) and Melitz (2003) where the
transition from autarky to trade induces entry of �rms. Firm entry increases the number of
available products in the market which gives rise to gains from trade through the well-known
"love of variety" nature of the utility function. However, worthwhile to mention at this point
is the di¤erent source of gains from trade in this model stemming from adjustments within
the �rm in contrast to entry of �rms at the industry level.
The endogenous choice of investment levels in product di¤erentiation and process innova-
tion is the key element of this theory. Trade liberalization enables �rms to exploit economies
of scale in innovation and increases incentives to invest in R&D as in a larger market �xed
16Welfare gains have diminishing returns with respect to product di¤erentiation: @V 2
@2e jp;�=const=�(a�p)2(��1)2b(1�e(s)+e(s)�)3 > 0. Substituting information from Eqs. (4) and (12) in the indirect utility Eq. (33), I
compute the total derivative as follows: dVde =(a�c(k)�t)2
8b([(1�e(s)+e(s)�)])2�(1� e (s)) d�de � � (� � 1)
�< 0. Recall from
proposition 1 that d�de < 0.
17

investment costs can be spread over a larger scale of output. Therefore, my formal analysis
reveals increasing spending in both types of investments after trade liberalization. This en-
hances welfare via two separate channels. The central welfare channel in this model is what
I called "love of diversity". Given the opportunity to serve a larger market, an MPF will
spend more resources on research for new blueprints or product speci�c attributes. For the
consumer, this increases welfare as it leads to products with new functional features or a
new design and thus the opportunity to choose from a broader product range. Technically,
a higher degree of product di¤erentiation enlarges the marginal utility of each new product
and thus enhances welfare. Furthermore, consumers enjoy lower prices as MPFs increase
investments in better processes. As �rm size grows in a larger market, a better technology
becomes more valuable. The resulting cost savings are passed on to consumers, leading to
welfare gains from lower prices (compare Eq. (14)).
To unbundle the di¤erent channels analytically, I substitute Eqs. (4) and (12) into Eq.
(33) and rewrite the indirect utility function as follows:
V = I +� (a� c (k)� t)2
8b [(1� e (s) + e (s) �)] . (37)
By totally di¤erentiating Eq. (37), I identify the three distinct channels which were discussed
above. The following expression represents the gains from trade induced by an increase in
the market size L:17
dV
dL=(1� e (s)) bx2
2L2d�
dL| {z }>0: Love of variety
�2b (� � 1) (a� c (k)� t)XL
e0 (s)ds
dL| {z }>0: Love of diversity
�X2Lc0 (k)
dk
dL| {z }>0: Lower prices
> 0. (38)
Inspection of Eq. (38) clearly reveals that consumers in a larger market are better o¤. It
highlights three distinct channels of gains from trade and shows how trade liberalization
a¤ects welfare through within-�rm adjustments. I derive the analogous expression for falling
trade costs t in the Appendix.
Preceding discussion suggested that consumers in a larger market or in a market with
lower trade costs, ceteris paribus, are better o¤. The magnitude of the gains from trade
naturally depends on the increase of investment levels after trade liberalization. Furthermore,
inspection of Eq. (38) reveals that the welfare gains also depend on the e¢ ciency of research
input utilization determined by e0 (s) and c0 (k). If trade induced investments (i.e. dsdLand
dkdL) do not generate more di¤erentiated products or a better production technology because
17To determine the sign of the derivative in Eq. (38), recall that e0 (s) < 0 and c0 (k) < 0: Furthermore, itfollows from proposition 1: d�
dL > 0 and from proposition 4: dsdL > 0 and
dkdL > 0.
18
of ine¢ cient innovation (low values of je0 (s)j and jc0 (k)j), the welfare gains from an increasein the market size will be low. The latter implies that gains from trade will be larger in a
developed country where due to better technological conditions the marginal bene�t of each
unit of investment is higher. I summarize these results in the following proposition.
Proposition 5 Table 1 summarizes the welfare gains from trade integration through the
di¤erent elements of the welfare function. Economies of scale after trade liberalization lead
to larger welfare gains in countries where the technological stage of development allows an
e¢ cient use of research input.
Table 1: Welfare E¤ects of Globalization
E¤ects of L " or t #: Welfare channel:Product range: � " Love of varietyProduct di¤erentiation: s� "; e (s) # Love of diversityProcess innovation: k� "; c (k) # Lower prices
3 Conclusion
In this paper, I focus on the gains from trade associated with intra-�rm adjustments. There
is indeed recent evidence that innovating �rms account for a large fraction of the productivity
and variety gains at a sector-level. To distinguish between the di¤erent welfare channels, I
construct a multi-product framework in which a �rm invests in di¤erent types of research.
Trade liberalization provides welfare gains which originate at the �rm-level because �rms
exploit economies of scale in innovation. An MPF weighs the marginal bene�t of each
type of innovation against the �xed upfront development costs. The market size e¤ect of
globalization accompanied by rising sales volumes raises the returns to the di¤erent types
of innovation. Consumers bene�t from a larger product portfolio (love of variety) of more
di¤erentiated products (love of diversity). Furthermore, a larger �rm output encourages
technology-upgrading. Consumers bene�t from the investment in a cost-reducing technology
through lower prices.
The key element of this theory is the investment in the degree of product di¤erentiation
and the consequent welfare gains through more di¤erentiated products. In most studies,
product di¤erentiation is a main component of the industry structure which is treated as
an exogenous variable. By endogenizing the degree of product di¤erentiation, I highlight an
additional channel in which globalization may a¤ect product variety. I show that adding
additional products in a larger market encourages MPFs to invest in a more diversi�ed
19
product range. In contrast to single-product �rms, MPFs have higher incentives to invest
in product di¤erentiation in order to reduce the cannibalization e¤ect. Consumers enjoy
additional gains as the marginal bene�t of any new variety rises in the degree of product
di¤erentiation. This implies that consumer welfare is not only determined by the absolute
number of available products but by the individual product features that distinguish these
varieties. Consumers value choosing from a broad and diversi�ed product range. Therefore,
investments in the diversity of the available products is an important aspect when analyzing
consumer welfare. Finally, I have shown that welfare improvements through economies of
scale depend on the e¢ ciency of innovation input utilization. The better research input is
transformed into research output, the higher will be the equilibrium investment levels and
the larger will be the gains from trade through intra-�rm adjustments.
20

4 Bibliography
References
[1] Acemoglu, D. and Zilibotti F. (2001) "Productivity Di¤erences". The Quarterly Journal
of Economics, 116, 563-606.
[2] Antoniades, A. (2012) "Heterogeneous Firms, Quality, and Trade" mimeo., Columbia
University.
[3] Arkolakis, C. andMuendler, M.A. (2010) "The Extensive Margin of Exporting Products:
A Firm-level Analysis". NBER Working Papers, 16641.
[4] Bernard, A., Jensen, B., Redding, S. and Schott P. (2007) "Firms in International
Trade". Journal of Economic Perspectives, 21, 105-130.
[5] Bernard, A., Redding, S. and Schott, P. (2010) "Multiple-Product Firms and Product
Switching". American Economic Review, 100(1), 70-97.
[6] Bastos, P. and Straume, O.R. (2012) "Globalization, Product Di¤erentiation, and Wage
Inequality". Canadian Journal of Economics, 45(3), 857�878.
[7] Bustos, P. (2011) "Trade Liberalization, Exports, and Technology Upgrading: Evidence
on the Impact of MERCOSUR on Argentinian Firms". American Economic Review, 101,
304-340.
[8] Broda, C. and Weinstein, D. E. (2010) "Product Creation and Destruction: Evidence
and Price Implications". American Economic Review, 100(3), 691-723.
[9] Cornell University, INSEAD, and WIPO (2013) "The Global Innovation Index 2013:
The Local Dynamics of Innovation", Geneva, Ithaca, and Fontainebleau.
[10] Eckel, C. and Neary, P.J. (2010) "Multi-product Firms and Flexible Manufacturing in
the Global Economy". Review of Economic Studies, 77 , 188�217.
[11] Eckel, C., Iacovone, L., Javorcik, B. and Neary, J.P. (2011) "Multi-Product Firms at
Home and Away: Cost- versus Quality-based Competence". CEPR Discussion Papers
8186.
[12] Ferguson, S. (2011) " Endogenous Product Di¤erentiation, Market Size and Prices".
IFN Working Paper 878.
21

[13] Krugman, P. R. (1979) "Increasing Returns, Monopolistic Competition and Trade".
Journal of International Economics, 9, 469-479.
[14] Krugman, P. R. (1980) "Scale Economies, Product Di¤erentiation, and the Pattern of
Trade". American Economic Review, 70, 950�959.
[15] Lambertini, L. and Mantovani, A. (2009) "Process and Product Innovation by a Multi-
product Monopolist: A Dynamic Approach". International Journal of Industrial Orga-
nization, 27(4), 508-518.
[16] Lileeva, A. and Tre�er, D. (2010) "Improves Access to Foreign Markets Raises Plant-
Level Productivity...for some Plants" The Quarterly Journal of Economics, 125 (3),
1051-1099.
[17] Lin, P. and Saggi, K. (2002) "Product Di¤erentiation, Process R&D, and the Nature of
Market Competition". European Economics Review, 46(1) , 201�211.
[18] Lin, P.(2004) "Process and Product R&D by a Multiproduct Monopolist". Oxford Eco-
nomic Papers, 56, 735-743.
[19] Lorz, O. and Wrede M. (2009) "Trade and Variety in a Model of Endogenous Product
Di¤erentiation", The B.E. Journal of Economic Analysis & Policy, 9 (1) Article 52.
[20] Mayer, T., Melitz M. J. and Ottaviano G. I. P. (2014) "Market Size, Competition, and
the Product Mix of Exporters", American Economic Review, 104(2): 495-536.
[21] Melitz, M. J. (2003) "The Impact of Trade on Intra-Industry Reallocations and Aggre-
gate Industry Productivity", Econometrica, 71(6), 1695-1725.
[22] Melitz, M. and Ottaviano, G. (2008) "Market Size, Trade and Productivity". Review of
Economic Studies, 75, 296-316.
[23] Neary, P. J. (2002) "Foreign Competition andWage Inequality". Review of International
Economics, 10 (4), 680-693.
[24] Neary, P. J. (2009) "International Trade in General Oligopolistic Equilibrium". Discus-
sion Paper.
[25] Qiu L. D. and Zhou W. (2013) "Multiproduct Firms and Scope Adjustment in Global-
ization", Journal of International Economics, 91, 142-153.
[26] Rosenkranz, S. (2003) "Simultaneous Choice of Process and Product Innovation". Jour-
nal of Economic Behavior and Organization 50, 183�201.
22
5 Appendix
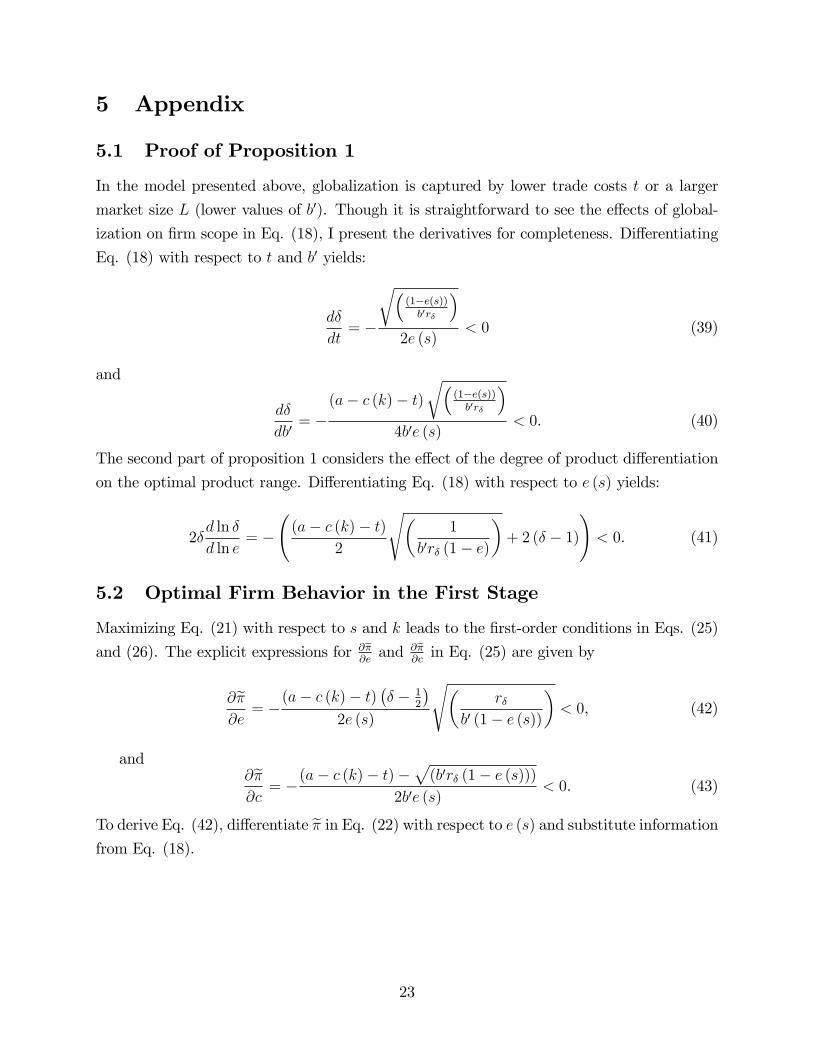
5.1 Proof of Proposition 1
In the model presented above, globalization is captured by lower trade costs t or a larger
market size L (lower values of b0). Though it is straightforward to see the e¤ects of global-
ization on �rm scope in Eq. (18), I present the derivatives for completeness. Di¤erentiating
Eq. (18) with respect to t and b0 yields:
d�
dt= �
r�(1�e(s))b0r�
�2e (s)
< 0 (39)
and
d�
db0= �
(a� c (k)� t)r�
(1�e(s))b0r�
�4b0e (s)
< 0. (40)
The second part of proposition 1 considers the e¤ect of the degree of product di¤erentiation
on the optimal product range. Di¤erentiating Eq. (18) with respect to e (s) yields:
2�d ln �
d ln e= �
(a� c (k)� t)
2
s�1
b0r� (1� e)
�+ 2 (� � 1)
!< 0. (41)
5.2 Optimal Firm Behavior in the First Stage
Maximizing Eq. (21) with respect to s and k leads to the �rst-order conditions in Eqs. (25)
and (26). The explicit expressions for @e�@eand @e�
@cin Eq. (25) are given by
@e�@e= �
(a� c (k)� t)�� � 1
2
�2e (s)
s�r�
b0 (1� e (s))
�< 0, (42)
and@e�@c= �(a� c (k)� t)�
p(b0r� (1� e (s)))
2b0e (s)< 0. (43)
To derive Eq. (42), di¤erentiate e� in Eq. (22) with respect to e (s) and substitute informationfrom Eq. (18).
23

5.3 Comparative Statics
In this part of the Appendix, I provide all analytical results for section 2.4. To derive my
results, I totally di¤erentiate the following �rst-order conditions:
@�
@s= �
(a� c (k)� t)�(a� c (k)� t)� (2� e (s))
r�b0r�
(1�e(s))
��4b0e (s)2
e0 (s)� rs = 0, (44)
and@�
@k= �(a� c (k)� t)�
p(b0r� (1� e (s)))
2b0e (s)c0 (k)� rk = 0. (45)
Throughout the analysis, I apply the following second-order conditions:
@2�
@s2=@2e�@e2
e0 (s) +@e�@ee00 (s) < 0, (46)
and@2�
@k2=@2e�@c2
c0 (k) +@e�@cc00 (k) < 0. (47)
To determine the signs of the following derivatives, recall that e0 (s) < 0 and c0 (k) < 0.
Proof of Proposition 2 The following derivatives show how equilibrium investment levels
s� and k� respond to changes in investment and capacity costs.
Change in Investments Costs:
ds�
drs=
1@2�@s2
< 0 (48)
dk�
drk=
1@2�@k2
< 0 (49)
Change in Capacity Costs:
ds�
dr�= �
(a� c (k)� t)�(2� e (s))
r�b0
r�(1�e(s))
��8b0e (s)2 @
2�@s2
e0 (s) < 0 (50)
dk�
dr�= � 1
4e (s) @2�@k2
s�(1� e (s))b0r�
�c0 (k) < 0 (51)
24

Proof of Proposition 3 To determine the interaction between process innovation and
product di¤erentiation (cross-e¤ects), I totally di¤erentiate Eq. (44) with respect to k and
Eq. (45) with respect to s. I combine the derivatives with information from Eq. (18) to
show the positive signs.
ds�
dk= � e
0 (s) c0 (k)
2b0e (s) @2�@s2
(a� c (k)� t)
2e (s)+
s�b0r�
(1� e (s))
��� � 1
2
�!> 0 (52)
dk�
ds= � e
0 (s) c0 (k)
2b0e (s) @2�@k2
((a� c (k)� t))
2e (s)+
s�b0r�
(1� e (s))
��� � 1
2
�!> 0 (53)
Proof of Proposition 4 Globalization is captured by an increase in the size of the market
L (recall: b0 � bL) or by falling trade costs t. The following derivatives show how equilibrium
values of s� and k� respond to changes in these parameters.
Change in Market Size: Again, I totally di¤erentiate Eq. (44) and then substitute
information from Eq. (18) to show that the sign of the following derivative is clearly negative:
ds�
db0= �(a� c (k)� t)
4b02e (s) @2�@s2
(a� c (k)� t)
2e (s)+ �
s�b0r�
(1� e (s))
�!e0 (s) < 0. (54)
From inspection of Eq. (22), I know that the following expression is clearly negative:
dk�
db0= �2 (a� c (k)� t)�
p(b0r� (1� e (s)))
4b02e (s) @2�@k2
c0 (k) < 0. (55)
Change in Trade Costs:
ds�
dt= � e0 (s)
2b0e (s) @2�@s2
((a� c (k)� t))
2e (s)+
s�b0r�
(1� e (s))
��� � 1
2
�!< 0 (56)
dk�
dt= � c0 (k)
2b0e (s) @2�@k2
< 0 (57)
5.4 Welfare
In the main body of this paper, I present the disentangled welfare gains of an increase in
the market size L. For the sake of completeness, I also present the explicit expression for a
25
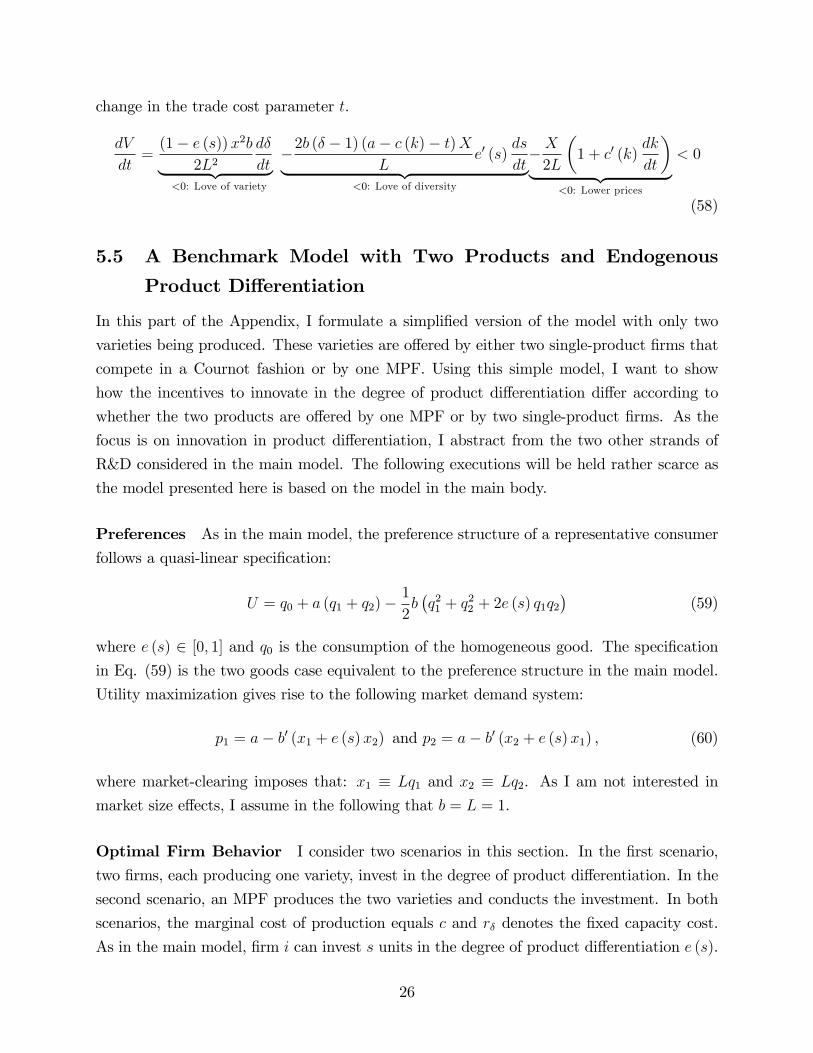
change in the trade cost parameter t.
dV
dt=(1� e (s))x2b
2L2d�
dt| {z }<0: Love of variety
�2b (� � 1) (a� c (k)� t)XL
e0 (s)ds
dt| {z }<0: Love of diversity
�X2L
�1 + c0 (k)
dk
dt
�| {z }
<0: Lower prices
< 0
(58)
5.5 A Benchmark Model with Two Products and Endogenous
Product Di¤erentiation
In this part of the Appendix, I formulate a simpli�ed version of the model with only two
varieties being produced. These varieties are o¤ered by either two single-product �rms that
compete in a Cournot fashion or by one MPF. Using this simple model, I want to show
how the incentives to innovate in the degree of product di¤erentiation di¤er according to
whether the two products are o¤ered by one MPF or by two single-product �rms. As the
focus is on innovation in product di¤erentiation, I abstract from the two other strands of
R&D considered in the main model. The following executions will be held rather scarce as
the model presented here is based on the model in the main body.
Preferences As in the main model, the preference structure of a representative consumer
follows a quasi-linear speci�cation:
U = q0 + a (q1 + q2)�1
2b�q21 + q
22 + 2e (s) q1q2
�(59)
where e (s) 2 [0; 1] and q0 is the consumption of the homogeneous good. The speci�cationin Eq. (59) is the two goods case equivalent to the preference structure in the main model.
Utility maximization gives rise to the following market demand system:
p1 = a� b0 (x1 + e (s)x2) and p2 = a� b0 (x2 + e (s)x1) , (60)
where market-clearing imposes that: x1 � Lq1 and x2 � Lq2. As I am not interested in
market size e¤ects, I assume in the following that b = L = 1.
Optimal Firm Behavior I consider two scenarios in this section. In the �rst scenario,
two �rms, each producing one variety, invest in the degree of product di¤erentiation. In the
second scenario, an MPF produces the two varieties and conducts the investment. In both
scenarios, the marginal cost of production equals c and r� denotes the �xed capacity cost.
As in the main model, �rm i can invest s units in the degree of product di¤erentiation e (s).
26
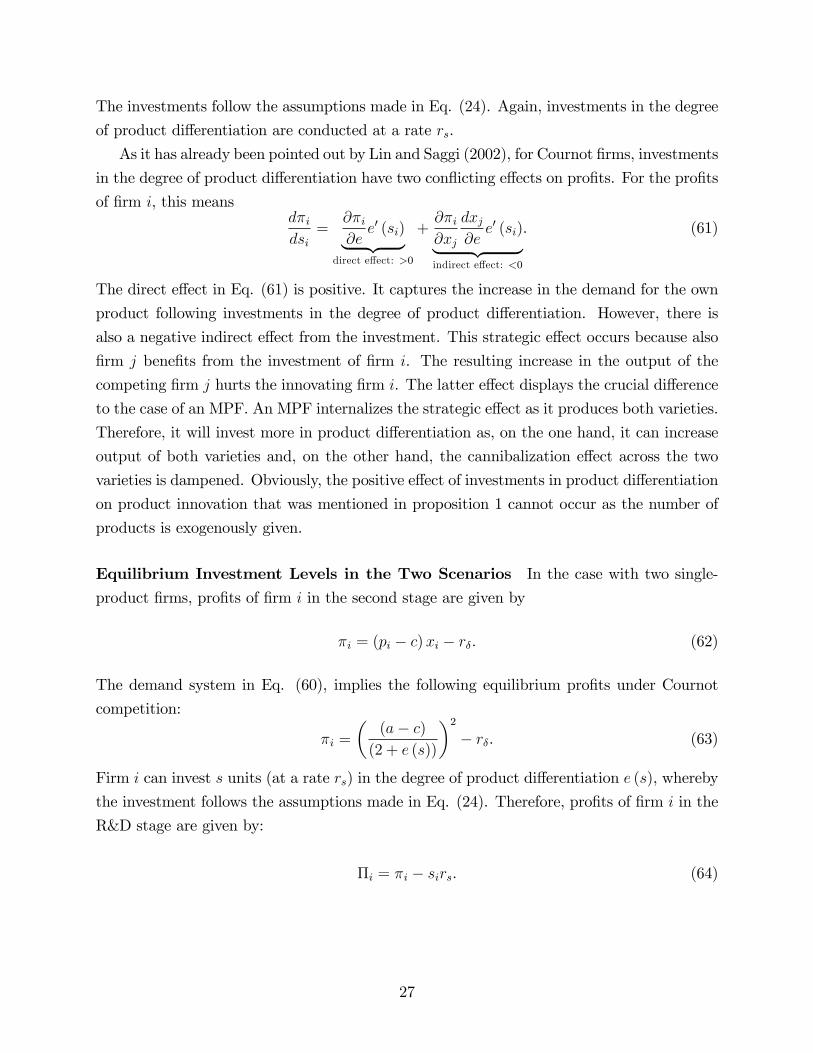
The investments follow the assumptions made in Eq. (24). Again, investments in the degree
of product di¤erentiation are conducted at a rate rs.
As it has already been pointed out by Lin and Saggi (2002), for Cournot �rms, investments
in the degree of product di¤erentiation have two con�icting e¤ects on pro�ts. For the pro�ts
of �rm i, this meansd�idsi
=@�i@ee0 (si)| {z }
direct e¤ect: >0
+@�i@xj
dxj@ee0 (si)| {z }
indirect e¤ect: <0
. (61)
The direct e¤ect in Eq. (61) is positive. It captures the increase in the demand for the own
product following investments in the degree of product di¤erentiation. However, there is
also a negative indirect e¤ect from the investment. This strategic e¤ect occurs because also
�rm j bene�ts from the investment of �rm i. The resulting increase in the output of the
competing �rm j hurts the innovating �rm i. The latter e¤ect displays the crucial di¤erence
to the case of an MPF. An MPF internalizes the strategic e¤ect as it produces both varieties.
Therefore, it will invest more in product di¤erentiation as, on the one hand, it can increase
output of both varieties and, on the other hand, the cannibalization e¤ect across the two
varieties is dampened. Obviously, the positive e¤ect of investments in product di¤erentiation
on product innovation that was mentioned in proposition 1 cannot occur as the number of
products is exogenously given.
Equilibrium Investment Levels in the Two Scenarios In the case with two single-
product �rms, pro�ts of �rm i in the second stage are given by
�i = (pi � c)xi � r�. (62)
The demand system in Eq. (60), implies the following equilibrium pro�ts under Cournot
competition:
�i =
�(a� c)(2 + e (s))
�2� r�. (63)
Firm i can invest s units (at a rate rs) in the degree of product di¤erentiation e (s), whereby
the investment follows the assumptions made in Eq. (24). Therefore, pro�ts of �rm i in the
R&D stage are given by:
�i = �i � sirs. (64)
27

The respective �rst-order condition for this maximization problem is
@�i@si
=@�i@ee0 (si)� rs = 0, (65)
where @�i@e= � 2(a�c)2
((2+e(s)))3< 0 and e0 (si) < 0.
In the second scenario, the two products are o¤ered by one MPF. The pro�ts of the �rm
in the second stage are given by:
� = (p1 � c)x1 + (p2 � c)x2 � 2r�. (66)
Calculating the equilibrium pro�ts yields:
� =(a� c)2
2 (1 + e (s))� 2r�. (67)
In the R&D stage, the �rm maximizes the following pro�t function
� = � � srs (68)
with respect to an optimal investment level s. The �rst-order condition is given by
@�
@s=@�
@ee0 (s)� rs = 0, (69)
where @�@e= � (a�c)2
2((1+e(s)))2< 0.
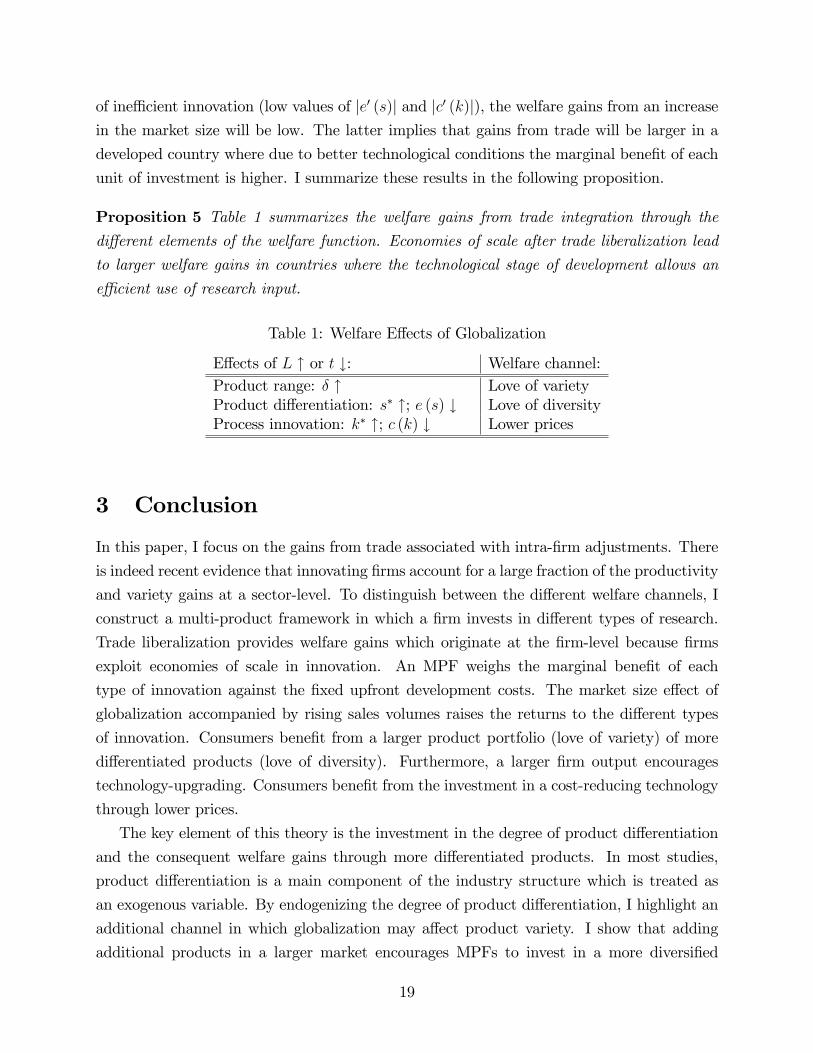
Eqs. (65) and (69) implicitly determine the optimal investments for the two scenarios.
From inspection of these equations, one observes that an MPF will invest more in the degree
of di¤erentiation as��@�@e
��MPF
>��@�@e
��SPF
. Since ((2 + e (s)))3 > 4 ((1 + e (s)))2 for all e (s) 2[0; 1], it follows that the marginal bene�t for product di¤erentiation is higher for MPFs. The
latter implies that in the optimum: je0 (s)jMPF < je0 (s)jSPF . Figure 4 illustrates again theproperties of the function e (s) and helps with the interpretation of the result.
[Insert Figure 4 about here]
Lemma 4 Even in the case of an exogenous product range of two products, MPFs will investmore in the degree of product di¤erentiation than single-product �rms. For a single-product
�rm, the marginal bene�t of the investment is lower, as the investment is accompanied by
a negative strategic e¤ect. An MPF internalizes this e¤ect as it produces both varieties.
28

Therefore, it will invest more in product di¤erentiation as, on the one hand, it can increase
output of both varieties and, on the other hand, the cannibalization e¤ect across these two
varieties is dampened.
29

Figure 1: Di¤erences in the Ability to Innovate
1
0 s
)(se
Figure 2: Optimal Degree of Product Di¤erentiation
( )see
'~
∂∂π
π,Π
R&DCosts
s*
srs ×
s
s
Π
30

Figure 3: Economies of Scale in Innovation
( )see
'~
∂∂π
π~,Π
R&DCosts
s*
srs ×
s
s
Π
s*1
31

Figure 4: Optimal Degree of Product Di¤erentiation (SPF vs. MPF)
1
0 s
)(se
*MPFs*
SPFs
32