Embed Size (px)
Citation preview
EVOLUTION OF AUSTRALIAN NCAP RESULTS PRESENTATION
Michael Case RACV Michael Griffiths Road Safety Solutions Jack Haley NRMA Ltd Michael Paine Vehicle Design & Research Australia Paper Number 98-Sl l-0-04
ABSTRACT
This paper traces the evolution of the methods of presentation of Australian NCAP (ANCAP) results to consumers.
ANCAP commenced in 1992 and has now tested over 60 vehicle models. The first two series of results in 1993 and 1994 were presented with an emphasis on NCAP criteria such as HIC and chest deflection measurements, with a colour-coded human figure included to indicate injury levels. The detailed dummy measurements were included in the back of the information brochure and this convention has been retained to the present.
The concentration on NCAP injury criteria was felt to be too technical for the intended general audience so for the next four releases of data the primary rating system became the risk of lif th?eatening injuT (>AIS 3) calculated as per the NHTSA algorithm, although the first three of these releases retained the colour-coded human figure.
At this time the US Insurance Institute for Highway Safety (IIHS) began NCAP offset tests and published the results in a more traditional consumer format. ANCAP focus group research revealed that this format was preferred by general readers, so ANCAP adopted this consumer format as of November 1996.
The Euro NCAP group began publishing its offset and side impact test data in February 1997 using a star rating similar to the NHTSA system. ANCAP is working with Euro NCAP and other international NCAP groups towards a c&mnon rating system.
1 INTRODUCTION
ANCAP was introduced to provide new car buyers with useful information about the relative occupant protection of popular vehicles on the Australian market. This information influences consumer demand and encourages manufacturers to design safer v&icles.
ANCAP commenced in 1992 with the fi.rII frontal test as used by the US NCAP since 1978. An offset test using the EEVC deformable barrier was added in 1994. 2
The first two series of ANCAP results were presented using head and chest injury criteria, with a human figure colour-coded included to indicate injury levels. The detailed dummy measurements were included in the back of the information brochure and this convention has been retained to the present (ANCAP [I] & [2] ).
The frrst two ANCAP public brochures included both the results and the full technical report on each vehicle test. The third publication was separated into a mini-brochure for consumers and a detailed report for technicians (ANCAP [3] &[4]).
The full injury results presentation was felt to be too technical for most consumers so for the next four releases of data the primary rating system became the risk of life threatening injwy. The first three of these releases retained the colour-coded human figure (ANCAP [5-71).
In 1994 the US Insurance Institute for Highway Safety (IIHS) began conducting vehicle offset tests and publishing the results in a traditional consumer format of Good, Acceptable, Marginal and Poor. ANCAP focus group research revealed that the IIHS format was preferred by consumers and ANCAP adopted this format in late 1996 (ANCAP [g-13]).
2. PRESENTATION DEVELOPMENTS
2.1 Need for Improved Presentation
The first 1993 release of ANCAP results only reported the full frontal tests. The inclusion of offset tests in 1994 doubled the available information, which made useful interpretation by the average motorist more difftcult. Although colour coded, the summary table of results in the ANCAP small car report presented a considerable amount of information.
NHTSA consumer focus group studies found that consumers wanted information on crash tests in a non-technical, easily understood form. NHTSA reported that consumers could understand information expressed simply in terms of ‘risk of injury’. However, it indicated they were confused by technical data sheets and dummy output parameters that needed interpretation, particularly
‘420
where these have a logarithmic relationship to the risk of injury.
2.4 Application of Simplified Presentation
2.2 Simplified Presentation
The on-going ‘success of ail NCAP groups relies on optimising consumer understanding. This could only be achieved in Australia by simplifying the format in which ANCAP presented test results, By adopting and extending some recent US NCAP developments in presentation, improved levels of’ consumer comprehension were expected.
Australian NCAP chose to use the 100 point risk rating in its four wheel drive and van release. This format was published in a mini-brochure titled Buyer’s Guide to Vehicle Crash Tests (ANCAP [4]). A sample page is iliustrated in Figure 2 of the Appendix. This brochure received favourable feedback from consumers about its “user- friendliness”.
2.5 Industry Response
In 1993, NHTSA began to publish NCAP results expressed as star ratings. These are calculated using injury risk functions which directly relate measured dummy parameters to figures of life threatening injury risk.
One disadvantage of the NHTSA star rating scheme is that thle star cut-off values chosen result in discrete bands of safety performance. Vehicles with scores at either end of a performance band, if not ranked in some other way, are lumped together as having the one level of safety.
The motor vehicle industry in Australia supports the intention of ANCAP in providing consumer information on vehicle safety but has some reservations about the testing process. These include allegations that there is a lack of repeatability and that the impact speeds are too high.
2.5.1 Repeatability
US NCAP ody went as far as combining head and chest dummy parameters of full frontal tests.. ANCAP needed to combine head and chest readings fdr full anJ offset frontal testing for both driver and front passenger.
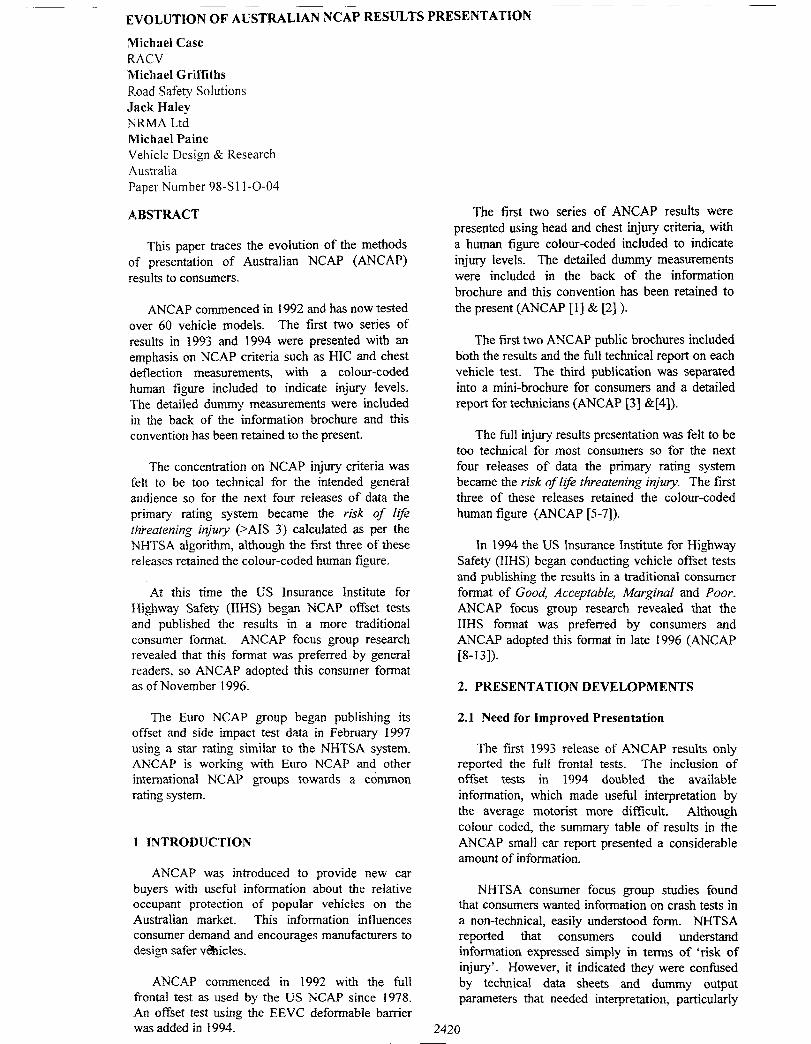
ANCAP has some repeat data available which is summarised below. Tests conducted in Australia have shown good consistency of results. Table 1 below provides results of NCAP repeat tests for HIC which show that these results are repeatable within 10 percent.
Table 1 - ANCAP Report Test Data
Monash University Accident Research Centre (MUARC) research indicates that frontal crashes make up approximately 60 percent of the total serious and fatal injury car crashes in Australia. Of all frontal crashes around one half are of the offset type. Using these data, risk of injury scores for full and offset test cases were combined to establish an overall risk score which simulates ‘real world’ frontal crashes. ‘This was achieved by applying the same injury risk functions used by NHTSA in calculating its star rating scores.
Vehicle HIC Variation Test 1 1 Test 2 %
Daihatsu Charade 960 1050 9.4 Nissan Micra 820 900 9.8 Mitsubishi Mirage 640 608 5.0 Ford Laser 860 871 1.3 Ford Probe (US 724 784 8.3 results) Ford Probe (US 102.5 994 3.0 results)
2.3 The 100 Point Injury Risk Scale 2.5.2 Test speeds
Injury risk values can be directly expressed on a 100 point scaie. This represents the risk of life threatening injury for a weighted combination of full and offset frontal crashes based on relative real world incidence. A plot of Injury Risk scores based on the NCAP 4;WD results, released in 1994 is shown in Figure: 1 of the Appendix. Scores are shown ranked by driver results.
Interpretation is consistent with the test dummy output parameters themselves (ie higher scores mean a higher risk outcome) and with the real world MUARC Crashworthiness Ratings results (MUARC 1998).
Only about 17 percent of fatalities and 37 percent of AIS 4+ injuries occur at crash speeds up to 48 km/h (30 mph), the speed commonly used in regulatory tests around the world, including Australia. Up to the NCAP full frontal crash speed of 56 km/h (35 mph) the fatalities and injuries figures become 25 percent and 53 percent, and up to the NCAP offset tests speed of 64 km/h (40 mph), they are 59 percent and 73 percent respectively. NCAP test speeds therefore cover far more of the serious crashes experienced on-road than do the regulatory speeds.
Australian research shows that at the full frontal regulatory speed there is little difference in HIC
242 1 between the models. Once the speed is raised the
differences become much more significant and it is much clearer which vehicles protect their occupants better.
2.6 Marketing Plan
The ultimate aim of any NCAP is to provide marketing incentives for vehicle manufactures to build in state of the art/world’s best practice occupant protection systems, by convincing consumers to give buying preference to above- average safety performance and particularly not to buy vehicles with below average crash test results.
Accordingly, there is not much point in having an NCAP unless:- . it is easy for consumers to understand which is
the safest car for their purposes; . the relative safety information is presented in a
compelling manner; . consumers can make practical use of the
information to effect their car buying decisions, and they are motivated to do so by the way the material is presented.
Most NCAP programs take some formal steps to publish their results, but the authors of this paper have not seen documentation of social marketing plans for other NCAP programs.
While it is common practice for inaugural NCAP programs to publish the results in a fairly innocuous manner to reduce the likelihood of litigation, it is important that once this settling in period is passed that the relative safety results are accessible and compelling in their presentation.
Like most NCAP programs, Australian NCAP was very cautious in its initial release, publishing mainly raw numbers for injury criteria for various parts of the body and avoiding overall vehicle safety summaries. Obviously, this mode of presentation is only of use to a very sophisticated user who can attempt to give different weightings to information on, say, injury criteria for head, chest and legs, relative injury information for driver and passenger and, where there is more than one test, somehow merging the results of an offset, head-on, or side-on test.
It is more useful to the consumer for the NCAP group itself to merge this information into a single outcome which takes into account the relative incidence of the various crash types and the relative occupancy of the different seating positions. In the past ANCAP has been aware of the need to make sure that the information actually got to consumers. it has done this by:- * Media releases of the information as each batch
of information becomes available through television, radio and newsprint. However, one-
2422
off media releases, whilst achieving a short term high profile, only provide communication span of approximately a day Or SO. Having brochures summarising the results on prominent stands in motoring organisations, and vehicle registering and driver licensing offices. These outlets provide long term access to the test results, but consumers need to be aware of their availability and have ready access to such offices. Conducting seminars specifically aimed at vehicle fleet managers, risk managers, occupational health and safety officers and the vehicle insurance industry. The response to these in Australia has been very good and the advantage of targeting fleet managers is that the control of a large number of vehicle purchases can be effected through one contact in a large organisation. Establishing an intemet web site where all of the test results, including short segments of video of the crash tests, can be accessed (www.nrma.com.au)
ANCAP has now progressed to the formulation of a social marketing plan, in particular aimed at:-
. Fleet, occupational health and safety and risk, managers. In addition to specialised seminars this includes the placement of articles in fleet manager magazines etc.
. Presentation material and brochures to be available at new car sales outiets. This generally only occurs at those dealer outlets whose vehicles perform well in the tests. However, if a consumer is shopping around for a particular class of vehicle, they may be considering at least one make of vehicle which performs well.
. Better packaged, understandable information specifically aimed at non-technical audiences, particularly market growth sectors such as women purchasers.
The main task is to get the information to consumers in an understandable and compelling form so that they will act on it when buying a vehicle. Market testing has found that the credibility of those currently promoting the ANCAP program is very high. This is because motoring organisations are highly regarded and the significance of their merger with state government road safety divisions to put out consumer information is not lost on consumers.
Another important consideration is the occupational health and safety requirements to provide a safe workplace, under which a vehicle is included. This has the potential to provide powerful leverage to both government and industry fleet buying standards.
Our view is that, until an NCAP program has an audited/monitored sound marketing program, it is unlikely to achieve its full potential.
2.7 Media Launches
2.7. I Media Releases
ANCAP h,as taken the common international approach of redeasing a group of vehicle results at one time to maximise interest and to provide consumers with adequate comparative information.
A common media release , written by a member of the ANCAP Technical Committee and reviewed by one of the stakeholders media staff, is provided for all stakeholders. The release is subjected to rigorous legal review to ensure there are minimal grounds for legal action.
2.7.2 Questions & Answers
A summary of common Questions and Answers about the program is kept continually updated and included in the media kit for each launch.
2.1.3 Video Tapes/Photos etc
A Betacam compilation of all the crash tests for each launch is made up from the high speed and real-time film and video from the crash laboratory. This is supplied to any television journalist who attends the launch and on demand to other stations.
2.7.4 Video News Release (VNR)
For several releases ANCAP contracted a media company to produce a video news release consisting of a series of sample questions and answers featuring members of the Technical and Management Committees, with a compilation of the crash test video included. However it was found that the television stations preferred to conduct their own interviews and did not use the question and answer part of the VNR. As the process was quite expensive, involving a professional interviewer, it was abandoned and the video tape is now formatted as above by a contractor from original laboratory film and tapes.
2.7.5 Media Kit
All the above items are included in a media kit folder. Each stakeholder formats the folder to their own preference. The kit is distributed to a range of magazines, nlewspapers and periodicals.
2.8 International Data
The Enhanced Safety of Vehicles (ESV) Conference held in Melbourne during May 1996
had the theme of globalisation and harmonisation of vehicle safety standards.
The ESV Conference demonstrated that much activity was occurring on a global scale with consumer crash test programs but there was a need to harmonise test protocols, including presentation of crash test results The Conference identified NCAP activity in Japan, Europe, Korea and the United States as well as Australia.
ANCAP saw benefits in reducing costs and enhancing the range of results provided by a more co-operative approach between global consumer crash test programs and gathered information from around the world to clarify the potential benefits of data sharing.
3. CURRENT SITUATION
3.1 Results Format
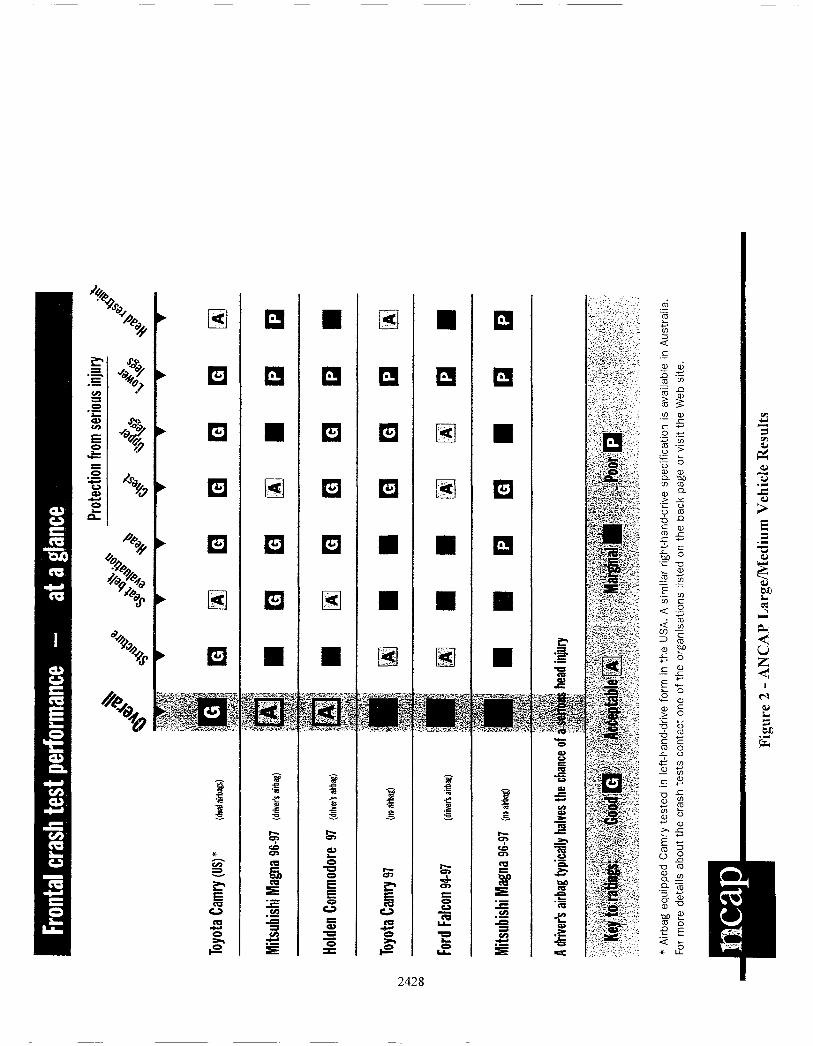
The ANCAP presentation of results has evolved by a process of continuous review, including focus group evaluations. The current format is based on the US IIHS brochure method and uses ratings of Good, Acceptable, Marginal and Poor (see Figs 2- 4).
This format was considered to be the best available internationally in 1996. Market research in Australia has also shown that consumers find this presentation format relatively easy to understand.
Four areas of vehicle crashworthiness are evaluated - structure, restraints, injury measurements and head restraint design. These are combined into an overah evaluation which is based on both the full frontal and offset crash test results. The results are available on the intemet (www.nrma.com.au/cras.htests/).
3.2 Data Sharing
ANCAP is part of a global NCAP network. NCAP organisations are standardising on testing and are sharing results for similar vehicles in different markets. ANCAP, by agreement with the manufacturers, has used IIHS results for the Volvo 850 and Toyota Camry and a Euro NCAP result for the Volkswagon Polo. Japan NCAP is also repubiishing results from US NCAP. This will become more common as vehicle designs are increasingly globalised.
Data sharing means that duplication of effort and considerable costs can be avoided and more vehicles can be evaluated. Consumers can then make a more informed choice at the time of vehicle purchase on the basis of occupant protection performance.
2423
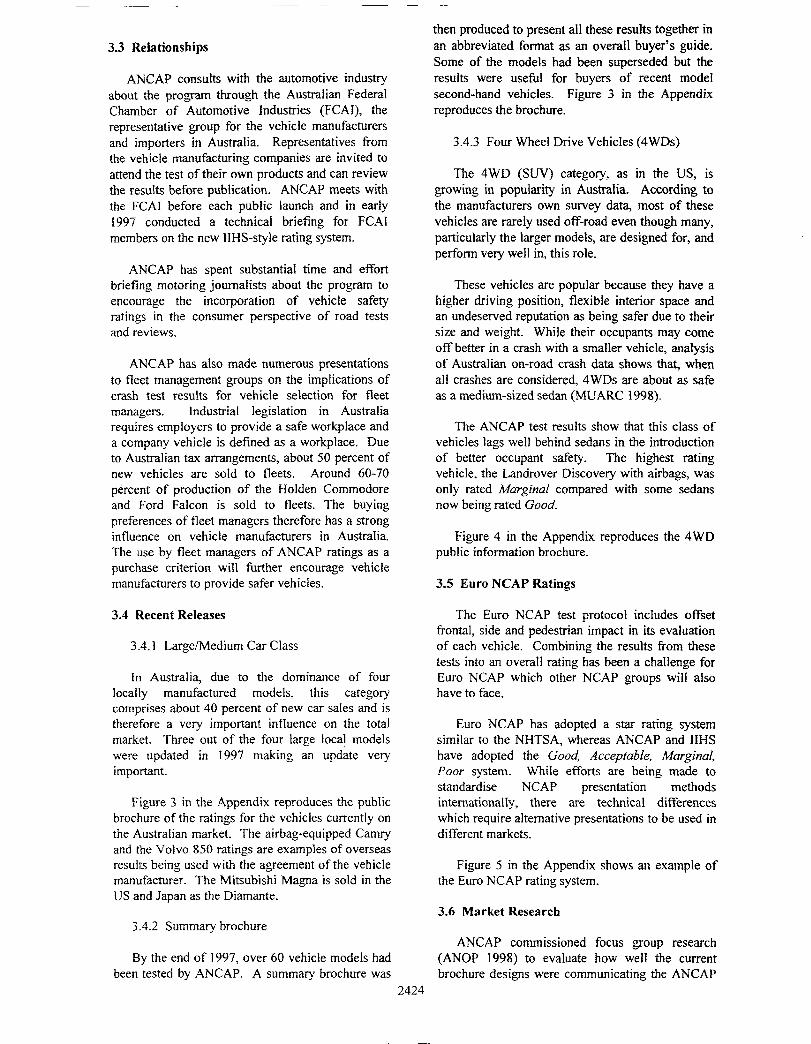
3.3 Relationships
ANCAP consults with the automotive industry about the program through the Australian Federal Chamber of Automotive industries (FCAI), the representative group for the vehicle manufacturers and importers in Australia. Representatives from the vehicle manufacturing companies are invited to attend the test of their own products and can review the results before publication. ANCAP meets with the FCAT before each public launch and in early 1997 conducted a technical briefing for FCAI members on the new IIHS-style rating system.
ANCAP has spent substantial time and effort briefing motoring journalists about the program to encourage the incorporation of vehicle safety ratings in the consumer perspective of road tests and reviews.
ANCAP has also made numerous presentations to fleet management groups on the implications of crash test results for vehicle selection for fleet managers. Industrial legislation in Australia requires employers to provide a safe workplace and a company vehicle is defined as a workpiace. Due to Australian tax arrangements, about 50 percent of new vehicles are sold to fleets. Around 60-70 percent of production of the Holden Commodore and Ford Falcon is sold to fleets. The buying preferences of fleet managers therefore has a strong influence on vehicle manufacturers in Australia. The use by fleet managers of ANCAP ratings as a purchase criterion wiI1 further encourage vehicle manufacturers to provide safer vehicles.
3.4 Recent Releases
3.4.1 Large/Medium Car Class
In Australia, due to the dominance of four locally manufactured models, this category comprises about 40 percent of new car sales and is therefore a very important influence on the total market. Three out of the four large loca! models were updated in 1997 making an update very important.
Figure 3 in the Appendix reproduces the public brochure of the ratings for the vehicles currently on the Australian market. The airbag-equipped Camry and the Volvo 850 ratings are examples of overseas results being used with the agreement of the vehicle manufacturer. The Mitsubishi Magna is sold in the US and Japan as the Diamante.
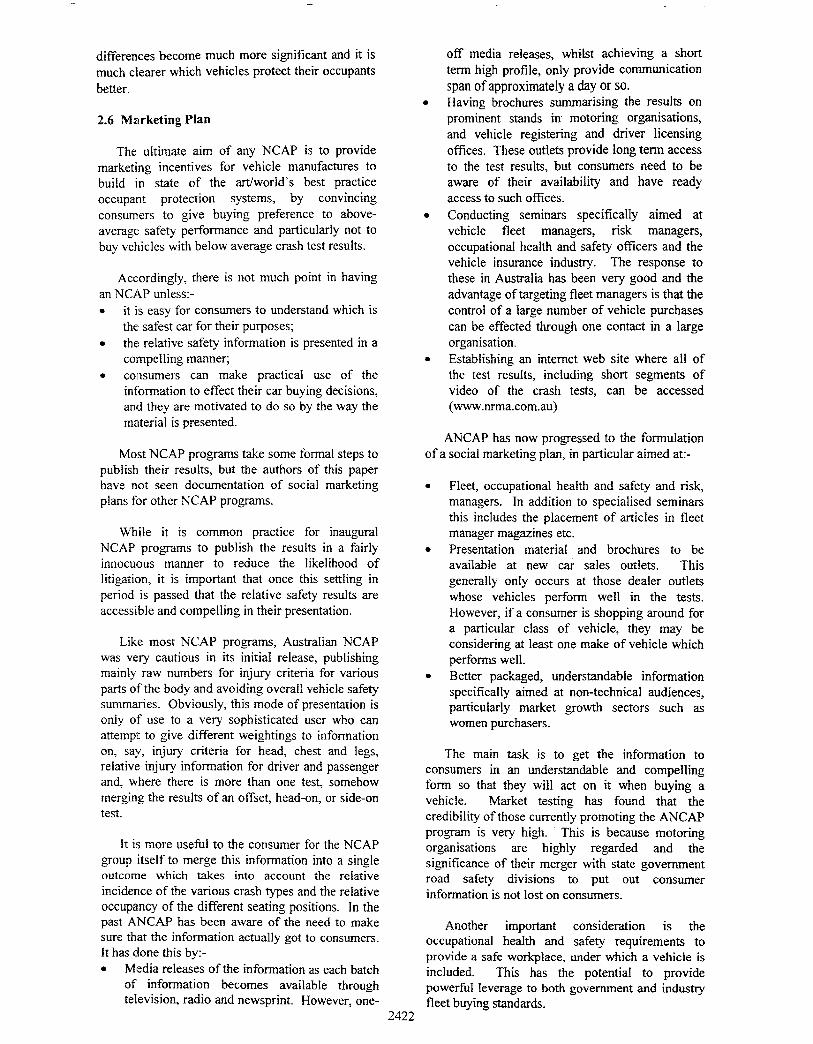
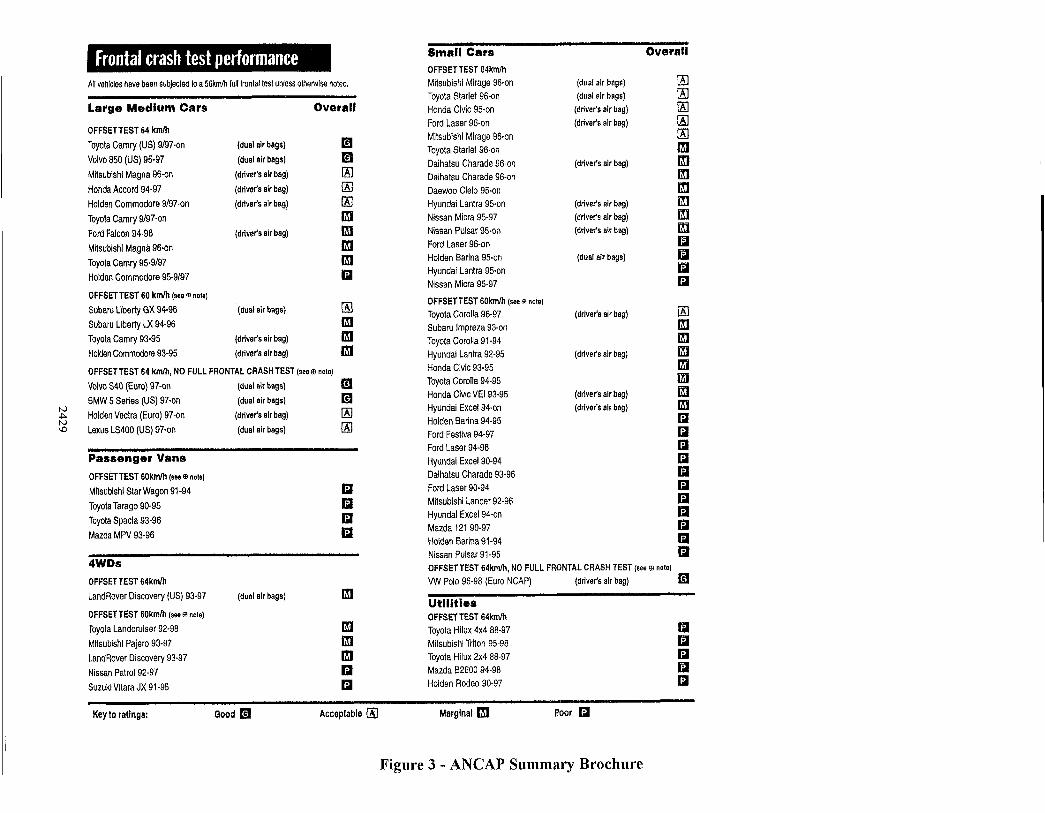
3.4.2 Summary brochure
By the end of 1997, over 60 vehicle models had been tested by ANCAP. A summary brochure was
2424
then produced to present all these results together in an abbreviated format as an overall buyer’s guide. Some of the models had been superseded but the results were useful for buyers of recent model second-hand vehicles. Figure 3 in the Appendix reproduces the brochure.
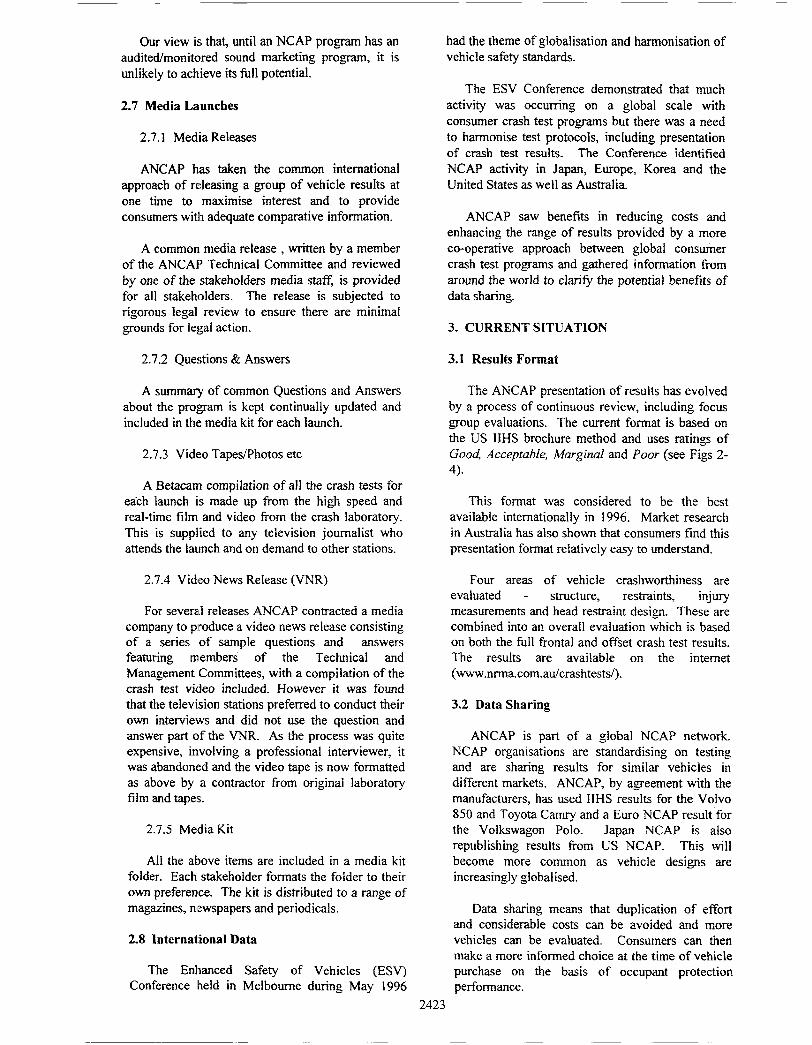
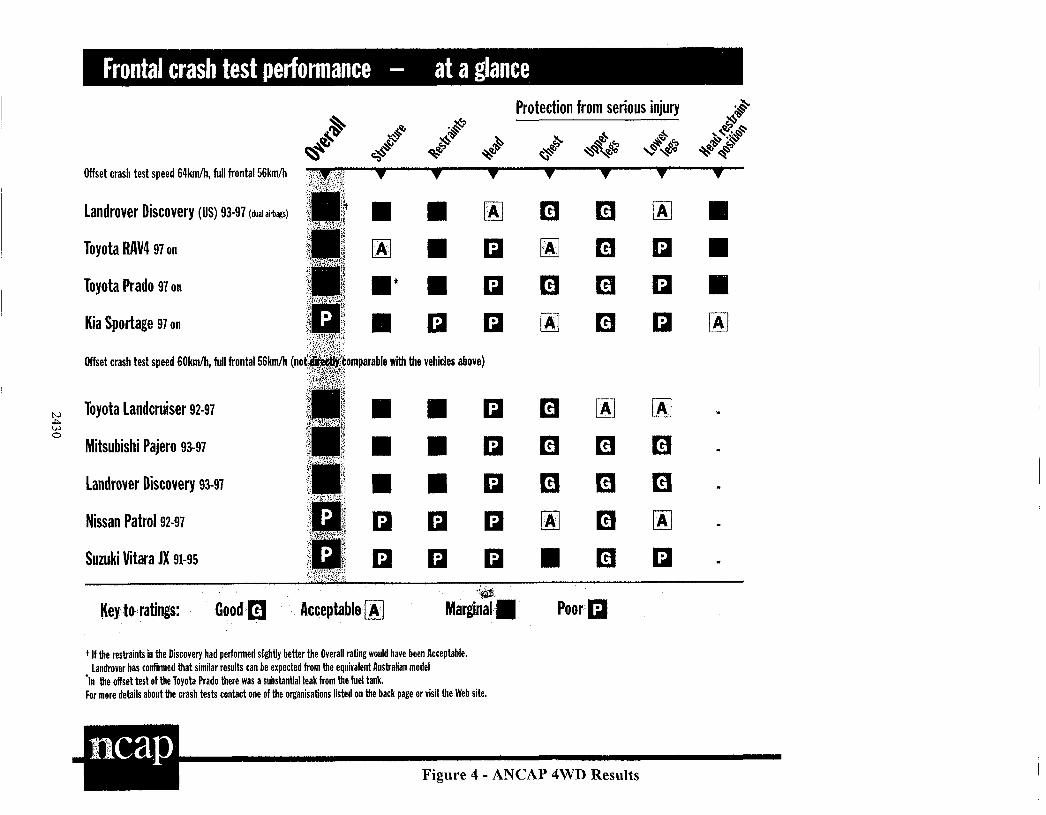
3.4.3 Four Wheel Drive Vehicles (4WDs)
The 4WD (SUV) category, as in the US, is growing in popularity in Australia. According to the manufacturers own survey data, most of these vehicles are rarely used off-road even though many, particularly the larger models, are designed for, and perform very well in, this role.
These vehicles are popular because they have a higher driving position, flexible interior space and an undeserved reputation as being safer due to their size and weight. While their occupants may come off better in a crash with a smaller vehicle, analysis of Australian on-road crash data shows that, when all crashes are considered, 4WDs are about as safe as a medium-sized sedan (MUARC 1998).
The ANCAP test results show that this class of vehicles lags well behind sedans in the introduction of better occupant safety. The highest rating vehicle, the Landrover Discovery with airbags, was only rated Marginal compared with some sedans now being rated Good.
Figure 4 in the Appendix reproduces the 4WD public information brochure.
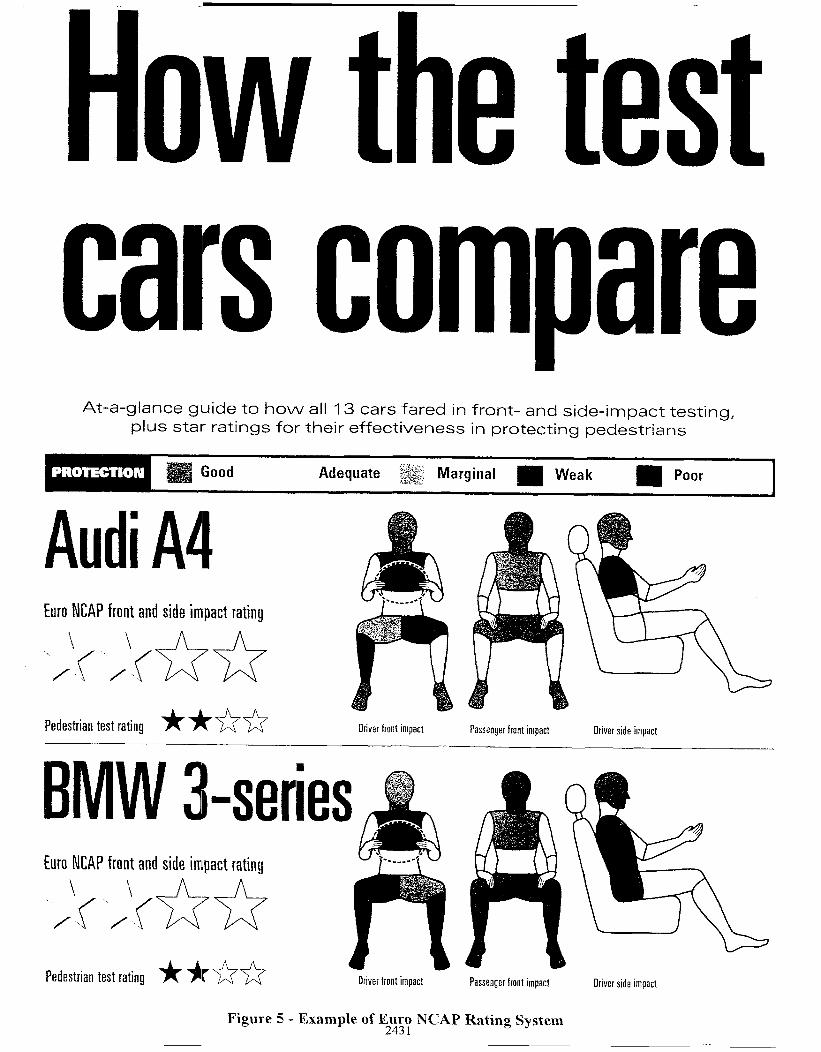
3.5 Euro NCAP Ratings
The Euro NCAP test protocol includes offset frontal, side and pedestrian impact in its evaluation of each vehicle. Combining the results from these tests into an overall rating has been a challenge for Euro NCAP which other NCAP groups will also have to face.
Euro NCAP has adopted a star rating system similar to the NHTSA, whereas ANCAP and IIHS have adopted the Good, Acceptable, Marginal, Poor system. While efforts are being made to standardise NCAP presentation methods internationally, there are technical differences which require alternative presentations to be used in different markets.
Figure 5 in the Appendix shows an example of the Euro NCAP rating system.
3.6 Market Research
ANCAP commissioned focus group research (ANOP 1998) to evaluate how well the current brochure designs were communicating the ANCAP
results, to canvass how the design and distribution could be improved and to suggest other avenues for promoting the pro,gram and the information.
The groups consisted of people who were soon to purchase, or had recently purchased, a new car. Both genders were represented (interviewed separately) and the groups were segregated into under and over 40 age groups.
The main resu Its of the research were that-: l despite considerable effort over the years to
simplify the content of ANCAP brochures, even more simplified presentations were needed;
l the logos of the program sponsors needed to be given greater prominence as they contributed greatly to the credibility of the program;
l the rating system may need minor revision to add a category better than Good Excellent was suggested;
l previous tests should be included wherever possible to provide a good comparison for readers;
l the distribution system should be broadened to include, for instance-:
-as an insert in motoring association magazines
-new car dealers -service .stations/garages -supermarkets -vehicle accessory stores and vehicle
sections of supermarkets -libraries
A public relations campaign was suggested including television current affairs and infotainment programs, particu.lariy those with a consumer angle, radio programs featuring motoring personalities, and features in women’s magazines which would be likely to reach a receptive audience. Cross promotions in these magazines with vehicle manufacturers were suggested.
Women are generally more concerned about safety than men and more often look for a wide range of information before reaching a purchasing decision. Women are involved in over half of all vehicle purchasmg decisions, so they are an influential target group.
4 FUTURE DIRECTIONS
After frontal crashes, side impacts cause the most trauma on Australian roads. ANCAP therefore intends to adopt a side impact test in the near future. When this occurs the relevance and value of the full frontal test will be re-evaluated in the light of airbag penetration into the Australian new vehicle mark.et.
The recent availability of an on-board data acquisition system by ANCAP’s main test contractor means that the rear seat in vehicles can now be retained - previously it had to be removed to accomodate the junction boxes for the umbilical cord data acquisition system. This will allow a range of fkther test activities such as effectiveness of rear seatbeltsiseat-pans, child restraints and seat latch strength. The exact tests to be run were still being decided at the time of writing.
5 CONCLUSIONS
ANCAP’s experience with producing consumer ratings on vehicle safety is a useful guide to other groups attempting the same task. Of greatest importance are the periodic review of methods of presentation of information to the car buying public and methods of advertising, marketing and distributing the information.
Television has been found to be an excellent medium for promoting vehicie safety overall and ANCAP pubfications. However, television advertisements are expensive and a wider marketing program maintains interest in crash test results for a longer period.
2425
REFERENCES
ANCAP [I], “Crash Test Report,” Vol 1 Number 1, Large/Medium cars, April 1993.
ANCAP [2], “Crash Test Report,” Vol 1 Number 2, Small cars, April 1994.
ANCAP [3], “Crash Test Report, Technical Summary,” Vol 1 Number 3, 4 wheel drives and passenger vans, November 1994.
ANCAP [4], “Buyers Guide to Vehicle Crash Tests, 4 wheel drives and passenger vans,” November 1994.
ANCAP [5], “Buyers Guide to Vehicle Crash Tests, Large/medium and small cars,” June 1995.
ANCAP [6], “Buyers Guide to Crash Tests, Utes,” November 1995.
ANCAP [7], “Buyers Guide to Crash Tests, Large/medium cars,” March 1996.
ANCAP [S], “Buyers Guide to Crash Tests, Small car update,” November 1996.
ANCAP [9], “Buyers Guide to Crash Tests, Large/medium car update,” February 1997.
ANCAP [lo], “Buyers Guide to Crash Tests, Small car update,” July 1997.
ANCAP [I 11, “Buyers Guide to Crash Tests, Large/medium car update,” December 1997.
ANCAP [ 121, “Buyers Guide to Crash Tests, Summary,” January 1998.
ANCAP [13], “Buyers Guide to Crash Tests,” 4WDs, April 1998.
ANOP, NCAP CRASH TEST BROCHURES, “Qualitative Research into New Car Buyers’ Attitudes to Car Safety and the NCAP Brochures”, ANOP Research Services Pty Ltd, April 1998.
MUARC, Newstead, Stuart, Cameron, Max, and Le, Chau My, “Vehicle Crashworthiness ratings and crashworthiness by year of manufacture: Victoria and New South Wales crashes during 1987-96,” March 1998.
2426
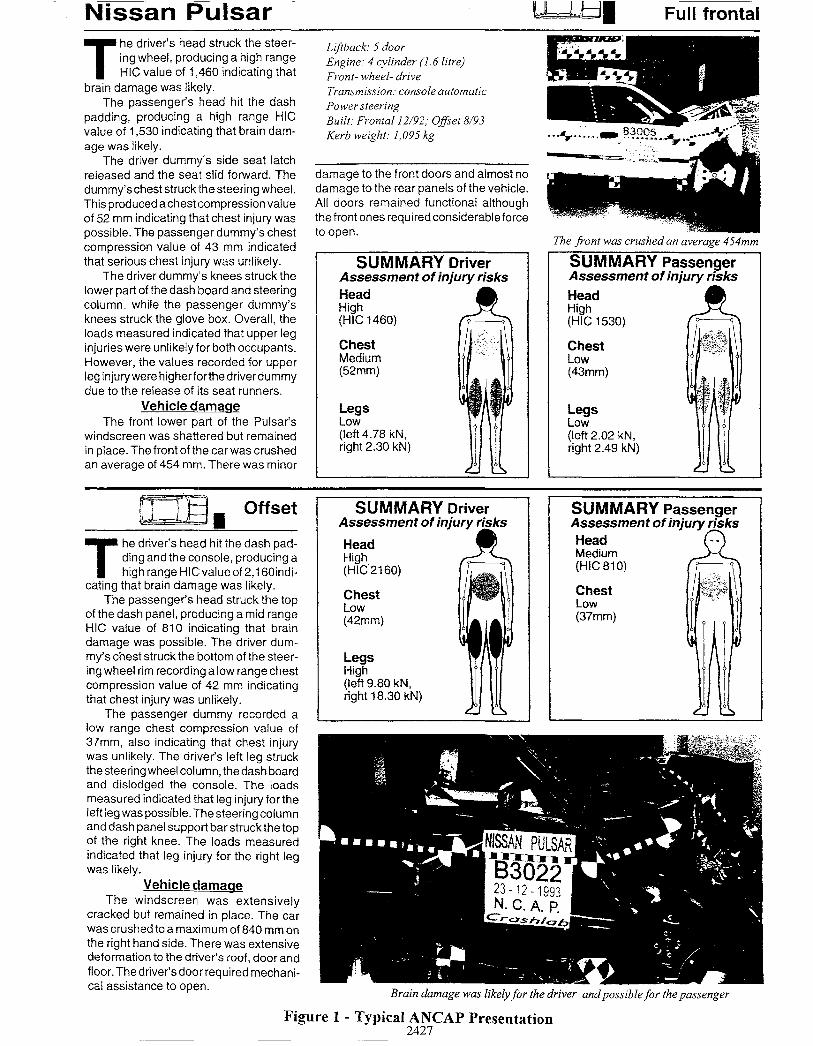
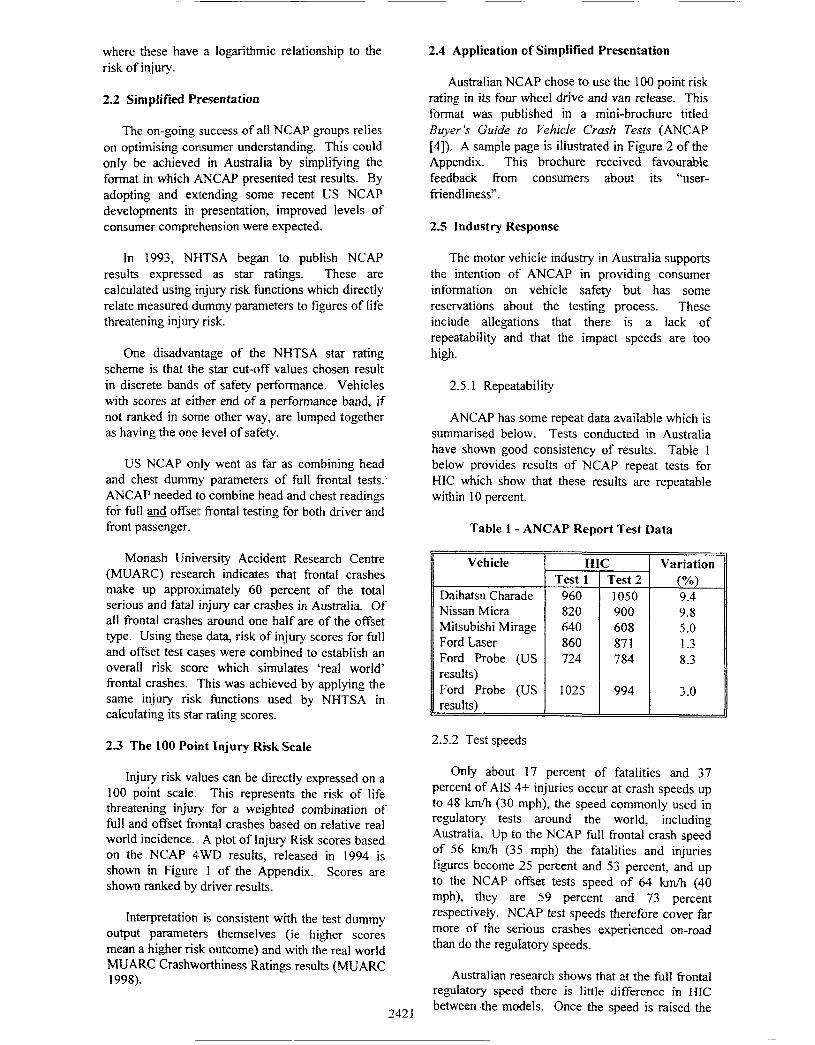
Nissan P’ulsar II Full frontal
T he driver’s heaId struck the steer- ing wheel, producing a high range HIC value of 1,460 indicating that
brain damage was likely. The passenger’s head hit the dash
padding, producing a high range HIC value of 1,530 indicating that brain dam- age was likely.
possible. The passenger dummy’schest
The driver dummy’s side seat latch released and the seat slid forward. The dummy’schest struckthesteering wheel. Thisproducedachestcompressionvalue of 52 mm indicating that chest injury was
Lijiback: 5 door Engine: 4 cylinder (I. 6 litre) Front- wheel- drive Transmission: console automatic Power steering Built: Frontal 12/92; Offset 8/93 Kerb weight: 1,095 kg
damage to the front doors and almost no
to open.
damage to the rear panels of the vehicle. All doors remained functional although thefrontonesrequiredconsiderableforce
compression value of 43 mm indicated that serious chest injury was unlikely.
The driver dummy’s knees struck the lower part of the dash board and steering column, while the passenger dummy’s knees struck the glovie box. Overall, the loads measured indicated that upper leg injuries were unlikely for both occupants. However, the values recorded for upper leg injurywere higherforthe driverdummy due to the release of its seat runners.
Vehicle damaae The front lower part of the Pulsar’s
windscreen was shattered but remained in place. The front of the carwas crushed an average of 454 mm. There was minor
SUMMARY Driver Assessment of injury risks Head High (HIC 1460)
Chest Medium (52mm)
Legs Low (left 4.78 kN, right 2.30 kN)
iI i Offset
T he driver’s hea.d hit the dash pad- ding and the console, producing a high range HICvalueof 2,16Oindi-
eating that brain dam.age was likely. The passenger’s head struck the top
of the dash panel, producing a mid range HIC value of 810 indicating that brain damage was possiblle. The driver dum- my’s chest struck the ibottom of the steer- ing wheel rim recording a low range chest compression value of 42 mm indicating that chest injury was unlikely.
The passenger clummy recorded a low range chest compression value of 37mm, also indicating that chest injury was unlikely. The drrver’s left leg struck the steering wheel column, the dash board and dislodged the console. The loads measured indicated that leg injury forthe left ieg was possible. The steering column and dash panel support bar struck the top of the right knee. The loads measured indicated that leg injury for the right leg was likely.
Vehicle clamaqe The windscreen was extensively
cracked but remained in place. The car was crushed to a max:imum of 840 mm on the right hand side. There was extensive deformation to the driver’s roof, door and floor. The driver’s door required mechani- cal assistance to open.
Figu
SUMMARY Driver Assessment of injury risks
Head High (HIC 2160)
Chest Low (42mm)
Legs High (left 9.80 kN, right 18.30 kN)
The j?ont was crushed an average 454mm
SUMMARY Passenger Assessment of injury risks Head High (HIC 1530)
Chest Low Wmm)
Legs Low (left 2.02 kN, right 2.49 kN)
SUMMARY Passenger Assessment of injwy risks Head Medium (HIC 810)
Chest Low (37mm)
Brain damage was likely for the driver andpossible for the passenger
re 1 - Typical ANCAP Presentation 2427
2428
R .
R .
q
R .
q
All vehicles have been subjected to a 56hh lull frontal lest unless olhwlse noted
Large Medium Cars dverall
OFFSETTEST 64 kmlh
Toyota Camry (US) Q/97-on Volvo 650 (US) 95-97 Mitsubishi Magna Q6-on Honda Accord 94-97 Holden Commodore Q/97-on
Toyota Camry Q/97-on
Ford Falcon 94-98 Miisubishl Magna 96.on Toyota Camry 95-9197 Holden Commodore 95-9197
(dual atr bags)
(dual air bags)
(driver’s elf bag) ixl
(dtiver’s air bag) q (driver’s alr bag) l7J
(driver’s alr bag) ii
q
OFFSETTEST 60 km/h (we * note)
Subaru Liberty GX 94-96 (dual alr bags) Subaru Liberty LX 94-96 Toyota Camry 93-95 (drtveh air bag) Holden Commodore 93-95 (driveis sir bag) ii
OFFSETTEST 64 kmlh, NO FULL FRONTAL CRASH TEST (see w note)
Volvo 540 (Euro) 97-on (dual air bsgs) BMW 5 Series (US) 97son (dual air bags) : Holden Vectra (Euro) 97.on (driver’s air bag) Lexus LS400 (US) 97.on (dual air begs)
Passenger Vans OFFSETTEST 6OkmJ1 (aas m note)
Mitsubishi Star Wagon 91-94 Toyota Tarago 90-95 Toyota Spacia 93-96 Mazda MPV 93-96
4WDs OFFSETTEST 64krw’h
LandRover Discovery (US) 93-97 (dual air bags) q OFFSETTEST 6Okmh (see B nope)
Toyota Landcruiser 92-96 Mltsubishi Pajero 93-97 !/ii LandRover Discovery 93-97 Nissan Patrol 92-97 ii Suzuki Vitara JX 91-95 fa
Small Cars Overall OFFSETTEST 64krn!h Mitsubishi Mirage 96-on Toyota Starlet 96-on Honda Civic 95-on Ford Laser 96-on Mitsubishi Mirage 96.on Toyota Starlet 96.on Daihatsu Charade 96.on Daihatsu Charade Q&on Daewoo Cielo 95.on Hyundai Lantra 95.on Nissan Micra 95-97 Nissan Pulsar 95on Ford Laser 96.on Holden Barina 95.on Hyundai Lantra 95on Nissan Micra 9.597
OFFSETTEST 6Ohh (seam Toyota Corolla 96-97 Subaru lmpreza 93.on Toyota Corolla 91-94 Hyundai Lantra 92-95 Honda Civic 93-95 Toyota Corolla 94-95 Honda Civic VEI 93-95 Hyundai Excel 94.on Holden Barina 94-95 Ford Festiva 94-97 Ford Laser 94-96 Hyundai Excel 90-94 Daihatsu Charade 93-96 Ford Laser 90-94 Miisubishi Lancer 92-96 Hyundai Excel 94-on Mazda 121 90-97 Holden BarinaQl-94 Nissan Pulsar 91-95
(dual air bags) (dual alr bags)
(driver’s air bag) (driver’s alr bag)
(driver’s alr bag)
(driver’s alr bag) (driver’s alr bag) (driver’s sir bag)
(dual alr bags)
(driver’s sir bag)
(driver’s alr bag)
(driver’s air bag) (driver’s air bag)
OFFSETTEST 64krn/‘h, NO FULL FRONTAL CRASH TEST (see rir nola) VW Polo 96-96 (Euro NCAP) (driver’s alr bag) a
Utilities OFFSET TEST 64kmh Toyota Hilux 4x4 66-97 Mitsubishi Tmon 95-96 i
Toyota Hilux 2x4 6697 Mazda 82600 94-96 Holden Rodeo 90-97
Key to ratings: Qood q Acceptable q Marginal IIJ
Figure 3 - ANCAP Summary Brochure
\ Protection from serious injury
($p 8 g $
*
* & $9 ,a
& @a *$& 6 e-b
~~*!i *Q * ,a *
Offset crash test speed 64km/h, full frontal 56km/h
Landrover Discovery (US) 93-97 (dual aitbgs)
Toyota RAV4 97 OII
Toyota Prado 97 ON
Kia Sportage 97 on
N Toyota Landcruiser 92-w tJ o Mitsubishi Pajero 93-97
Landrover Discovery 93-97
Nissan Patrol 92-97
Suzuki Vitara JX 91-95
HeyWatings: Good q Acceptable m .Q&,
Marginal H Poor m
t If the restraints in the Discovery had performed slightly better the Overall rating would have been Acceptable. Landrover has confbmed that similar results can be expected from the equivalent Australian model
‘In the offset test of the Toyota Prado there was a substantial leak from the fuel tank. For more details about the crash tests contact one of the organisations listed on the back page or visit the Web site.
Figure 4 - ANCAP 4WD Results
How the test
cars compare At-a-glance guide to how all 13 cars fared in front- and side-impact testing,
plus star ratings for their effectiveness in protecting pedestrians
Audi A4 - ..A.-. . . . . two NCAY tront and side impact rating
\- /‘.( ,:.~(* *
I , h h Pedestrian test rating *1ta* Driver front impact Passenger front impact Driver side impact
BMW 3-serie Euro NCAP front and side impact rating
x/‘s x/~ts**
Pedestrian test rating ***-i? Driver front impact Passenger front impact Driver side impact
Figure 5 - Example of E2~y NCAP Rating System