Embed Size (px)
Citation preview
Young adult licensing trends and travel modesSeptember 2015
RACV Research Report 15/01


Royal Automobile Club of Victoria (RACV) Ltd
Report No. Date ISBN Pages15/01 September 2015 978-0-9804913-7-1 48
TitleYoung adult licensing trend and travel modes
Authors AcknowledgmentsTJ Bailey Rebekah Smith
LN Wundersitz Melinda Spiteri
SJ Raftery VicRoads for providing licensing data
MRJ Baldock
Performing OrganisationCentre for Automotive Safety Research (CASR)
The University of Adelaide
South Australia 5005
AUSTRALIA
AbstractChanging travel mode choices among young people, in particular declines in the percentages of those with driver’s licences, have been found in several countries. This study sought comparable evidence of driver licensing decline among the young in Victoria, Australia, as well as reasons for not wanting to drive or obtain a licence. A pattern of licensing decline among Victorian 18-29 year olds since 2001 was found. In 2014, over one-third of 18-24 year old Victorians were not licensed to drive. This licensing decline is accompanied by substantial increases in the proportions of licensed drivers aged over 50. An online survey of 147 Australians aged 18-30 not licensed to drive found that the most frequent reasons for not being licensed included the difficulty of the licensing process or its expense, not liking driving or preferring walking. Over a third of those aged 25-30 said they had never learned to drive, or were still learning. In sum, there is a pattern of changing travel mode choice among young adults characterised by their driving less, not at all or delaying getting a licence. As well there are some strong preferences for other transport modes, such as public transport and walking. Potential implications of such changes in travel modes include reduced road infrastructure revenue and costs, reduced traffic congestion, environmental benefits and reduced road deaths and injuries, but also a need for safer infrastructure for cycling, motorcycling and walking. Graduated licensing systems that protect young drivers will continue to be needed and young drivers will increasingly experience a road system comprising road users aged over fifty.
Key WordsYoung drivers, travel mode, licensing
Young adult licensing trends and travel modes
RACV Research Report 15/01
DisclaimerThe research presented in this report has been funded by RACV and is released in the public interest. The views expressed and recommendations made are those of the authors and do not necessarily reflect RACV policy or the views of the University of Adelaide.
Although the report is believed to be correct at the time of publication, RACV, excludes, to the maximum extent permitted at law, all liability for loss (whether arising under contract, tort, statute or otherwise) arising from the contents of the report or from its use. Where such liability cannot be excluded, it is reduced to the maximum extent permitted at law. Discretion and judgement should be applied when using or applying any of the information contained within the report.
© Royal Automobile Club of Victoria (RACV) Ltd 2013. This work is copyright. Apart from any use as permitted under the Copyright Act 1968, no part may be reproduced by any process without permission in writing from the RACV.

Young adult licensing trends and travel modes
RACV Research Report 15/01
Executive Summary
introduced its more stringent graduated licensing scheme (GLS) around 2007. By 2014, just over one-third of 18-24 year old Victorians were not licensed to drive, although some of these (for various reasons) were likely to have been merely delaying a decision to obtain a licence. Nonetheless, this third is likely to be an underestimate of non-driving among the young due to the unquantified proportion who hold a valid driver’s licence but still choose not to drive for some if not all of their travel. The licensing data also revealed that young adults in Victoria are becoming more likely to hold motorcycle licences, although there is an increasing trend for motorcycle licensing across all adult ages. Nonetheless, 22 to 25 year olds are becoming more likely to hold a licence for motorcycle riding only. Additionally, the licence data revealed that the licensing decline among young adults is accompanied by substantial increases in the proportions of adults aged over 50 who are licensed.
From an online survey of 147 Australians aged 18-30 who are not licensed to drive, this study found that the most frequent reasons for not being licensed related to opportunities to get a licence, such as the difficulty of the licensing process or its expense. Other common reasons related to perceived need for a licence, such as not liking driving or preferring walking. Over a third of respondents aged 25-30 said that they had never learned to drive or were still learning. This, together with the survey’s finding that not liking driving was a common reason among 22-24 and 25-30 year olds, suggests the emergence of a strong pattern of not wanting to drive much or at all, particularly among some 25-30 year olds. (A similar conclusion was reached in research work in Sydney by Raimond and Milthorpe, 2010).
Collectively, the reviewed literature, the analysis of Victorian licensing data and the survey of young Australian non-drivers point to a pattern of changing travel mode choice among young adults. This pattern is characterised by an increasing number of young adults who choose not to acquire a driver’s licence and who prefer alternative transport modes, such as public transport or walking. It is likely that many young licensed drivers are also increasing their use of alternative transport modes as complements to their driving. However, it is not certain to what extent this might be indicative of trends over the coming decades. In particular, it is not yet known if the present generation of young adults who do not drive will tend to maintain this choice as they get older, or if they will adopt transport mode choices
Changing travel mode choices among young people, in particular declines in the percentages of young people with driver’s licences, have been found in several countries, including the US, Canada, Sweden, Norway, the UK and Germany. Among North American young adults, common reasons for not holding a driver’s licence included that they were too busy to get a licence; owning and maintaining a vehicle is too expensive; they are able to get transport from others; and that they prefer walking, cycling or public transport to driving as travel mode choices.
The present study aimed to determine if there is comparable evidence of driver licensing decline among young people in Victoria but also any comparable reasons for not wanting to drive or to obtain a licence. Declines in licensing rates have the potential, in broad government and industry policy circles, to affect future transportation needs, preferences for non-driving transport modes, vehicle purchases, and could have road safety and environmental consequences. The study paid attention to the road safety implications of changing travel mode preferences among young adults. This was important because much of the relevant literature has been written from sociological and public transport planning perspectives, with very little focussed attention on potential road safety implications.
The literature review indicates there are many inter-linked broad factors influencing young adults’ travel mode choices, and particularly whether they obtain a driver’s licence. These factors include:
• transport planning policies, economic circumstances and market forces restricting access to and usage of cars;
• a delayed transition from teenage to adult lifestyles;
• increased use of car-sharing schemes and;
• a devaluing of car ownership and car use as alifestyle characteristic.
Also, along with increasing commonality of teleworking (working from home), public transport is becoming an increasingly more attractive choice due to convenience, shorter travel times and the fact that it allows sustained use of technological equipment such as smartphones and laptops.
Using licensing data supplied by VicRoads, this study identified patterns of licensing decline among Victorian 18-29 year olds since 2001, which means the decline was evident well before Victoria
i
Young adult licensing trends and travel modes
• reduced overall exposure to the road by young drivers, contributing to reductions in road crashes, deaths and injuries;
• a continuing need for graduated licensing systems that protect young drivers as they accumulate experience and which extend across the late teens into the early 20s to similarly protect those who delay obtaining licences;
• young drivers in the future will be participating in an age-mix of drivers and a road system that will increasingly comprise road users aged over 50, with a great many of them elderly;
• a need for increased provision of safe and appealing infrastructure for alternative transport modes, such as public transport, but particularly for those who prefer to cycle, motorcycle or walk, in view of their heightened vulnerability as road users.
Finally, in consideration of the reviewed literature and the study’s limitations, a number of areas for further research were recommended.
more traditionally associated with middle adulthood and raising a family, which are often more car-reliant. Another factor potentially influencing young adults’ decisions on whether to obtain a licence is the reduced need to physically travel from home to work brought about by teleworking (working from home). This trend is particularly noticeable among young adults and ultimately serves to reduce their overall travel (van der Waard et al., 2012; US Department of Transportation, 2015).
There are wide ranging implications for declines in licensing and car use, such as reduced road infrastructure revenue and costs, reduced traffic congestion, environmental benefits and reduced road deaths and injuries. However, the implications also extend to better planning of public transport services to meet any increases in patronage, and increased implementation of safer infrastructure for cycling, motorcycling and walking.
On the assumption that the identified changing travel mode choices persist into the future, several implications for road safety specifically were suggested:
ii

RACV Research Report 15/01iii
1. Introduction 1
1.1 Aim, rationale and scope of the study 1
2. Methodology 3
2.1 Literature review 32.2 Population-based licensing rates in Victoria 32.3 Survey of young Australians 4
3. Literature review 5
3.1 Current trends in travel mode choice among young adults 53.2 Reasons for not having a driver’s licence 73.3 The broader implications 133.4 Conclusion from literature review 15
4. Results – population-based licensing rates in Victoria 17
4.1 Licensing rates generally 174.2 Motorcycle licence numbers 214.3 Brief summary of key licensing results 26
5. Results ― survey of non-drivers aged 18-30 27
5.1 Demographics of survey respondents 275.2 Reasons for not having a licence 285.3 Plans to obtain a licence 305.4 Current travel modes used 315.5 Discussion of survey results 31
6. Discussion 33
6.1 Study limitations 336.2 Further discussion on key findings 336.3 Implications of young adults’ changing choices of travel mode 346.4 Road safety conclusions 35
7. Recommendations for further research 37
References 39
Appendix A - Driver’s licences held, age 18-24, Victoria, 2001-2014 43
Appendix B - Survey of non-drivers aged 18-30 44
Appendix C - Changing age-mix of drivers in Victoria 48
Young adult licensing trends and travel modes
Table of Contents
iv

RACV Research Report 15/01
Are young adults’ choices of travel mode changing? It is important to explore this question because road user age influences various key aspects of road travel, including choice of transport mode, exposure to the road system, choice of vehicle driven and hence road safety. For example, increases in the numbers of young adults who acquire driver’s licences commonly translate into increased crashes involving young drivers and their passengers, while conversely lower numbers of younger drivers are likely to lead to fewer crashes involving that age group. The question is also important because young adults’ travel mode choices may persist into later adulthood.
Declines in the percentages of young people with driver’s licences accompanied by increases in the proportions of licensed drivers at other ages have been noted in the United States, Canada, Sweden, Norway, the United Kingdom, Japan, South Korea and Germany. In the US, between 1983 and 2010, the percentage of 19 year olds holding licences dropped from 87% to 70% while the proportion for 17 year olds fell by a third, dropping from 69% to 46% (Sivak & Schoettle, 2012a, 2012b).
In a survey of 618 young North American adults (aged 18-39) not holding a driver’s licence (Schoettle & Sivak, 2013), the main reasons given by the respondents (in descending frequency order) were:
• Too busy to get a licence
• Owning and maintaining a vehicle is too expensive
• Able to get transportation from others
• Prefer to walk or cycle
• Prefer public transport
• Environmental concerns about vehicle use
• Communication needs are met through online transactions instead
• Disability/medical/vision problems.
Although over two-thirds of the sample said they planned to obtain a licence within the next five years, a fifth said they intended never to obtain a licence. Schoettle and Sivak (2013) also found that the reasons above were often given by licensed young drivers for generally driving less often and for shorter distances when compared with those in the previous generation, which suggests some of these reasons indicate beliefs and values commonly held by young people today.
Other research has found a range of influential factors on young adults’ travel choices, particularly in relation to driving. The range includes socio-economic circumstances, attractiveness of other modes of transport and opportunities for getting a licence. For example, many young American adults may be delaying licensure so they can avoid tougher Graduated Licensing Scheme (GLS) requirements that apply to younger ages, thereby making them inexperienced but more mature drivers when they do obtain licences (Williams, Tefft & Grabowski, 2012).
1.1 Aim, rationale and scope of the studyThe study primarily aimed to determine if there is any quantitative evidence of driver licensing decline among young people in Victoria but, irrespective of whether there is, there was a secondary aim to ascertain the reasons young people might give for not wanting to drive or for not obtaining a driver’s licence. This would afford comparisons with similar trends found in other countries. While young adults’ reasons for not being licensed, or for delaying licensure are likely to be varied, declines in licensing rates have the potential, in broad government and industry policy circles, to affect future transportation needs, choice of non-driving transport mode (i.e. cycling, walking and public transport), vehicle purchases, and may bring road safety and environmental consequences. The study paid particular attention to the road safety implications of changing travel mode preferences among young adults.
In terms of study scope, it needs to be appreciated that efforts to quantify non-licensed young adults will yield understated extents of non-driving in this age group. It is entirely feasible for adults to have a driving licence without a current intention to drive a vehicle. However, quantification of 18-30 year olds who have a driver’s licence but do not drive was outside the scope of this study.
Young adult licensing trends and travel modes 1
Introduction1

RACV Research Report 15/012
Additionally, not obtaining a licence is linked with the issue of unlicensed driving. Because the intention of unlicensed drivers is to not obtain or hold a valid licence but still drive despite that, the issue of unlicensed driving was not included in the study.
The project proceeded using three distinct approaches but in complementary fashion: a review of relevant literature, identification of any age-related trend(s) in population-based driver licensing rates in Victoria and a short survey of Australians aged 18-30 focussing on reasons for not having a driver’s licence.
Approval to conduct the study was granted by the University of Adelaide’s Human Research Ethics Committee to analyse licensing data and conduct the survey.
2.1 Literature reviewThe search for literature was conducted using the following terms and databases: TRID, Australian Transport Index (ATRI), Informit Online, ScienceDirect, PsychINFO, PubMed and Academic OneFile, and using the keywords: drivers licence, graduated licensing system, learners permit, young driver, young person, travel mode, driver behaviour, road safety, travel behaviour, licence rate, socio economic factors, geography, public transport, vehicle ownership, income / financial, Millennials / Generation Y, Generation Z.
As literature indicating declining trends in driver licensing among young people has begun to emerge only relatively recently, the literature search period was largely limited to the period covering 2009 to the time of preparing this report.
2.2 Population-based licensing rates in VictoriaThe Centre for Automotive Safety Research (CASR) requested the driver licensing department in VicRoads to supply the total number of licensed drivers (Probationary & Full combined) for each age or age group: 18, 19, 20, 21, 22, 23, 24, 25-29, 30-34, 35 39, 40-44, 45-49, 50-54, 55-59, 60-64, 65-69, 70+, as close as possible to the 30 June in each of the years from 2001 to 2014. These ages and age groups were those used by Sivak and Schoettle (2012a) and therefore afforded comparison with the 15 countries they studied. The 30 June date is the date used by the Australian Bureau of Statistics (ABS) in its annual estimates of the population in each jurisdiction by age and sex.
The driver licence numbers by age were tabulated alongside respective ABS population data for each age or age group, and the percentage of licensed drivers per population then calculated for each age category for each of the years 2001-20141. These percentages were then examined to ascertain any trends over time in driver licensing rates, particularly for ages 18 to 24. Additionally, the data were examined for any apparent trends among the remaining driver ages, to determine if any change in young driver licensing rates is reflected in, or is different to, any change found among other driver ages.
While this approach was chosen to afford direct comparisons with Sivak and Schoettle’s (2012a) findings, Raimond and Milthorpe (2010) provided a cautionary note for such an approach. They commented that there are some risks in relying on licensing data sources and population data sources being strictly comparable, particularly given there may have been changes in the quality of licence data or in the definition of who is counted in population estimates. Raimond and Milthorpe (2010) sought corroborating evidence in the form of licensing trends from the Sydney Household Travel Survey, while Delbosc and Currie (2014) relied on Victorian travel survey data to strengthen their findings. In the present study, comparisons were made with the trends found in the work of Delbosc and Currie (2014) based on VicRoads licensing data and travel surveys.
CASR also requested data for each year 2011-2014 inclusive concerning the numbers of motorcycle (BIKE class) only licences held, as well as numbers of motorcycle endorsements to car licences, with both data sets broken down by age. It was anticipated breaking the data down by licence type would afford identification of any changes in preferences among young Victorian adults for motorcycling as a mode of transport.
Young adult licensing trends and travel modes 3
Methodology2
1 As 2014 ABS population data were not available at the time of writing the report, population numbers for 2013 were used in calculating licensing percentages for 2014 (ABS, 2013).
RACV Research Report 15/014
2.3 Survey of young AustraliansThe survey was conducted during February-March 2015 with Australians aged 18-30 who self-identified that they do not currently have a driver’s licence or drive. The survey (see Appendix B) was relatively short, containing eight questions, beginning with a necessary confirmation of the participant’s licence status. The remaining questions asked about age, gender and postcode, main and secondary reasons for not having a licence (if this is the case), any plans to become licensed and current main mode of travel. Two questions about main and secondary reasons for non-licensure provided several answer options and the option order was randomised between the two questions and for each new participant.
For purposes of comparison, the survey was modelled on the questionnaire used by Schoettle and Sivak (2013) who provided permission to use the modified form of the survey in the present study. Approval to conduct the survey was also sought from, and granted by, the University of Adelaide’s Human Research Ethics Committee. This approval was contingent on the survey being prefaced with a Participant Information Sheet and a Consent Form (see Appendix B).
The survey was conducted with the assistance of SurveyMonkey, an online business providing assistance in designing and implementing online surveys. Many of the survey’s respondents were recruited by SurveyMonkey using their Australian resident audience pool. These respondents received no remuneration for participating in the survey apart from an offer for their name to be included in a SurveyMonkey lottery where they could win a small prize and/or know that a small donation by SurveyMonkey was made to a charity for each complete survey response. A weblink to the survey was also promoted by RACV among its young adult members via electronic newsletter and social media.
While conducting online surveys was considered to be the most appropriate way of seeking young people’s views surrounding their non-licensure or not driving, it was acknowledged that online surveys, by their nature, can exclude participation by people without internet access. However, given that young adults are highly likely to be familiar with and have access to communications technologies (Dutzik, Masen & Baxandall, 2013), such as through educational institutions, work places and public libraries, this was not considered to be a serious study limitation.
The literature review focussed on three key aspects surrounding apparent changes in young adults’ travel mode choices:
• current trends in travel mode choice among young adults
• the reasons young people give for not getting or for delaying obtaining a driver’s licence
• the broader implications of reported licensing trends and range of reasons given, particularly for road safety.
As well, previous studies of young driver licensing rates yielded information on the methodological approaches used in those studies, which in turn informed consideration of suitable approaches for the present study, as described in Section 4.
3.1 Current trends in travel mode choice among young adultsAn emergent but substantial body of literature was found attesting to changes in travel mode choice among young adults (particularly those aged 18-30). This is indicated, not just by declining preferences for car use, but by a greater inclination to use alternative transport modes, either exclusively or as a complement to car travel. Much of this literature was written from perspectives such as urban planning and ride-sharing advocacy ranging through to the car manufacturing industry, but also with respect to recent sociological trends. Changing travel mode choice among young adults is also indicated by declines in the proportions of young adults obtaining driver’s licences.
3.1.1 Declining preference for car useA recent OECD study (van Dender & Clever, 2013) found that declining preference for car use (as measured by passenger-kilometres) is evident in several industrialised countries. The authors attributed this trend to various broad level factors, including countries’ transport policies affecting car use, market prices for cars, population changes such as ageing and saturation of access to cars. It has also been suggested that a current trend to de-emphasise purchase and consumption of materialistic goods may be normalising the notion of not owning a personal vehicle (Kronenberg, 2010).
Such broader factors are likely to ultimately affect a young person’s decisions about using cars, including obtaining a driver’s licence. Studies such as those by Thakuriah, Menchu and Tang (2010), Goodwin and van Dender (2013), Metz (2013) and Sivak (2014) have focussed on saturation levels among car sales to young adults. However, van der Waard, Immers and Jorritsma (2012) noted that one of the main contributors to car market saturation is the rise in car-sharing or pooling schemes, which may in turn also be a reflection of emerging attitudes towards car ownership. The ways such broader factors impact on an individual’s decision to obtain a driver’s licence or not is explored in more detail in section 3.2.3 of this report.
3.1.2 Increased use of alternative transport modesThere were strong indications in the literature of growing preferences for alternative travel modes over car travel. Coverage of these changes in the literature was either population-wide or specifically in relation to young adults. For the present study, the focus was on research literature concerning young people specifically.
Kuhnimhof, Armoogum, Buehler, Dargay, Denstadli and Yamamoto (2012a) reported that car availability as measured by household car ownership has decreased in Germany, France, Great Britain, Norway and the USA since 2000. Moreover, in most of these countries, average daily car travel distance has declined which, in France, Japan and the US, has led to reductions in total everyday travel by young adults. In Great Britain and Germany, declines in car travel appear to be compensated for by increased use of alternative transport modes (Kuhnimhof et al., 2012a). Also in this direction, van Dender and Clever (2013) commented that there is increasing diversity in travel mode choice among car users generally, including signs that car use is less of a priority in those preferring urban life-styles and who are more reliant on online networks.
Sigurðardóttir, Kaplan and Møller (2014a) conducted a detailed study of such trends in Denmark. Using 1995-2012 data, they found women in their 20s have become less likely than men in that age group to have a driver’s licence, though there was no gender gap by age 30. However, while young men and women both increased their number
Young adult licensing trends and travel modes 5
Literature review3
RACV Research Report 15/016
of car trips as they got older, women overall tended to make greater numbers of trips, but for shorter distances. Moreover, whereas young men were becoming more likely in recent years to be driving ‘mandatory’ trips such as travel to work, young women were becoming more likely to be driving others around.
A study in Germany, (Kuhnimhof, Buehler, Wirtz & Kalinowska, 2012b) reported that not only has car use among 18-29 year olds decreased since 2000, but those drivers were becoming increasingly more likely to use alternative transport modes, particularly cycling and public transport, in addition to their driving. The authors also argued that reduced need for a car may be driven by transport policies that actively discourage car use, such as the congestion charges found in central London and Singapore, but also the availability of low-cost air-fares and high-speed rail travel (Kuhminhof et al., 2012a).
In Canada, Marzoughi, (2011) found a 10% decrease in the proportion of 16-19 year olds with driver’s licences in Toronto since the 1990s, which the author suggested may be related to the attractiveness of public transport passes and their associated usage in the city. Greater use of public transport by young adults has also been noted in Montreal, although this was largely attributed to the introduction of a GLS in 1997 (Grimsrud & El-Geneidy, 2013, 2014), in which many young drivers effectively bypassed GLS restrictions through using public transport.
A major US national survey of 11,842 respondents found that people under 30 were far more likely than other age groups to choose public transport for their travel needs. While most of this group live in relatively dense neighbourhoods where high-quality public transport is readily available, they were more likely to express positive feelings about using public transport. Moreover, among the most important factors for them in choosing public transport compared to other travel modes were shorter travel times, reliability and being able to use technological equipment such as laptop computers on their journeys (TransitCenter, 2014).
In the UK, Asad (2013) compared data from the UK Trip Rate and Information Computer System, the Scottish Household Survey and a Manchester travel survey with respect to those living in central urban locations compared with outer urban areas. It was found that household members in central locations walked more for commuting, shopping and leisure, and drove less. These people tended to be young adults with high education levels and living in modern housing, typically as single person households or as couples. However, Delbosc and Currie (2013a) rightly query the direction of the cause and effect relationship here: Do young people prefer to not get a licence because they choose alternative transport modes and/or live in accessible areas? Or do they choose not to get a licence first, then realise this means they need to use alternative transport and live in accessible areas? It is plausible that both causal directions exist in practice, perhaps the former more so than the latter.
3.1.3 Declining licensing rates among young adultsThe Sivak and Schoettle (2012a) study found declines in young driver licensing in eight industrialised countries (although Australia was not included in this study). In addition, there was a similar study by Kuhnimhof et al., (2012a), which found that, in Great Britain, Japan, Norway and the US, driver licensing rates among young adults have decreased since 2000, and particularly among men. For example, Kuhnimhof et al. (2012a) reported that, in the US, which experienced the most dramatic drops out of all those countries, between 1995 and 2010 the proportions of those with licences and aged under 20 dropped from 65% to 45%. For Americans aged 20-29, the proportions dropped from 91% to 82%. For American males under age 20, the rates dropped from 65% in 1995 to 45% in 2010; for males aged 20-29, the rates dropped from 93% to 81% over the same timeframe. Clearly, in the US, the sharpest drops in licensing occurred for those aged under 20, particularly for males. In Britain, Berrington and Mikolai (2014) reported that the proportion of 17-20 year olds holding a full UK driving licence peaked in the mid 1990s, then declined towards 2004 but has tended to level off since.
Trends in young driver licensing rates in Australia have been examined recently but mainly from transport planning perspectives. Based on VicRoads data, Delbosc and Currie (2014) reported that the proportion of licence holders among ages up to 30 in Victoria dropped from 85% in 2000 to 73% in 2010, and noted this represented a rate drop of 1% per year. By contrast, the licence holder proportions for ages 31 to 64 were steadily maintained at approximately 95% across the same period. However, for ages 65 and over, the licensing rate rose from 67% in 2000 to 73% in 2010. Delbosc and Currie (2014) found that similar patterns emerged when they examined data from the Victorian Integrated Survey of Travel and Activity (VISTA) (formerly the Victorian Activity Travel Survey), which indicated that these patterns are consistent across different sources of data.
For New South Wales, Raimond and Milthorpe (2010) reported Road Traffic Authority (RTA) statistics for 1998 to 2009 showing that applications for learner’s permits at age 16 were at a consistently high level across this period, but that around 2010 the permits were not being converted into licences to the same extent that they were a decade ago. For example, in 1998, 84% of 25 year olds in NSW held a licence, but that had fallen to 74% by 2009, with the greatest drop occurring in the Sydney region. By contrast, licence holding among those aged 65 had increased from 76% to 87%.
Young adult licensing trends and travel modes 7
Other recent work exploring declines in licensing rates, although in relation to different factors, includes Goodwin and van Dender (2013) and Kuhnimhof, Zumkeller and Chlond (2013), both in relation to car purchase and use; Metz (2013) on implications for transport planning, and Curry, Pfeiffer, Durbin, Elliott and Kim, (2014, 2015) in relation to socio-economic factors. For example, not unexpectedly, Curry et al. (2014) found that 17 year olds living in high-income localities in New Jersey (NJ) were five times more likely to have acquired a licence than those in the lowest income NJ localities. However, whatever the reasons for these licensing declines, it is important to bear in mind Sivak and Schoettle’s (2012a) finding that some countries (such as Finland, The Netherlands, Spain and Switzerland) have experienced increased licensing across all adult age groups. Aretun and Nordbakke (2014) believe that this trend may be fuelled, in part at least, by increases in the numbers of women, and older women particularly, who are obtaining driver’s licences.
However, Delbosc and Currie (2013a) noted that in several of the countries with increased licensure studied by Sivak and Schoettle (2012a) and Kuhnimof et al. (2013a), licensing rates were originally quite low when compared to those countries that experienced licensing declines. This would tend to make the increased licensing experienced by those countries appear all the more dramatic. Also, they noted that only two survey years of data were available in many countries reporting increased licensing rates (in some cases 20 years apart). Delbosc and Currie (2013a) suggested that, in those countries, licensing rates may have peaked in the 1990s, as in many countries, and then declined, although not to levels below those in the 1980s.
3.2 Reasons for not having a driver’s licenceYoung adults can have a wide range of reasons for not having a driver’s licence. In their work on declining licensing trends among Swedish young adults, Aretun and Nordbakke (2014) pointed out the importance of distinguishing between two broad types of reasoning. One type relates to low needs for holding a licence, or absence of need to hold a licence, which may be influenced by a young adult’s interest in and perceptions about driving, the licensing process and availability of alternative transport modes. The other type of reason concerns opportunity ― the degree to which getting a licence is possible or feasible (for example, the effect of financial restraint on feasibility of getting a licence).
The common reasons for not holding a licence found by Schoettle and Sivak (2013) cover both needs and opportunities. The reasons relating to needs were respondents’ environmental concerns, communication needs being met online and preferences for alternative transport modes. Opportunity-related reasons were ‘too busy to get a licence’, costs and medical issues. It seems that economic aspects constitute a key factor in whether a young person obtains a driver’s licence. In addition to the modelling work mentioned by Aretun and Nordbakke (2014), a US national survey of 18 year olds (Williams, 2011) reported that the most important reason for not being licensed was ‘no car available’, which might be an indirect measure of financial circumstances (although ‘no car available’ might also mean the household does not allow its 18 year olds to obtain a licence just yet). Nonetheless, Schoettle and Sivak (2013) noted that in their sample young adults without a licence tended to have less education and higher unemployment. Other prominent reasons reflecting opportunity factors were costs generally, parent availability (for supervised learner driving) and being otherwise busy.
It is important to recognise that young people who do not have a driver’s licence (whether due to needs or lack of opportunity) do not necessarily view this circumstance in a pejorative fashion. A small scale study found that New Zealander non-drivers aged 16-24 did not necessarily dislike the notion of driving, but rather that they considered active travel modes and public transport options suited them better. Moreover, they were all happy with their travel choices (Ward, Baggett, Orsini, Angelo & Weiss, 2014). Interestingly, the study sample was composed of Maori, Pacific Islander and Asian young non-drivers, the age and ethnic groups in New Zealand most likely to experience road trauma.
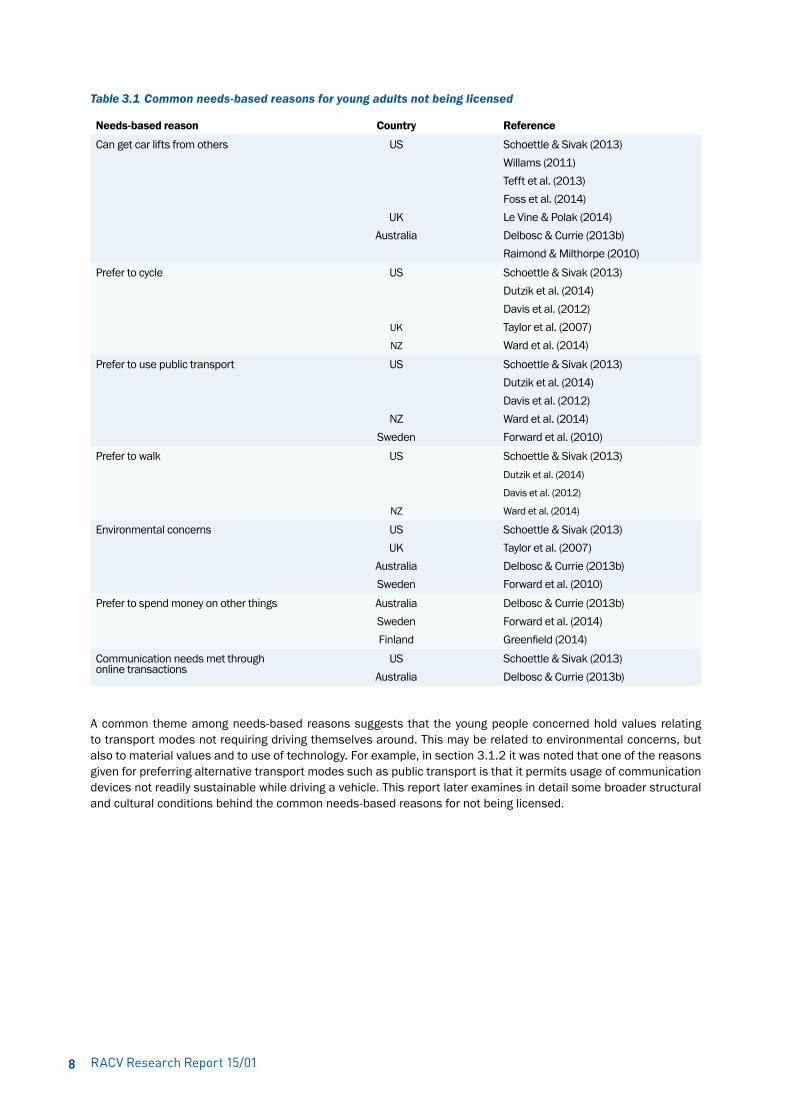
3.2.1 Needs-based reasonsSeveral researchers have identified numerous needs-based reasons for not having a driver’s licence. A summary of studies identifying various needs-based reasons is provided in Table 3.1.
RACV Research Report 15/018
Table 3.1 Common needs-based reasons for young adults not being licensed
Needs-based reason Country Reference
Can get car lifts from others US
UKAustralia
Schoettle & Sivak (2013)Willams (2011) Tefft et al. (2013)Foss et al. (2014)Le Vine & Polak (2014)Delbosc & Currie (2013b)Raimond & Milthorpe (2010)
Prefer to cycle US
UK
NZ
Schoettle & Sivak (2013)Dutzik et al. (2014)Davis et al. (2012)Taylor et al. (2007)Ward et al. (2014)
Prefer to use public transport US
NZSweden
Schoettle & Sivak (2013)Dutzik et al. (2014)Davis et al. (2012)Ward et al. (2014)Forward et al. (2010)
Prefer to walk US
NZ
Schoettle & Sivak (2013)Dutzik et al. (2014)
Davis et al. (2012)
Ward et al. (2014)
Environmental concerns USUK
AustraliaSweden
Schoettle & Sivak (2013)Taylor et al. (2007)Delbosc & Currie (2013b)Forward et al. (2010)
Prefer to spend money on other things AustraliaSwedenFinland
Delbosc & Currie (2013b)Forward et al. (2014)Greenfield (2014)
Communication needs met through online transactions
USAustralia
Schoettle & Sivak (2013)Delbosc & Currie (2013b)
A common theme among needs-based reasons suggests that the young people concerned hold values relating to transport modes not requiring driving themselves around. This may be related to environmental concerns, but also to material values and to use of technology. For example, in section 3.1.2 it was noted that one of the reasons given for preferring alternative transport modes such as public transport is that it permits usage of communication devices not readily sustainable while driving a vehicle. This report later examines in detail some broader structural and cultural conditions behind the common needs-based reasons for not being licensed.
Young adult licensing trends and travel modes 9
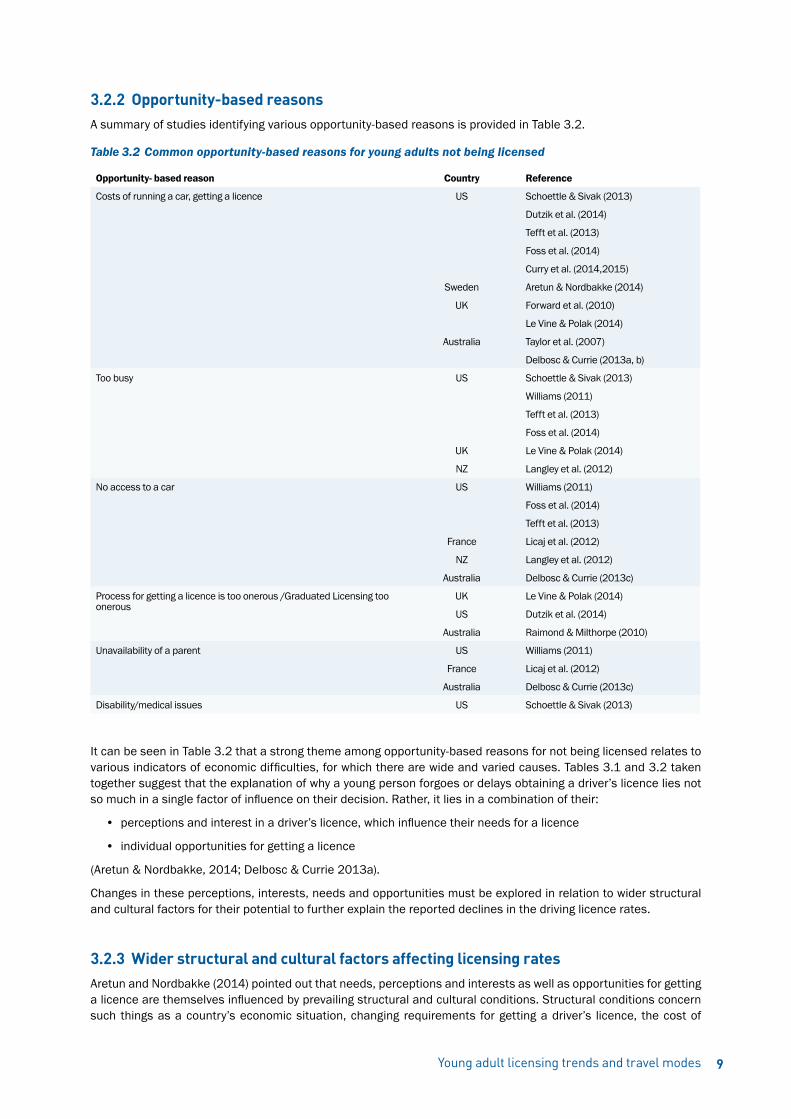
3.2.2 Opportunity-based reasonsA summary of studies identifying various opportunity-based reasons is provided in Table 3.2.
Table 3.2 Common opportunity-based reasons for young adults not being licensed
Opportunity- based reason Country Reference
Costs of running a car, getting a licence US
Sweden
UK
Australia
Schoettle & Sivak (2013)
Dutzik et al. (2014)
Tefft et al. (2013)
Foss et al. (2014)
Curry et al. (2014,2015)
Aretun & Nordbakke (2014)
Forward et al. (2010)
Le Vine & Polak (2014)
Taylor et al. (2007)
Delbosc & Currie (2013a, b)
Too busy US
UK
NZ
Schoettle & Sivak (2013)
Williams (2011)
Tefft et al. (2013)
Foss et al. (2014)
Le Vine & Polak (2014)
Langley et al. (2012)
No access to a car US
France
NZ
Australia
Williams (2011)
Foss et al. (2014)
Tefft et al. (2013)
Licaj et al. (2012)
Langley et al. (2012)
Delbosc & Currie (2013c)
Process for getting a licence is too onerous /Graduated Licensing too onerous
UK
US
Australia
Le Vine & Polak (2014)
Dutzik et al. (2014)
Raimond & Milthorpe (2010)
Unavailability of a parent US
France
Australia
Williams (2011)
Licaj et al. (2012)
Delbosc & Currie (2013c)
Disability/medical issues US Schoettle & Sivak (2013)
It can be seen in Table 3.2 that a strong theme among opportunity-based reasons for not being licensed relates to various indicators of economic difficulties, for which there are wide and varied causes. Tables 3.1 and 3.2 taken together suggest that the explanation of why a young person forgoes or delays obtaining a driver’s licence lies not so much in a single factor of influence on their decision. Rather, it lies in a combination of their:
• perceptions and interest in a driver’s licence, which influence their needs for a licence
• individual opportunities for getting a licence
(Aretun & Nordbakke, 2014; Delbosc & Currie 2013a).
Changes in these perceptions, interests, needs and opportunities must be explored in relation to wider structural and cultural factors for their potential to further explain the reported declines in the driving licence rates.
3.2.3 Wider structural and cultural factors affecting licensing ratesAretun and Nordbakke (2014) pointed out that needs, perceptions and interests as well as opportunities for getting a licence are themselves influenced by prevailing structural and cultural conditions. Structural conditions concern such things as a country’s economic situation, changing requirements for getting a driver’s licence, the cost of
RACV Research Report 15/0110
running a vehicle and the availability of public transport. Statistical modelling has shown that, in Sweden at least, such economic aspects are related to the reported decline in driver licensing (Aretun & Nordbakke, 2014).
Cultural conditions relate to people’s lack of motives for getting a licence that stem from generational or other broad changes in values, attitudes and lifestyles, but also from structural conditions, typically economic circumstances. This includes young adults tending to live with their parents rather than independently, preferences for urbanised living, and the increased use of information and communications technologies (Aretun & Nordbakke, 2014). Structural and cultural conditions tend to overlap, especially when the broader transport policy implications of changes in licensing rates are explored. Referring to them as structural and cultural conditions in a collective sense affords comprehensiveness when considering their combined effects on licensing rates.
By contrast, other attempts at categorising the range of factors affecting licensing rates tend to be more specific than Aretun and Norbakke (2014), but are not as comprehensive. For example, Hopkins and Stephenson (2014) identified seven ‘clusters of explanations’ for changing mobility patterns among young adults: individual, social, built environment, natural environment, economic, legal/policy and technological factors. However, there are various other broad factors, such as those that are characteristic of the Millennials ― today’s generation of young adults, which do not easily fit into that categorisation.
The present literature review identified four key areas of structural and cultural conditions likely to be affecting licensing rates: generational factors, changing socio-economic circumstances, graduated licensing schemes, and changing information and communications technology options. A fifth area, environmental concerns, appears to be not as influential as commonly surmised. It is important to explore these wider societal trends and conditions because Delbosc and Currie (2014) considered the literature to date has rarely delved into them.
Generational factorsThe so called ‘Millennials’ generation, or ‘Generation Y’ (adults born between 1980 and 2000) constitutes the most populous of all current generations in both the US and Australia (Delbosc & Currie, 2013a). A subtheme was found in the literature that, unlike previous generations, Millennials are not merely avoiding or delaying getting driver’s licences but are intentionally snubbing car ownership and car use. This trend is often reported in popular media and empirical research into the topic is only just being formally published. For example, Tuttle (2012, 2013) noted American car industry marketing research suggesting that Millennials are far more interested in buying new iPhones than new cars. The latest iPhones and iPads are the Millennials’ status symbols, with cars being valued for their utilitarian value rather than prestige (Schweiterman, 2011; Thompson & Weissmann, 2012). Americans aged 18-34 accounted for 30% fewer new cars purchased than this age group did in 2007, although the car industry considers that this is more due to new cars being too expensive for this age group than any different values held by this generation (Tuttle, 2013).
Such findings mirror recent large scale empirical research only just being published. In America, Dutzik, Inglis and Baxandall (2014) reported a continuing shift away from cars for commuting among Millennials, in conjunction with their consistently increasing preferences for alternative transport modes. Between 2001 and 2009, average driving distances among 16-34 year olds dropped by 23% as a result of their taking fewer driving trips and shorter trips, although this is part of a general trend among Americans (Dutzik et al., 2014; US Department of Transportation, 2015). Earlier British research also reports declining numbers of driving trips and shorter overall driving distances among young adults (Taylor, Bernard, White & Lewis, 2007).
However, as with any stereotyping of generational cohorts, the Millennials are not a homogeneous group. Sigurðardóttir, Kaplan and Møller (2014b, 2014c) ran semi-structured interviews with 50 Danish teenagers and found they tended to be subdivided along market adoption lines with respect to car use and licensing intentions. About a fifth (20%) of the group were highly motivated about using cars and intended to be licensed as soon as possible. The bulk (just over two-thirds, or 70%) were as keen about car use but pragmatically realised that obtaining a licence and running a car are costly, such that they considered them to be longer term goals. The remaining group (about two-fifths, or 40%) tended to comprise those who were content to delay both car use and licensure, or who were disinterested in either as life-goals. This group tended to have low motivation for owning or using a car as adults. Among other attributes, they were unfamiliar with car brands and imagery, and tended to cycle or use public transport regularly as a matter of preference. Interestingly, this group also tended to belong to families with prevailing pro-cycling or non-car use beliefs and practices, and participated in social networks with similar interests (Sigurðardóttir et al., 2014b, 2014c).
Similarly, in the United Kingdom, Taylor et al. (2007) identified five subgroups among their young adult research subjects: those who mainly drive cars and have limited use of other transport modes; those who drive but make more use of other modes; those who use a limited range of public transport; those who use mainly public transport; and those who mainly walk. In Australia, Delbosc and Currie (2013d) argued that, while many youth do not see cars as status symbols, equally, there are youth sub-cultures who place a great deal of social status on owning,
Young adult licensing trends and travel modes 11
modifying and showing off cars.
While many of the above generational factors are characteristic of reduced need for car use and being licensed, some generational factors reflect reduced opportunities from delayed transition to an adult lifestyle. Delayed transition to adulthood is considered a multi-faceted phenomenon, some of it arising simply from socio-economic circumstances as discussed below. However, Berrington and Mikolai (2014) and Delbosc and Currie, (2013a), among others, have also identified longer periods at school and tertiary study delaying the transition to work, plus deferred gaining of residential independence from parents and in starting a family as likely to be influential on the decision as to when or whether to become licensed to drive.
Changing socio-economic circumstancesEarlier, it was noted that while young Americans are driving less and for shorter overall distances, this is part of a broader population trend in the western world (Kuhnimhof et al., 2012a). Delbosc and Currie (2014) found an association in both Australia and overseas between low licensing rates among young adults and part-time work and studying. Dutzik et al. (2014) noted that reduced driving exposure has been reported over the past decade for both unemployed and employed youth, as well as among young people in households of various income levels. However they also noted that the Millennials generation have not experienced consistently cheap petrol prices compared to previous generations, and the current consistently high cost of fuel may be encouraging the Millennials to make transport and housing choices that require little or no driving (see also Kunimhof et al., 2012a). In Britain, Taylor et al. (2007) considered that young adults’ life transitions such as leaving home and movement into employment are happening later than they previously did, which may help explain observed decreases in their mobility.
While a family’s socio-economic circumstances are highly likely to influence whether a household has access to a car or not, or more than one vehicle, they are not the only determinant. In noting that as population density increases, the number of motor vehicles per household decreases. Strang and Mead (2013) reported that in the inner suburbs of Sydney, the number of households with two or more vehicles declined between 2001 and 2011 at the same time as the number of households with cars increased. However, the trend was not evident in Melbourne, where property prices and population density are not as high.
Some American researchers, such as Davis, Dutzik and Baxandall (2012) and Curry et al. (2014, 2015), have attributed licensing declines to recession in the global financial market and various socio-economic factors generally. However, Dutzik et al. (2014) now consider that there was evidence of licences declining in America before the last recession set in. Moreover, while socio-economic factors such as race/ethnicity and household income are influential on adult travel behaviour, they are not significantly influential for teenagers today (Taylor, Ralph, Blumenberg & Smart, 2013).
Graduated driver licensing schemesSeveral studies have commented on how tougher restrictions on driving exposure required under some Graduated Licensing Schemes (GLS), and the difficulty of qualifying for a licence under a GLS, have influenced decisions to delay or not obtain a driver’s licence (e.g. Masten, Foss and Marshall (2011) and Dutzik et al. (2014)). Raimond and Milthorpe (2010) noted that, in New South Wales, an increasing number of young people are not converting learner’s permits to provisional licences, possibly because of the requirement for 120 hours of supervised driving. A similar trend may be occurring in Queensland (RACQ, 2014), which has a requirement of 100 supervised hours. However, while GLS schemes may have contributed to licensing decline in NSW, a pattern of decline was evident before NSW’s GLS became tougher (Raimond & Milthorpe, 2010).
In the US, common reasons among teenagers for not having a licence included “licensing requirement is a hassle” and “parents too busy to supervise driving” (Williams, 2011). Blumenberg, Wander, Taylor and Smart (2013) noted that US states with the toughest GLS provisions tended to be those states with proportionally fewer young adults holding driver’s licences, and that these people were also more likely to be using alternative transport modes. While Curry et al. (2014) believe their findings support the view that teenagers delay getting licensed primarily for economic reasons rather than toughness of a GLS, they cite Tefft, Williams and Grabowski’s (2013) finding that substantial proportions of American teenagers may be obtaining licences outside their state’s GLS. Neither Tefft et al. (2013) nor Curry et al. (2014) discussed this further, although it is plausible that those teenagers could be simply delaying licensure until they are old enough to obtain a licence with minimal, if any, GLS restrictions, or that they may obtain a licence in another state with less rigorous GLS restrictions. Simply delaying licensure seems the more likely explanation. However, Foss, Masten and Masten (2014) reported that at least 36% of American teenagers do not become licensed until a year after or beyond their state’s minimum licensing age, thereby missing out on the relevant GLS protections.
RACV Research Report 15/0112
Changing information and communications technology optionsUse of information and communications technologies has increased substantially since 2001 (Blumenberg et al., 2013), particularly with the proliferation in use of smartphones and social media. Young adults have been the earliest and most enthusiastic adopters of these new technologies and social networking tools (Dutzik et al., 2013).
Many young (and older) adults without driver’s licences, or who have reduced their driving, prefer alternative transport modes such as public transport because it permits use of communication devices in ways not possible while driving a vehicle (Davis et al., 2012; Blumenberg et al., 2013; Delbosc & Currie, 2013b; TransitCenter, 2014). This includes social networking, playing video games, and watching downloaded films (Schweiterman, 2011), also online shopping, internet banking, e conferencing and teleworking (van der Waard et al., 2012; US Department of Transportation, 2015). Many countries with GLS systems specifically ban young drivers from using mobile phones while driving, thus providing a reason to prefer transport modes where such devices can be used easily and legally while travelling.
The preference for alternative transport may also be encouraged by the creation of new technology-enabled transport services such as phone apps for bicycle sharing, car-pooling and providing real-time updates of public transport arrival and departure times (Schweiterman, 2011; Dutzik et al., 2013, 2014). Bicycle and car sharing schemes, both private and commercial such as Uber, have been linked to reductions in personal driving and car ownership (Dutzik et al., 2013, 2014; US Department of Transportation, 2015). A City of Sydney Council survey found suggestions that members of local car-share schemes were deferring any plans for car purchase (Strang & Mead, 2013). Declining use of private cars in Helsinki has led to the creation of a smart phone app that permits users to plan a journey across the city that informs the user of the pros and cons of taking the planned journey by public transport, by a car-sharing facility or by bicycle hire, with the app also affording a booking and payment facility for the chosen option (Greenfield, 2014).
More generally, in their explorations of reasons given by non-licensed young people, Sivak and Schoettle (2012a) considered there is a connection between a country’s internet penetration rate and youth licensing. For example, Williams (2011) reported that up to 10% of US teenagers said they did not have a licence because e-communications enable them to keep in touch with friends. However, Delbosc and Currie (2013d) noted an alternative explanation ― that some young people may prioritise buying smart phones and iPads over paying for petrol and car insurance. In fact, two-thirds of young American adults prefer having an internet connection to having a car of their own (CISCO, 2011 cited in van der Waard et al., 2012).
Nonetheless, Delbosc and Currie’s (2013a) overall conclusion is that, while the new information and communications technology options may contribute to licensing decline, they do not do so to an overly great extent. In particular, they noted that if the ubiquitous use of such options was actually reducing the need to travel, then declines would be evident across all travel mode choices. Similarly, Blumenberg, Taylor, Smart, Ralph, Wander and Brumbaugh (2012) found that use of information and communication technologies is more often a complement to than a substitute for travel (see also Taylor et al., 2013).
Environmental concernsWhile Table 3.1 suggests that environmental concerns have influenced licensing rates in the US, UK, Sweden and Australia, Delbosc and Currie (2013a, 2013b), after they reviewed this evidence, concluded that environmental concerns do not constitute a significant influence. This is consistent with an earlier finding from these researchers that environmental issues were not at the forefront of young people’s minds and many youth in their study downplayed the possible impact of their travel on the environment (Delbosc & Currie, 2012). (Nonetheless, Delbosc and Currie (2013d) maintained that there are still likely to be some young people who make conscious travel choices based on their environmental attitudes.)
Similar findings emerged from the discussion group studies of British teenagers by Line, Chatterjee and Lyons (2010, 2012) who found that while the participants were aware of climate change issues, they exhibited poor understanding of the link between transport choice and climate change. In fact they expressed a preference for car use due to the speed, freedom and positive image they believed it would provide them with, even though they recognised the environmental impacts of personal car use. Moreover, like Delbosc and Currie’s (2012) study in Australia, the teenagers in Line et al. (2010, 2012) claimed their current environmentally friendly travel behaviours such as cycling and walking were not influenced by climate change issues. Also in Britain, Taylor et al. (2007) reported that concern for the environment did not seem to be considered by young people when they made transport decisions. In their focus group study, environmental issues were ranked below concerns such as personal convenience when choosing how to travel.

Young adult licensing trends and travel modes 13
3.3 The broader implicationsIf the Millennials generation, as they age, come to drive less than previous generations, and if future generations continue with this trend, this will undoubtedly bring some benefits. These include reduced traffic congestion, less air pollution, and fewer road deaths and injuries (Dutzik et al., 2014). However, there are also potential negative consequences, such as reduced revenue from fuel taxes bringing reduced expenditure for highway construction and repair and, as the US Department of Transportation (2015) points out, it may also mean that, by driving less, we have adapted to living with an inadequate, congested transport system.
Much of the literature relevant to the topic of young adults’ choices of travel mode has been written from sociological and public transport planning perspectives exclusively, with any other broader implications considered only within the confines of those parameters. Very little focussed attention appears to have been paid to the potential road safety implications. Indeed, what little has been written from a road safety perspective tended to treat the road safety implications as a side issue, or of passing relevance, rather than as an issue deserving of detailed attention. Nonetheless, it is possible to study the sociological and transport planning implications indicated in the literature and infer road safety implications from these.
Sociological implicationsDelbosc and Currie (2013a) wrote that even as more becomes known about the causes of youth licensing declines, many important questions remain. Chief among these is the extent to which young people are forgoing a licence entirely and to what extent they may be delaying it until they have a sufficient need to drive. There is evidence that some young adults, as they age, choose to forgo a licence entirely (Delbosc and Currie, 2013a) and there is also evidence suggesting that if someone does not get a licence by the time they are aged in their 20s they are unlikely to ever get one (Raimond & Milthorpe, 2010). Kuhnimhof et al. (2012a, 2013), however, caution that it is too early to be sure whether the multi-transport mode characteristics of many Millennials will be maintained or whether they will become more private-car focussed as they age (for example, changing transport needs when young adults start a family (Taylor et al., 2007)).
Analyses by Delbosc and Currie (2013a, 2013b) found that while living independently, working full-time and marrying are statistically associated with having a driver’s licence, the long term picture is for young adults to become increasingly less likely to live independently, have full time work, or to marry until they are older. Moreover, for today’s young adults, owning a car may no longer be seen as the status symbol or rite of passage as it was for previous generations (Delbosc & Currie, 2013c). These trends are reflected in Delbosc and Currie’s (2013b) Melbourne travel survey, in which almost a half of young adults who did not have a licence said they did not plan to get one in the following year, a finding similar to a recent British survey (Stokes, 2012 in Delbosc & Currie, 2013b). This research, along with the findings of Sivak and Schoettle (2012a, 2012b) and Kuhnimhof et al. (2012a), points to a picture of continuing decline in licensing rates in future years among young adults.
As noted earlier, one of the reasons given by young adults who are not licensed to drive relates to a preference to use information technologies that obviate the need to be driving in order to communicate with others. The continuing rise in teleworking, or working online while geographically away from an employer (typically at one’s home), is a prime example of this preference. In 2008, the ABS found that a quarter of employed people had worked some if not all work hours at their home. A recent traffic demand management modelling study assumed that just 5% of the working population in Belgium engaged in teleworking; in other words they were not physically travelling to or from work (Pirdavani, Bellemans, Brijs, Kochan & Wets, 2014). While only some of this sample would have comprised young adults, it is among the young that teleworking is most evident. The study predicted that with just a 5% sample of teleworkers not physically travelling, there would be a national reduction of 3.15% in vehicle-kilometres travelled (Pirdavani et al., 2014). Clearly then, there would be substantial reductions in travel distances with proportions of teleworkers greater than 5%.
Transport planning implicationsWhile not totally characteristic of the Millennials generation, it seems there is a substantial proportion of young individuals who are disinterested in driving and/or in owning cars, at least in America (Dutzik et al., 2014), Britain (Taylor et al., 2007), Finland (Greenfield, 2014), Denmark (Sigurðardóttir et al., 2014b) and Australia (Delbosc & Currie, 2013b) and that this trend will continue if not increase over time. Dutzik et al. (2014) consider transport planners should now start factoring in this demographic trend by expanding safe access to an array of transport options, including public transport, cycling and walking. The research of Sigurðardóttir et al. (2014c) indicates young adults often show high willingness to alternate between using cars, bicycles and public transport. The benefits in terms of reduced road construction and maintenance costs, reduced congestion, reduced harmful emissions and deaths and injuries prevented mean that the planners should not merely accommodate the changed preference
RACV Research Report 15/0114
for less car-intensive lifestyles but through their planning actively encourage it (Taylor et al., 2007; Sigurðardóttir et al., 2014c). For example, the US Department of Transportation (2015) noted a survey finding from the American Planning Association that only 8% of the country’s Millennials would prefer to live in a car dependent suburb. In fact, the city of Denver has developed a community-supported strategy to build protected bicycle lanes in order to attract and retain young adults to live and work there as a means to promote local mobility and economic development.
In Australia, Richardson and Elaurant (2013) reported that inner city car use is declining, noting, for example, 2001 to 2011 ABS journey to work data showing that car use declined by up to 16% in inner Perth. Although work travel is typically only about 20% of all car travel, this implies similar trends of a reduction in car travel as a percentage of all travel (Richardson & Elaurant, 2013). When population growth is factored in, Richardson and Elaurant (2013) predicted public transport patronage will increase 3 to 4 fold in the next 20 to 40 years. This has substantial transport planning implications in terms of (i) developing integrated networks of trains, trams and buses; (ii) the priority given to public transport within general traffic, and (iii) park and ride facilities (for cars and bicycles) (Richardson & Elaurant, 2013).
As noted in section 3.1.2 of this report, greater use of public transport by young adults has been found in Montreal (Grimsrud & El-Geneidy, 2013, 2014). The authors argued their data suggest young adults’ preference towards using public transport will continue as they age. This implies a continuing trend of reduced car use for when the young people become older and experience mid-life stages such as education/work transitions. However, other studies in this area indicate a different pattern, with Sigurðardóttir et al. (2014a), for example, finding in Denmark an increased likelihood of car use as people get older. As noted earlier, Delbosc and Currie (2013a) suggested there may be a bi-directional cause and effect relationship with licensing and public transport use. Young adults who choose not to be licensed may find public transport a convenient alternative, despite potential for crowding at peak times. At the same time, improving public transport services may divert or delay the need for young adults to obtain a licence (Delbosc & Currie, 2013b).
Road safety implicationsAs mentioned, much of the literature relevant to young adults’ travel mode choices has focussed on the surrounding sociological and public transport planning factors with very little attention on the potential road safety implications. Nonetheless, these sociological and transport planning implications can inform consideration of the implications for road safety.
One of the sociological factors concerns the rise in teleworking leading to reduced total travel distances (Pirdavani et al., 2014). Associated with this is the growing preference for public transport because it facilitates use of laptop computers and smart phones, which are inappropriate to use while driving (Transit Center, 2014). If increasing numbers of young adults are choosing not to be licensed because, among a range of reasons relevant to them, they prefer online communications, clearly this will affect overall travel distances. Even allowing for the online preferences including both teleworking and informal/social forms of contact, the teleworking component alone has potential to bring substantial reductions in total travel distances. Pirdavani et al’s (2014) study predicted that with 5% of Belgium’s working population engaged in teleworking, the 3.15% reduction in total travel distances would bring road total crash reductions of 2.6%. Clearly, there would be substantial safety benefits if larger proportions of a population prefer teleworking and online social contact instead of driving (or even not physically travelling at all). This is particularly true if those proportions predominantly comprise young adults, as young adults are commonly overrepresented in crashes (George Institute, 2014).
Among those who prefer public transport to driving themselves, there is likely to be a range of reasons for this (including affording sustained use of electronic communication devices on public transport). If the full range of factors leads to overall increases in public transport patronage, road safety benefits can be expected to follow. Researchers, such as Grimsrud and El-Geneidy (2013, 2014) in Canada and Richardson and Elaurant (2013) in Australia, have predicted increased public transport use alongside declining car use. Public transport is one of the safest modes of travel compared with cars, for both local and interstate journeys (NSC, 2011; Savage, 2013; Moeinaddini, Asadi-Shekari, Sultan & Shah, 2015). Moreover, research in various countries, including Australia, indicates that crash rates are significantly reduced when per capita public transport vehicle kilometres increase (Litman, 2010). Consequently, if more Australians use public transport, either solely or as a complement to driving, the inevitable reduction in crashes will translate to a road safety benefit.
Another relevant sociological trend relates to the popularity of cycling. In Australia, in common with the USA and the UK, the level of cycling in transport is very low at around 1% of trips (Arnold, 2014). Nonetheless, based on ABS journey to work data, Strang and Mead (2013) reported that Sydney experienced a 44% increase in the number of people cycling to work between 2006 and 2011, alongside a reduction in trips by private car. Analysis of journey to work data by Richardson and Weaver (2013) showed that a recent modest increase in cycling in Perth was largely a result of
Young adult licensing trends and travel modes 15
more cycling in inner areas, where safe off-street facilities have been constructed. Reid and Adams (2011) considered that the best approach to improving cyclist safety is to reduce motorised traffic speeds in conjunction with segregated pathways. Nuworsoo, Cooper, Cushing and Jud (2012) reported that cycle track infrastructure such as cycle parking, route directness of the track, wide lanes for passing each other and traffic light phases for cyclists crossing a road are likely to increase usage of cycle tracks, thereby removing cyclists from regular roads and reducing the incidence of cycle/motor vehicle crashes. Increased usage of dedicated cycle tracks following such enhancement of facilities was also demonstrated in Portland, Oregon (Monsere, McNeil & Dill, 2012). In that study, cyclists liked the separation of road user types, with cyclists particularly reporting greater perceptions of safety, thus increasing their desire to use dedicated cycling facilities.
Cycling and walking as alternatives or part-journey alternatives to driving are currently encouraged in various public health campaigns and in the news media. Just as cycling can be made more attractive through improved facilities, so can the motivation to walk be increased. In fact, considering that cyclists and pedestrians are more exposed and vulnerable as road users, it would seem imperative that increases in walking be supported by safer and visually appealing pedestrian facilities, which vice versa, will also serve to increase walking (Richardson & Elaurant, 2013; Sigurðardóttir et al., 2014c). In particular, traffic signals with better information for pedestrians, mid-block pedestrian crossings, raised crossings and generally high-visibility crossings involving painted road markings minimise inappropriate perceptions between pedestrians and motorists and effectively reduce crashes involving pedestrians (Pulugurtha, Vasudevan, Nambisan & Dangeti 2012; Candappa, Stephan, Fotheringham, Lenné & Corben, 2014; US Department of Transportation, 2015). Other infrastructure improvements that serve to make walking and cycling safer as well as inviting, for example as adopted in Mackay, Queensland, include pathway lighting, secure bicycle parking, and better directional signage for safe walking and cycling routes (Mortimer, 2014).
GLS requirements are introduced on the basis of their proven effectiveness in many countries in reducing road crashes among young drivers and their passengers (Williams et al., 2012). However, there is some evidence that teenagers delay obtaining a licence to avoid tough GLS restrictions, or because the requirements for getting a licence are considered too onerous (e.g. Raimond & Milthorpe, 2010; RACQ, 2014). It is also likely that many instances of licensing delay are due to economic circumstances (Curry et al., 2014), and that low-income drivers may have higher rates of risky driving behaviours and crashes (Curry et al., 2014). However, a New Zealand study found that novice drivers who had delayed getting a licence were likely to be more mature and hence safer drivers when they did get a licence (Langley, Begg, Brookland, Samaranayaka, Jordan & Davie, 2012; see also Williams, 2011). Such thinking may be instrumental for several US states that have recently considered raising their minimum ages for licences. New Jersey now has the highest minimum licensing age in the US (17 years) and is the only American state to apply GLS requirements to 18-20 year old drivers (Curry et al., 2014).
For whatever reasons Australian teenagers may have for delaying licensure, more accurate estimates of the proportions who are doing so are needed to inform consideration of whether the GLS restrictions in some Australian jurisdictions ought to apply to novice drivers aged in their early twenties. In this regard, Victoria’s requirement of a four year term subject to the conditions of a Probationary licence is the longest such term nationally, extending to at least age 22 before an unrestricted (full) licence can be gained. There are studies underway in the USA on the crash reduction benefits of applying GLS conditions to 18-19 year olds (Williams et al., 2012).
There is one other road safety implication to bear in mind in relation to GLS systems. Despite the extent of the decline in licensing rates among young adults in Australia, young adults are nonetheless still likely to remain the high risk group of drivers they currently are (George Institute, 2014) and will continue to be over-represented in road crashes. Hence, there will be an ongoing need for GLS systems to protect young drivers.
In summary, the literature suggests that the road safety implications of the growing preferences among many young adults to be less car reliant and more willing to use alternative transport modes fall in the following main areas:
• Reduced road crashes, deaths and injuries involving young adults;
• A continuing need for GLS systems that protect young drivers as they accumulate experience into their 20s (as those who do drive will continue to be disproportionally represented in crashes);
• Provision of safe and appealing infrastructure that supports alternative transport, such as for public transport, but particularly for those who prefer to cycle and walk in view of their vulnerability as road users.
3.4 Conclusions from the literature reviewChanging travel mode choices among young adults are now evident in many western countries, broadly characterised by patterns of licensing decline along with increased preferences for alternative travel modes. It is not just that more young adults are choosing not to obtain a licence, but also that some are delaying obtaining a licence. Even
RACV Research Report 15/0116
among young adults who are licensed, many are substituting some of their driving with increased use of alternative travel modes.
The reasons given by young people for not getting a licence relate to both need for a licence and opportunities for getting a licence. Common needs-based reasons include that the young adults are able to get lifts from others; or that they prefer to cycle, walk or use public transport. Common opportunity-based reasons concern the costs involved in running a car or in obtaining a licence; the young adults have no access to a car; or they are too busy to get a licence.
There are many inter-linked factors influencing young adults’ travel mode choices, including:
• transport planning policies, economic circumstances and market forces restricting access to and usage of cars;
• a delayed transition from teenage to adult lifestyles;
• increased use of car-sharing schemes and;
• a devaluing of car ownership and car use as a lifestyle characteristic.
Also, along with increasing commonality of teleworking, public transport is becoming an increasingly more attractive travel choice due to convenience, shorter travel times and the fact that it allows sustained use of technological equipment such as smartphones and laptops.
The broad implications of these trends include benefits such as reduced traffic congestion, less air pollution, and fewer road deaths and injuries, but also potentially negative consequences such as reduced revenue from fuel taxes. The implications also extend to a continuing need for GLS systems that protect young drivers and a continuing or increased need for safe and appealing infrastructure that supports alternative transport modes. Nonetheless, although recent literature is providing more information about the causes of youth licensing decline, important questions remain, such as the extent to which young people are forgoing a licence entirely and to what extent they may be delaying it until they have a sufficient need to drive. Moreover, much of the relevant literature has been written largely from sociological and public transport planning perspectives, with very little focussed attention paid to the potential road safety implications. The present study is aimed at helping to reduce that knowledge gap.
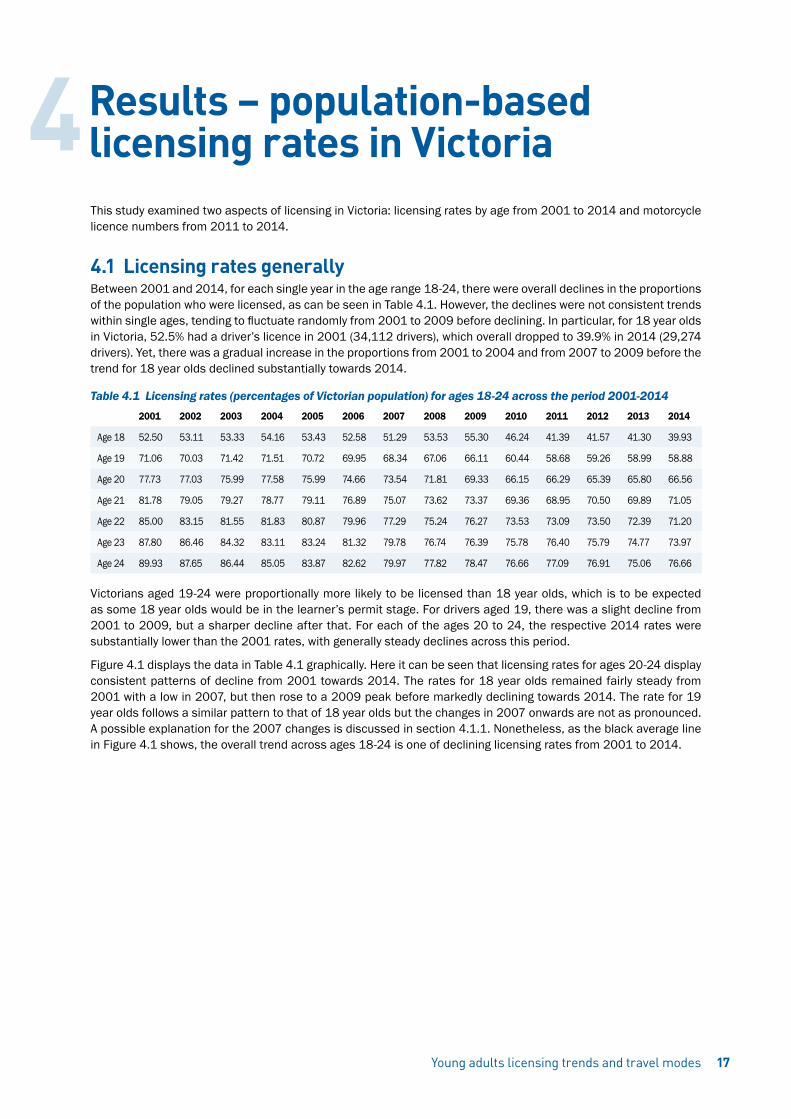
This study examined two aspects of licensing in Victoria: licensing rates by age from 2001 to 2014 and motorcycle licence numbers from 2011 to 2014.
4.1 Licensing rates generallyBetween 2001 and 2014, for each single year in the age range 18-24, there were overall declines in the proportions of the population who were licensed, as can be seen in Table 4.1. However, the declines were not consistent trends within single ages, tending to fluctuate randomly from 2001 to 2009 before declining. In particular, for 18 year olds in Victoria, 52.5% had a driver’s licence in 2001 (34,112 drivers), which overall dropped to 39.9% in 2014 (29,274 drivers). Yet, there was a gradual increase in the proportions from 2001 to 2004 and from 2007 to 2009 before the trend for 18 year olds declined substantially towards 2014.
Table 4.1 Licensing rates (percentages of Victorian population) for ages 18-24 across the period 2001-20142001 2002 2003 2004 2005 2006 2007 2008 2009 2010 2011 2012 2013 2014
Age 18 52.50 53.11 53.33 54.16 53.43 52.58 51.29 53.53 55.30 46.24 41.39 41.57 41.30 39.93
Age 19 71.06 70.03 71.42 71.51 70.72 69.95 68.34 67.06 66.11 60.44 58.68 59.26 58.99 58.88
Age 20 77.73 77.03 75.99 77.58 75.99 74.66 73.54 71.81 69.33 66.15 66.29 65.39 65.80 66.56
Age 21 81.78 79.05 79.27 78.77 79.11 76.89 75.07 73.62 73.37 69.36 68.95 70.50 69.89 71.05
Age 22 85.00 83.15 81.55 81.83 80.87 79.96 77.29 75.24 76.27 73.53 73.09 73.50 72.39 71.20
Age 23 87.80 86.46 84.32 83.11 83.24 81.32 79.78 76.74 76.39 75.78 76.40 75.79 74.77 73.97
Age 24 89.93 87.65 86.44 85.05 83.87 82.62 79.97 77.82 78.47 76.66 77.09 76.91 75.06 76.66
Victorians aged 19-24 were proportionally more likely to be licensed than 18 year olds, which is to be expected as some 18 year olds would be in the learner’s permit stage. For drivers aged 19, there was a slight decline from 2001 to 2009, but a sharper decline after that. For each of the ages 20 to 24, the respective 2014 rates were substantially lower than the 2001 rates, with generally steady declines across this period.
Figure 4.1 displays the data in Table 4.1 graphically. Here it can be seen that licensing rates for ages 20-24 display consistent patterns of decline from 2001 towards 2014. The rates for 18 year olds remained fairly steady from 2001 with a low in 2007, but then rose to a 2009 peak before markedly declining towards 2014. The rate for 19 year olds follows a similar pattern to that of 18 year olds but the changes in 2007 onwards are not as pronounced. A possible explanation for the 2007 changes is discussed in section 4.1.1. Nonetheless, as the black average line in Figure 4.1 shows, the overall trend across ages 18-24 is one of declining licensing rates from 2001 to 2014.
Young adults licensing trends and travel modes 17
Results – population-based licensing rates in Victoria4
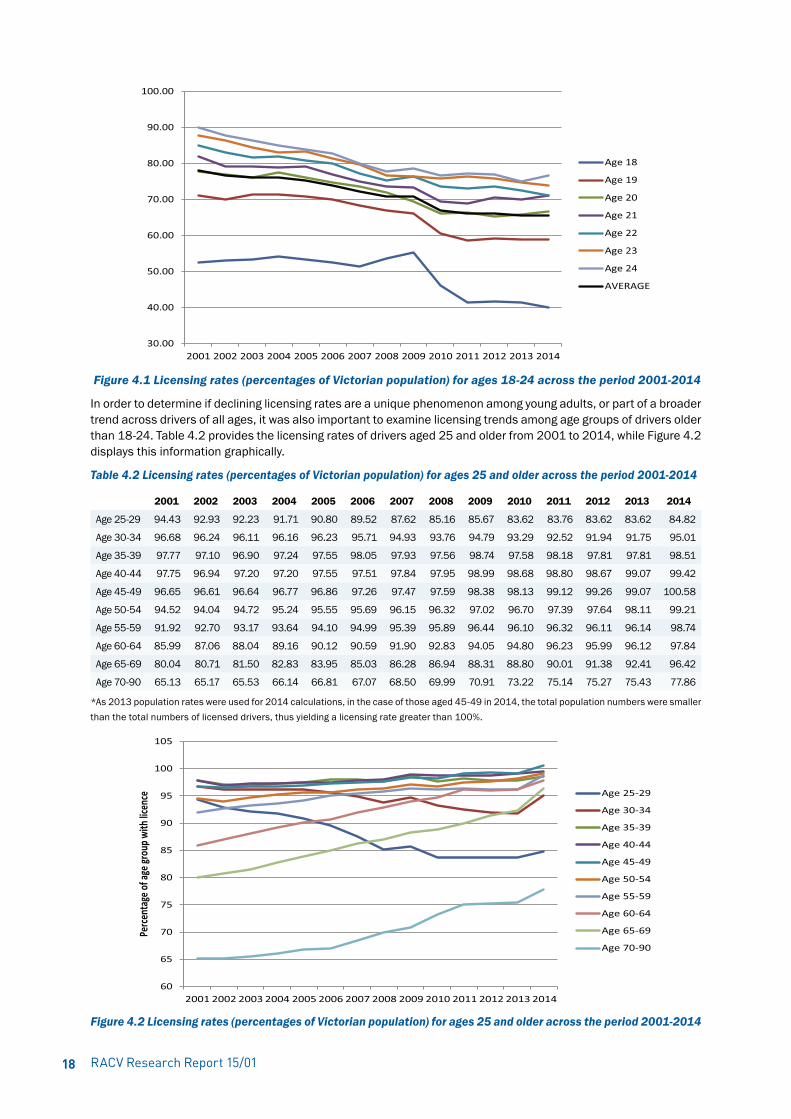
RACV Research Report 15/0118
Figure 4.1 Licensing rates (percentages of Victorian population) for ages 18-24 across the period 2001-2014
In order to determine if declining licensing rates are a unique phenomenon among young adults, or part of a broader trend across drivers of all ages, it was also important to examine licensing trends among age groups of drivers older than 18-24. Table 4.2 provides the licensing rates of drivers aged 25 and older from 2001 to 2014, while Figure 4.2 displays this information graphically.
Table 4.2 Licensing rates (percentages of Victorian population) for ages 25 and older across the period 2001-2014
2001 2002 2003 2004 2005 2006 2007 2008 2009 2010 2011 2012 2013 2014
Age 25-29 94.43 92.93 92.23 91.71 90.80 89.52 87.62 85.16 85.67 83.62 83.76 83.62 83.62 84.82
Age 30-34 96.68 96.24 96.11 96.16 96.23 95.71 94.93 93.76 94.79 93.29 92.52 91.94 91.75 95.01
Age 35-39 97.77 97.10 96.90 97.24 97.55 98.05 97.93 97.56 98.74 97.58 98.18 97.81 97.81 98.51
Age 40-44 97.75 96.94 97.20 97.20 97.55 97.51 97.84 97.95 98.99 98.68 98.80 98.67 99.07 99.42
Age 45-49 96.65 96.61 96.64 96.77 96.86 97.26 97.47 97.59 98.38 98.13 99.12 99.26 99.07 100.58
Age 50-54 94.52 94.04 94.72 95.24 95.55 95.69 96.15 96.32 97.02 96.70 97.39 97.64 98.11 99.21
Age 55-59 91.92 92.70 93.17 93.64 94.10 94.99 95.39 95.89 96.44 96.10 96.32 96.11 96.14 98.74
Age 60-64 85.99 87.06 88.04 89.16 90.12 90.59 91.90 92.83 94.05 94.80 96.23 95.99 96.12 97.84
Age 65-69 80.04 80.71 81.50 82.83 83.95 85.03 86.28 86.94 88.31 88.80 90.01 91.38 92.41 96.42
Age 70-90 65.13 65.17 65.53 66.14 66.81 67.07 68.50 69.99 70.91 73.22 75.14 75.27 75.43 77.86
*As 2013 population rates were used for 2014 calculations, in the case of those aged 45-49 in 2014, the total population numbers were smaller than the total numbers of licensed drivers, thus yielding a licensing rate greater than 100%.
Figure 4.2 Licensing rates (percentages of Victorian population) for ages 25 and older across the period 2001-2014
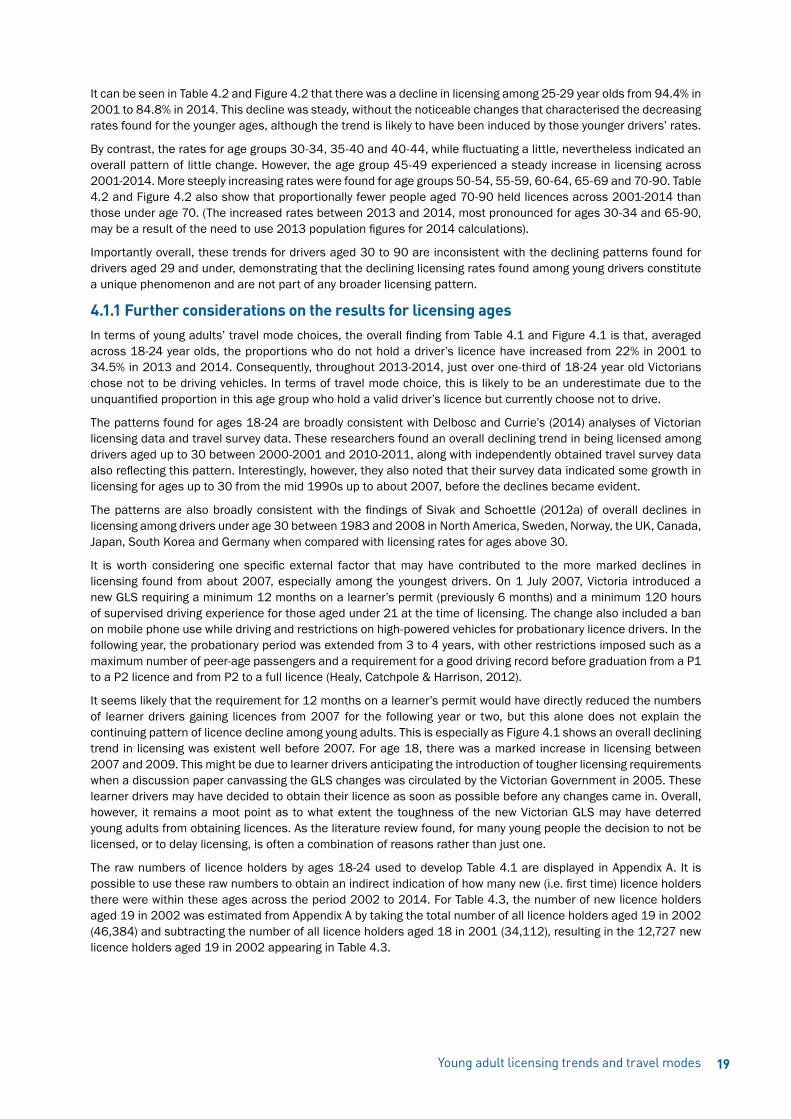
Young adult licensing trends and travel modes 19
It can be seen in Table 4.2 and Figure 4.2 that there was a decline in licensing among 25-29 year olds from 94.4% in 2001 to 84.8% in 2014. This decline was steady, without the noticeable changes that characterised the decreasing rates found for the younger ages, although the trend is likely to have been induced by those younger drivers’ rates.
By contrast, the rates for age groups 30-34, 35-40 and 40-44, while fluctuating a little, nevertheless indicated an overall pattern of little change. However, the age group 45-49 experienced a steady increase in licensing across 2001-2014. More steeply increasing rates were found for age groups 50-54, 55-59, 60-64, 65-69 and 70-90. Table 4.2 and Figure 4.2 also show that proportionally fewer people aged 70-90 held licences across 2001-2014 than those under age 70. (The increased rates between 2013 and 2014, most pronounced for ages 30-34 and 65-90, may be a result of the need to use 2013 population figures for 2014 calculations).
Importantly overall, these trends for drivers aged 30 to 90 are inconsistent with the declining patterns found for drivers aged 29 and under, demonstrating that the declining licensing rates found among young drivers constitute a unique phenomenon and are not part of any broader licensing pattern.
4.1.1 Further considerations on the results for licensing agesIn terms of young adults’ travel mode choices, the overall finding from Table 4.1 and Figure 4.1 is that, averaged across 18-24 year olds, the proportions who do not hold a driver’s licence have increased from 22% in 2001 to 34.5% in 2013 and 2014. Consequently, throughout 2013-2014, just over one-third of 18-24 year old Victorians chose not to be driving vehicles. In terms of travel mode choice, this is likely to be an underestimate due to the unquantified proportion in this age group who hold a valid driver’s licence but currently choose not to drive.
The patterns found for ages 18-24 are broadly consistent with Delbosc and Currie’s (2014) analyses of Victorian licensing data and travel survey data. These researchers found an overall declining trend in being licensed among drivers aged up to 30 between 2000-2001 and 2010-2011, along with independently obtained travel survey data also reflecting this pattern. Interestingly, however, they also noted that their survey data indicated some growth in licensing for ages up to 30 from the mid 1990s up to about 2007, before the declines became evident.
The patterns are also broadly consistent with the findings of Sivak and Schoettle (2012a) of overall declines in licensing among drivers under age 30 between 1983 and 2008 in North America, Sweden, Norway, the UK, Canada, Japan, South Korea and Germany when compared with licensing rates for ages above 30.
It is worth considering one specific external factor that may have contributed to the more marked declines in licensing found from about 2007, especially among the youngest drivers. On 1 July 2007, Victoria introduced a new GLS requiring a minimum 12 months on a learner’s permit (previously 6 months) and a minimum 120 hours of supervised driving experience for those aged under 21 at the time of licensing. The change also included a ban on mobile phone use while driving and restrictions on high-powered vehicles for probationary licence drivers. In the following year, the probationary period was extended from 3 to 4 years, with other restrictions imposed such as a maximum number of peer-age passengers and a requirement for a good driving record before graduation from a P1 to a P2 licence and from P2 to a full licence (Healy, Catchpole & Harrison, 2012).
It seems likely that the requirement for 12 months on a learner’s permit would have directly reduced the numbers of learner drivers gaining licences from 2007 for the following year or two, but this alone does not explain the continuing pattern of licence decline among young adults. This is especially as Figure 4.1 shows an overall declining trend in licensing was existent well before 2007. For age 18, there was a marked increase in licensing between 2007 and 2009. This might be due to learner drivers anticipating the introduction of tougher licensing requirements when a discussion paper canvassing the GLS changes was circulated by the Victorian Government in 2005. These learner drivers may have decided to obtain their licence as soon as possible before any changes came in. Overall, however, it remains a moot point as to what extent the toughness of the new Victorian GLS may have deterred young adults from obtaining licences. As the literature review found, for many young people the decision to not be licensed, or to delay licensing, is often a combination of reasons rather than just one.
The raw numbers of licence holders by ages 18-24 used to develop Table 4.1 are displayed in Appendix A. It is possible to use these raw numbers to obtain an indirect indication of how many new (i.e. first time) licence holders there were within these ages across the period 2002 to 2014. For Table 4.3, the number of new licence holders aged 19 in 2002 was estimated from Appendix A by taking the total number of all licence holders aged 19 in 2002 (46,384) and subtracting the number of all licence holders aged 18 in 2001 (34,112), resulting in the 12,727 new licence holders aged 19 in 2002 appearing in Table 4.3.
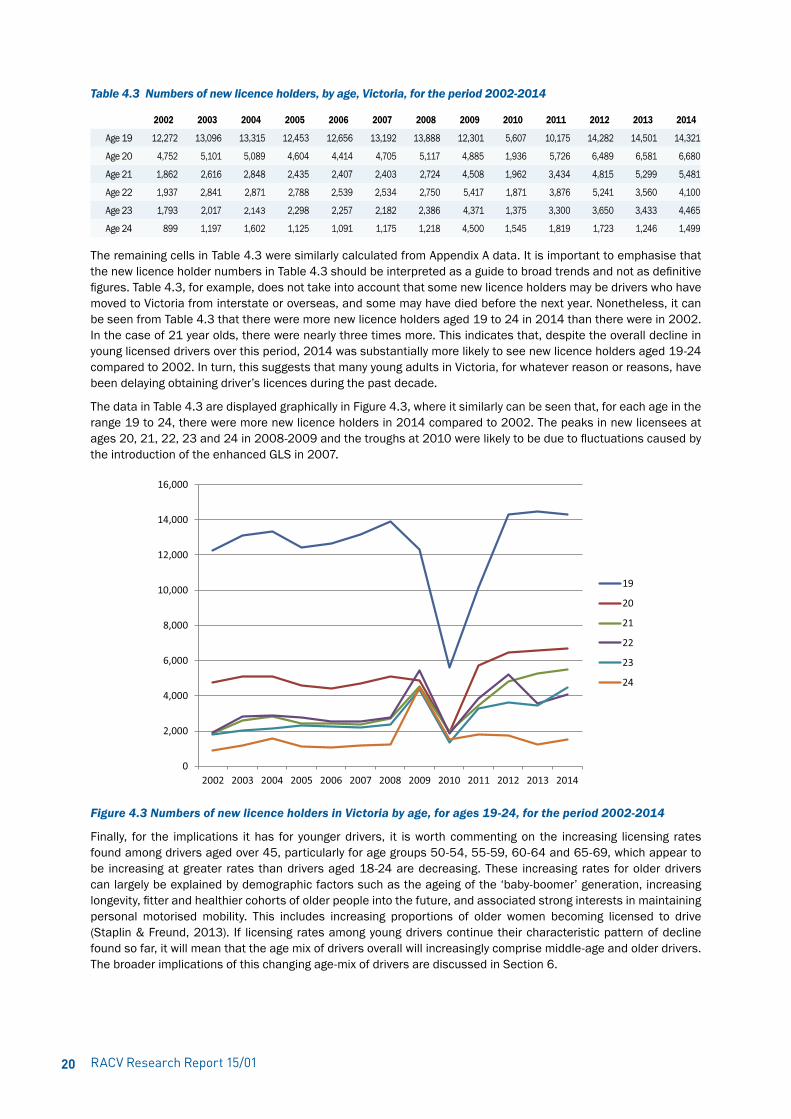
RACV Research Report 15/0120
Table 4.3 Numbers of new licence holders, by age, Victoria, for the period 2002-2014
2002 2003 2004 2005 2006 2007 2008 2009 2010 2011 2012 2013 2014
Age 19 12,272 13,096 13,315 12,453 12,656 13,192 13,888 12,301 5,607 10,175 14,282 14,501 14,321
Age 20 4,752 5,101 5,089 4,604 4,414 4,705 5,117 4,885 1,936 5,726 6,489 6,581 6,680
Age 21 1,862 2,616 2,848 2,435 2,407 2,403 2,724 4,508 1,962 3,434 4,815 5,299 5,481
Age 22 1,937 2,841 2,871 2,788 2,539 2,534 2,750 5,417 1,871 3,876 5,241 3,560 4,100
Age 23 1,793 2,017 2,143 2,298 2,257 2,182 2,386 4,371 1,375 3,300 3,650 3,433 4,465
Age 24 899 1,197 1,602 1,125 1,091 1,175 1,218 4,500 1,545 1,819 1,723 1,246 1,499
The remaining cells in Table 4.3 were similarly calculated from Appendix A data. It is important to emphasise that the new licence holder numbers in Table 4.3 should be interpreted as a guide to broad trends and not as definitive figures. Table 4.3, for example, does not take into account that some new licence holders may be drivers who have moved to Victoria from interstate or overseas, and some may have died before the next year. Nonetheless, it can be seen from Table 4.3 that there were more new licence holders aged 19 to 24 in 2014 than there were in 2002. In the case of 21 year olds, there were nearly three times more. This indicates that, despite the overall decline in young licensed drivers over this period, 2014 was substantially more likely to see new licence holders aged 19-24 compared to 2002. In turn, this suggests that many young adults in Victoria, for whatever reason or reasons, have been delaying obtaining driver’s licences during the past decade.
The data in Table 4.3 are displayed graphically in Figure 4.3, where it similarly can be seen that, for each age in the range 19 to 24, there were more new licence holders in 2014 compared to 2002. The peaks in new licensees at ages 20, 21, 22, 23 and 24 in 2008-2009 and the troughs at 2010 were likely to be due to fluctuations caused by the introduction of the enhanced GLS in 2007.
Figure 4.3 Numbers of new licence holders in Victoria by age, for ages 19-24, for the period 2002-2014
Finally, for the implications it has for younger drivers, it is worth commenting on the increasing licensing rates found among drivers aged over 45, particularly for age groups 50-54, 55-59, 60-64 and 65-69, which appear to be increasing at greater rates than drivers aged 18-24 are decreasing. These increasing rates for older drivers can largely be explained by demographic factors such as the ageing of the ‘baby-boomer’ generation, increasing longevity, fitter and healthier cohorts of older people into the future, and associated strong interests in maintaining personal motorised mobility. This includes increasing proportions of older women becoming licensed to drive (Staplin & Freund, 2013). If licensing rates among young drivers continue their characteristic pattern of decline found so far, it will mean that the age mix of drivers overall will increasingly comprise middle-age and older drivers. The broader implications of this changing age-mix of drivers are discussed in Section 6.
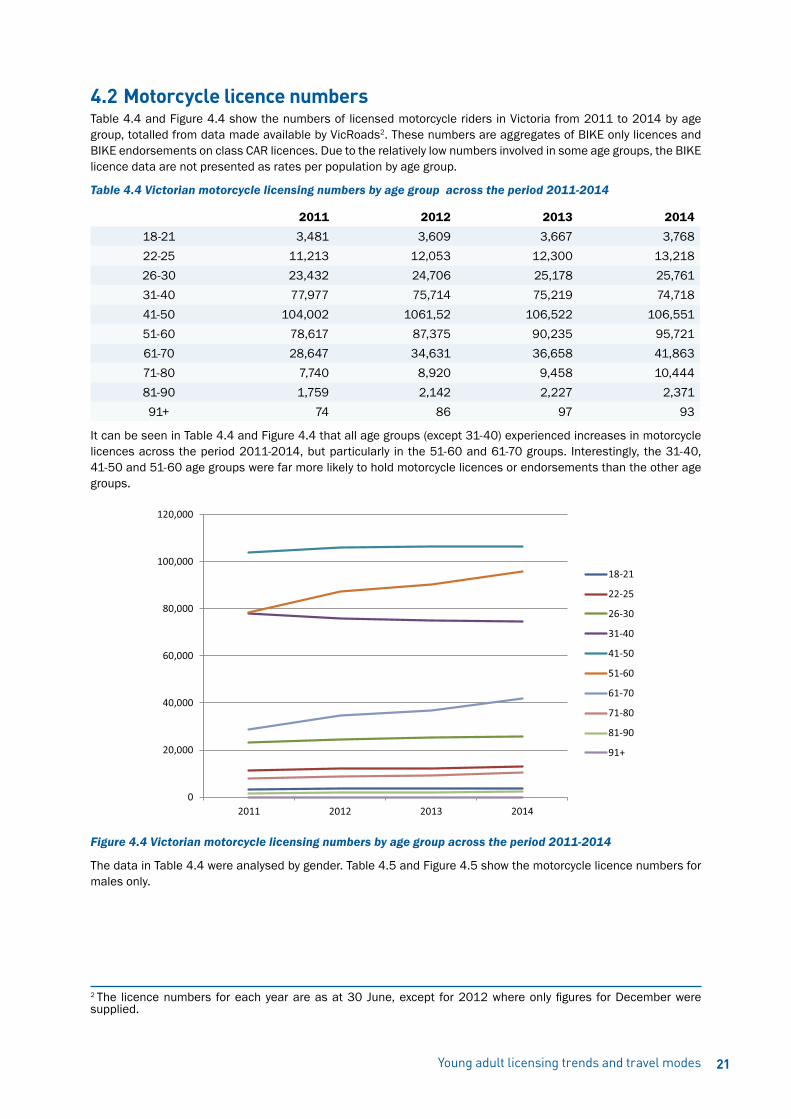
Young adult licensing trends and travel modes 21
4.2 Motorcycle licence numbersTable 4.4 and Figure 4.4 show the numbers of licensed motorcycle riders in Victoria from 2011 to 2014 by age group, totalled from data made available by VicRoads2. These numbers are aggregates of BIKE only licences and BIKE endorsements on class CAR licences. Due to the relatively low numbers involved in some age groups, the BIKE licence data are not presented as rates per population by age group.
Table 4.4 Victorian motorcycle licensing numbers by age group across the period 2011-2014
2011 2012 2013 201418-21 3,481 3,609 3,667 3,76822-25 11,213 12,053 12,300 13,21826-30 23,432 24,706 25,178 25,76131-40 77,977 75,714 75,219 74,71841-50 104,002 1061,52 106,522 106,55151-60 78,617 87,375 90,235 95,72161-70 28,647 34,631 36,658 41,86371-80 7,740 8,920 9,458 10,44481-90 1,759 2,142 2,227 2,37191+ 74 86 97 93
It can be seen in Table 4.4 and Figure 4.4 that all age groups (except 31-40) experienced increases in motorcycle licences across the period 2011-2014, but particularly in the 51-60 and 61-70 groups. Interestingly, the 31-40, 41-50 and 51-60 age groups were far more likely to hold motorcycle licences or endorsements than the other age groups.
Figure 4.4 Victorian motorcycle licensing numbers by age group across the period 2011-2014
The data in Table 4.4 were analysed by gender. Table 4.5 and Figure 4.5 show the motorcycle licence numbers for males only.
2 The licence numbers for each year are as at 30 June, except for 2012 where only figures for December were supplied.

RACV Research Report 15/0122
Table 4.5 Victorian male motorcycle licence numbers by age group across the period 2011-2014
2011 2012 2013 201418-21 3,207 3,320 3,351 3,45222-25 10,087 10,845 11,094 11,96926-30 20,460 21,753 22,224 22,86331-40 67,780 65,662 65,213 64,62041-50 91,186 92,636 92,806 92,55551-60 70,249 77,761 80,131 84,73861-70 26,484 31,755 33,553 38,13271-80 7,333 8,450 8,952 9,86081-90 1,685 2,025 2,110 2,24591+ 71 84 94 91
It can be seen in Table 4.5 and Figure 4.5 that male motorcycle licence numbers increased in all age groups except 31-40. The most substantial increases occurred for the 51-60 and 61-70 age groups, as might be expected considering the overall trend for these groups evident in Table 4.4 and Figure 4.4.
Figure 4.5 Victorian male motorcycle licence numbers by age group across the period 2011-2014Table 4.6 and Figure 4.6 show female motorcycle licence numbers by age group.
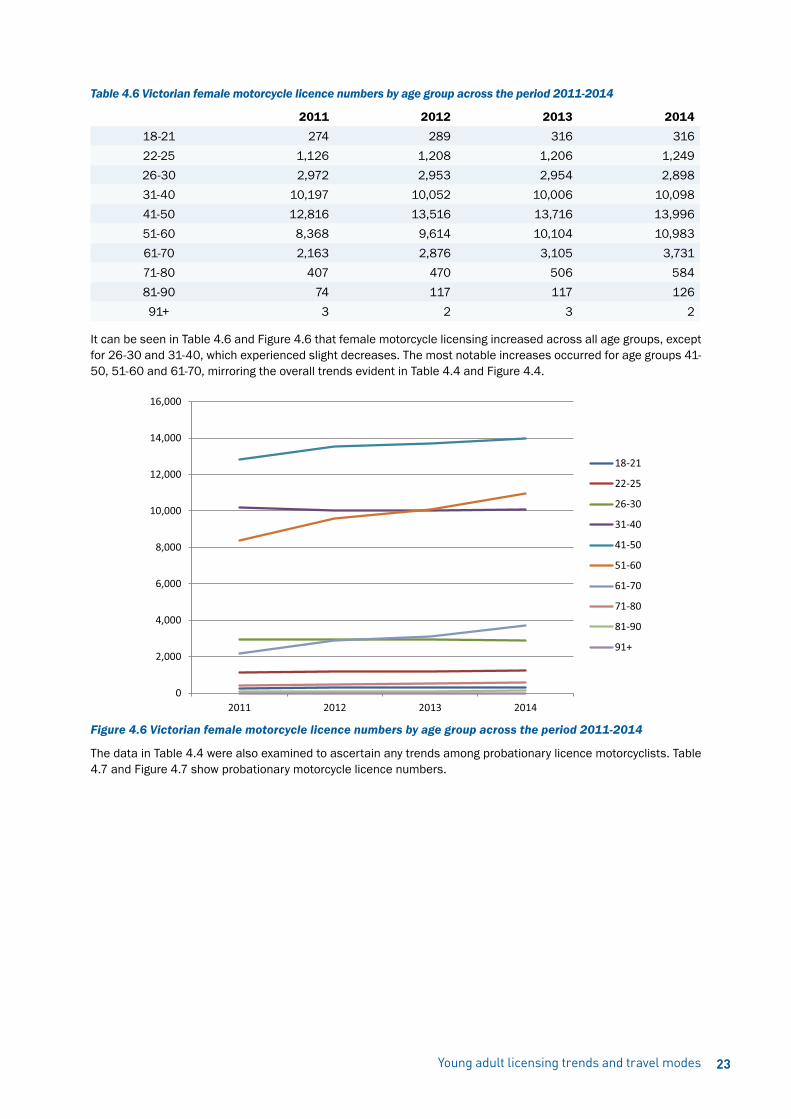
Young adult licensing trends and travel modes 23
Table 4.6 Victorian female motorcycle licence numbers by age group across the period 2011-2014
2011 2012 2013 201418-21 274 289 316 31622-25 1,126 1,208 1,206 1,24926-30 2,972 2,953 2,954 2,89831-40 10,197 10,052 10,006 10,09841-50 12,816 13,516 13,716 13,99651-60 8,368 9,614 10,104 10,98361-70 2,163 2,876 3,105 3,73171-80 407 470 506 58481-90 74 117 117 12691+ 3 2 3 2
It can be seen in Table 4.6 and Figure 4.6 that female motorcycle licensing increased across all age groups, except for 26-30 and 31-40, which experienced slight decreases. The most notable increases occurred for age groups 41-50, 51-60 and 61-70, mirroring the overall trends evident in Table 4.4 and Figure 4.4.
Figure 4.6 Victorian female motorcycle licence numbers by age group across the period 2011-2014
The data in Table 4.4 were also examined to ascertain any trends among probationary licence motorcyclists. Table 4.7 and Figure 4.7 show probationary motorcycle licence numbers.

RACV Research Report 15/0124
Table 4.7 Victorian probationary motorcycle licence numbers by age group across the period 2011-20142011 2012 2013 2014
18-21 2,113 3,552 3,621 3,71822-25 520 1,228 1,473 1,85726-30 313 283 284 26731-40 246 211 189 16041-50 57 56 45 4651-60 24 20 15 1161-70 4 8 6 671-80 1 0 1 081-90 1 0 0 091+ 0 0 0 0
It can be seen in Table 4.7 and Figure 4.7 that probationary motorcycle numbers rose steeply since 2011 for age groups 18-21 and 22-25, particularly from 2011 to 2012, but the numbers for the other age groups declined.
Figure 4.7 Victorian probationary motorcycle licence numbers by age group across the period 2011-2014
As the data in Table 4.4 are aggregates of both motorcycle only licence holders plus car licence holders with BIKE endorsements, the figures were examined with respect to those holding only a motorcycle licence. The numbers of people holding motorcycle only licences are displayed in Table 4.8 and Figure 4.8.
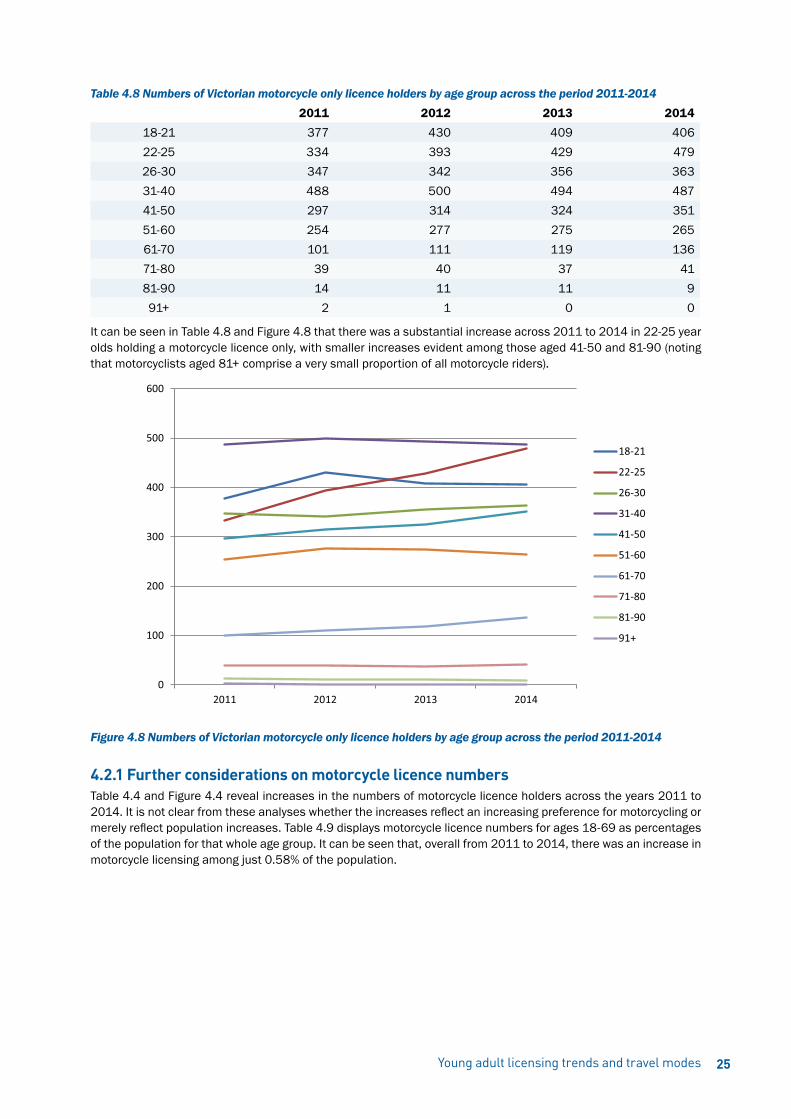
Young adult licensing trends and travel modes 25
Table 4.8 Numbers of Victorian motorcycle only licence holders by age group across the period 2011-20142011 2012 2013 2014
18-21 377 430 409 40622-25 334 393 429 47926-30 347 342 356 36331-40 488 500 494 48741-50 297 314 324 35151-60 254 277 275 26561-70 101 111 119 13671-80 39 40 37 4181-90 14 11 11 991+ 2 1 0 0
It can be seen in Table 4.8 and Figure 4.8 that there was a substantial increase across 2011 to 2014 in 22-25 year olds holding a motorcycle licence only, with smaller increases evident among those aged 41-50 and 81-90 (noting that motorcyclists aged 81+ comprise a very small proportion of all motorcycle riders).
Figure 4.8 Numbers of Victorian motorcycle only licence holders by age group across the period 2011-2014
4.2.1 Further considerations on motorcycle licence numbersTable 4.4 and Figure 4.4 reveal increases in the numbers of motorcycle licence holders across the years 2011 to 2014. It is not clear from these analyses whether the increases reflect an increasing preference for motorcycling or merely reflect population increases. Table 4.9 displays motorcycle licence numbers for ages 18-69 as percentages of the population for that whole age group. It can be seen that, overall from 2011 to 2014, there was an increase in motorcycle licensing among just 0.58% of the population.
RACV Research Report 15/0126
Table 4.9 Victorian motorcycle licences as percentages of the Victorian population, ages 18-69 across the period 2011-2014
2011 2012 2013 2014Total population age 18-69 3,770,377 3,833,791 3,904,786 3,904,786Total number motorcycle licence holders age 18-70*
327,369 344,240 349,779 361,600
Percent of motorcycle licence out of total population
8.68% 8.98% 8.96% 9.26%
Licence numbers supplied by VicRoads for age 69 were contained within age group 61-70, not 61-69. Hence, it seems plausible that the increases in motorcycle licence numbers are due more to the rising popularity of motorcycling than to population increases alone. For example, Tables 4.4, 4.5 and 4.6 and Figures 4.4, 4.5 and 4.6 indicate a growing popularity for motorcycling particularly among middle and older age groups in Victoria. This is not a new phenomenon as the trend has been evident for some time nationally (Weissenfeld, Baldock & Hutchinson, 2011).
Marked increases were also found for the 18-21 and 22-25 age groups, particularly for 18-21 year olds between 2011 and 2012 (Tables 4.5, 4.7 & 4.8 and Figures 4.5, 4.7 & 4.8). The main factor behind these marked increases is likely to be the Victorian Government’s (2010) discussion paper on motorcycle licensing and the subsequent adoption of a motorcycle GLS system. It is likely many people in these age groups would have decided to obtain motorcycle licensing sooner rather than later in order to avoid being subject to the new motorcycle GLS. This new GLS increased the required time on a probationary licence for motorcyclists from one to three years. This provision is likely to be the main contributing factor to the predominance of probationary licence motorcyclists in the 18-21 and 22-25 age groups (Table 4.7 and Figure 4.7).
Related to that trend is the surge in 22-25 year olds holding motorcycle only licences (Table 4.8 and Figure 4.8). While the new motorcycle GLS requirements are likely to be a major contributing factor, it is also plausible that the popularity of motorcycling in this age group may indicate a preference for motorcycling over driving cars. This possibility can best be quantified through surveys of young motorcyclists’ motivations.
4.3 Summary of key licensing resultsPatterns of licensing decline among Victorian 18-29 year olds have existed since at least 2001, which means the declines were evident well before the more stringent GLS introduced around 2007. By 2014, just over one-third of 18-24 year old Victorians were not licensed to drive, although some of these for various reasons were likely to have been merely delaying a decision to obtain a licence. Nonetheless, this third is likely to be an underestimate of non-driving among young adults due to the unquantified proportion who hold a valid driver’s licence but still choose not to drive for some if not all of their travel. By contrast, young adults in Victoria are becoming more likely to hold motorcycle licences, although this trend was apparent among other motorcycling age groups too. Nonetheless, 22 to 25 year olds are becoming more likely to hold a licence for motorcycle riding only, even though this group constitutes a relatively small proportion of the Victorian motorcycling population. Additionally, the licence data revealed that the licensing decline among young adults is accompanied by substantial increases in the proportions of adults aged over 50 who are licensed.
The survey sought the views of young adults who were not licensed or who did not drive as to the reasons for their choices. It was anticipated information concerning these views could contribute towards explaining any trends found in the analyses of the VicRoads licensing data. As discussed in section 2.2, an online survey was conducted during February-March 2015 on Australians aged 18-30 who self-identified that they do not currently have a driver’s licence or drive. The survey (see Appendix B) contained eight questions, beginning with a necessary confirmation of the participant’s licence status. The remaining questions asked about age, gender and postcode, main and secondary reasons for not having a licence (if this is the case), any plans to become licensed and current main mode of travel. Two questions about main and secondary reasons for non-licensure provided several answer options and the option order was randomised between the two questions and for each new participant.
It was anticipated that the number of young adults in Victoria who do not drive constitutes a minority population who would be difficult to identify for purposes of conducting a survey. Nonetheless, responses were received from 270 individuals nationally. Of these, 121 had indicated at the first question that they currently have a licence. These respondents were thanked but disqualified from completing further questions, as was the case in Schoettle and Sivak’s (2013) original survey. It was important to have this initial filtering question as it constitutes an extra check to help ensure that the survey sample comprised only individuals who did not hold a current licence. (Nonetheless, as discussed earlier, among young licence holders many do not drive for at least some, if not all, of their road travel). Two other respondents were excluded from further analysis as they had indicated their age was 31 or over. This left 147 adults aged 18 to 30 who did not currently hold a licence, although some of these had a learner’s permit or an expired licence.
5.1 Demographics of survey respondentsThe overall gender breakdown of the 147 eligible respondents was 19.7% male, 76.2% female and 4% transgender / intergender / other / no response. The preponderance of female respondents over males was chiefly due to the respondents in the SurveyMonkey audience pools containing many more female members than males. Also, SurveyMonkey’s experience is that female audience pool members tend to respond more quickly to their survey invitations whereas males are typically slower to respond. In addition, the 121 ineligible respondents contained more females (72.0%) than males (28.0%). Interestingly, Shoettle and Sivak (2013), who used SurveyMonkey on an American audience pool, also had a preponderance of female respondents (62.8%). In the present study, gender balance was not a prime issue of concern as it was deemed more important to maximise eligible respondent numbers, given the difficulty of identifying and locating 18-30 year olds who do not drive, than to preset gender quotas on the respondents.
The respondent age profile can be seen in Table 5.1.
Table 5.1 Age profile of eligible survey respondents
Age 18 19 20 21 22 23 24 25-30% 10.9 17.0 8.8 4.8 10.9 3.4 8.8 35.4
Respondents’ residence allocation as indicated by postcode (survey Q. 3) were: Melbourne metropolitan area 47 respondents, rest of Victoria 13, Western Australia 13, Tasmania 4, South Australia 14, Queensland 11, New South Wales 40, the Australian Capital Territory 4 and the Northern Territory 1, with 2 respondents omitting giving their postcode.
For its audience pools, SurveyMonkey possesses data on respondent member household income, maintained in conjunction with participants’ general background details, hence this information was not sought as part of the present survey. Most respondents (25%) came from households with annual income less than $29,999, followed by $30,000 to $59,999 (20%), $60,000 to $$89,999 (5%) and $90,000 to $119,999 (5%). Another 5% of respondents came from households with income over $180,000, while 40% had declined to divulge this information to SurveyMonkey.
Young adults licensing trends and travel modes 27
Results - survey of non-drivers aged 18-305
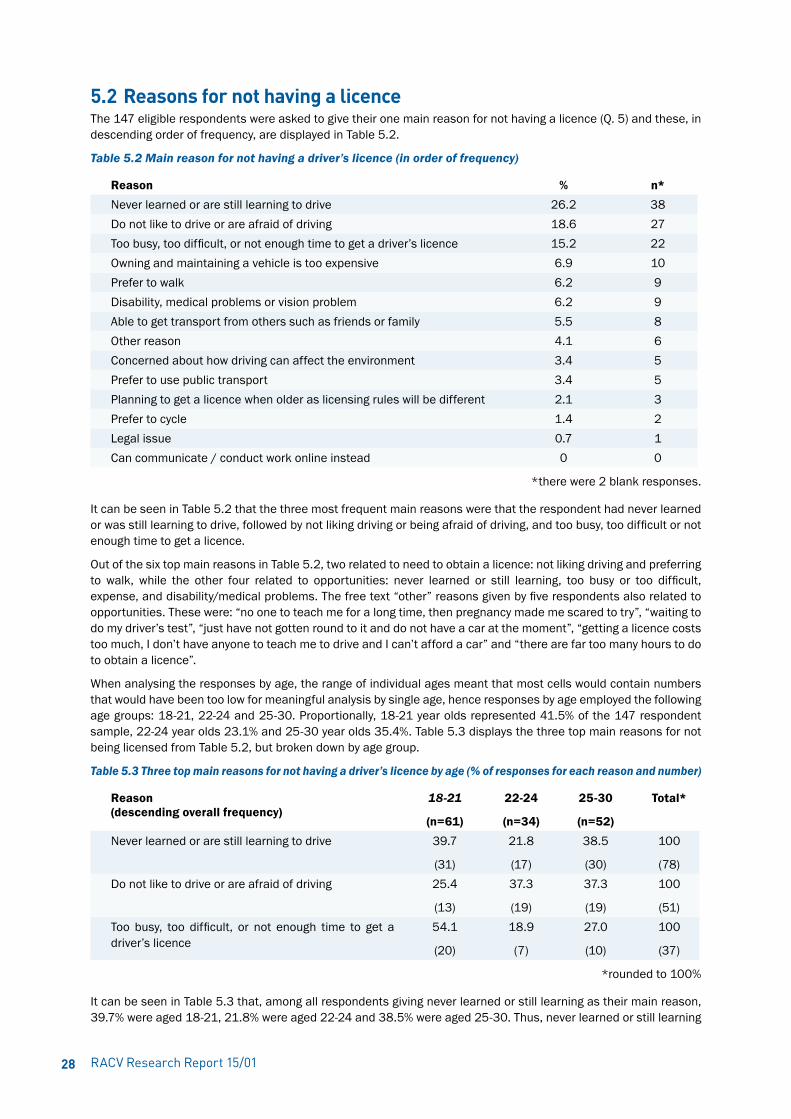
RACV Research Report 15/0128
5.2 Reasons for not having a licenceThe 147 eligible respondents were asked to give their one main reason for not having a licence (Q. 5) and these, in descending order of frequency, are displayed in Table 5.2.
Table 5.2 Main reason for not having a driver’s licence (in order of frequency)
Reason % n*Never learned or are still learning to drive 26.2 38Do not like to drive or are afraid of driving 18.6 27Too busy, too difficult, or not enough time to get a driver’s licence 15.2 22Owning and maintaining a vehicle is too expensive 6.9 10Prefer to walk 6.2 9Disability, medical problems or vision problem 6.2 9Able to get transport from others such as friends or family 5.5 8Other reason 4.1 6Concerned about how driving can affect the environment 3.4 5Prefer to use public transport 3.4 5Planning to get a licence when older as licensing rules will be different 2.1 3Prefer to cycle 1.4 2Legal issue 0.7 1Can communicate / conduct work online instead 0 0
*there were 2 blank responses.
It can be seen in Table 5.2 that the three most frequent main reasons were that the respondent had never learned or was still learning to drive, followed by not liking driving or being afraid of driving, and too busy, too difficult or not enough time to get a licence.
Out of the six top main reasons in Table 5.2, two related to need to obtain a licence: not liking driving and preferring to walk, while the other four related to opportunities: never learned or still learning, too busy or too difficult, expense, and disability/medical problems. The free text “other” reasons given by five respondents also related to opportunities. These were: “no one to teach me for a long time, then pregnancy made me scared to try”, “waiting to do my driver’s test”, “just have not gotten round to it and do not have a car at the moment”, “getting a licence costs too much, I don’t have anyone to teach me to drive and I can’t afford a car” and “there are far too many hours to do to obtain a licence”.
When analysing the responses by age, the range of individual ages meant that most cells would contain numbers that would have been too low for meaningful analysis by single age, hence responses by age employed the following age groups: 18-21, 22-24 and 25-30. Proportionally, 18-21 year olds represented 41.5% of the 147 respondent sample, 22-24 year olds 23.1% and 25-30 year olds 35.4%. Table 5.3 displays the three top main reasons for not being licensed from Table 5.2, but broken down by age group.
Table 5.3 Three top main reasons for not having a driver’s licence by age (% of responses for each reason and number)
Reason(descending overall frequency)
18-21
(n=61)
22-24
(n=34)
25-30
(n=52)
Total*
Never learned or are still learning to drive 39.7
(31)
21.8
(17)
38.5
(30)
100
(78)Do not like to drive or are afraid of driving 25.4
(13)
37.3
(19)
37.3
(19)
100
(51)Too busy, too difficult, or not enough time to get a driver’s licence
54.1
(20)
18.9
(7)
27.0
(10)
100
(37)
*rounded to 100%
It can be seen in Table 5.3 that, among all respondents giving never learned or still learning as their main reason, 39.7% were aged 18-21, 21.8% were aged 22-24 and 38.5% were aged 25-30. Thus, never learned or still learning
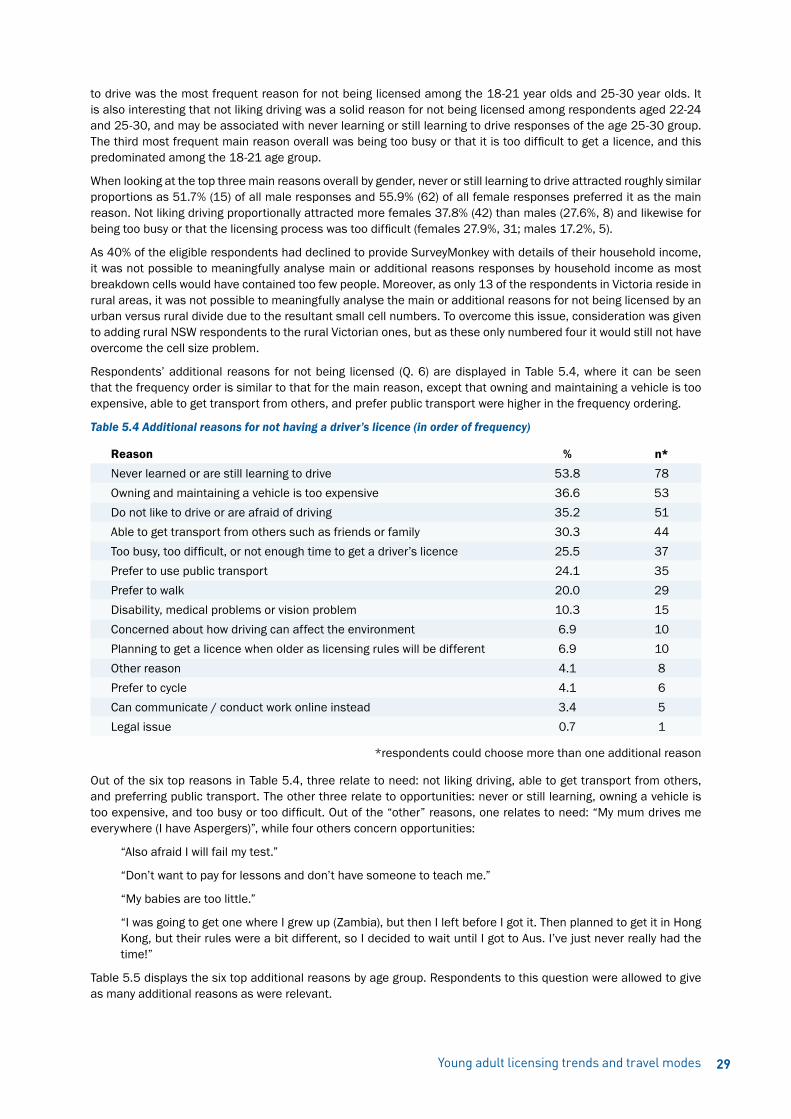
Young adult licensing trends and travel modes 29
to drive was the most frequent reason for not being licensed among the 18-21 year olds and 25-30 year olds. It is also interesting that not liking driving was a solid reason for not being licensed among respondents aged 22-24 and 25-30, and may be associated with never learning or still learning to drive responses of the age 25-30 group. The third most frequent main reason overall was being too busy or that it is too difficult to get a licence, and this predominated among the 18-21 age group.
When looking at the top three main reasons overall by gender, never or still learning to drive attracted roughly similar proportions as 51.7% (15) of all male responses and 55.9% (62) of all female responses preferred it as the main reason. Not liking driving proportionally attracted more females 37.8% (42) than males (27.6%, 8) and likewise for being too busy or that the licensing process was too difficult (females 27.9%, 31; males 17.2%, 5).
As 40% of the eligible respondents had declined to provide SurveyMonkey with details of their household income, it was not possible to meaningfully analyse main or additional reasons responses by household income as most breakdown cells would have contained too few people. Moreover, as only 13 of the respondents in Victoria reside in rural areas, it was not possible to meaningfully analyse the main or additional reasons for not being licensed by an urban versus rural divide due to the resultant small cell numbers. To overcome this issue, consideration was given to adding rural NSW respondents to the rural Victorian ones, but as these only numbered four it would still not have overcome the cell size problem.
Respondents’ additional reasons for not being licensed (Q. 6) are displayed in Table 5.4, where it can be seen that the frequency order is similar to that for the main reason, except that owning and maintaining a vehicle is too expensive, able to get transport from others, and prefer public transport were higher in the frequency ordering.
Table 5.4 Additional reasons for not having a driver’s licence (in order of frequency)
Reason % n*Never learned or are still learning to drive 53.8 78Owning and maintaining a vehicle is too expensive 36.6 53Do not like to drive or are afraid of driving 35.2 51Able to get transport from others such as friends or family 30.3 44Too busy, too difficult, or not enough time to get a driver’s licence 25.5 37Prefer to use public transport 24.1 35Prefer to walk 20.0 29Disability, medical problems or vision problem 10.3 15Concerned about how driving can affect the environment 6.9 10Planning to get a licence when older as licensing rules will be different 6.9 10Other reason 4.1 8Prefer to cycle 4.1 6Can communicate / conduct work online instead 3.4 5Legal issue 0.7 1
*respondents could choose more than one additional reason
Out of the six top reasons in Table 5.4, three relate to need: not liking driving, able to get transport from others, and preferring public transport. The other three relate to opportunities: never or still learning, owning a vehicle is too expensive, and too busy or too difficult. Out of the “other” reasons, one relates to need: “My mum drives me everywhere (I have Aspergers)”, while four others concern opportunities:
“Also afraid I will fail my test.”
“Don’t want to pay for lessons and don’t have someone to teach me.”
“My babies are too little.”
“I was going to get one where I grew up (Zambia), but then I left before I got it. Then planned to get it in Hong Kong, but their rules were a bit different, so I decided to wait until I got to Aus. I’ve just never really had the time!”
Table 5.5 displays the six top additional reasons by age group. Respondents to this question were allowed to give as many additional reasons as were relevant.

RACV Research Report 15/0130
Table 5.5 Six top additional reasons for not having a driver’s licence by age group (% of responses and number)
Reason(descending frequency order)
18-21 22-24 25-30 Total
Never learned or are still learning to drive 43.6
(34)
17.9
(14)
38.5
(30)
100
(78)Owning and maintaining a vehicle is too expensive 37.7
(20)
20.8
(11)
41.5
(22)
100
(53)Do not like to drive or are afraid of driving 33.3
(17)
29.4
(15)
37.3
(19)
100
(51)Able to get transport from others such as friends or family
56.8
(25)
22.7
(10)
20.5
(9)
100
(44)Too busy, too difficult, or not enough time to get a driver’s licence
56.8
(21)
16.2
(6)
27.0
(10)
100
(37)Prefer to use public transport 34.3
(12)
28.6
(10)
37.1
(13)
100
(35)
It can be seen in Table 5.5 that 43.6% of those who chose “never” or “still learning” as an additional reason were from the 18-21 age group. It can be expected that the majority of these would have been still acquiring a licence. By contrast, 38.5% who chose this additional reason were from the 25-30 age group and it seems plausible that the majority of these were those who simply had never learned. The 25-30 age group were also most likely to have stated that owning or maintaining a car is too expensive, not liking driving and preferring use of public transport. Females were more likely than males to give the following as additional reasons for not being licensed: vehicle expenses (females 39.6%, 44; males 27.6%, 8); not liking driving (females 37.8%, 42; males 27.6%, 8); able to get transport from others (females 34.2%, 8; males 20.7%, 6); and being too busy (females 27.9, 31; males 17.2%, 5).
Of those in the present study who gave never learned or still learning as their main reason for not being licensed, a quarter most commonly indicated not liking driving among their additional reasons.
5.3 Plans to obtain a licenceQuestion seven in the survey asked respondents when they plan to get a driver’s licence, if at all. The majority (46.5%) said they planned to get one within one to five years, with 39.6% planning to get one within the next year, and 2.1% in six or more years. However, 11.8% said they had no plans to obtain a licence.
When analysing the licensing intentions data by age group (Table 5.6), the younger driver age group (18-21) and the older group (25-30) predominated among those intending to obtain a licence within one year and in one to five years. In addition, 25-30 year olds were the age group most likely to indicate intentions to never obtain a licence.
Table 5.6 Plans to obtain a driver’s licence by age group (% of responses and number)
18-21 22-24 25-30 Total*Never 29.4
(5)
17.6
(3)
52.9
(9)
100
(17)Less than 1 year 43.9
(25)
19.2
(11)
36.8
(21)
100
(57)1 to 5 years 46.3
(31)
25.4
(17)
28.4
(19)
100
(67)6 to 10 years (0) (1) (1)More than 10 years (0) (0) (1)
*Rounded off to 100%.
Females (41.4%) were more likely than males (34.5%) to say they would obtain a licence within the year, while the gender proportions for the “never” and “in one to five years” categories were proportionally similar.

Young adult licensing trends and travel modes 31
As might be expected, those who indicated intentions to defer obtaining a licence for up to five years gave reasons for not being licensed that were consistent with their goals. Among this group, the most common main reason was that they had never learned to drive or were still learning, while common additional reasons were able to get transport from others, not liking driving and too busy.
5.4 Current travel modes usedTable 5.7 displays the results of the final survey question, which asked respondents how they usually travel. It can be seen that the most common mode choice was public transport, followed by passenger travel. The two “other” text responses were: “By public transport and walking” and “Segway”.
Table 5.7 Usual travel mode choices
% n*By public transport 56.2 81As a vehicle passenger 28.5 41Walking 11.1 16Cycling 2.8 4 Other 1.4 2
*There were 3 blank responses.
When analysing travel mode choice by age, 18-21 year olds (45.7%) appeared to be more likely than the other age groups to use public transport (compared with 21.0% for age 22-24 and 33.3% for 25-30). For those who travel as passengers, age 25-30 predominated (41.5%) (compared with age 18-21 ― 36.6%, and for age 22-24 ― 22.0%).
Gender-wise, males (72.4%) were more likely than females (52.2%) to say they used public transport, but females (29.7%) were more likely to be travelling as passengers (males 24.1%), and females (13.5%) were more likely to be walking than males (3.4%). As might be expected, respondents residing within a Melbourne postcode area were more likely to cite public transport than those residing in rural areas of the State.
5.5 Discussion of survey resultsThe survey found that the most frequent reasons for not being licensed related to opportunities to get a licence, such as the difficulty of the licensing process, its expense, or being too busy. Other common reasons related to perceived need for a licence, such as not liking driving or preferring walking. Only being too busy or that it was too difficult were among the three top reasons for non-licensure in Schoettle and Sivak (2013). (The other two in Schoettle & Sivak’s top three were: owning a vehicle is too expensive, and I can get lifts from others.) Environmental concerns and use of communications technologies were uncommon responses in the survey for not being licensed, which concurs with the conclusions of Delbosc and Currie (2013a).
Over a third of respondents aged 25-30 said that they had never learned to drive or were still learning. This, together with the survey’s finding that not liking driving was a common reason among 22-24 and 25-30 year olds, suggests the emergence of a strong pattern of not wanting to drive much or at all particularly among some 25-30 year olds in Victoria. This is comparable with Raimond and Milthorpe’s (2010) Sydney-based finding that, if this age group is not licensed, they will likely remain so for some time.
The top three additional reasons for not having a licence were never or still learning, vehicle expenses and not liking driving. Out of these three, only vehicle expenses also appeared in Schoettle and Sivak’s (2013) top three. The present study found that older age groups were likely to nominate vehicle expenses and preference for public transport as reasons for not being licensed, which was also found by Schoettle and Sivak (2013). In the present study, females were most likely to have stated vehicle expenses, not liking driving, and ability to get transport from others among their additional reasons, and in Schoettle and Sivak (2013) females were also more likely to nominate vehicle expenses, not liking driving and ability to get transport from others as additional reasons.
A majority of respondents (46.5%) said they planned to get a licence within one to five years, with 39.6% planning to get one within the next year, and 2.1% in six or more years. However, 11.8% said they had no plans to obtain a licence. A similar pattern was reported by Sivak and Schoettle (2013), except that in their US study more respondents intended to obtain a licence within one year rather than in one to five years. However, the present study’s findings of a one to five year timespan are consistent with Delbosc and Currie’s (2013b) Melbourne survey in which almost a half of the young adults said they did not plan to get a licence within the next 12 months.
While 18-21 year olds appeared more likely to use public transport than the other age groups, the proportional

RACV Research Report 15/0132
distributions across the three age groups were similar to the age profile of all 147 respondents (as mentioned in section 5.2). Thus, it is not clear to what extent the age group break down for choosing public transport merely reflects the age-group distribution of the sample, or is suggestive of a trend independent of it.
Overall, the survey shows that, consistent with the reviewed literature (Schoettle & Sivak, 2013; Aretun & Nordbakke, 2014), young adults who do not drive, or who delay obtaining a licence, are likely to cite multiple reasons or factors that influenced these decisions and which cover both needs and opportunities. A strong pattern of young adults not wanting to drive much or at all, along with not liking driving, may be emerging in Victoria, consistent with such trends found in Sydney (Raimond & Milthorpe, 2010).

Young adults licensing trends and travel modes 33
While the present study’s finding of licensing decline among young adults in Victoria confirms previous Australian studies and overseas work, and the surveyed reasons for non-licensure bear similarity with those of Schoettle and Sivak (2013) in the US, there are some limitations that should be borne in mind.
6.1 Study limitationsThe licence data supplied by VicRoads consisted of numbers of licences held at 30 June in each year from 2001 to 2014 by age. While this allowed estimation of trends in licensing by age over time, the trends found should be considered as indicative rather than definitive. This is because licence numbers on a single day do not reflect changes in those numbers over the previous 12 months due to, for example, newly licensed drivers, and drivers who die or who transfer into the licence system from interstate. It was possible for Table 4.3 and Figure 4.3 to estimate indirectly numbers of newly licensed drivers for a given age by subtracting licence numbers for the previous year but only as a substitute for direct data on numbers of new licensees.
Obtaining numbers of licence holders in relation to population numbers is similarly an indirect means of estimating the numbers of non-licence holders, which was the focus of the study. However, given the difficulty of quantifying eligible yet non-licence holders the method used was an appropriate approach. It should also be appreciated that the licence data analysis is likely to give underestimates of the prevalence of non-drivers as it is feasible for many adults to not drive despite holding valid driver’s licences. Lastly, despite the similar trends found with other studies, care should still be exercised in extrapolating the licence trends found in Victoria to other Australian jurisdictions.
The difficulty of identifying adults who do not drive also affected the response rate for the survey. Even though most jurisdictions were represented, as well as urban and rural areas, having just 147 eligible respondents restricted the extent to which factors such as reasons for not being licensed could be explored in relation to other variables such as age. Also, as many times more females than males responded, there was potential for the findings to be more characteristic of females than males. It was also unfortunate that 121 potential respondents had to be excluded on the basis that they currently had a licence, even though they may not have been active drivers. For sake of reliability, current licensed drivers were excluded from completing the survey, just as they were in the original survey format by Schoettle and Sivak (2013). Nonetheless, it would have been informative had the survey design allowed these 121 licensed drivers to participate further after filtering questions confirming that they do not drive despite holding a licence. Lastly, due to the sample size, care should be exercised in extrapolating the survey findings to young Australian adults generally.
6.2 Further discussion on key findingsThe reviewed literature generally reports that travel mode choice among young adults is changing, as evidenced by declines in many countries in the proportions that have driver’s licences coupled with young adults’ increased use of alternative transport modes. As well, even among those who hold licences, many are complementing their driving with increased use of alternative transport options. There are likely to be many inter-linked, societal-level factors influencing the needs and opportunities for holding licences. Such broad factors, which are also affecting other travel mode choices of young adults, include:
• transport planning policies, economic circumstances and market forces restricting access to and usage of cars (van Dender & Clever, 2013; Metz, 2013);
• a delayed transition from teenage to adult lifestyles (Aretun & Nordbakke, 2014; Berrington & Mikolai, 2014);
• increased use of car-sharing schemes (Strang & Mead, 2013) and,
• a devaluing of car ownership and car use as a lifestyle characteristic (Delbosc & Currie, 2013c).
Also, along with increasing commonality of teleworking, public transport is becoming an increasingly more attractive choice among the young (at least for those who have good access to it) due to convenience, shorter travel times and that it allows use of technological equipment such as smartphones and laptops (TransitCenter, 2014).
Consistent with the world literature, Table 4.1 and Figure 4.1 in this study indicate patterns of licensing decline
Discussion6
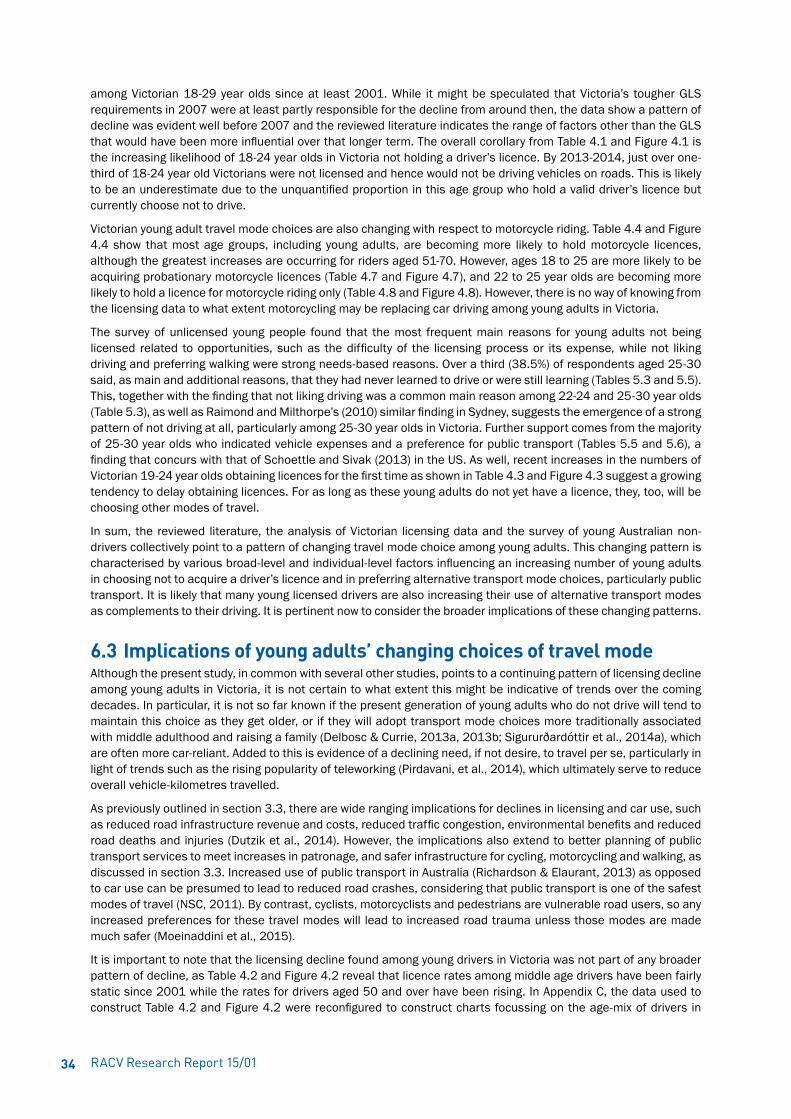
RACV Research Report 15/0134
among Victorian 18-29 year olds since at least 2001. While it might be speculated that Victoria’s tougher GLS requirements in 2007 were at least partly responsible for the decline from around then, the data show a pattern of decline was evident well before 2007 and the reviewed literature indicates the range of factors other than the GLS that would have been more influential over that longer term. The overall corollary from Table 4.1 and Figure 4.1 is the increasing likelihood of 18-24 year olds in Victoria not holding a driver’s licence. By 2013-2014, just over one-third of 18-24 year old Victorians were not licensed and hence would not be driving vehicles on roads. This is likely to be an underestimate due to the unquantified proportion in this age group who hold a valid driver’s licence but currently choose not to drive.
Victorian young adult travel mode choices are also changing with respect to motorcycle riding. Table 4.4 and Figure 4.4 show that most age groups, including young adults, are becoming more likely to hold motorcycle licences, although the greatest increases are occurring for riders aged 51-70. However, ages 18 to 25 are more likely to be acquiring probationary motorcycle licences (Table 4.7 and Figure 4.7), and 22 to 25 year olds are becoming more likely to hold a licence for motorcycle riding only (Table 4.8 and Figure 4.8). However, there is no way of knowing from the licensing data to what extent motorcycling may be replacing car driving among young adults in Victoria.
The survey of unlicensed young people found that the most frequent main reasons for young adults not being licensed related to opportunities, such as the difficulty of the licensing process or its expense, while not liking driving and preferring walking were strong needs-based reasons. Over a third (38.5%) of respondents aged 25-30 said, as main and additional reasons, that they had never learned to drive or were still learning (Tables 5.3 and 5.5). This, together with the finding that not liking driving was a common main reason among 22-24 and 25-30 year olds (Table 5.3), as well as Raimond and Milthorpe’s (2010) similar finding in Sydney, suggests the emergence of a strong pattern of not driving at all, particularly among 25-30 year olds in Victoria. Further support comes from the majority of 25-30 year olds who indicated vehicle expenses and a preference for public transport (Tables 5.5 and 5.6), a finding that concurs with that of Schoettle and Sivak (2013) in the US. As well, recent increases in the numbers of Victorian 19-24 year olds obtaining licences for the first time as shown in Table 4.3 and Figure 4.3 suggest a growing tendency to delay obtaining licences. For as long as these young adults do not yet have a licence, they, too, will be choosing other modes of travel.
In sum, the reviewed literature, the analysis of Victorian licensing data and the survey of young Australian non-drivers collectively point to a pattern of changing travel mode choice among young adults. This changing pattern is characterised by various broad-level and individual-level factors influencing an increasing number of young adults in choosing not to acquire a driver’s licence and in preferring alternative transport mode choices, particularly public transport. It is likely that many young licensed drivers are also increasing their use of alternative transport modes as complements to their driving. It is pertinent now to consider the broader implications of these changing patterns.
6.3 Implications of young adults’ changing choices of travel modeAlthough the present study, in common with several other studies, points to a continuing pattern of licensing decline among young adults in Victoria, it is not certain to what extent this might be indicative of trends over the coming decades. In particular, it is not so far known if the present generation of young adults who do not drive will tend to maintain this choice as they get older, or if they will adopt transport mode choices more traditionally associated with middle adulthood and raising a family (Delbosc & Currie, 2013a, 2013b; Sigururðardóttir et al., 2014a), which are often more car-reliant. Added to this is evidence of a declining need, if not desire, to travel per se, particularly in light of trends such as the rising popularity of teleworking (Pirdavani, et al., 2014), which ultimately serve to reduce overall vehicle-kilometres travelled.
As previously outlined in section 3.3, there are wide ranging implications for declines in licensing and car use, such as reduced road infrastructure revenue and costs, reduced traffic congestion, environmental benefits and reduced road deaths and injuries (Dutzik et al., 2014). However, the implications also extend to better planning of public transport services to meet increases in patronage, and safer infrastructure for cycling, motorcycling and walking, as discussed in section 3.3. Increased use of public transport in Australia (Richardson & Elaurant, 2013) as opposed to car use can be presumed to lead to reduced road crashes, considering that public transport is one of the safest modes of travel (NSC, 2011). By contrast, cyclists, motorcyclists and pedestrians are vulnerable road users, so any increased preferences for these travel modes will lead to increased road trauma unless those modes are made much safer (Moeinaddini et al., 2015).
It is important to note that the licensing decline found among young drivers in Victoria was not part of any broader pattern of decline, as Table 4.2 and Figure 4.2 reveal that licence rates among middle age drivers have been fairly static since 2001 while the rates for drivers aged 50 and over have been rising. In Appendix C, the data used to construct Table 4.2 and Figure 4.2 were reconfigured to construct charts focussing on the age-mix of drivers in
Young adult licensing trends and travel modes 35
2014 compared to 2001. These charts show that, out of all licensed drivers in Victoria, the proportion aged 51 and over grew from 33% in 2001 to 40% in 2014 while the proportion of the driving population aged 18-30 fell from 24% to 21% over the same period. It is a moot point as to what extent these licensing trends may persist; however out of Australia’s population, the ABS has projected that, over the next fifty years, the proportion of 15-29 year olds will decline, while the proportion aged 65 and over will rise from 14% in 2012 to between 22.4% and 24.6%. Consequently, within the coming decades it is conceivable that at least a half, if not more, of the country’s drivers will be aged over 50, with a great many in that group aged 65 plus.
Assuming that the Victorian licensing trends and population trends persist into the future, several implications for road safety can be suggested, fortunately mainly positive ones. First, a trend for fewer young Victorians being licensed as drivers will mean reduced overall young driver exposure to the road, which should bring fewer crashes involving young drivers and their passengers. However, these benefits may be limited by the extent to which these young people become vulnerable road users in other modes of transport.
Second, even with a trend for fewer young drivers on the road, young drivers by virtue of their inexperience will continue to be disproportionally represented in road tolls. Hence, GLS systems that support young drivers while they gain experience will continue to be paramount.
Third, many of the measures designed to improve the safety of older drivers will ultimately improve the safety of all drivers, including young drivers. These measures include, for example, improvements in the visibility of road signage and intersection signal phasing that acknowledges slower judgement in entering traffic streams.
Fourth, for all drivers, but particularly young drivers, the road system will increasingly be occupied by older drivers as well as the infrastructure improvements designed to better accommodate them. A growing prominence of older drivers may help many drivers become more understanding of older drivers’ needs and abilities, particularly if this is supported by appropriate content in driver training and education programs with respect to safely sharing use of the road (US Department of Transportation, 2015).
Fifth, although the survey shows some young adults say they never intend to take up driving, Table 4.3 and Figure 4.3 suggest that, for various reasons, some young adults who intend to obtain licences are deferring that action for a few years. When these young adults do obtain their licences, they will be older and likely more mature in their driving outlook (Williams, 2011; Langley et al., 2012), which will also contribute to lowering young driver crash involvement.
Finally, for those young people who choose never to get a licence, along with those who delay obtaining licences, and those who are increasingly complementing their driving with alternative travel modes, it will be necessary to continue to provide measures that improve the safety of vulnerable road users.
6.4 Road safety conclusionsThe literature reviewed in this study, the licence data analysis and the survey findings collectively indicate changing preferences among many young adults to be less car reliant (whether or not they are licensed to drive), and more willing to use alternative transport modes. In sum, the road safety implications of these trends include:
• reduced overall exposure to the road by young drivers, contributing to reductions in road crashes, deaths and injuries;
• a continuing need for a GLS system that both protects young drivers as they accumulate experience (as those who do drive are likely to continue to be disproportionally represented in crashes); as well as a GLS system that extends across the late teens into the early 20s to protect those who choose to delay getting a licence;
• a declining proportion of young drivers will be participating in an age-mix of drivers and an associated road system that will increasingly comprise road users aged over 50, many of them elderly;
• a need for increased provision of safe and appealing infrastructure for alternative transport modes, such as public transport, but particularly for those who prefer to cycle, motorcycle or walk, in view of their heightened vulnerability as road users.

RACV Research Report 15/0136
Young adult licensing trends and travel modes 37
While this study and the work of Delbosc and Currie (2012-2014) has identified patterns of licensing decline among young Victorian adults, along with increasing preferences for alternative transport modes, there has been very little by way of systematic consideration of the road safety implications of these patterns. To more fully inform such a consideration, the following areas are recommended for further research, preferably in a national context:
1. The extent to which licensing decline among young adults exists in other Australian jurisdictions, especially in relation to urban versus rural localities.
2. The extent to which licensing decline among young adults is reflected in other measures of their road exposure, such as vehicle registrations by age of owner.
3. The extent to which young adults may be delaying or deferring obtaining licences and their reasons for doing so.
4. The prevalence of young adults who choose to not drive despite holding a valid driver’s licence.
5. The range of reasons young adults, both male and female, give for not driving and factors of influence on those reasons.
6. The non-car driving travel modes chosen by young adults (namely public transport, cycling, motorcycling and walking) and their reasons for doing so.
7. The reasons why drivers, particularly young drivers, obtain a licence in the first place.
Recommendations for further research7

RACV Research Report 15/0138

Young adults licensing trends and travel modes 39
Aretun, Å., & Nordbakke, S. (2014). Developments in driver’s licence holding among young people: potential explanations, implications and trends. VTI Rapport 824A. VTI, Linköping, Sweden.
Arnold, T. (2014). Cycling safety in Australia. Journal of the Australasian College of Road Safety, 25(4), 40-43.
Asad, F., H., A. (2013). City centres: Understanding the travel behaviour of residents and the implications for sustainable travel. Unpublished doctoral dissertation, University of Salford, Salford, United Kingdom.
Australian Bureau of Statistics (ABS). (2008). Locations of Work. Report 6275.0. ABS, Canberra.
Australian Bureau of Statistics (ABS). (2012). Population projections, Australia, 2012 (base) to 2101. Report 3222.0. ABS, Canberra.
Australian Bureau of Statistics (ABS). (2013). Population by Age and Sex, Regions of Australia, 2013. Report 3235.0. ABS, Canberra.
Australian Transport Council (ATC). (2011). National Road Safety Strategy 2011-2020, ATC, Canberra.
Berrington, A. & Mikolai, J. (2014). Young adults’ licence holding and driving behaviour in the UK: Full findings. RAC Foundation, London.
Blumenberg, E., Taylor, B., Smart, M., Ralph, K., Wander, M. & Brumbaugh, S. (2012). What’s youth got to do with it? Exploring the travel behaviour of teens and young adults. Institute of Transportation Studies, Lewis Center for Regional Policy Studies and UCLA Luskin School of Public Affairs, Michigan.
Blumenberg, E., Wander, M., Taylor, B. D. & Smart, M. (2013). The times, are they a-changin’? Youth, travel mode, and the journey to work. Transportation Research Board 92nd Annual Meeting, Washington DC.
Candappa, N., Stephan, K., Fotheringham, N., Lenné, M., & Corben, B. (2014). Raised crosswalks on entrance to the roundabout∼ A case study on effectiveness of treatment on pedestrian safety and convenience. Traffic Injury Prevention 15(6), 631-639.
CISCO. (2011). Cisco Connected World Technology Report. The Future of Work: Information Access Expectations, Demands and Behavior of the World’s Next Generation Workforce. CISCO, SanJose, California.
Curry, A. E., Pfeiffer, M. R., Durbin, D. R., Elliott, M. R. & Kim, K. H. (2014). Young driver licensing in New Jersey: Rates and trends, 2006-2011. AAA Foundation for Traffic Safety, Washington DC.
Curry, A. E., Pfeiffer, M. R., Durbin, D. R., Elliott, M. R. & Kim, K. H. (2015). Young driver licensing: Examination of population-level rates using New Jersey’s state licensing base. Accident Analysis and Prevention 76, 49-56.
Davis, B., Dutzik, T. & Baxandall, P. (2012). Transportation and the new generation: Why young people are driving less and what it means for transportation policy. Frontier Group, California.
Delbosc, A., & Currie, G. (2012). Using online discussion forums to study attitudes towards cars and transit among young people in Victoria. 35th Australian Transport Research Forum, 26-28 September, Perth.
Delbosc, A., & Currie, G. (2013a). Causes of youth licensing decline: A synthesis of evidence. Transport Reviews, 33(3), 271-290.
Delbosc, A., & Currie, G. (2013b). Exploring attitudes of young adults towards cars and driver licensing. In Proceedings of Australian Transport Research Forum 2013, 2-4 October, Brisbane.
Delbosc, A., & Currie, G. (2013c). Investigating attitudes toward cars among young people using online discussion forums. Transportation Research Board 92nd Annual Meeting, Washington DC.
Delbosc, A., & Currie, G. (2013d). Are changed living arrangements influencing youth driver license decline? Transportation Research Board 92nd Annual Meeting, Washington DC.
Delbosc, A., & Currie, G. (2014). Changing demographics and young adult driver license decline in Melbourne, Australia (1994–2009). Transportation, 41(3), 529-542.
Dutzik, T., Inglis, J. & Baxandall, P. (2014). Millennnials in motion: Changing travel habits of young Americans and
References
RACV Research Report 15/0140
the implications for public policy. US PIRG Education Fund Frontier Group, Washington DC.
Dutzik, T., Masen, T. & Baxandall, P. (2013). A new way to go: The transportation apps and vehicle-sharing tools that are giving more Americans the freedom to drive less. US PIRG Education Fund Frontier Group, Washington DC.
Forward, S., Aretun, Å., Enström, I., Nolén, S. & Börjesson, J. (2010). Young people’s attitudes toward acquiring a driver’s license. VTI report 694/2010. Linköping: The Swedish National Road and Transport Institute (VTI).
Foss, R., Masten, S. & Masten, C. (2014). Examining the safety implications of later licensure: Crash rates of older vs. younger novice drivers before and after graduated driver licensing. Washington DC: AAA Foundation for Traffic Safety.
George Institute. (2014). Young Driver Factbase. Retrieved on 3 November 2014 from: http://www.youngdriverfactbase.com/key-statistics/
Goodwin, P., & Van Dender, K. (2013). ‘Peak Car’—Themes and Issues. Transport Reviews, 33(3), 243-254.
Government of Victoria. (2005). Young Driver Safety and Graduated Licensing Discussion Paper. State Government of Victoria and VicRoads: Melbourne.
Government of Victoria. (2010). Graduated Licensing for Motorcyclists ― A discussion paper. State Government of Victoria and VicRoads: Melbourne.
Greenfield, A. (2014). Helsinki’s ambitious plan to make car ownership pointless in 10 years. The Guardian, 10 July.
Grimsrud, M., & El-Geneidy, A. (2013). Driving transit retention to renaissance: trends in Montreal commute public transport mode share and factors by age group and birth cohort. Public Transport, 5(3), 219-241.
Grimsrud, M., & El-Geneidy, A. (2014). Transit to eternal youth: lifecycle and generational trends in Greater Montreal public transport mode share. Transportation, 41(1), 1-19.
Healy, D., Catchpole, J., Harrison, W. (2012). Victoria’s Graduated Licensing System Evaluation Interim Report. Internal report prepared for VicRoads. Melbourne:VicRoads.
Hopkins, D., & Stephenson, J. (2014). Generation Y mobilities through the lens of energy cultures: a preliminary exploration of mobility cultures. Journal of Transport Geography, 38, 88-91.
Kronenberg, T. (2010). Dematerialisation of consumption: A win-win strategy? MPRA paper No. 25704. Munich. Retrieved on 27 October 2014 from: http://mpra.ub.uni-muenchen.de/25704/1/MPRA_paper_25704.pdf
Kuhnimhof, T., Armoogum, J., Buehler, R., Dargay, J., Denstadli, J. M., & Yamamoto, T. (2012a). Men shape a downward trend in car use among young adults—evidence from six industrialized countries. Transport Reviews, 32(6), 761-779.
Kuhnimhof, T., Buehler, R., Wirtz, M., & Kalinowska, D. (2012b). Travel trends among young adults in Germany: increasing multimodality and declining car use for men. Journal of Transport Geography, 24, 443-450.
Kuhnimhof, T., Zumkeller, D., & Chlond, B. (2013). Who made peak car, and how? A breakdown of trends over four decades in four countries. Transport Reviews, 33(3), 325-342.
Langley, J., Begg, D., Brookland, R., Samaranayaka, A., Jordan, H. & Davie, G. (2012). Non progression though graduated driver licensing: Characteristics, traffic offending and reasons for non progression. Traffic Injury Prevention 13(1), 7-13.
Le Vine, S., & Polak, J. (2014). Factors associated with young adults delaying and forgoing driving licences: Results from Britain. Traffic Injury Prevention 15, 794-800.
Licaj, I., Haddak, M., Pochet, P., & Chiron, M. (2012). Individual and contextual socioeconomic disadvantages and car driving between 16 and 24years of age: a multilevel study in the Rhône. Journal of Transport Geography, 22, 19-27.
Line, T., Chatterjee, K., & Lyons, G. (2010). The travel behaviour intentions of young people in the context of climate change. Journal of Transport Geography, 18(2), 238-246.
Line, T., Chatterjee, K., & Lyons, G. (2012). Applying behavioural theories to studying the influence of climate change on young people’s future travel intentions. Transportation Research Part D: Transport and Environment, 17(3), 270-276.
Litman, T. (2010). Evaluating Public Transportation Health Benefits. Victoria Transport Policy Institute: Victoria, British Columbia.
Young adult licensing trends and travel modes 41
Marzoughi, R. (2011). Teen travel in the Greater Toronto Area: A descriptive analysis of trends from 1986 to 2006 and the policy implications. Transport Policy, 18(4), 623-630.
Masten, S. V., Foss, R. D., & Marshall, S. W. (2011). Graduated driver licensing and fatal crashes involving 16-to 19-year-old drivers. Journal of the American Medical Association, 306(10), 1098-1103.
Metz, D. (2013). Peak car and beyond: The fourth era of travel. Transport Reviews, 33(3), 255-270.
Moeinaddini, M., Asadi-Shekari, Z., Sultan, Z., & Shah, M. Z. (2015). Analyzing the relationships between the number of deaths in road accidents and the work travel mode choice at the city level. Safety Science, 72, 249-254.
Monsere, C. M., McNeil, N., & Dill, J. (2012). Multiuser perspectives on separated, on-street bicycle infrastructure. Transportation Research Record: Journal of the Transportation Research Board, 2314(1), 22-30.
Mortimer, R. (2014) Mode shift to pedestrian and cyclist usage: A coordinated approach. In proceedings, Australian Institute of Traffic Planning and Management National Conference (AITPM 2014).
National Safety Council (NSC). (2011). Injury Facts. 2011 edition. National Safety Council: Itasca, Illinois.
Nuworsoo, C., Cooper, E., Cushing, K., & Jud, E. (2012). Integration of Bicycling and Walking Facilities into the Infrastructure of Urban Communities. Report 11-05. Mineta Transportation Institute, San José State University: California.
Pirdavani, A., Bellemans, T., Brijs, T., Kochan, B., & Wets, G. (2014). Assessing the road safety impacts of a teleworking policy by means of geographically weighted regression method. Journal of transport geography, 39, 96-110.
Pulugurtha, S. S., Vasudevan, V., Nambisan, S. S., & Dangeti, M. R. (2012). Evaluating effectiveness of infrastructure-based countermeasures for pedestrian safety. Transportation Research Record: Journal of the Transportation Research Board, 2299(1), 100-109.
Raimond, T. & Milthorpe, F. (2010). Why are young people driving less? Trends in licence-holding and travel behaviour. In Proceedings of Australasian Transport Research Forum, 29 September – 1 October, Canberra.
Reid, S. & Adams, S. (2011). Infrastructure and cyclist safety. Final Project Report PPR580. Wokingham, UK: Transport Research Laboratory.
Richardson, E. & Elaurant, S. (2013). Declining car use – it’s implications for the transport network. Australian Institute of Traffic Planning and Management 2013 National Conference, Perth.
Richardson, E. & Weaver, K. (2013). A plan to move the mode share of cycling in Perth to six per cent. Australian Institute of Traffic Planning and Management 2013 National Conference, Perth.
Royal Automobile Club of Queensland (RACQ). (2014). How old is too old to learn? Retrieved on 2 May 2014 from: www.racq.com.au/about_us/news_and_community/news_andmedia/stories/how_old_is_too_old_to_learn?/
Savage, I. (2013). Comparing the fatality risks in United States transportation across modes and over time. Research in Transportation Economics, 43(1), 9-22.
Schweiterman, J. P. (2011). The travel habits of Gen Y. Planning, May/June, 30-33.
Sigurðardóttir, S. B., Kaplan, S., & Møller, M. (2014a) Gender differences in the travel behaviour of adolescents and young adults in Denmark. Transport Research Arena, Paris.
Sigurðardóttir, S. B., Kaplan, S., & Møller, M. (2014b). The motivation underlying adolescents∼ intended time-frame for driving licensure and car ownership: A socio-ecological approach. Transport Policy, 36, 19-25.
Sigurðardóttir, S. B., Kaplan, S., & Møller, M. (2014c). ‘Now or later?’ Understanding adolescents’ time-frame for their intentions to obtain a driving license and own a car. In proceedings, Transport Research Arena 2014, Paris.
Sivak, M. (2014). Has Motorization in the US Peaked? Part 5: Update Through 2012. UMTRI-2014-11. Michigan: University of Michigan Transportation Research Institute.
Sivak, M. & Schoettle, B. (2012a). Recent changes in the age composition of drivers in 15 countries. Traffic Injury Prevention, 13(2), 126-132.
Sivak, M. & Schoettle, B. (2012b). Update: Percentage of young persons with a driver’s license continues to drop. Traffic Injury Prevention, 13, 341.
Schoettle, B. & Sivak, M. (2013). The Reasons for the Decline in Young Driver Licensing in the U.S. Report No. UMTRI-2013-22, Transportation Research Institute, The University of Michigan, Michigan.
RACV Research Report 15/0142
Staplin, L., & Freund, K. (2013). Policy prescriptions to preserve mobility for seniors—A dose of realism. Accident Analysis & Prevention, 61, 212-221.
Stokes, G. (2012). Has car use per person peaked? Age, gender and car use. Presentation to Transport Statistics Users Group on Peak Car. London.
Strang, P. & Mead, C. (2013). Changing cities, changing modes – transport choices for the 21st century. In proceedings, Australian Institute of Traffic Planning and Management National Conference (AITPM 2013).
Taylor, J., Bernard, M., White, C., & Lewis, J. (2007). Understanding the travel aspirations, needs and behaviour of young adults. United Kingdom: Department for Transport.
Taylor, B., Ralph, K., Blumenberg, E. & Smart, M. (2013). Who knows about kids these days? Analyzing the determinants of youth and adult mobility between 1990 and 2009. Transportation Research Board 92nd Annual Meeting, Washington DC.
Tefft, B. C., Williams, A. F. & Grabowski, J. G. (2013). Timing of Driver’s License Acquisition and Reasons for Delay among Young People in the United States, 2012. AAA Foundation for Traffic Safety, Washington DC.
Thakuriah, P. V., Menchu, S., & Tang, L. (2010). Car ownership among young adults. Transportation Research Record: Journal of the Transportation Research Board, 2156(1), 1-8.
Thompson, D. & Weissmann, J. (2012). The cheapest generation. The Atlantic, September.
TransitCenter. (2014). Who’s on board: 2014 mobility attitudes survey. TransitCenter, New York. Retrieved on 24 September 2014 from:
http://transitcenter.org/wp-content/uploads/2014/08/WhosOnBoard2014-ForWeb.pdf
Tuttle, B. (2012). The car debate: Do Millennials really want cars or not? TIME, 9th August.
Tuttle, B. (2013). Will Millennials change how cars are bought and sold? TIME, 9th August.
US Department of Transportation Federal Highway Administration (FHWA). (2015). Beyond Traffic 2045 Trends and Choices. Draft report. Retrieved on 31 March 2015 from: http://www.dot.gov/BeyondTraffic
van Dender, K., & Clever, M. (2013). Recent Trends in Car Usage in Advanced Economies–Slower Growth Ahead? International Transport Forum Discussion Paper 2013-09. Paris: OECD.
van der Waard, J., Immers, B., & Jorritsma, P. (2012). New drivers in mobility: What moves the Dutch in 2012 and beyond?. International Transport Forum Discussion Paper 2012-15. Paris: OECD.
Ward, A. L., Baggett, T., Orsini, A., Angelo, J., & Weiss, H. (2014). Participatory photography gives voice to young non-drivers in New Zealand. Health Promotion International Dec18, 1-10.
Weissenfeld, A., Baldock, M. F. & Hutchinson, P. (2011). Analysis of trends over time for motorcycle crashes in South Australia. Australasian Road Safety Research, Policing and Education Conference, 6-11 November, Perth.
Williams, A. F. (2011). Teenagers’ licensing decisions and their views of licensing policies: a national survey. Traffic Injury Prevention, 12(4), 312-319.
Williams, A. F., Tefft, B. C. & Grabowski, J. G. (2012). Graduated driver licensing research, 2010 - present. Journal of Safety Research 43, 195-203.
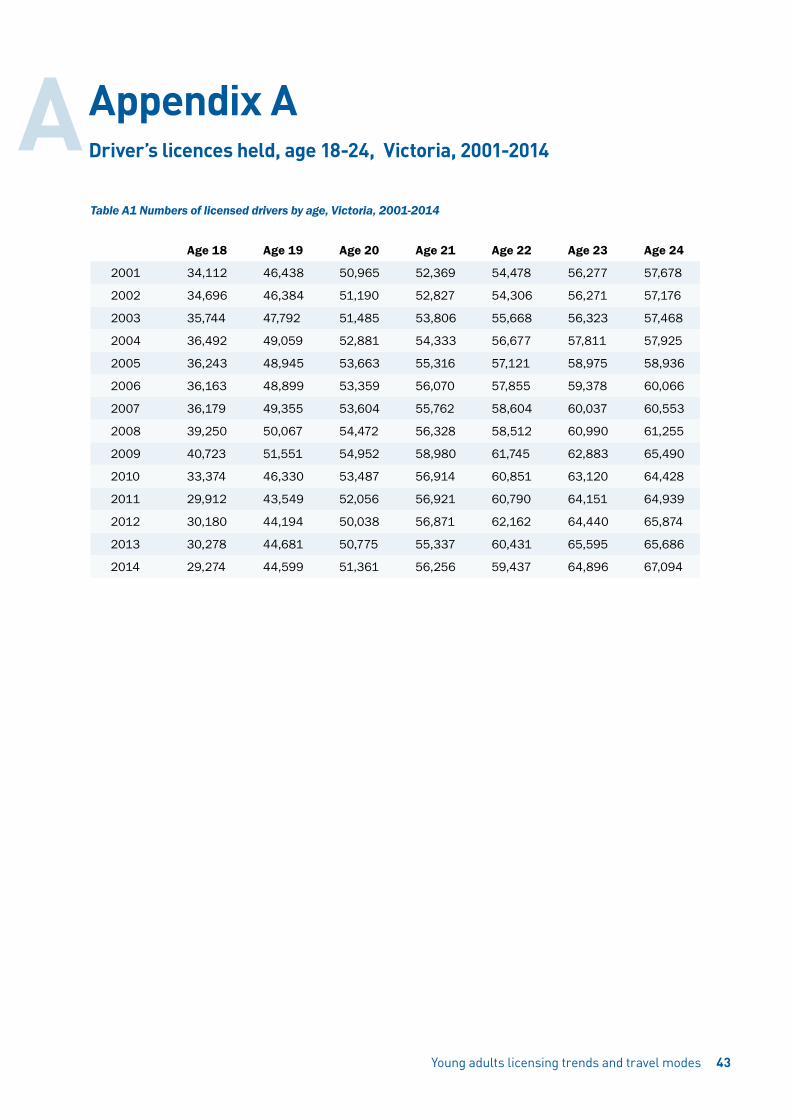
Table A1 Numbers of licensed drivers by age, Victoria, 2001-2014
Age 18 Age 19 Age 20 Age 21 Age 22 Age 23 Age 24
2001 34,112 46,438 50,965 52,369 54,478 56,277 57,678
2002 34,696 46,384 51,190 52,827 54,306 56,271 57,176
2003 35,744 47,792 51,485 53,806 55,668 56,323 57,468
2004 36,492 49,059 52,881 54,333 56,677 57,811 57,925
2005 36,243 48,945 53,663 55,316 57,121 58,975 58,936
2006 36,163 48,899 53,359 56,070 57,855 59,378 60,066
2007 36,179 49,355 53,604 55,762 58,604 60,037 60,553
2008 39,250 50,067 54,472 56,328 58,512 60,990 61,255
2009 40,723 51,551 54,952 58,980 61,745 62,883 65,490
2010 33,374 46,330 53,487 56,914 60,851 63,120 64,428
2011 29,912 43,549 52,056 56,921 60,790 64,151 64,939
2012 30,180 44,194 50,038 56,871 62,162 64,440 65,874
2013 30,278 44,681 50,775 55,337 60,431 65,595 65,686
2014 29,274 44,599 51,361 56,256 59,437 64,896 67,094
Young adults licensing trends and travel modes 43
Appendix A Driver’s licences held, age 18-24, Victoria, 2001-2014A

RACV Research Report 15/0144
PARTICIPANT INFORMATION SHEET
Who is undertaking the project?
This project is being conducted by Dr Trevor Bailey at the University of Adelaide, South Australia.
Why am I being invited to participate?
You are invited to participate as you are a resident of Australia aged between 18 and 30.
How much time will the survey take?
You should be able to complete the survey within 5 minutes.
What are the benefits of the research project?
Your responses will provide indications of the choices people in your age group are making about the ways they travel and the reasons given for those choices
Can I withdraw from the project?
Participation in this project is completely voluntary and anonymous. If you agree to participate, you can withdraw from the survey at any time, however once you have submitted responses you will not be able to withdraw them.
What will happen to my information?
The survey includes questions about your age, gender and postcode. No other personal details are requested. All responses and other project records will be stored electronically by the University of Adelaide for up to 7 years. The information will be kept confidential and will be accessible only to researchers involved in the project. The researchers will prepare a report on any overall trends found in young adults’ travel choices and reasons. It is expected in due course this report will be published and a summary made available at: http://casr.adelaide.edu.au/
Who do I contact if I have questions about the project?
If you have any questions about the project, you can contact one of the following:
Dr Trevor Bailey (phone number)
Dr Matthew Baldock (phone number)
Dr Lisa Wundersitz (phone number).
Appendix BSurvey of non-drivers aged 18-30B

Young adult licensing trends and travel modes 45
What if I have a complaint or any concerns?
The study has been approved by the Human Research Ethics Committee at the University of Adelaide (approval number H-2014-XXX). If you have questions or problems associated with the practical aspects of your participation in the project, or wish to raise a concern or complaint about the project, then you should consult the Principal Investigator named above.
Contact the Human Research Ethics Committee’s Secretariat on phone (08) XXX or by email if you wish to speak with an independent person regarding concerns or a complaint, the University’s policy on research involving human participants, or your rights as a participant. Any complaint or concern will be treated in confidence and fully investigated. You will be informed of the outcome.
If I want to participate, what do I do?
To participate in the survey, click on the NEXT button below to go to the survey consent form. On giving consent, the NEXT button on that screen will take you to the first survey question.
CONSENT FORM1. I have read the previous Participant Information Sheet and agree to take part in the following research project:
Are young adults’ ways of travelling changing?(Human Research Ethics Committee Approval Number: H-2014-XXX)
2. My consent is given freely.
3. I have been informed that, while information gained during the study may be published, I will not be identified and my personal results will not be divulged.
4. I understand that I am free to withdraw from the survey at any time.
5. I am aware that I can print a copy of this Consent Form, when completed, as well as the Participant Information Sheet (use the Print command on your internet browser).
If you agree to take part in the survey, please click the NEXT button below and you will be taken to the first survey question.
NEXT
1. Please choose which ONE of the following applies to you.
a) You currently have a driver or motorcycle licence (this includes a suspended or disqualified licence)
b) You currently have a probationary or provisional licence (including a suspended or disqualified licence)
c) You have a learner’s permit
d) You used to have a licence or learner’s permit but no longer have one
e) You have NEVER held a learner’s permit or driver’s licence
2. What is your age?
18
19
20
21
22
23

RACV Research Report 15/0146
24
25-30
31 or older
3. What is your postcode?
4. Are you:
Male
Female
Transgender/intergender/other
5. What is the MAIN reason you do not currently have a driver’s licence? Please select ONLY ONE main reason.
Can communicate and/or conduct work online instead
Able to get transport from others such as friends or family
Concerned about how driving can affect the environment
Disability, medical problem or vision problem
Do not like to drive or are afraid of driving
Legal issue
Never learned or are still learning to drive
Owning and maintaining a vehicle is too expensive
Prefer to walk
Prefer to cycle
Prefer to use public transport (bus, tram, train or taxi)
Too busy, too difficult, or not enough time to get a driver’s licence
I’m planning to get a licence when I’m older as the licensing rules will be different then
Other (please state)________________
6. Are there any additional reasons you do not currently have a driver’s licence? (Select all that apply).
No additional reasons
Can communicate and/or conduct work online instead
Able to get transport from others such as friends or family
Concerned about how driving can affect the environment
Disability, medical problem or vision problem
Do not like to drive or are afraid of driving
Legal issue
Never learned or are still learning to drive
Owning and maintaining a vehicle is too expensive
Prefer to walk
Prefer to cycle
Prefer to use public transport (bus, tram, train or taxi)
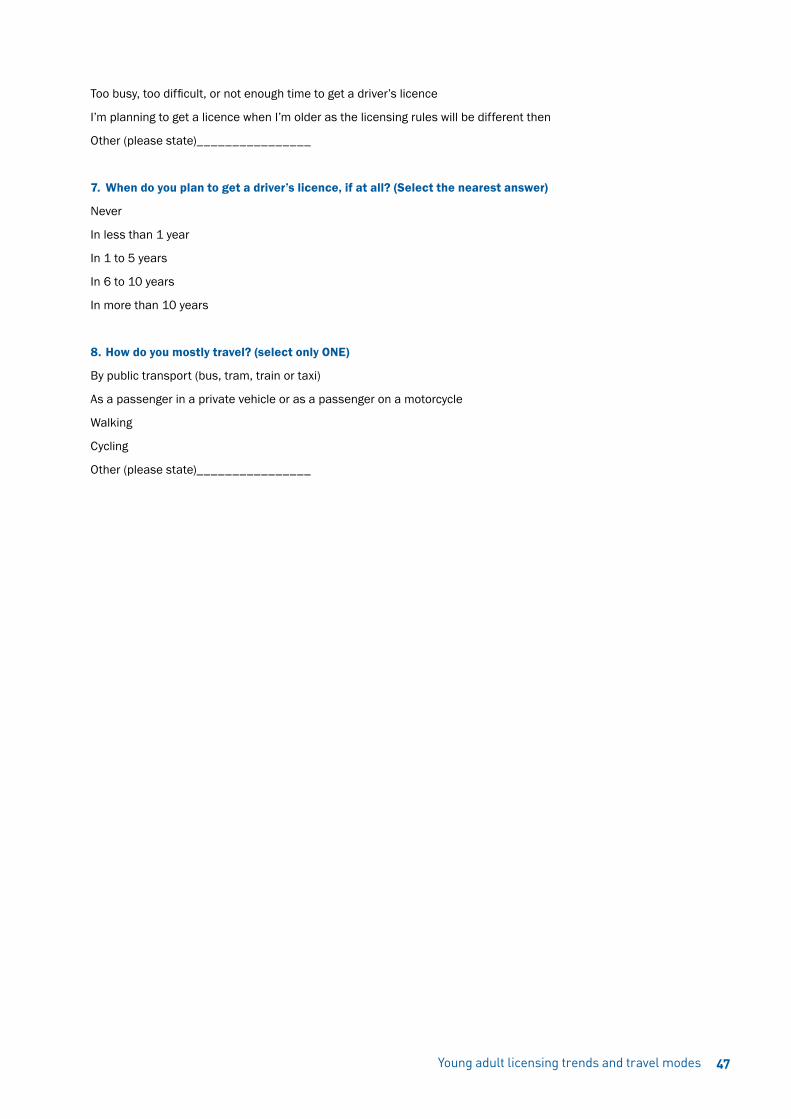
Young adult licensing trends and travel modes 47
Too busy, too difficult, or not enough time to get a driver’s licence
I’m planning to get a licence when I’m older as the licensing rules will be different then
Other (please state)________________
7. When do you plan to get a driver’s licence, if at all? (Select the nearest answer)
Never
In less than 1 year
In 1 to 5 years
In 6 to 10 years
In more than 10 years
8. How do you mostly travel? (select only ONE)
By public transport (bus, tram, train or taxi)
As a passenger in a private vehicle or as a passenger on a motorcycle
Walking
Cycling
Other (please state)________________

RACV Research Report 15/0148
Figure C1 Age-mix of drivers in Victoria 2001
Figure C2 Age-mix of drivers in Victoria 2014
Figures C1 and C2 show that, out of all licensed drivers in Victoria, the proportion aged 51 and over grew from 33% in 2001 to 40% in 2014, while the proportion of the driving population aged 18-30 fell from 24% to 21% over the same period.
Young adults licensing trends and travel modes 48
Appendix C Changing age-mix of drivers in VictoriaC


Royal Automobile Club of Victoria (RACV) LtdABN 44 004 060 833 550 Princes Highway Noble Park North Victoria 3174 Australia RACV MemberLine 13 RACV (13 7228)
racv.com.au