Embed Size (px)
Citation preview
1
René Biner Partner, Head Private Finance Dr. Michael Studer Managing Director, Risk Management
Partners Group Research Flash December 2010
Mezzanine Investments: Stability Through the Storm
Juri Jenkner Head London, René Biner Head Private Finance, Manuel Martiny Investment Solutions Germany
Partners Group Research Flash December 2010
Mezzanine Investments: Stability Through the Storm
2
EXECUTIVE SUMMARY
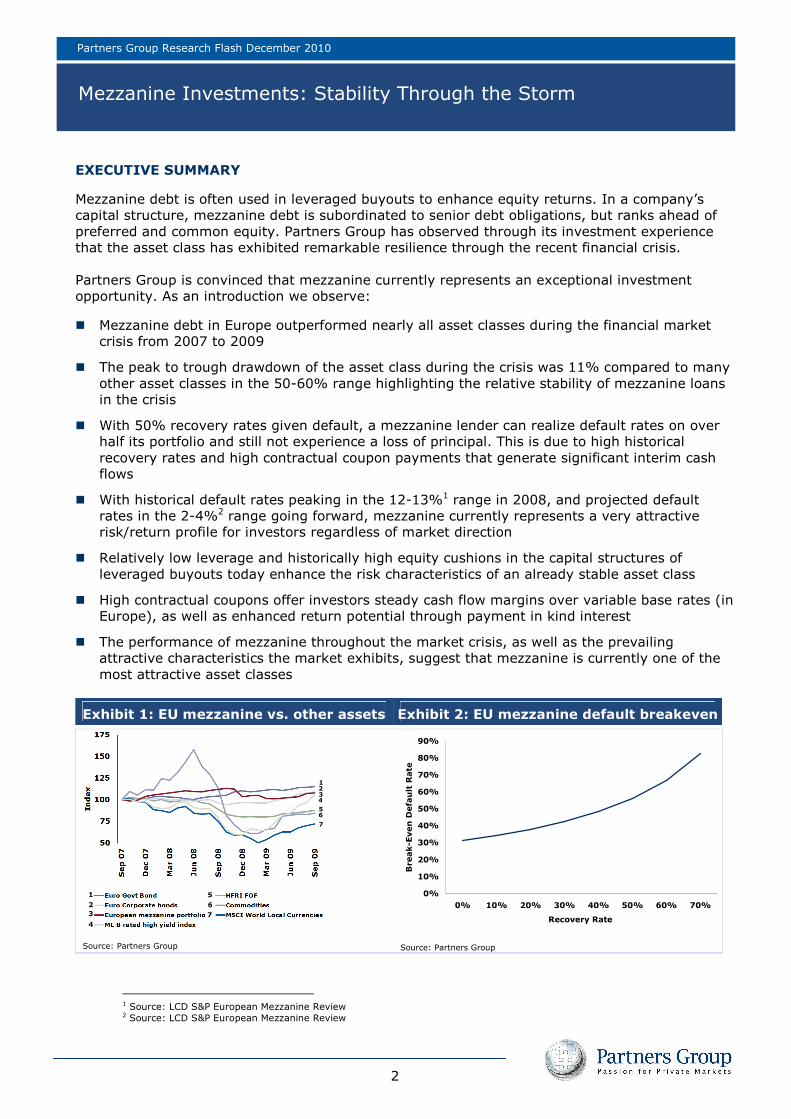
Mezzanine debt is often used in leveraged buyouts to enhance equity returns. In a company’s capital structure, mezzanine debt is subordinated to senior debt obligations, but ranks ahead of preferred and common equity. Partners Group has observed through its investment experience that the asset class has exhibited remarkable resilience through the recent financial crisis. Partners Group is convinced that mezzanine currently represents an exceptional investment opportunity. As an introduction we observe:
� Mezzanine debt in Europe outperformed nearly all asset classes during the financial market crisis from 2007 to 2009
� The peak to trough drawdown of the asset class during the crisis was 11% compared to many other asset classes in the 50-60% range highlighting the relative stability of mezzanine loans in the crisis
� With 50% recovery rates given default, a mezzanine lender can realize default rates on over half its portfolio and still not experience a loss of principal. This is due to high historical recovery rates and high contractual coupon payments that generate significant interim cash flows
� With historical default rates peaking in the 12-13%1 range in 2008, and projected default rates in the 2-4%2 range going forward, mezzanine currently represents a very attractive risk/return profile for investors regardless of market direction
� Relatively low leverage and historically high equity cushions in the capital structures of leveraged buyouts today enhance the risk characteristics of an already stable asset class
� High contractual coupons offer investors steady cash flow margins over variable base rates (in Europe), as well as enhanced return potential through payment in kind interest
� The performance of mezzanine throughout the market crisis, as well as the prevailing attractive characteristics the market exhibits, suggest that mezzanine is currently one of the most attractive asset classes
Exhibit 1: EU mezzanine vs. other assets Exhibit 2: EU mezzanine default breakeven
Source: Partners Group
0%
10%
20%
30%
40%
50%
60%
70%
80%
90%
0% 10% 20% 30% 40% 50% 60% 70%
Recovery Rate
Break-Even Default Rate
Source: Partners Group
1 Source: LCD S&P European Mezzanine Review 2 Source: LCD S&P European Mezzanine Review
1
2
3
4
5
6
7
1
6
3
5
4
2
7
Partners Group Research Flash December 2010
Mezzanine Investments: Stability Through the Storm
3
INTRODUCTION During the global financial crisis that emerged in the summer of 2007 and persisted through 2009, the vast majority of financial asset classes were significantly negatively impacted, including public equities, commodities, hedge funds, as well as high yield and investment grade corporate bonds and loans. However, the mezzanine debt asset class, although largely unnoticed in the broader markets context, held up well during the credit crisis. Mezzanine debt, a form of subordinated debt capital often used in leveraged buyout transactions ("LBOs") to enhance equity returns, is the primary focus of this analysis. In this research series, we first compare the development of various asset classes during the 24 month period starting in September 2007. Second, we will focus on the characteristics of European mezzanine investments in order to explain why these mezzanine investments have been able to partially decouple from the global market turmoil. Finally, we will touch on some of the benefits of the mezzanine asset class that have emerged in the current environment.
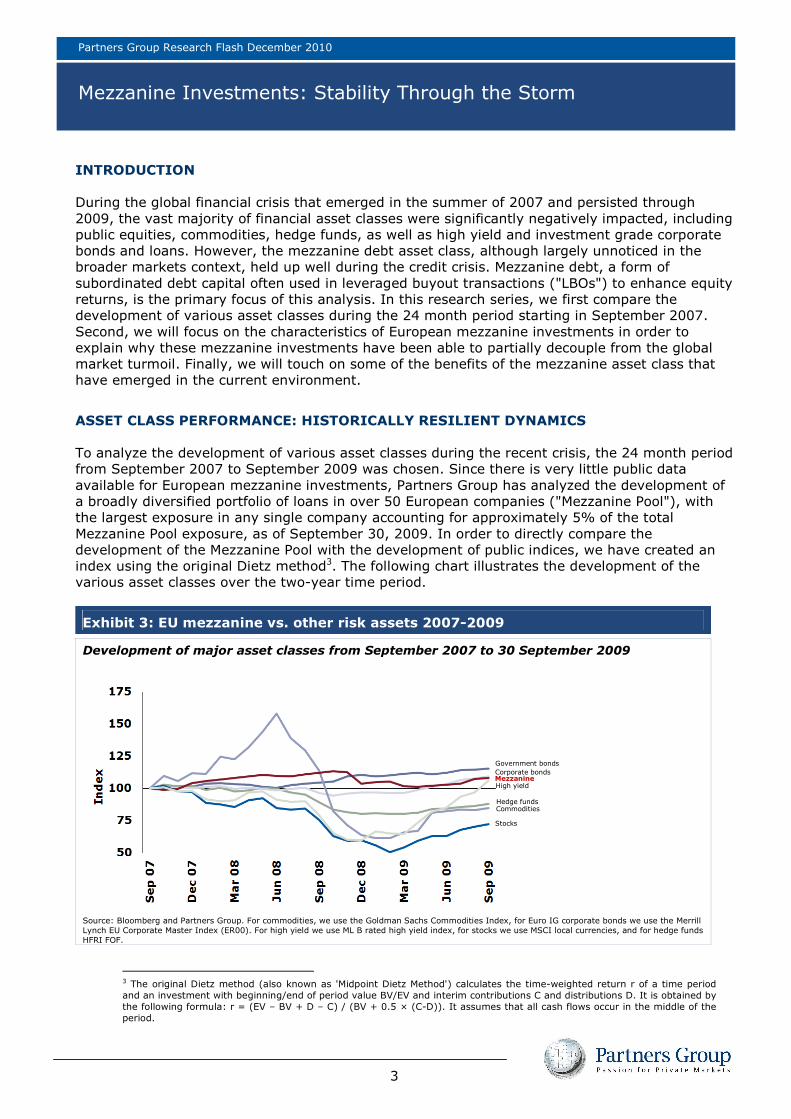
ASSET CLASS PERFORMANCE: HISTORICALLY RESILIENT DYNAMICS To analyze the development of various asset classes during the recent crisis, the 24 month period from September 2007 to September 2009 was chosen. Since there is very little public data available for European mezzanine investments, Partners Group has analyzed the development of a broadly diversified portfolio of loans in over 50 European companies ("Mezzanine Pool"), with the largest exposure in any single company accounting for approximately 5% of the total Mezzanine Pool exposure, as of September 30, 2009. In order to directly compare the development of the Mezzanine Pool with the development of public indices, we have created an index using the original Dietz method3. The following chart illustrates the development of the various asset classes over the two-year time period.
Exhibit 3: EU mezzanine vs. other risk assets 2007-2009
Development of major asset classes from September 2007 to 30 September 2009
Source: Bloomberg and Partners Group. For commodities, we use the Goldman Sachs Commodities Index, for Euro IG corporate bonds we use the Merrill Lynch EU Corporate Master Index (ER00). For high yield we use ML B rated high yield index, for stocks we use MSCI local currencies, and for hedge funds HFRI FOF.
3 The original Dietz method (also known as 'Midpoint Dietz Method') calculates the time-weighted return r of a time period and an investment with beginning/end of period value BV/EV and interim contributions C and distributions D. It is obtained by the following formula: r = (EV – BV + D – C) / (BV + 0.5 × (C-D)). It assumes that all cash flows occur in the middle of the period.
Government bonds
Corporate bonds Mezzanine High yield
Hedge funds Commodities
Stocks
Partners Group Research Flash December 2010
Mezzanine Investments: Stability Through the Storm
4
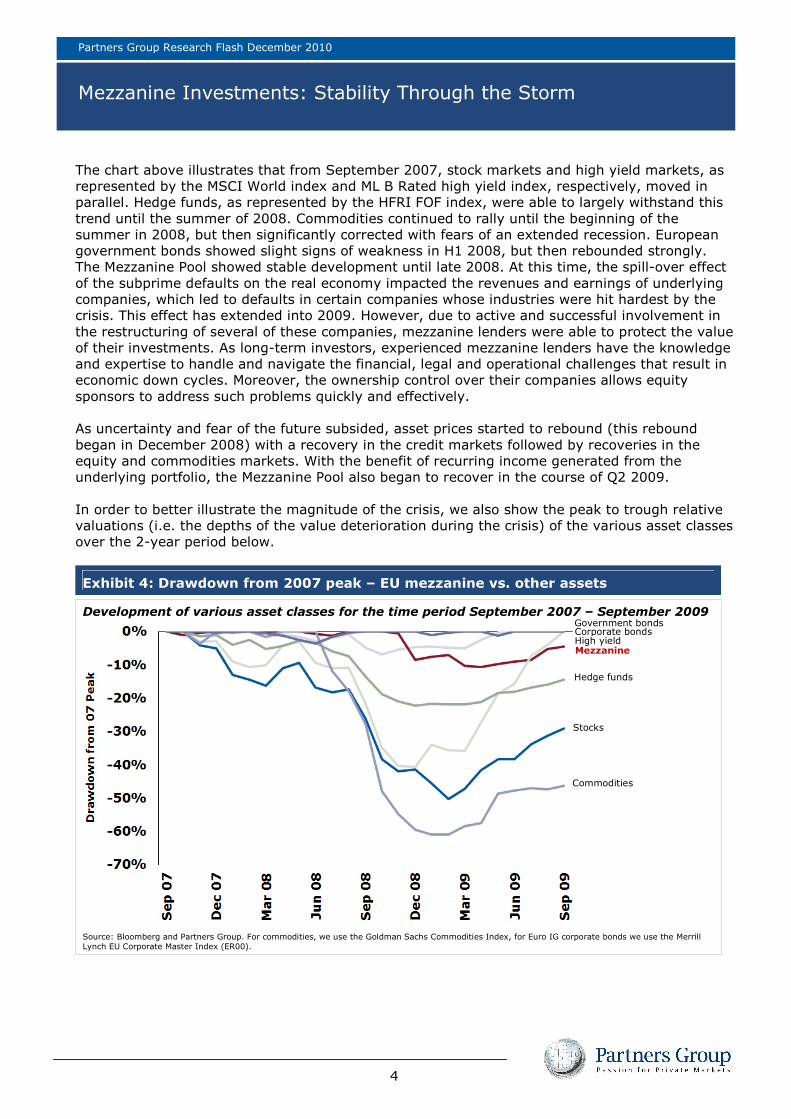
The chart above illustrates that from September 2007, stock markets and high yield markets, as represented by the MSCI World index and ML B Rated high yield index, respectively, moved in parallel. Hedge funds, as represented by the HFRI FOF index, were able to largely withstand this trend until the summer of 2008. Commodities continued to rally until the beginning of the summer in 2008, but then significantly corrected with fears of an extended recession. European government bonds showed slight signs of weakness in H1 2008, but then rebounded strongly. The Mezzanine Pool showed stable development until late 2008. At this time, the spill-over effect of the subprime defaults on the real economy impacted the revenues and earnings of underlying companies, which led to defaults in certain companies whose industries were hit hardest by the crisis. This effect has extended into 2009. However, due to active and successful involvement in the restructuring of several of these companies, mezzanine lenders were able to protect the value of their investments. As long-term investors, experienced mezzanine lenders have the knowledge and expertise to handle and navigate the financial, legal and operational challenges that result in economic down cycles. Moreover, the ownership control over their companies allows equity sponsors to address such problems quickly and effectively. As uncertainty and fear of the future subsided, asset prices started to rebound (this rebound began in December 2008) with a recovery in the credit markets followed by recoveries in the equity and commodities markets. With the benefit of recurring income generated from the underlying portfolio, the Mezzanine Pool also began to recover in the course of Q2 2009. In order to better illustrate the magnitude of the crisis, we also show the peak to trough relative valuations (i.e. the depths of the value deterioration during the crisis) of the various asset classes over the 2-year period below.
Exhibit 4: Drawdown from 2007 peak – EU mezzanine vs. other assets
Development of various asset classes for the time period September 2007 – September 2009
Source: Bloomberg and Partners Group. For commodities, we use the Goldman Sachs Commodities Index, for Euro IG corporate bonds we use the Merrill Lynch EU Corporate Master Index (ER00).
Government bonds
Mezzanine
Commodities
Stocks
Hedge funds
Corporate bonds High yield
Partners Group Research Flash December 2010
Mezzanine Investments: Stability Through the Storm
5
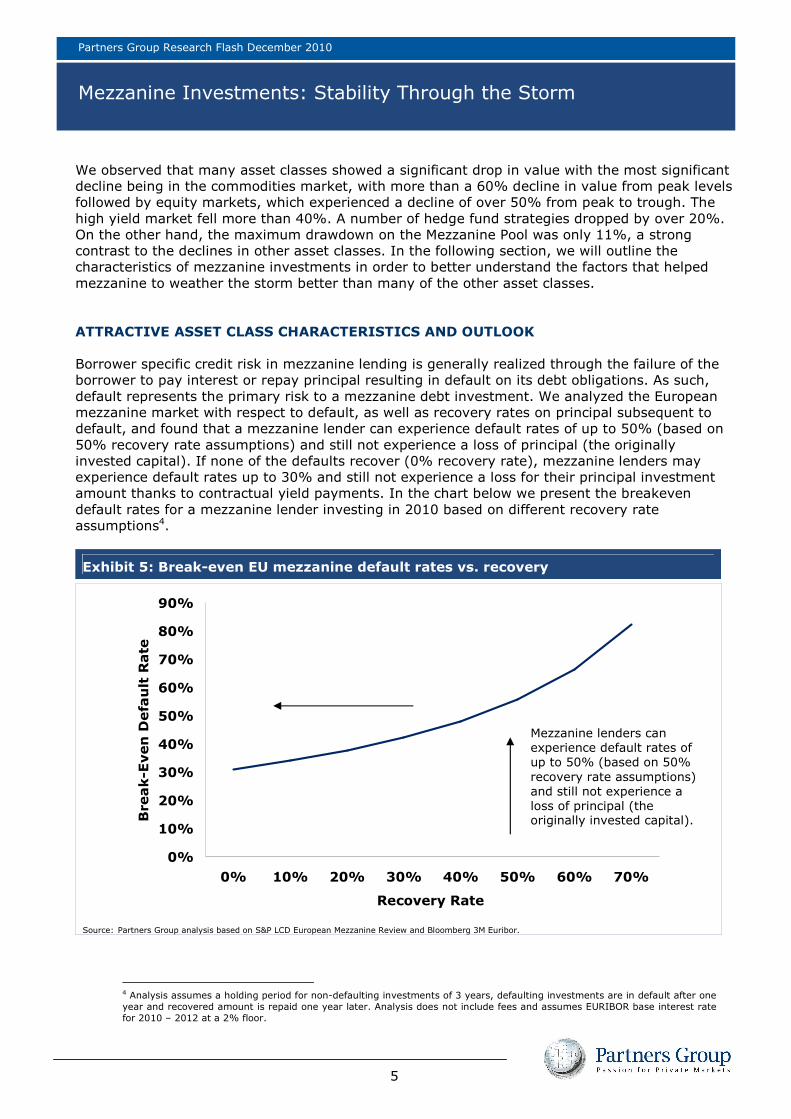
We observed that many asset classes showed a significant drop in value with the most significant decline being in the commodities market, with more than a 60% decline in value from peak levels followed by equity markets, which experienced a decline of over 50% from peak to trough. The high yield market fell more than 40%. A number of hedge fund strategies dropped by over 20%. On the other hand, the maximum drawdown on the Mezzanine Pool was only 11%, a strong contrast to the declines in other asset classes. In the following section, we will outline the characteristics of mezzanine investments in order to better understand the factors that helped mezzanine to weather the storm better than many of the other asset classes. ATTRACTIVE ASSET CLASS CHARACTERISTICS AND OUTLOOK Borrower specific credit risk in mezzanine lending is generally realized through the failure of the borrower to pay interest or repay principal resulting in default on its debt obligations. As such, default represents the primary risk to a mezzanine debt investment. We analyzed the European mezzanine market with respect to default, as well as recovery rates on principal subsequent to default, and found that a mezzanine lender can experience default rates of up to 50% (based on 50% recovery rate assumptions) and still not experience a loss of principal (the originally invested capital). If none of the defaults recover (0% recovery rate), mezzanine lenders may experience default rates up to 30% and still not experience a loss for their principal investment amount thanks to contractual yield payments. In the chart below we present the breakeven default rates for a mezzanine lender investing in 2010 based on different recovery rate assumptions4.
Exhibit 5: Break-even EU mezzanine default rates vs. recovery
0%
10%
20%
30%
40%
50%
60%
70%
80%
90%
0% 10% 20% 30% 40% 50% 60% 70%
Recovery Rate
Break-Even Default Rate
Source: Partners Group analysis based on S&P LCD European Mezzanine Review and Bloomberg 3M Euribor.
4 Analysis assumes a holding period for non-defaulting investments of 3 years, defaulting investments are in default after one year and recovered amount is repaid one year later. Analysis does not include fees and assumes EURIBOR base interest rate for 2010 – 2012 at a 2% floor.
Mezzanine lenders can experience default rates of up to 50% (based on 50% recovery rate assumptions) and still not experience a loss of principal (the originally invested capital).
Partners Group Research Flash December 2010
Mezzanine Investments: Stability Through the Storm
6
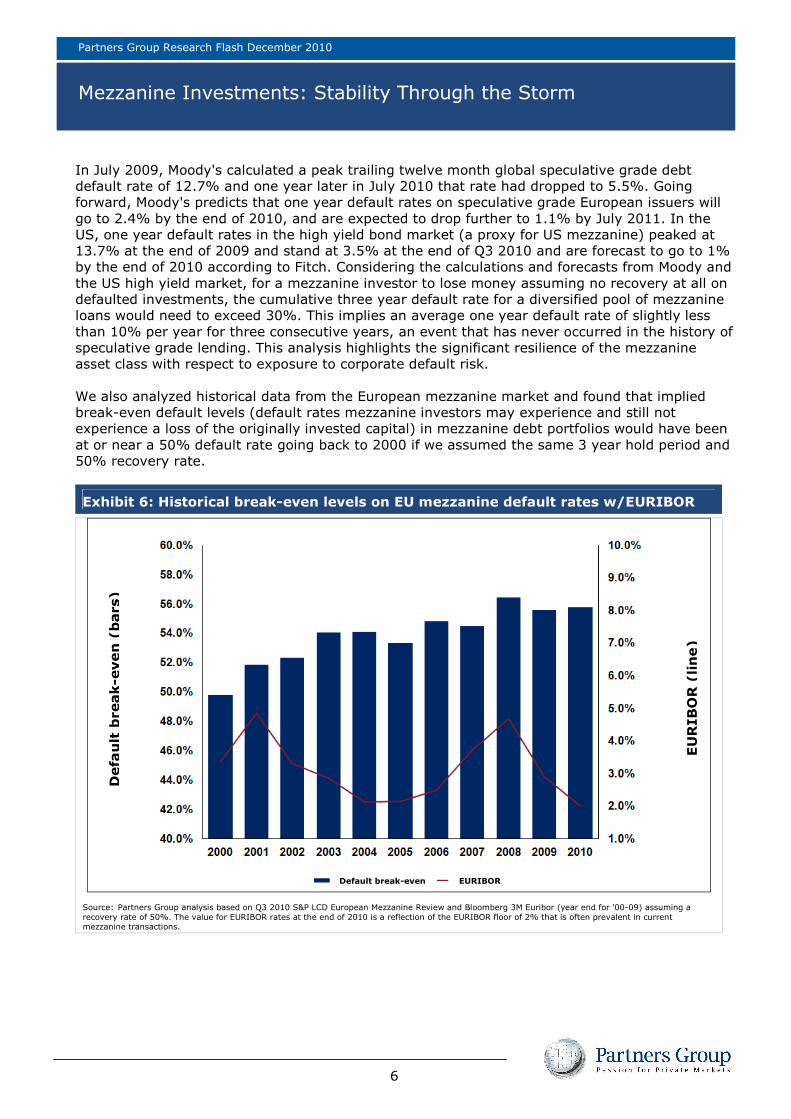
In July 2009, Moody's calculated a peak trailing twelve month global speculative grade debt default rate of 12.7% and one year later in July 2010 that rate had dropped to 5.5%. Going forward, Moody's predicts that one year default rates on speculative grade European issuers will go to 2.4% by the end of 2010, and are expected to drop further to 1.1% by July 2011. In the US, one year default rates in the high yield bond market (a proxy for US mezzanine) peaked at 13.7% at the end of 2009 and stand at 3.5% at the end of Q3 2010 and are forecast to go to 1% by the end of 2010 according to Fitch. Considering the calculations and forecasts from Moody and the US high yield market, for a mezzanine investor to lose money assuming no recovery at all on defaulted investments, the cumulative three year default rate for a diversified pool of mezzanine loans would need to exceed 30%. This implies an average one year default rate of slightly less than 10% per year for three consecutive years, an event that has never occurred in the history of speculative grade lending. This analysis highlights the significant resilience of the mezzanine asset class with respect to exposure to corporate default risk. We also analyzed historical data from the European mezzanine market and found that implied break-even default levels (default rates mezzanine investors may experience and still not experience a loss of the originally invested capital) in mezzanine debt portfolios would have been at or near a 50% default rate going back to 2000 if we assumed the same 3 year hold period and 50% recovery rate.
Exhibit 6: Historical break-even levels on EU mezzanine default rates w/EURIBOR
Source: Partners Group analysis based on Q3 2010 S&P LCD European Mezzanine Review and Bloomberg 3M Euribor (year end for '00-09) assuming a recovery rate of 50%. The value for EURIBOR rates at the end of 2010 is a reflection of the EURIBOR floor of 2% that is often prevalent in current mezzanine transactions.
Default break-even (bars)
EURIBOR (line)
Default break-even EURIBOR
Partners Group Research Flash December 2010
Mezzanine Investments: Stability Through the Storm
7
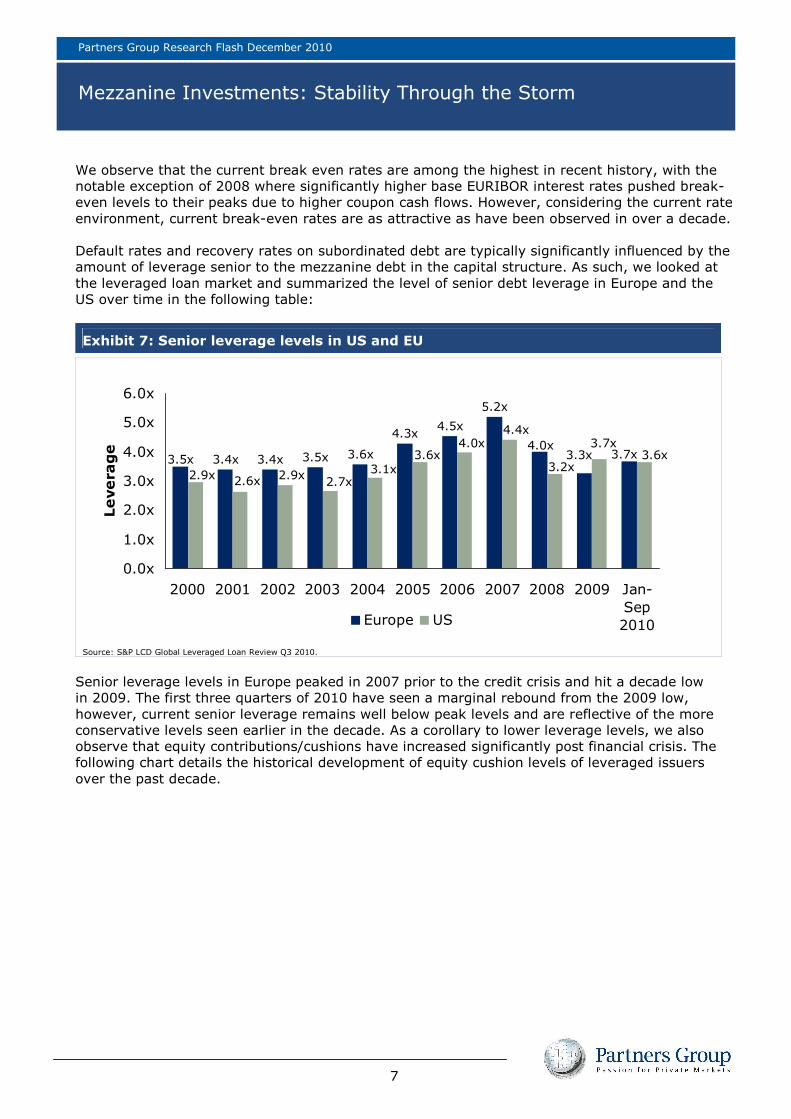
We observe that the current break even rates are among the highest in recent history, with the notable exception of 2008 where significantly higher base EURIBOR interest rates pushed break-even levels to their peaks due to higher coupon cash flows. However, considering the current rate environment, current break-even rates are as attractive as have been observed in over a decade. Default rates and recovery rates on subordinated debt are typically significantly influenced by the amount of leverage senior to the mezzanine debt in the capital structure. As such, we looked at the leveraged loan market and summarized the level of senior debt leverage in Europe and the US over time in the following table:
Exhibit 7: Senior leverage levels in US and EU
Source: S&P LCD Global Leveraged Loan Review Q3 2010.
Senior leverage levels in Europe peaked in 2007 prior to the credit crisis and hit a decade low in 2009. The first three quarters of 2010 have seen a marginal rebound from the 2009 low, however, current senior leverage remains well below peak levels and are reflective of the more conservative levels seen earlier in the decade. As a corollary to lower leverage levels, we also observe that equity contributions/cushions have increased significantly post financial crisis. The following chart details the historical development of equity cushion levels of leveraged issuers over the past decade.
3.4x 3.4x 3.5x 3.6x
4.3x4.5x
5.2x
4.0x3.5x 3.3x 3.7x
3.1x3.6x
3.7x
3.2x
4.4x4.0x
3.6x
2.9x2.6x2.9x2.7x
0.0x
1.0x
2.0x
3.0x
4.0x
5.0x
6.0x
2000 2001 2002 2003 2004 2005 2006 2007 2008 2009 Jan-Sep2010
Leverage
Europe US
Partners Group Research Flash December 2010
Mezzanine Investments: Stability Through the Storm
8
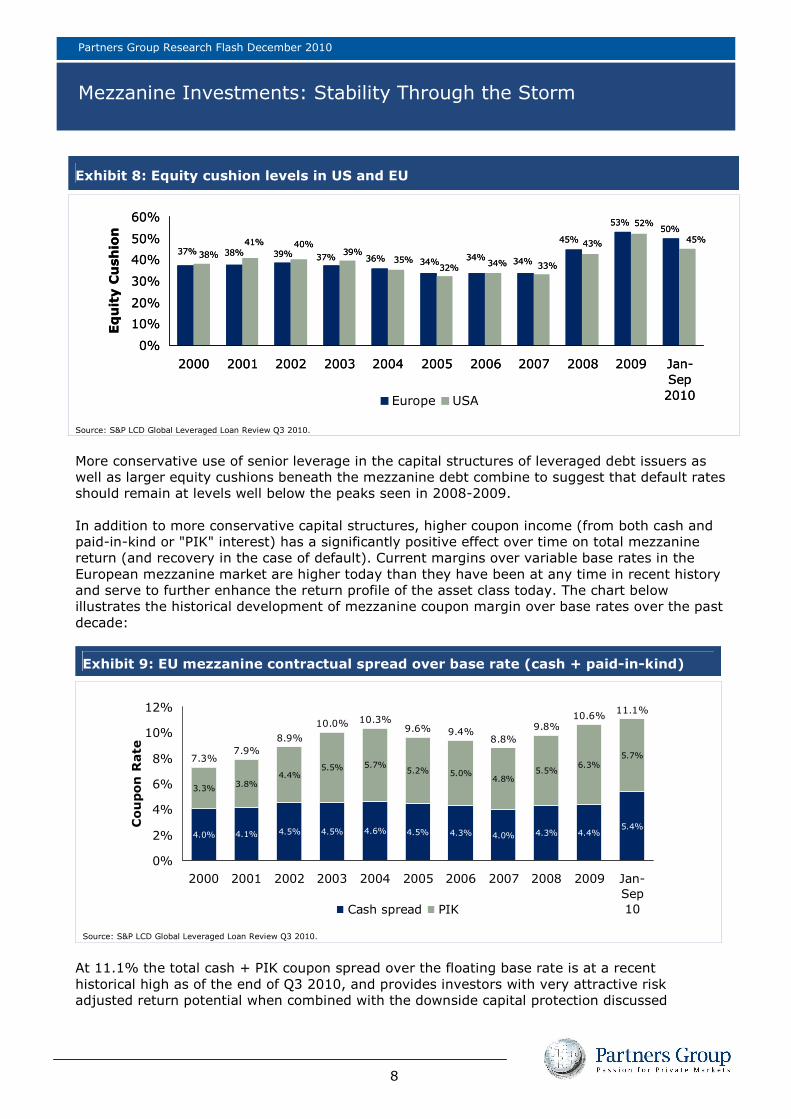
More conservative use of senior leverage in the capital structures of leveraged debt issuers as well as larger equity cushions beneath the mezzanine debt combine to suggest that default rates should remain at levels well below the peaks seen in 2008-2009. In addition to more conservative capital structures, higher coupon income (from both cash and paid-in-kind or "PIK" interest) has a significantly positive effect over time on total mezzanine return (and recovery in the case of default). Current margins over variable base rates in the European mezzanine market are higher today than they have been at any time in recent history and serve to further enhance the return profile of the asset class today. The chart below illustrates the historical development of mezzanine coupon margin over base rates over the past decade:
Exhibit 9: EU mezzanine contractual spread over base rate (cash + paid-in-kind)
Source: S&P LCD Global Leveraged Loan Review Q3 2010.
At 11.1% the total cash + PIK coupon spread over the floating base rate is at a recent historical high as of the end of Q3 2010, and provides investors with very attractive risk adjusted return potential when combined with the downside capital protection discussed
Exhibit 8: Equity cushion levels in US and EU
39%37%34%
34% 34%
45%
53%
37%
50%
38%36% 35%
45%
52%
43%
33%34%32%
40%41%
38% 39%
0%
10%
20%
30%
40%
50%
60%
2000 2001 2002 2003 2004 2005 2006 2007 2008 2009 Jan-Sep2010Europe USA
Equity Cushion
39%37%34%
34% 34%
45%
53%
37%
50%
38%36% 35%
45%
52%
43%
33%34%32%
40%41%
38% 39%
0%
10%
20%
30%
40%
50%
60%
2000 2001 2002 2003 2004 2005 2006 2007 2008 2009 Jan-Sep2010Europe USA
Equity Cushion
Source: S&P LCD Global Leveraged Loan Review Q3 2010.
4.0% 4.1% 4.5% 4.5% 4.6% 4.5% 4.3% 4.0% 4.3%5.4%
3.3%3.8%
4.4%5.5% 5.7%
5.2% 5.0%4.8%
5.5%
5.7%
4.4%
6.3%7.3%
7.9%
8.9%
10.0% 10.3%9.6% 9.4%
8.8%
9.8%10.6%
11.1%
0%
2%
4%
6%
8%
10%
12%
2000 2001 2002 2003 2004 2005 2006 2007 2008 2009 Jan-Sep10
Coupon Rate
Cash spread PIK
Partners Group Research Flash December 2010
Mezzanine Investments: Stability Through the Storm
9
above. This attractive return potential is before any concurrent equity participation which has been a traditional feature seen in the mezzanine lending environment, and which has the potential to further enhance the profile for the mezzanine asset class. Lastly, given the significant activity in the global high yield bond market, we compared newly issued US and European high yield bonds for the year to date October 2010 with a portfolio of over ten global mezzanine investments made by Partners Group during the same period. The analysis focused on the average underlying company leverage levels and contractual returns for each portfolio. We found that the average total net debt to EBITDA multiple ("Net Leverage") of the newly issued global high yield portfolio exhibited a lower Net Leverage level of 3.9x than the mezzanine portfolio which had average total Net Leverage of 4.9x. However, we found that the average coupon on newly issued high yield bonds is 8.33% compared to the average coupon in the mezzanine portfolio of 13.48%. When considering the return per unit of leverage for each portfolio to control for differences in contractual coupons it can be pointed out that the mezzanine portfolio returns 2.8% per unit of leverage in the current market, while the newly issued high yield bond portfolio returns 2.1% per unit of leverage, suggesting the mezzanine portfolio produces attractive risk adjusted returns compared to the high yield market. Bearing this attractive comparison to public bonds in mind, and combining that with other attractive features of mezzanine debt including more robust covenant protections and typical contingent control rights of private market lenders in cases of financial stress, this further serves to enhance the relative value proposition of mezzanine debt. In addition to the favorable capital structure positioning, high contractual and relative returns which we discussed above, several other characteristics and dynamics specific to mezzanine debt contributed to the resiliency of the mezzanine asset class during the crisis. Stable ownership characteristics, enhanced protection rights and more robust control over the documentation process also contribute significant support and stability to the asset class. OWNERSHIP STRUCTURE Mezzanine debt is typically provided and held by a concentrated group of specialized institutional lenders, in many cases only one or two. These lenders tend to be stable, longer-term institutional investors that are relationship driven and have previous experience providing debt to trusted equity sponsors and management teams. Furthermore, mezzanine lenders often enhance their returns by purchasing equity investments in the deals or negotiating warrant positions in the companies. On the one hand, this enables mezzanine investors to participate in the upside of the investment case whereas on the other hand, mezzanine investors enjoy significant downside protection due to the equity in the capital structure. As a closely held private debt instrument, there is typically limited or no trading in the mezzanine asset class. As a result, the asset class tends to exhibit lower price volatility. Generally, a lack of secondary market liquidity in an asset class is not viewed by investors as favorable. However, when taking into consideration the nature of the underlying investor class of traditional mezzanine lenders, the liquidity profile of mezzanine debt has proven to be advantageous when market stress is at its worst. This results from the longer lockup periods on the capital provided to mezzanine funds than the maturities on loans that they provide. Accordingly, mezzanine lenders are able to focus their investment and divestment decisions entirely on credit fundamentals of the underlying companies. Thus, traditional mezzanine lenders are less likely to be focused on technical capital flows from other market participants in need of liquidity, which further reduces price volatility.
Partners Group Research Flash December 2010
Mezzanine Investments: Stability Through the Storm
10
CONTROL AND PROTECTION RIGHTS As a private debt instrument, mezzanine is governed by a subordinated credit agreement with the borrower as well as an intercreditor agreement with the senior lenders. At the time these agreements are negotiated, mezzanine lenders may place added emphasis and importance on the controls and protections afforded to them by the subordinated credit agreement. Two of the primary controls of the subordinated credit agreement that have been instrumental for lenders are the sections and clauses known as covenants and events of default. Covenants are typically implemented in the following forms:
� Financial maintenance covenants are requirements placed on the borrower to maintain certain levels of financial performance, typically on a quarterly basis. Examples of financial covenants include maximum leverage ratios, minimum interest coverage and fixed charge/debt service coverage ratios, maximum capital expenditures and minimum EBITDA, with levels set close to the borrower’s business plan metrics
� Negative covenants are prohibitions or restrictions imposed on the borrower that shall prevent the borrower from taking certain actions and often restrict the ability for cash and/ or assets to leak out of the company. Examples of negative covenants include restrictions on the borrower’s ability to incur additional debt, restrictions on liens, payments (including dividends), asset sales, the issuance of securities, intercompany loans, investments, capital expenditures, mergers and acquisitions and amendments to constituent agreements
� Affirmative covenants require increased levels and frequency of disclosure of information. Examples of affirmative covenants include reporting requirements, delivery of other financial information and compliance certificates. Other affirmative covenants include the maintenance of insurance and hedging arrangements, maintenance of business lines and properties and use of the proceeds of the loan
Covenants serve as control mechanisms for mezzanine lenders in situations where a company may be under-performing or having financial difficulties, thereby allowing mezzanine lenders to monitor and engage the borrower and equity sponsor. In a case of a covenant breach, certain rights for lenders are triggered. Mezzanine lenders actively address the problem with the equity sponsor to provide solutions in a timely manner, before the situation can worsen. In many cases, mezzanine lenders provide sponsors with a certain flexibility which can allow borrowers to work through temporary challenges. In more dire situations, the equity sponsor and mezzanine lender work together to devise a plan and set a course for more substantive modifications to give the company time to work out its problems. In return, the mezzanine lenders receive certain concessions, such as increased pricing, amendment fees, tighter ongoing or new covenants and reporting requirements and other provisions. If all modifications and addressed problems could not be solved in a pre-defined time horizon, most of the lending contracts additionally allow lenders to trigger their change of control rights and in fact take over control of the company allowing them to benefit from all future economic upside.
Partners Group Research Flash December 2010
Mezzanine Investments: Stability Through the Storm
11
CONCLUSIONS Mezzanine debt has proven to be one of the most resilient asset classes in the financial crisis between 2007 and 2009. Investors in mezzanine debt enjoyed a significantly less severe drawdown from the peak, and as such, exposed lenders to much lower levels of volatility. Based on our observations through this time period with regard to volatility our conclusion is that on a risk adjusted basis, mezzanine debt is one of the most attractive investments in the market. The primary characteristics which have enabled the mezzanine debt asset class to achieve this attractive profile include: high contractual yields, relatively low default rates, high recovery rates given default, favorable ownership dynamics, and greater control of protective legal documentation. Our outlook for the asset class remains positive due to the persistence of the characteristics outlined above, which are further enhanced by current market conditions. Relatively low levels of leverage combined with high equity cushions from equity sponsors effectively decrease default risk. In addition, average coupon rates are as high as they have been in over a decade. Higher contractual returns on mezzanine debt combined with projected default rates near 1-2% in the coming year is likely to generate one of the most favorable backdrops to the mezzanine lending environment we have experienced in recent history, and to create one of the most attractive investment opportunities in the financial markets today.
Partners Group Research Flash December 2010
Contact
12
Client contact:
Kathrin Schulthess
Investment Solutions
Phone: +41 41 768 85 81
Email: [email protected]
Media relations contact:
Dr. Anna Hollmann
Phone: +41 41 768 83 72
E-mail: [email protected]
www.partnersgroup.com
ZUG | SAN FRANCISCO | NEW YORK | LONDON | GUERNSEY | LUXEMBOURG | MUNICH | DUBAI | SINGAPORE | BEIJING | SEOUL | TOKYO | SYDNEY
Partners Group Research Flash December 2010
Disclaimer
13
This material has been prepared solely for purposes of illustration and discussion. Under no circumstances should the information contained herein be used or considered as an offer to sell, or solicitation of an offer to buy any security. Any security offering is subject to certain investor eligibility criteria as detailed in the applicable offering documents. The information contained herein is confidential and may not be reproduced or circulated in whole or in part. The information is in summary form for convenience of presentation, it is not complete and it should not be relied upon as such.
All information, including performance information, has been prepared in good faith; however Partners Group makes no representation or warranty express or implied, as to the accuracy or completeness of the information, and nothing herein shall be relied upon as a promise or representation as to past or future performance. This material may include information that is based, in part or in full, on hypothetical assumptions, models and/or other analysis of Partners Group (which may not necessarily be described herein), no representation or warranty is made as to the reasonableness of any such assumptions, models or analysis. Any charts which represent the composition of a portfolio of private markets investments serve as guidance only and are not intended to be an assurance of the actual allocation of private markets investments. The information set forth herein was gathered from various sources which Partners Group believes, but does not guarantee, to be reliable. Unless stated otherwise, any opinions expressed herein are current as of the date hereof and are subject to change at any time. All sources which have not been otherwise credited have derived from Partners Group.
Material notes to investors based in the People’s Republic of China This material is presented to investors by Partners Group’s Beijing Representative Office on behalf of Partners Group (Singapore) Pte Limited. Partners Group’s Beijing Representative Office is not representing any other entity (including, without limitation, Partners Group AG). Partners Group’s Beijing Representative Office is engaged solely in the conduct of market research and liaison activities and is not engaged in direct business operations in accordance with the Regulatory Measures for Registration of Representative Offices of Foreign Companies, Article 3. Any products referenced herein have not been submitted to or approved/verified by or registered with the China Securities Regulatory Commission or other relevant governmental authorities in the PRC. Such products may not be offered, sold or delivered or available for reoffering, resale or redelivery directly or indirectly to any person in the PRC, other than in full compliance with the relevant laws and regulations of the PRC. PRC investors are responsible for obtaining all relevant government regulatory approvals/licences, verifications and/or registrations.
Material notes to investors based in Australia Partners Group (UK) Limited ABN 41 130 021 484 is exempt from the requirement to hold an Australian financial services licence by operation of ASIC Class Order 03/1099: UK FSA regulated financial service providers. Partners Group (UK) Limited is regulated by the Financial Services Authority of the United Kingdom under UK laws, which differ from Australian laws.
Material notes to investors based in Japan The registration number for Partners Group AG in Japan is Kanto Financial Bureau No. 2141 (Financial Instruments Business). The Financial Instruments Mediation Assistance Center ("FINMAC") is the appropriate financial arbitrator for any complaints or disputes regarding our financial products and transactions (FINMAC +81 3 3667 8009).
Material notes to investors based in the United Kingdom This material is presented to investors by Partners Group (UK) Limited, which is regulated by the UK Financial Services Authority (“FSA”). Any product offered will be an unregulated collective investment scheme for the purposes of the Financial Services and Markets Act 2000 of the United Kingdom (“FSMA 2000”). The promotion of any product and the distribution of any associated material is accordingly restricted by law. Any product related material is therefore issued by Partners Group (UK) Limited only to persons who are of a kind to whom such product may lawfully be promoted under the Financial Services and Markets Act 2000 (Promotion of Collective Investment Schemes) (Exemptions) Order 2001 (“CIS Order”) and Rule 4.12 of the Conduct of Business Rules published by the FSA (“Relevant Persons”).
Material notes to investors based in the United States of America This material is presented to investors on behalf of Partners Group AG. Statements herein do not necessarily pertain to Partners Group (USA) Inc. or Partners Group Real Estate, LLC, which are SEC registered investment advisers and affiliates of Partners Group AG. For information specifically regarding Partners Group (USA) Inc. or Partners Group Real Estate, LLC, please contact us.
Material notes to investors based in the Dubai International Financial Centre This material relates to a financial product which is not subject to any form of regulation or approval by the Dubai Financial Services Authority ("DFSA"). The DFSA has no responsibility for reviewing or verifying any prospectus or other documents in connection with this financial product. Accordingly, the DFSA has not approved this document or any other associated documents nor taken any steps to verify the information set out in this document, and has no responsibility for it. The financial product to which this document relates may be illiquid and/or subject to restrictions on its resale. Prospective purchasers should conduct their own due diligence on the financial product. If you do not understand the contents of this document you should consult an authorised financial adviser.
Material notes to investors based in Canada We are required by applicable securities law in Canada to notify you as follows: We are not registered as an adviser in Canada. We provide our services in Canada as an exempt international adviser. Our principal office is located in Baar/Zug Switzerland. There may be difficulty enforcing legal rights against us because we are resident outside Canada and all or substantially all of our assets may be situated outside of Canada. We have appointed agents for service of process in Canada, depending on your jurisdiction. Please see the below Schedule for the list of our agents and their addresses.
Province/Territory Agent for service Province/Territory Agent for service
Ontario Blakes Extra-Provincial Services Inc., Suite 2800, 199 Bay Street, Toronto, On M5L 1A9
Saskatchewan MacPherson, Leslie & Tyerman LLP, 1500 Continental Bank Building, 1874 Scarth Street, Regina, SK S4P 4E9
Quebec Services Blakes Québec Inc., 600 de Maisonneuve Boulevard Ouest, Suite 2200, Tour KPMG, Montréal, QC H3A 3J2
Nova Scotia Stewart McKelvey, Purdy's Wharf Tower One, 1959 Upper Water Street, Suite 900, P.O. Box 997, Halifax, NS B3J 2X2
British Columbia Blakes Vancouver Services Inc., 595 Burrard Street, P.O. Box 49314, Suite 2600, Three Bentall Centre, Vancouver, BC V7X 1L3
New Brunswick Stewart McKelvey, 10th Floor, Brunswick House, 44 Chipman Hill, Saint John, NB E2L 4S6
Alberta Blake, Cassels & Graydon LLP, Attention: Pat Finnerty/ Ross Bentley, 855 - 2nd Street S.W., Suite 3500, Bankers Hall East Tower, Calgary, AB T2P 4J8
Newfoundland and Labrador
Stewart McKelvey, Cabot Place, 100 New Gower Street, Suite 1100, P.O. Box 5038, St. John's, NL A1C 5V3
Manitoba Aikins, MacAulay & Thorvaldson LLP, 30th Floor, Commodity Exchange Tower, 360 Main Street, Winnipeg, MB R3C 4G1
Prince Edward Island Stewart McKelvey, 65 Grafton Street, Box 2140, Charlottetown, PE C1A 8B9