Embed Size (px)
Citation preview
MEXUS-Gulf Shrimp Research, 1978-84
EDWARD F. KLIMA, REFUGIO GMO. CASTRO MELENDEZ, NEAL BAXTER, FRANK J. PATELLA, TERRY J. CODY, and LOREnA F. SULLIVAN
Introduction
Mexico and the United States share shrimp and other marine resources in the Gulf of Mexico. As a result, in 1fJ77 a cooperative research agreement was established between the Federal fisheries research organizations of the two countries-the Departmento de Pesca's Instituto Nacional de Pesca (INP) and the National Marine Fisheries Service's (NMFS) Southeast Fisheries Centerto develop joint marine research programs. At the first MEXUS-Gulf meeting in Campeche, Mex. (lfJ77) a shrimp working group developed cooperative research plans to determine migration, growth and mortality rates of brown and pink shrimp, and to define the fishing characteristics of the US. and Mexican shrimp fleets. This report summarizes the first 7 years' results from this cooperative research and suggests the direction of the program for the next 2 years (1985-86).
Background and the Fishery
Total shrimp production in the Gulf of Mexico in 1fJ77 was about 148,000 metric tons (t), heads on, whereas in 1fJ78 it decreased slightly to 139,000 t. The fishery originally consisted of both US. and Mexican vessels fishing Mexican waters and primarily US. boats fishing US. waters. Since 1fJ79, how-
Edward F. Klima, K. Neal Baxter, Frank 1. Patella, and Loretta F. Sullivan are with the Galveston Laboratory, Southeast Fisheries Center, National Marine Fisheries Service, NOAA, 4700 Avenue U, Galveston, TX 77551; Refugio Gmo. Castro Melendez is with the Centro Reservado Instituto de Pesca, Tampico Apdo. Postal, Tampico, Tamaulipas, Mexico; and Terry 1. Cody is with the Texas Parks and Wildlife Department, P.O. Box 1717 Turning Basin, Rockport, TX 78382.
ever, US. vessels have not been allowed in Mexican waters.
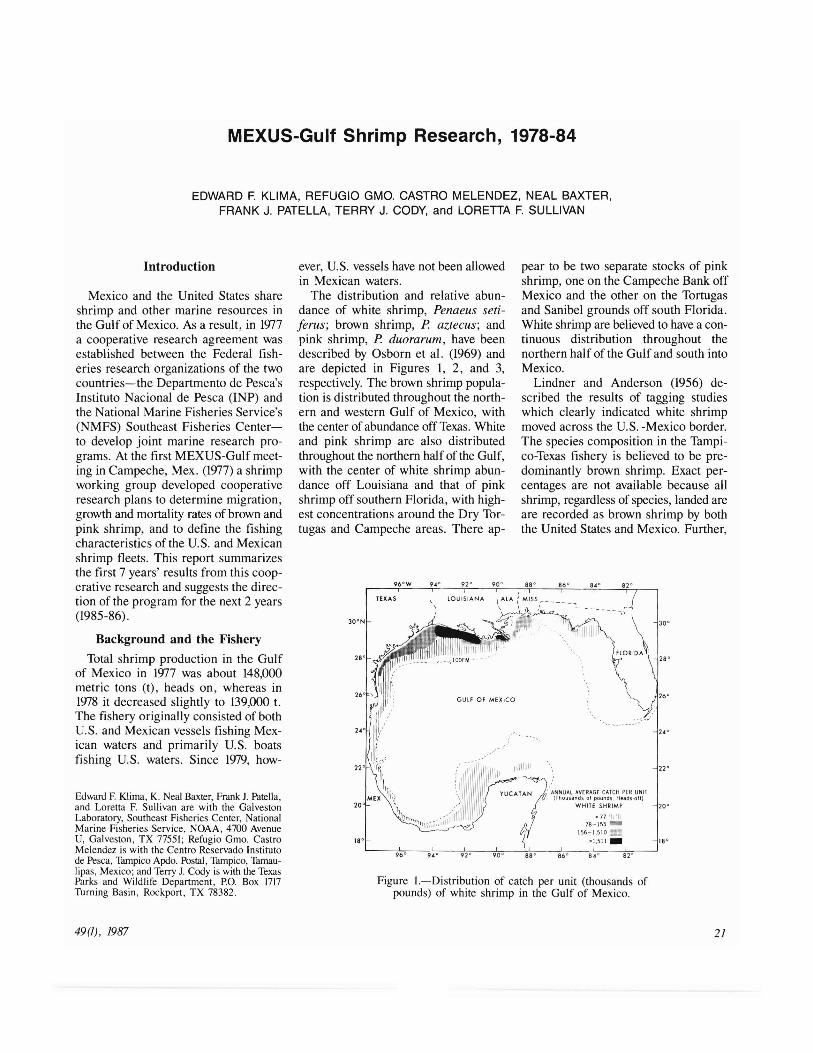
The distribution and relative abundance of white shrimp, Penaeus setiferus; brown shrimp, P. aztecus; and pink shrimp, P. duorarum, have been described by Osborn et al. (1969) and are depicted in Figures I, 2, and 3, respectively. The brown shrimp population is distributed throughout the northern and western Gulf of Mexico, with the center of abundance off Texas. White and pink shrimp are also distributed throughout the northern half of the Gulf, with the center of white shrimp abundance off Louisiana and that of pink shrimp off southern Florida, with highest concentrations around the Dry Tortugas and Campeche areas. There ap
92<> 90"
TEXAS
pear to be two separate stocks of pink shrimp, one on the Campeche Bank off Mexico and the other on the Tortugas and Sanibel grounds off south Florida. White shrimp are believed to have a continuous distribution throughout the northern half of the Gulf and south into Mexico.
Lindner and Anderson (1956) described the results of tagging studies which clearly indicated white shrimp moved across the US. -Mexico border. The species composition in the Tampico-Texas fishery is believed to be predominantly brown shrimp. Exact percentages are not available because all shrimp, regardless of species, landed are are recorded as brown shrimp by both the United States and Mexico. Further,
, ANNUAL AVERAGE CATCH PER UNIT (Thousands of pounds, Heads-off)
WHITE SHRIMP
< 77 11111111 78-155~
156-1.510 '!if
::>1.511_
Figure i.-Distribution of catch per unit (thousands of pounds) of white shrimp in the Gulf of Mexico.
49(1), 1987 21
, 11 Af~~~uAS~:~;~~~~U~~~~~:a~: ~f7)11 PINK SHRIMP
<140
141-28\ ~
282-4,480
18' >4,481_ 18°
96' 92' 90' 88' 869" 8" 96' 9" 92' 90' 88' 86' 82'
2"
8"86'
r; A(~~~:~la~~5[~n~U~~~C~:a~~ ~f~)'f BROWN SHRIMP
<181 182-362
Jb3-4,043 I
>4,044_
88'90'92'
TEXAS
18'
Figure 2.-Distribution of catch per unit (thousands of Figure 3.-Distribution of catch per unit (thousands of pounds) of brown shrimp in the Gulf of Mexico. pounds) of pink shrimp in the Gulf of Mexico.
information concerning transboundary movement of the brown and pink shrimp stocks is also unknown and formulated the basis for a major study by the MEXUS-Gulf shrimp working group.
Methods
Shrimp Tagging
Shrimp stock assessment has been based largely on information obtained from tagging studies. Shrimp probably were first tagged in the Gulf of Mexico during the mid-1930's (Lindner and Anderson, 1956) with Petersen disc tags. Since that time, many investigators have used an assortment of tags and techniques to obtain information on growth, mortality, and movement. Neal (1969) reviewed the marks and marking procedures used up to that time.
Petersen disc tags were not completely suitable for these studies and as early as 1955, Menzel (1955) successfully marked white shrimp by injecting them with a solution of fast green biological stain. Costello (1959) and Costello and Allen (1962) perfected the use of biological stains for penaeid shrimp marking and evaluated the effectiveness of
these stains and injection techniques. The stain injection technique was later used in the Gulf area by Klima (1964, 1974), Allen and Costello (1966), and Knight and Berry (1967), but was severely limited because only groups of shrimp and not individuals could be identified,
The next stage in the evolution of tags was the development of a ribbon tag by Marullo et al. (1976), which has been modified slightly for the cooperative tagging studies. The tag is now tapered at the end attached to the needle so that it is easily inserted between the muscular tissue of the shrimp. An Aureomycin! mixture is routinely used prior to tag insertion to retard infection and secondary bacterial growth. Tags 4 mils thick are used to tag juvenile shrimp (50-100 mm TL) and a thicker 6-mil tag is employed for larger shrimp.
MEXUS-Gulf Tagging
Cooperative shrimp tagging efforts were conducted both inshore and off-
I Mention of trade names or commercial firms does not imply endorsement by the National Marine Fisheries Service, NOAA.
shore U.S. and Mexico waters from 1978 to 1981. Tagging procedures and methods have been described by Neal (1969), Emiliani (1971), and Baxter and Hollaway (1981). In the offshore studies, shrimp were caught by the FRS Oregon II or the Marcep II, with tows limited to 15 minutes to lessen stress on the shrimp. The animals were maintained in 500 L flow-through tanks fitted with aluminum baffles to reduce the effects of vessel roll. All shrimp were tagged with serially numbered ribbon tags.
Tagged animals were placed in an expendable canister (Emiliani, 1971) and released overboard while the vessel was underway. Within about 10 minutes after dropping to the bottom, the canister opened, allowing shrimp to escape. This presumably reduced mortality by predation at the release site and was a standard technique for this study.
Shrimp Recovery and Awards
To increase the return of captured shrimp, a fishing contest was established in 1977. Fishing contests were held in both the United States and Mexico every 45 days during major recovery periods, with winners for each contest awarded first ($500), second ($200), third
Marine Fisheries Review
20 0
22
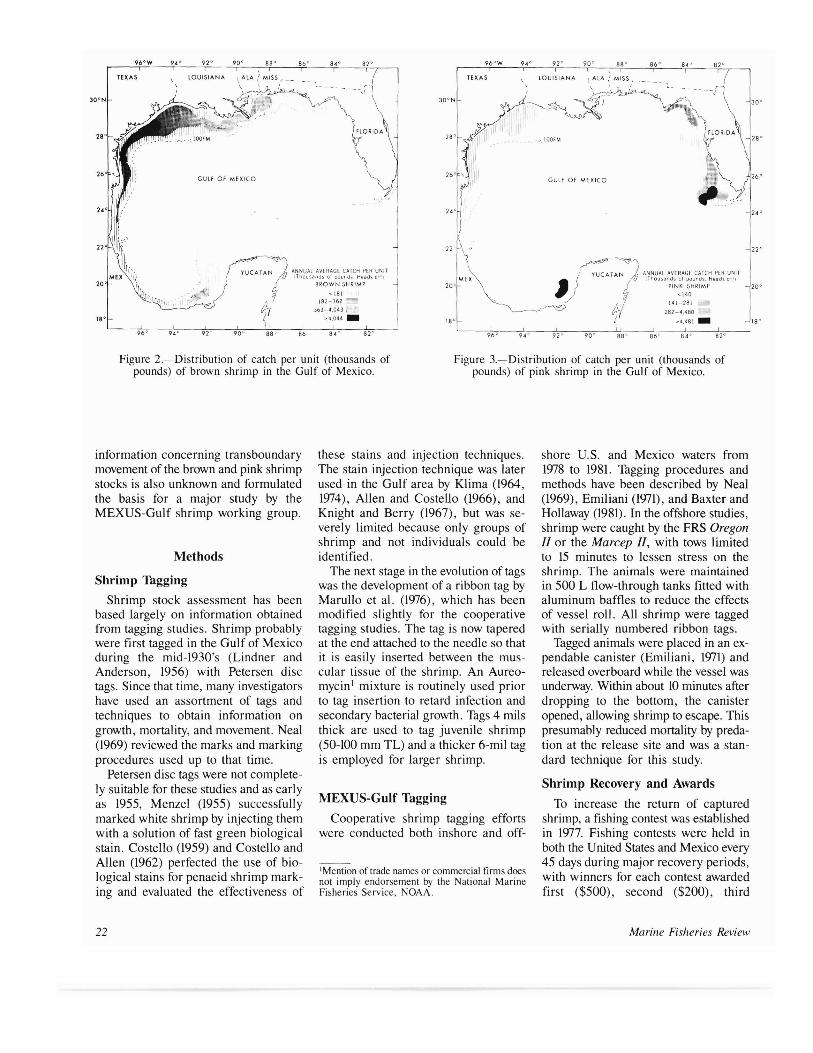
($100), and fourth ($50) prizes (Fig. 4). This awards system was used until the September 1979 contest, when the number of winners in each contest was increased. Awards of $500 (one), $100 (one) and $50 (six) were given in the September 1979 and all subsequent drawings. Winning numbers were preselected by computer at the time of release by a priority system. If the first priority tag selected was not recovered, the second priority tag was selected and so on until four winners were identified. Tagged shrimp were returned to port agents located in the major ports. These agents collected catch and fishery effort statistics, handled the recovery of tagged shrimp, and had a major responsibility for obtaining and verifying pertinent information on area and date of recapture.
Data Analysis Growth in length of brown and pink
shrimp during the April-August period was estimated from 1978-81 markcapture data. These data included tail length (the distance from the first body segment to the posterior end of the telson) when released and recaptured, the dates of release and recapture, and the sex of each individual. Data entries with the same release and recapture data do not reflect growth and therefore were not included.
Parrack's (1979) methods were used to estimate the growth functions which he expressed in terms of the change in the age rather than absolute age. He noted that recaptured individuals were of some unknown age on the date marked and on the date recaptured so that the change
PARTICIPE EN TDRNED DE PESCA DE CAMARDN
PREMIO S/"@/C. EFE~~IVO DE $50 A$500 DOLARES
CAMARONES CON MARCAS INSERTADAS
".."".~
los personas Que en'reguen los comorones con marcos partlclparon en sorteos bimestroles ,a troves de coda numera .mpreso en los listones, como en una loterio. En coda SOrteo se daran (uolra premlos y los numeros no premlodos lendron oporlunldod de porticipar de nuevo en alros sorteeS Esfe sistema sera permonenle hasta 1979
PREMIOS EN $500 $200 $100 $50 DOlARES PRIMERO SEGUNDO TERCERO CUARTO
los comarones con marcos, Indlcando fecha y lugar de capturo, deberan ser entregados 01 centro de InvestigaCH)" pesquero U of.clna de pesca mas proximos
QfIC1N.4 DIRECClON TELUOND
51 UsTED [NCQNIRQ UN CAMAlWN MARCAOO 0 SAB[ QU[ AlGUI[N LO HllO, AVIS[ A LA OflCINA Dl P[SCA
Bit fS VN '~fVUIO CON/V,..IO OIL OH ... ., ... "'I,..,O 0' PB( ... 01 ... ,_1(0 Y H ,.. ... 1I0N ... I ...... IINI "SH('LI~ H'YI(I I U ... P ....... IL BIVOIO O( 10~ H.... 1I0S "'IG .... IOIiOS .... VNO ... N(' ... ('f(I"'lfNIO Y "'0""'1'0"'0 01 lOS ( .......... ONIS
Figure 4.-Poster advertising shrimp incentive award system.
49(1), 1987
in age is equivalent to the time at large. Parrack rearranged the von Bertalanffy equation from:
where: Sa size at age a, Sr size at recapture, S asymptotic size, b an equation constant related to
the size at birth, and size when marked.
We also used Parrack's technique to estimate the equation parameter S by utilizing the Marquardt algorithm to minimize the residual sum of squares.
We calculated the growth function for sexes combined to provide a description of population growth rather than estimating growth for each sex. The ratio of males to females throughout the recovery period did not appear to change from 1:1; therefore, we concluded that the growth function was adequate to describe growth of sexes combined.
Commercial Catch Data
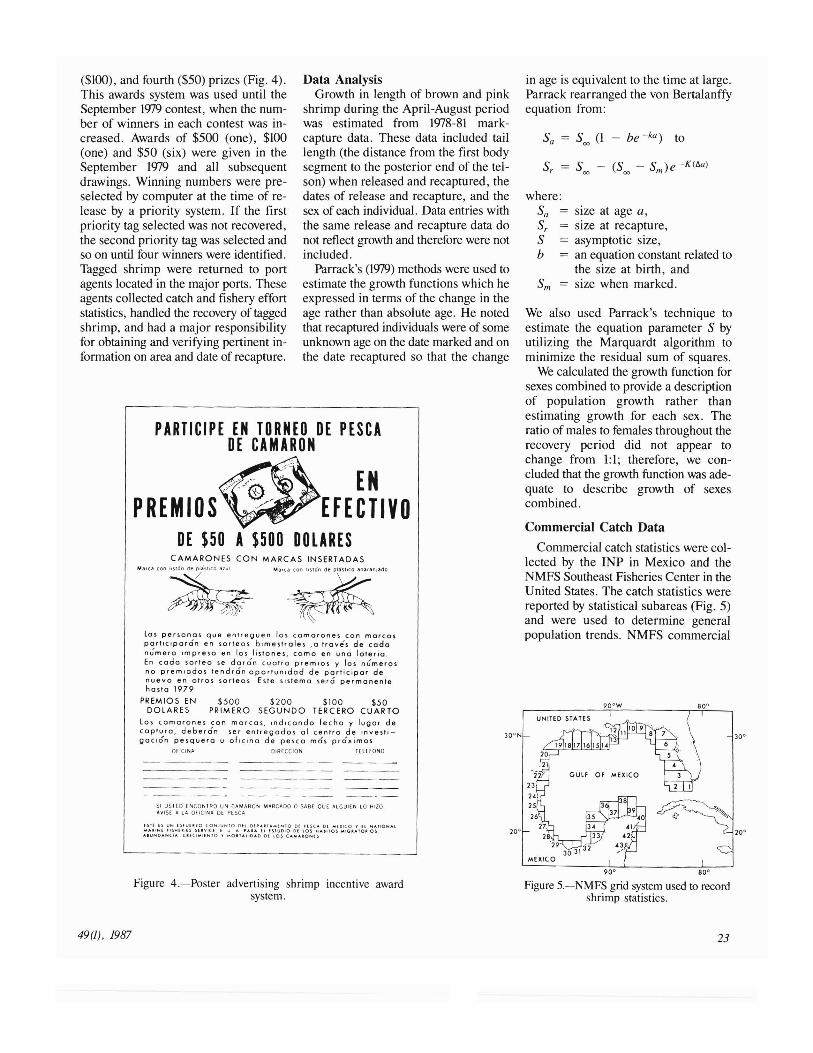
Commercial catch statistics were collected by the INP in Mexico and the NMFS Southeast Fisheries Center in the United States. The catch statistics were reported by statistical subareas (Fig. 5) and were used to determine general population trends. NMFS commercial
Figure 5.-NMFS grid system used to record shrimp statistics.
23
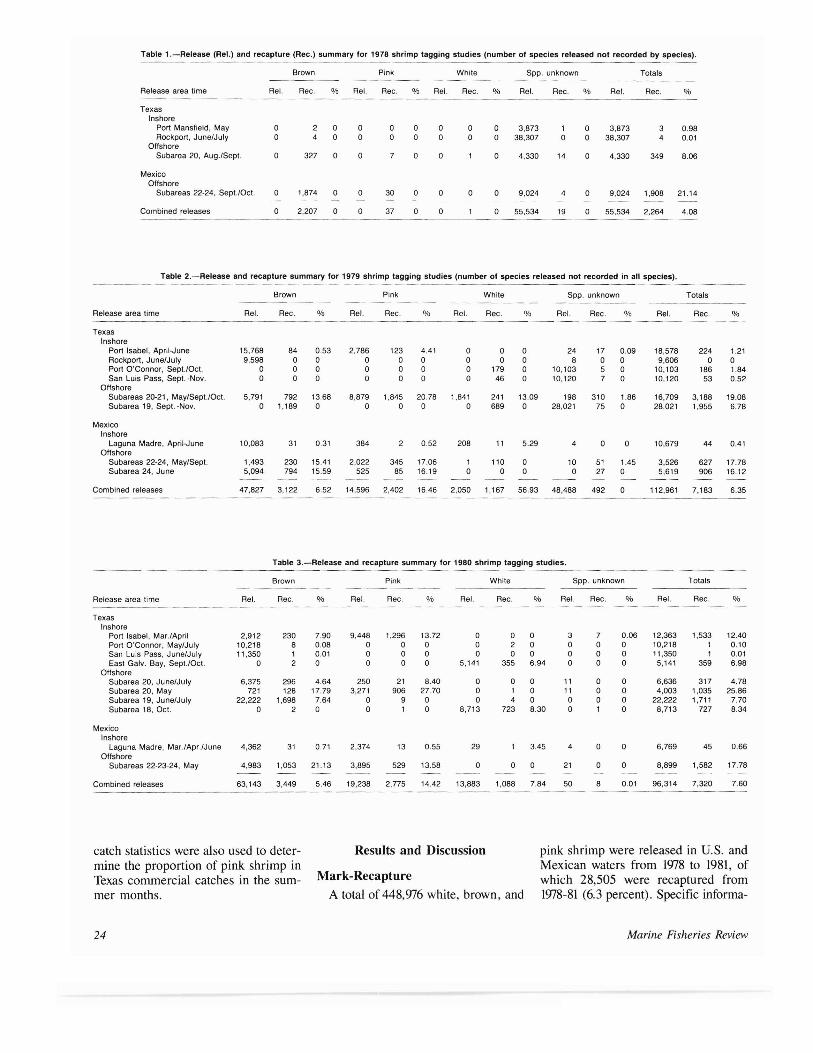
Table l.-Release (ReI.) and recapture (Rec.) summary lor 1978 shrimp tagging studies (number of species released not recorded by species).
Brown Pink White Spp. unknown Totals
Release area time ReI. Rec. % ReI. Rec. % ReI. Rec. % ReI. Rec. % ReI. Rec. %
Texas Inshore
Port Mansfield. May Rockport, June/July
Offshore Subarea 20, Aug.lSept.
0 0
0
2 4
327
0 0
0
0 0
0
0 0
0 0
0
0 0
0
0 0
0 0
0
3.873 38,307
4,330
1 0
14
0 0
0
3,873 38,307
4,330
3 4
349
0.98 0.01
8.06
Mexico Offshore
Subareas 22-24, Sept.lOct. 0 1,874 0 0 30 0 0 0 0 9,024 4 0 9,024 1,908 21.14
Combined releases o 2,207 0 o 37 o o o 55,534 19 o 55,534 2,264 4.08
Table 2.-Release and recapture summary for 1979 shrimp tagging studies (number 01 species released not recorded in all species).
Brown Pink White Spp. unknown Totals
Release area time ReI. Rec. % ReI. Rec. % ReI. Ree. % ReI. Rec. % ReI. Rec. %
Texas Inshore
Port Isabel, April·June 15,768 84 0.53 2,786 123 4.41 0 o 0 24 17 0.09 18,578 224 1.21 Rockport, June/July 9,598 0 o o o 0 0 o 0 8 0 o 9,606 0 o Port O'Connor, Sept.lOct. o 0 o o o 0 0 179 0 10,103 5 o 10,103 186 1.84 San Luis Pass, Sept. ·Nov. o 0 o o o 0 0 46 0 10,120 7 o 10,120 53 0.52
Oflshore Subareas 20·21, May/Sept.lOct. 5,791 792 13.68 8,879 1,845 20.78 1,841 241 13.09 198 310 1.86 16,709 3,188 19.08 Subarea 19, Sept. ·Nov. o 1,189 o o o 0 0 689 0 28,021 75 o 28,021 1.955 6.78
Mexico Inshore
Laguna Madre, April-June 10,083 31 0.31 384 2 0.52 208 11 5.29 4 0 o 10,679 44 0.41 Offshore
Subareas 22·24, May/Sept. 1,493 230 15.41 2,022 345 17.06 1 110 0 10 51 1.45 3,526 627 17.78 Subarea 24, June 5,094 794 15.59 525 85 16.19 0 o 0 o 27 o 5,619 906 16.12
Combined releases 47,827 3,122 6.52 14,596 2,402 16.46 2.050 1,167 56.93 48,488 492 o 112,961 7,183 635
Table 3.-Release and recapture summary for 1980 shrimp tagging studies.
Brown Pink White Spp. unknown Totals
Release area time ReI. Rec. % ReI. Rec. % ReI. Rec. % ReI. Rec. % ReI. Rec. %
Texas Inshore
Port Isabel. Mar.lApril 2,912 230 7.90 9,448 1,296 13.72 o o o 3 7 0.06 12,363 1,533 12.40 Port O'Connor, May/july 10,218 8 0.08 o o o o 2 o o o o 10,218 1 0.10 San Luis Pass, June/July 11,350 1 0.01 o o o o o o o o o 11,350 1 0.01 East Galv. Bay, Sept.lOct. o 2 o o o o 5,141 355 6.94 o o o 5,141 359 6.98
Offshore Subarea 20, June/July 6,375 296 4.64 250 21 8.40 o o o 11 o o 6,636 317 4.78 Subarea 20, May 721 128 17.79 3,271 906 27.70 o 1 o 11 o o 4,003 1,035 25.86 Subarea 19, June/July 22,222 1,698 7.64 o 9 o o 4 o o o o 22,222 1,711 7.70 Subarea 18, Oct. o 2 o o 1 o 8,713 723 830 o 1 o 8,713 727 8.34
Mexico Inshore
Laguna Madre, Mar.lApr.lJune 4,362 31 0.71 2,374 13 0.55 29 3.45 4 o o 6,769 45 0.66 Offshore
Subareas 22·23·24, May 4,983 1,053 21.13 3,895 529 13.58 o o o 21 o o 8,899 1,582 17.78
Combined releases 63,143 3,449 5.46 19,238 2,775 14.42 13,883 1,088 7.84 50 8 0.01 96,314 7,320 7.60
catch statistics were also used to deter Results and Discussion pink shrimp were released in U.S. and mine the proportion of pink shrimp in Mexican waters from 1978 to 1981, of
Mark-RecaptureTexas commercial catches in the sum which 28,505 were recaptured from mer months. A total of 448,976 white, brown, and 1978-81 (6.3 percent). Specific informa-
Marine Fisheries Review 24

Table 4.-Release and recapture summary for 1981 shrimp tagging studies.
Brown Pink White Spp. unknown ----
Totals
Release area time ReI. Rec. % ReI. Rec. % ReI. Rec. % ReI. Rec. % ReI. Rec. %
Texas Inshore
Port O'Connor, Oct. East Galv. Bay, MayIJune/Aug.-Oc!.
Offshore Subarea 19, June-Oc!. Subarea 18, MayIJune/Oct.lNov. Subarea 19, July
0 15,375
40,474 35,074
4,189
0 691
5,394 219
1,152
0 4.51
13.33 0.62
27.50
0 0
0 0 0
0 0
0 0 0
0 0
0 0 0
10,027 20,272
14,306 34,784
0
174 809
421 2,636
0
1.74 3.99
2.94 7.58 0
0 0
0 0 0
0 0
1 0 0
0 0
0 0 0
10,027 35,647
54,780 69,858 4,189
174 1,502
5,816 2,855 1,152
1.74 4.21
10.62 4.09
27.50
Mexico Offshore
Subarea 34, March 0 0 0 9,656 239 2.48 10 0 0 0 0 0 9,666 239 2.47
Combined releases 95,112 7,458 7.84 9,656 239 2.48 79,399 4,040 5.08 0 0 184,167 11,738 6.37
tion on release area and time and numbers recaptured are provided in Tables 1-4, Most shrimp releases from inshore sites resulted in poor recoveries of less than 1 percent. The only notable exception was in 1980 at Port Isabel, Tex., when more than 12 percent of the shrimp released in March-April were recovered. We believe the reason for poor recovery rates for inshore sites is that techniques are not yet developed to tag large quantities of live shrimp properly during the periods when temperatures are notably high (i.e., >30°C) and water is clear which may increase mortality of tagged shrimp due to predation by major inshore predators (Howe and Hoyt, 1982).
Comparative tagging studies conducted in coastal Louisiana waters in the summer showed recovery rates ranging from 5.7 percent to 20.5 percent (Hollaway and Baxter, 1981; Baxter and Hollaway, 1981). The turbid waters in Louisiana probably prevented predation on tagged shrimp by major inshore predators. The combination of clear coastal Texas waters and high temperatures may have resulted in poor survival of the tagged shrimp. Further, inshore areas are probably not exposed to intensive fishing immediately following the release; therefore, the opportunity for recovery is slight and depends on shrimp migration to offshore waters where intensive fishereis are located. The water temperature at Port Isabel in MarchApril, when an inshore study was conducted, was well below 25°C and the shrimp appeared to be in good condition. In all other inshore studies, water temperatures were >25°C and shrimp
49(1), 1987
condition was poor to fair. Offshore recovery rates ranged from
2,5 percent in March 1980 on the Campeche Banks to 26 percent in the offshore fishery (statistical subarea 20) in May 1980, The low 2,5 percent recovery was probably due to poor detection of the tags and poor return of recaptured tagged shrimp to the proper authorities, This was the first mark-recapture study conducted on the Campeche Banks and, as such, the fishermen probably were not aware of the tags even though publicity of the tagging program had been distributed to the Campeche fleet. The next lowest recovery rate (4,2 percent) occurred from the October-November 1981 release in statistical subarea 18, probably due to low fishing pressure exerted in the area, Overall, recovery rates from the offshore fisheries reflected the fishing pressure exerted on the marked population. The offshore tagging studies conducted in 1978, 1979, and 1980 in the Tampico fishery (subareas 22-24) yielded consistently high recovery rates of 16-21 percent. This indicated a fairly consistent high rate of exploitation. On the other hand, the offshore tagging studies conducted off Texas yielded variable fishing intensity in time and space,
Shrimp Movement
Transboundary
Cody and Avent (1980) reported on the 1978-79 tagging studies conducted in Texas and described generalized movements of the shrimp stocks, We do not attempt to repeat their analyses but concentrate on the aspect of transboundary
migration of brown and pink shrimp stocks,
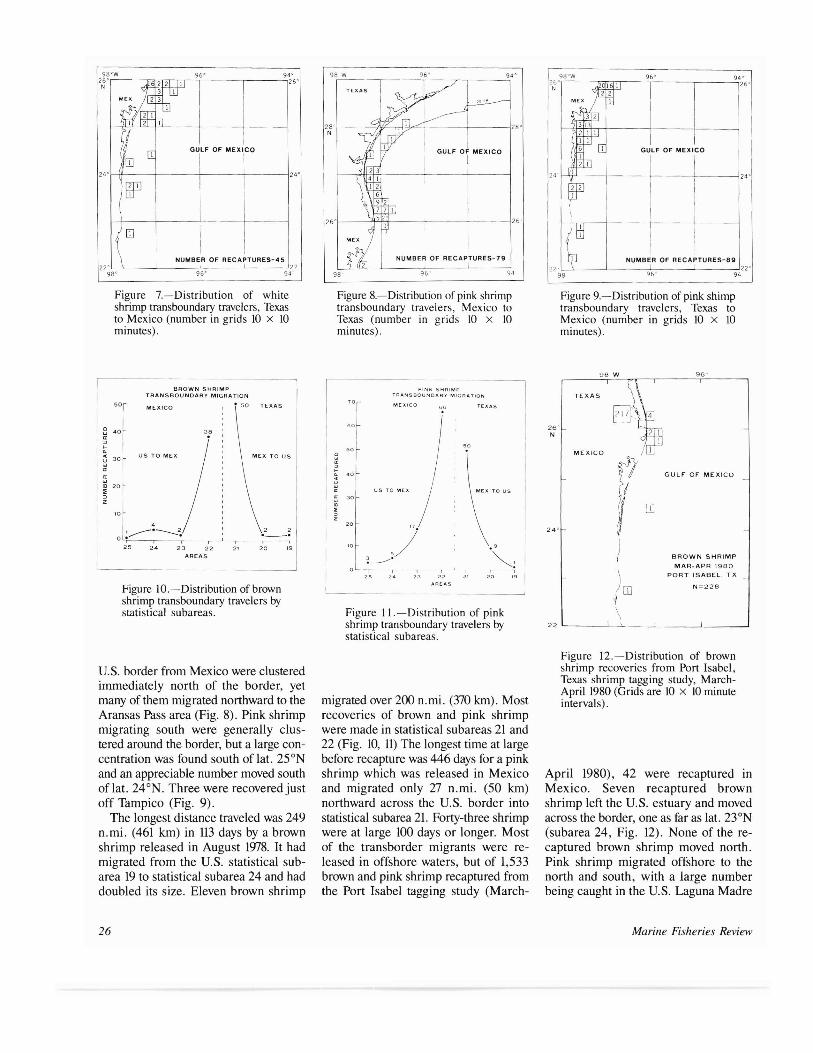
A total of 108 brown and 160 pink shrimp were recaptured which had migrated either from the United States to Mexico or from Mexico to the United States. Movement of tagged brown shrimp from Mexico to the United States centered in statistical subarea 21. However, several of these shrimp migrated northward up the coast, one as far as long, 94OW and into waters deeper than 20 fm (Fig, 6), Most of the brown shrimp which moved from US, waters into Mexican waters were recovered immediately south of the border; however, one shrimp was recovered almost off Tampico and four were recovered south of lat. 24°N (Fig. 7),
Pink shrimp which moved across the
98r--°__W__-'-_'_-T__~r-_-.:,94°
94 '
Figure 6.-Distribution of brown shrimp transboundary travelers, Mexico to Texas (number in grids 10 X 10 minutes).
25
----------
98"W 96" 94" 26'r-----r=or.;r-",-----'-;:-------,----;26, N
GULF OF MEXICO
24'f--\l'-------+---f-----+-----I24'
[1]
NUMBER OF RECAPTURE$-45 _--L-__--' 22
96' 94
Figure 7.-Distribution of white shrimp transboundary travelers, Texas to Mexico (number in grids 10 X LO minutes).
BROWN SHRIMP TRANSBOUNDARY MIGRATION
50 MEXICO
40 38
US TO MEX30
20
00
4
o ~----.---~ ~
25 24 23 22 21 20 '9 AREAS
Figure 1O.-Distribution of brown shrimp transboundary travelers by statisticaL subareas.
u.s. border from Mexico were clustered immediately north of the border, yet many of them migrated northward to the Aransas Pass area (Fig. 8). Pink shrimp migrating south were generally clustered around the border, but a large concentration was found south of lat. 25°N and an appreciable number moved south oflat. 24oN. Three were recovered just off Tampico (Fig. 9).
The longest distance traveled was 249 n.mi. (461 kIn) in 113 days by a brown shrimp released in August 1978. It had migrated from the U.S. statistical subarea 19 to statistical subarea 24 and had doubled its size. Eleven brown shrimp
9496 .
NUMBER OF RECAPTURES-79
TEXAS
28·f----'=H'-r.+7"""-r---+------128' N
Figure 8.-Distribution of pink shrimp transboundary travelers, Mexico to Texas (number in grids 10 x 10 minutes).
PINK SHRIMP TRANS BOUNDARY MIGRATION
'T MEXICO TEXAS06
60
1 '0
.."" '0
c
0
[," w
« u
US TO MEX
"
10 ,9./'" ~------.
o r -, ,- I , ,~ 25 2' 23 <2 2' 20 19
AREAS
Figure Il.-Distribution of pink shrimp transboundary travelers by statistical subareas.
migrated over 200 n.mi. (370 km). Most recoveries of brown and pink shrimp were made in statistical subareas 21 and 22 (Fig. 10, 11) The longest time at large before recapture was 446 days for a pink shrimp which was released in Mexico and migrated only n n.mi. (50 kIn) northward across the U.S. border into statistical subarea 21. Forty-three shrimp were at large 100 days or longer. Most of the transborder migrants were released in offshore waters, but of 1,533 brown and pink shrimp recaptured from the Port Isabel tagging study (March-
NUMBER OF RECAPTURES-89
98"W 94" 26'r'-----,;;;J;<,-;T-----'-;:-----,------;26' N
GULF OF MEXICO
I I24 ·f-\i-'----+---f------'------124'
Figure 9.-Distribution of pink shimp transboundary travelers, Texas to Mexico (number in grids LO X LO minutes).
98 W 96
TEXAS
26' N
MEXICO
GULF OF MEXICOr; OJ
24'
r BROWN SHRIMP
MAR-APR 1980
PORT ISABEL, T X
N=228)[1] 1 \ \
22
Figure 12.-Distribution of brown shrimp recoveries from Port Isabel, Texas shrimp tagging study, MarchApril 1980 (Grids are 10 x 10 minute intervals) .
April 1980), 42 were recaptured in Mexico. Seven recaptured brown shrimp left the U.S. estuary and moved across the border, one as far as lat. 23°N (subarea 24, Fig. 12). None of the recaptured brown shrimp moved north. Pink shrimp migrated offshore to the north and south, with a large number being caught in the U.S. Laguna Madre
Marine Fisheries Review 26
--------
----- ----20
. 3
2 1
9
10
119811
8
1
TEXAS
28 0
N
~_~ ..l__
94 0 92 0
GULF or MEXICO
2
I
PINK SHRIMP MAR·APR 1980
PORT ISABEL. TX
N=t274
J_
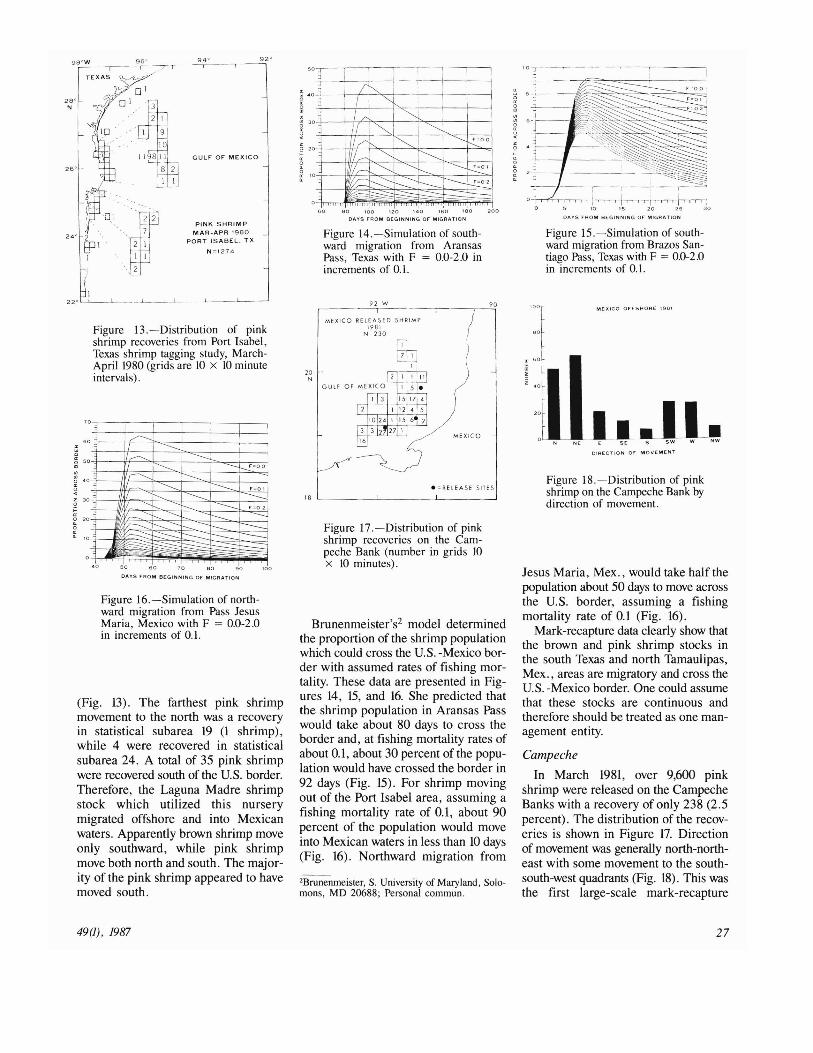
Figure 13.-~istribution of pink shrimp recoveries from Port Isabel, Texas shrimp taggmg study, M~rchApril 1980 (grids are 10 x 10 mmute intervals).
1
I50+---#.r:::......---.~,
I
------
:---+--2J""-=r-;~ .=00
.=0 I
r--. __ .-02
r---J rr---:. t---. t-- t--. ___
~~ 1
40' 50 6 0 70' 80 '0
DAYS FROM BEGINNING Of MIGRATION
Figure 16.-Simulation of northward migration from Pass Jesus Maria, Mexico with F = 0.0-2.0 in increments of 0.1.
(Fig. 13). The farthest pink shrimp movement to the north was a recovery in statistical subarea 19 (l shrimp), while 4 were recovered in statistical subarea 24. A total of 35 pink shrimp were recovered south of the US. border. Therefore, the Laguna Madre shrimp stock which utilized this nursery migrated offshore and into Mexican waters. Apparently brown shrimp ~ove
only southward, while pink shn.mp move both north and south. The maJority of the pink shrimp appeared to have moved south.
49 (J) , J9ff1
1 I I i I ::
I
~ I '0 .......~ I I
~AI0 1"-....I~I
r=o 0I~ ~I e----...0 "-....1 .~ -----
~
F=O 1I Ir-l. ~ ~ 1-----r---"'0 ~~---r----..-j---K0 2
~ ±-:::::0 , 0 eo 100 '20 140 6 'eo 2
DAYS FROM BEGINNING or MIGRATION
Figure 14.-Simulation of southward migration from Aransas Pass, Texas with F = 0.0-2.0 10
increments of 0.1.
92 w 90
MEXICO RELEASED SHRIMP \98\
N 130
20 N
MEXICO
• =RElEASE SITES 18 L --L --L ~
Figure 17.-Di~tribution of pink shrimp recoveries on the Campeche Bank (number in grids 10 X 10 minutes).
Brunenmeister's2 model determined the proportion of the shrimp po~ulation
which could cross the US. -MeXICO border with assumed rates of fishing mortality. These data are presented in Figures 14, 15, and 16. She predicted that the shrimp population in Aransas Pass would take about 80 days to cross the border and, at fishing mortality rates of about 0.1, about 30 percent of the pop~lation would have crossed the border In
92 days (Fig. 15). For shrimp m~ving
out of the Port Isabel area, assuming a fishing mortality rate of 0.1, about 90 percent of the population would move into Mexican waters in less than 10 days (Fig. 16). Northward migration from
'Brunenmeister, S. University of Maryland, Solomons, MD 20688; Personal commun.
'o-:r----·-----,--~-,
5 10 15 20 25 30
DAYS fROM BEGINNING Of MIGRATION
Figure IS.-Simulation of southward migration from Brazos Santiago Pass, Texas With F = 0.0-2.0 in increments of 0.1.
MEXICO OfrSHORE. 1961
eo
1• .Jl-!NE. E. SE S
D1RI:CTlON or MovEMENT
Figure 18.-Distribution of pink shrimp on the Campeche Bank by direction of movement.
Jesus Maria, Mex., would take half the population about 50 days to move acr?ss the U.S. border, assuming a fishing mortality rate of 0.1 (Fig. 16).
Mark-recapture data clearly show th~t
the brown and pink shrimp stocks In
the south Texas and north Tamaulipas, Mex. , areas are ntigratory and cross the US. -Mexico border. One could assume that these stocks are continuous and therefore should be treated as one management entity.
Campeche
In March 1981, over 9,600 pink shrimp were released on the Campeche Banks with a recovery of only 238 (2.5 percent). The distribution of th~ rec?veries is shown in Figure 17. DirectIOn of movement was generally north-northeast with some movement to the southsouth-west quadrants (Fig. 18). This was the first large-scale mark-recapture
27
200
150 i ~ J: I
Z 100 " ... ..J
..J 4: I 0 l-
SO
BROWN SHRIMP 1976-60 PINK SHRIMP 1976-60
APRIL-AUGUST SEXES COMBINED APRIL-AUGUST SEXES COMBINED 200
150
J: I
100Z " ... ..J
..J 4: I o I- 50
S INF = 166.09 K = 0.2469 N = 1429
S INF = 161.40 K = 0.3551 N = 2337
o 2.5 5.0 7.5 10.0
AGE (MONTHS)
0-+.-"---..",-,,"'1"'1"'---""-,,'1""""---"'1-"",,---.,'1-''--'--'-'1 o 2.5 5.0 7.5 10.0 12.5 15.0 12.5 15.0
AGE (MONTHS)
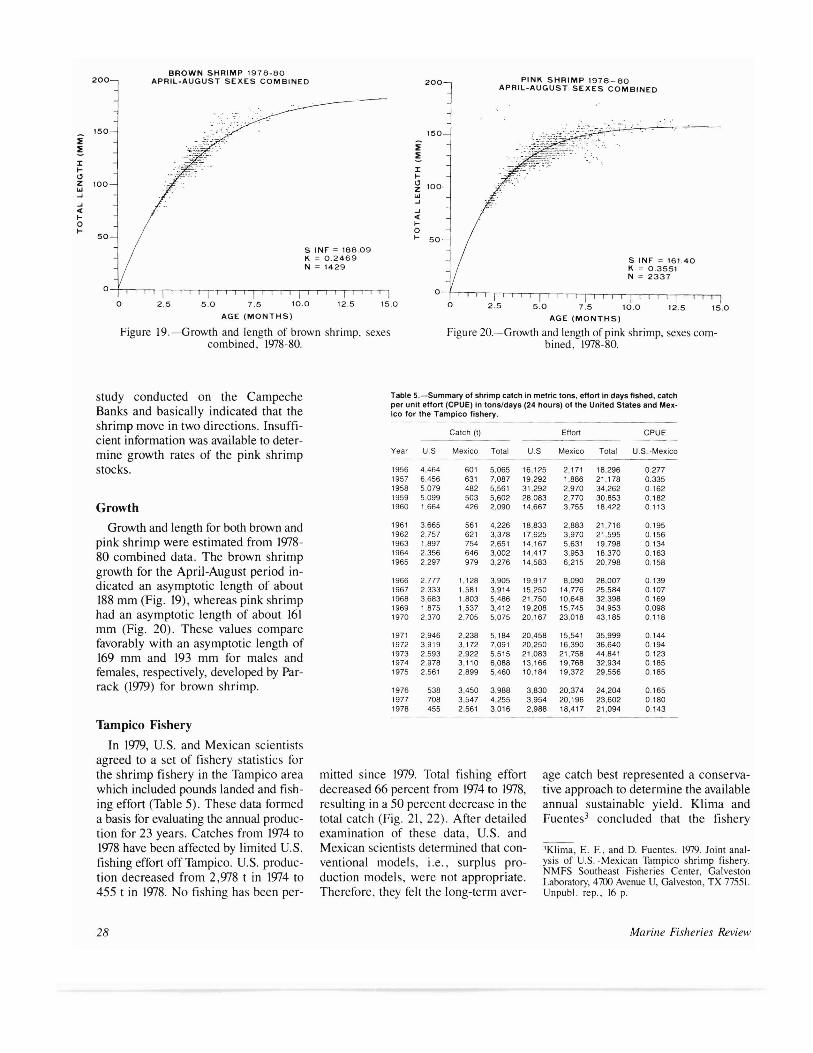
Figure 19. -Growth and length of brown shrimp, sexes Figure 20.-Growth and length of pink shrimp, sexes comcombined, 1978-80. bined, 1978-80.
Table 5.-Summary of shrimp catch in metric tons, effort in days fished, catch per unit effort (CPU E) in tons/days (24 hours) of the United States and Mex-
Banks and basically indicated that the ico for the Tampico fishery.
shrimp move in two directions, Insuffi
study conducted on the Campeche
Catch (t) Effort CPUE cient information was available to deter-
Year us Mexico Total U.S Mexico Total U.S. -Mexico mine growth rates of the pink shrimp stocks. 1956 4,464 601 5,065 16,125 2,171 18,296 0.277
1957 6,456 631 7,087 19,292 1,886 21,178 0.335 1958 5.079 482 5,561 31,292 2,970 34,262 0.162 1959 5,099 503 5,602 28,083 2,770 30,853 0.182 1960 1,664 426 2,090 14,667 3,755 18,422 0.113Growth 1961 3,665 561 4,226 18,833 2,883 21,716 0.195Growth and length for both brown and 1962 2,757 621 3,378 17,625 3,970 21,595 0.156
pink shrimp were estimated from 1978- 1963 1,897 754 2,651 14,167 5,631 19,798 0.134 1964 2,356 646 3,002 14,417 3,953 18,370 0.16380 combined data. The brown shrimp 1965 2,297 979 3,276 14,583 6,215 20,798 0.158
growth for the April-August period in1966 2.777 1,128 3,905 19,917 8,090 28,007 0.139dicated an asymptotic length of about 1967 2,333 1,581 3,914 15,250 14,776 25,584 0.107
188 mm (Fig. 19), whereas pink shrimp 1968 3,683 1,803 5,486 21,750 10,648 32,398 0.169 1969 1.875 1,537 3,412 19,208 15,745 34,953 0.098
had an asymptotic length of about 161 1970 2,370 2,705 5,075 20,167 23,018 43,185 0.118
mm (Fig. 20). These values compare 1971 2,946 2,238 5,184 20,458 15,541 35,999 0.144
favorably with an asymptotic length of 1972 3,919 3,172 7,091 20,250 16,390 36,640 0.194 1973 2,593 2,922 5,515 21,083 21,758 44,841 0.123169 mm and 193 mm for males and 1974 2,978 3,110 6,088 13,166 19,768 32,934 0.185
females, respectively, developed by Par- 1975 2,561 2,899 5,460 10,184 19,372 29,556 0.185
rack (1979) for brown shrimp. 1976 538 3,450 3,988 3,830 20,374 24,204 0.165 1977 708 3,547 4,255 3,954 20,196 23,602 0.180 1978 455 2,561 3,016 2,988 18,417 21,094 0.143
Tampico Fishery
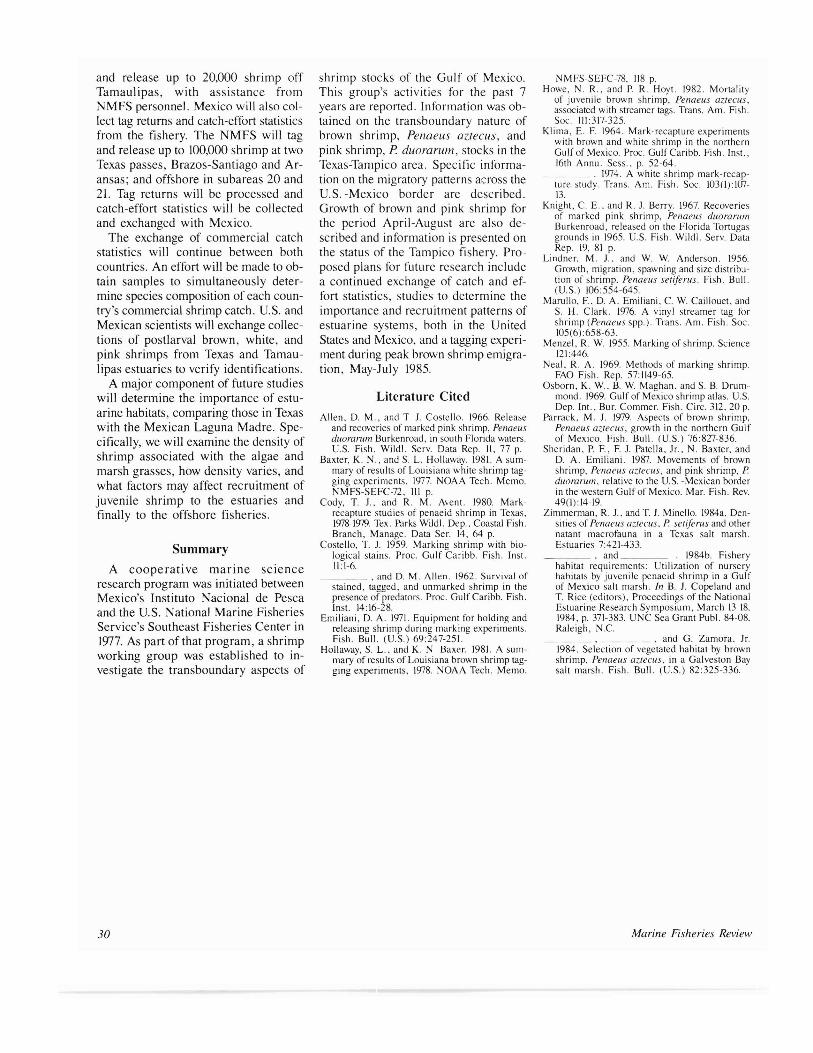
In 1979, U.S. and Mexican scientists agreed to a set of fishery statistics for the shrimp fishery in the Tampico area which included pounds landed and fishing effort (Table 5). These data formed a basis for evaluating the annual production for 23 years. Catches from 1974 to 1978 have been affected by limited U.S. fishing effort off Tampico. U.S. production decreased from 2,978 t in 1974 to 455 t in 1978. No fishing has been per
mitted since 1979. Total fishing effort decreased 66 percent from 1974 to 1978, resulting in a 50 percent decrease in the total catch (Fig. 21, 22), After detailed examination of these data, U.S. and Mexican scientists determined that conventional models, i.e., surplus production models, were not appropriate. Therefore, they felt the long-term aver
age catch best represented a conservative approach to determine the available annual sustainable yield. Klima and Fuentes3 concluded that the fishery
'Klima, E. F., and D. Fuentes. 1979. Joint analysis of U.S. -Mexican Tampico shrimp fishery. NMFS Southeast Fisheries Center, Galveston Laboratory, 4700 Avenue U, Galveston, TX 77551. Unpubl. rep., 16 p.
Marine Fisheries Review 28
ANNUAL CATCH
:f
:t 0" , • ! I J..--'
1956 56 60 62 64 66 68 70 72 74 76 78
YEAR
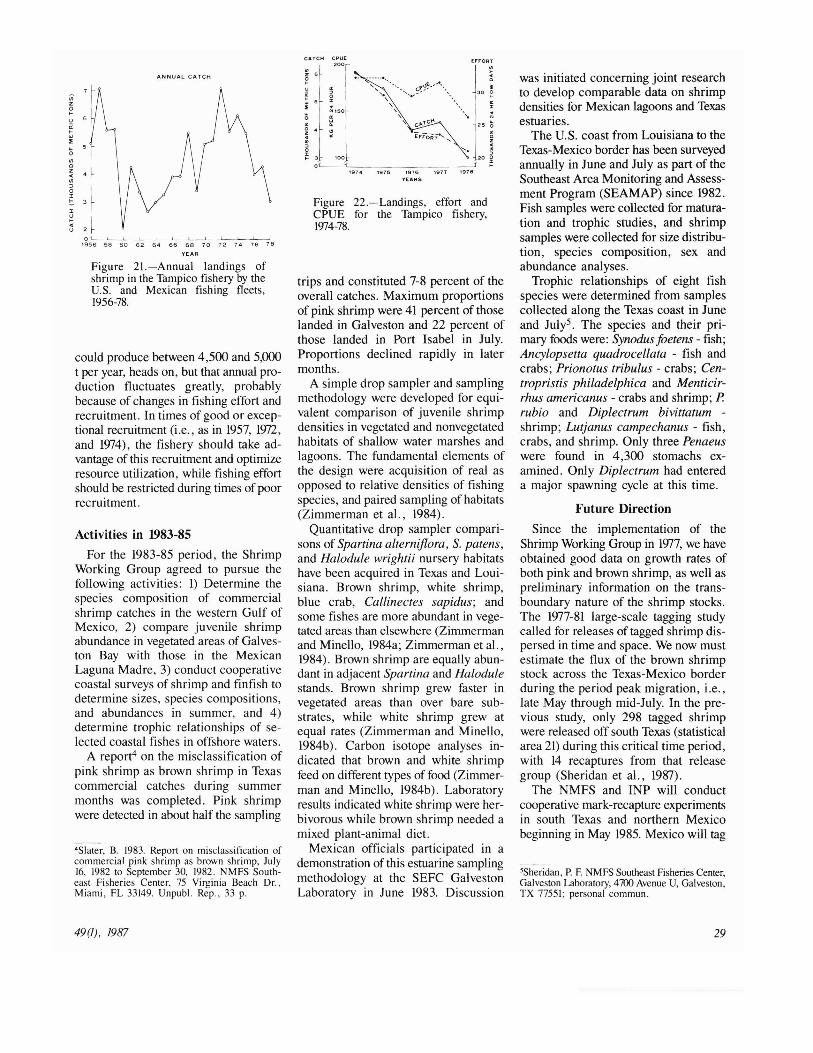
Figure 21.-Annual landings of shrimp in the Tampico fishery by the U.S. and Mexican fishing fleets, 1956-78.
could produce between 4,500 and 5,000 t per year, heads on, but that annual production fluctuates greatly, probably because of changes in fishing effort and recruitment. In times of good or exceptional recruitment (i.e., as in 1957, 1972, and 1974), the fishery should take advantage of this recruitment and optimize resource utilization, while fishing effort should be restricted during times of poor recruitment.
Activities in 1983-85
For the 1983-85 period, the Shrimp Working Group agreed to pursue the following activities: 1) Determine the species composition of commercial shrimp catches in the western Gulf of Mexico, 2) compare juvenile shrimp abundance in vegetated areas of Galveston Bay with those in the Mexican Laguna Madre, 3) conduct cooperative coastal surveys of shrimp and finfish to determine sizes, species compositions, and abundances in summer, and 4) determine trophic relationships of selected coastal fishes in offshore waters.
A report4 on the misclassification of pink shrimp as brown shrimp in Texas commercial catches during summer months was completed. Pink shrimp were detected in about half the sampling
4SIater, B. 1983. Report on misclassification of commercial pink shrimp as brown shrimp, July 16, 1982 to September 30, 1982. NMFS Southeast Fisheries Center, 75 Virginia Beach Dr., Miami, FL 33149. Unpubl. Rep., 33 p.
49(1), 1987
CATCH CPUE 200
Figure 22.-Landings, effort and CPUE for the Tampico fishery, 1974-78.
trips and constituted 7-8 percent of the overall catches. Maximum proportions of pink shrimp were 41 percent of those landed in Galveston and 22 percent of those landed in Port Isabel in July. Proportions declined rapidly in later months.
A simple drop sampler and sampling methodology were developed for equivalent comparison of juvenile shrimp densities in vegetated and nonvegetated habitats of shallow water marshes and lagoons. The fundamental elements of the design were acquisition of real as opposed to relative densities of fishing species, and paired sampling of habitats (Zimmerman et al., 1984).
Quantitative drop sampler comparisons of Spartina alterniflora, S. patens, and Halodule wrightii nursery habitats have been acquired in Texas and Louisiana. Brown shrimp, white shrimp, blue crab, Callinectes sapidus; and some fishes are more abundant in vegetated areas than elsewhere (Zimmerman and Minello, 1984a; Zimmerman et aI., 1984). Brown shrimp are equally abundant in adjacent Spartina and Halodule stands. Brown shrimp grew faster in vegetated areas than over bare substrates, while white shrimp grew at equal rates (Zimmerman and Minello, 1984b). Carbon isotope analyses indicated that brown and white shrimp feed on different types of food (Zimmerman and Minello, 1984b). Laboratory results indicated white shrimp were herbivorous while brown shrimp needed a mixed plant-animal diet.
Mexican officials participated in a demonstration of this estuarine sampling methodology at the SEFC Galveston Laboratory in June 1983. Discussion
was initiated concerning joint research to develop comparable data on shrimp densities for Mexican lagoons and Texas estuaries.
The U.S. coast from Louisiana to the Texas-Mexico border has been surveyed annually in June and July as part of the Southeast Area Monitoring and Assessment Program (SEAMAP) since 1982. Fish samples were collected for maturation and trophic studies, and shrimp samples were collected for size distribution, species composition, sex and abundance analyses.
Trophic relationships of eight fish species were determined from samples collected along the Texas coast in June and July5. The species and their primary foods were: Synodus foetens - fish; Ancylopsetta quadrocellata - fish and crabs; Prionotus tribulus - crabs; Centropristis philadelphica and Menticirrhus americanus - crabs and shrimp; P rubio and Diplectrum bivittatum shrimp; Lutjanus campechanus - fish, crabs, and shrimp. Only three Penaeus were found in 4,300 stomachs examined. Only Diplectrum had entered a major spawning cycle at this time.
Future Direction
Since the implementation of the Shrimp Working Group in 1977, we have obtained good data on growth rates of both pink and brown shrimp, as well as preliminary information on the transboundary nature of the shrimp stocks. The 1977-81 large-scale tagging study called for releases of tagged shrimp dispersed in time and space. We now must estimate the flux of the brown shrimp stock across the Texas-Mexico border during the period peak migration, i.e., late May through mid-July. In the previous study, only 298 tagged shrimp were released off south Texas (statistical area 21) during this critical time period, with 14 recaptures from that release group (Sheridan et aI., 1987).
The NMFS and INP will conduct cooperative mark-recapture experiments in south Texas and northern Mexico beginning in May 1985. Mexico will tag
'Sheridan, P. F. NMFS Southeast Fisheries Center, Galveston Labomtory, 4700 Avenue U, Galveston, TX 77551; personal commun.
29
and release up to 20,000 shrimp off Tamaulipas, with assistance from NMFS personnel. Mexico will also collect tag returns and catch-effort statistics from the fishery. The NMFS will tag and release up to 100,000 shrimp at two Texas passes, Brazos-Santiago and Aransas; and offshore in subareas 20 and 21. Tag returns will be processed and catch-effort statistics will be collected and exchanged with Mexico.
The exchange of commercial catch statistics will continue between both countries. An effort will be made to obtain samples to simultaneously determine species composition of each country's commercial shrimp catch. U.S. and Mexican scientists will exchange collections of postlarval brown, white, and pink shrimps from Texas and Tamaulipas estuaries to verify identifications.
A major component of future studies will determine the importance of estuarine habitats, comparing those in Texas with the Mexican Laguna Madre. Specifically, we will examine the density of shrimp associated with the algae and marsh grasses, how density varies, and what factors may affect recruitment of juvenile shrimp to the estuaries and finally to the offshore fisheries.
Summary
A cooperative marine science research program was initiated between Mexico's Instituto Nacional de Pesca and the U.S. National Marine Fisheries Service's Southeast Fisheries Center in 1fJ77. As part of that program, a shrimp working group was established to investigate the transboundary aspects of
shrimp stocks of the Gulf of Mexico. This group's activities for the past 7 years are reported. Information was obtained on the transboundary nature of brown shrimp, Penaeus aztecus, and pink shrimp, P duorarum, stocks in the Texas-Tampico area. Specific information on the migratory patterns across the U.S. -Mexico border are described. Growth of brown and pink shrimp for the period April-August are also described and information is presented on the status of the Tampico fishery. Proposed plans for future research include a continued exchange of catch and effort statistics, studies to determine the importance and recruitment patterns of estuarine systems, both in the United States and Mexico, and a tagging experiment during peak brown shrimp emigration, May-July 1985.
Literature Cited
Allen. D. M., and T 1. Costello. 1966. Release and recoveries of marked pink shrimp, Penaeus duorarum Burkenroad. in south Florida waters. US. Fish. Wildl. Servo Data Rep. II, 77 p.
Baxter, K. N., and S. L. Hollaway. 1981. A summary of results of Louisiana white shrimp tagging experiments. 1977. NOAA Tech. Memo. NMFS-SEFC-72, III p.
Cody, 1. 1.. and R. M. A\ent. 1980. Markrecapture studies of penaeid shrimp in Texas, 1978-1979. Tex. Parks Wildl. Dep.. Coastal Fish. Branch, Manage. Data Ser. \4, 64 p.
Costello, 1. 1. 1959. Marking shrimp with biological stains. Proc. Gulf Caribb. Fish. lnst. 11: 1-6.
____ . and D. M. Allen. 1962. Survival of stained, tagged, and unmarked shrimp in the presence of predators. Proc. Gulf Caribb. Fish. lnst. 14: 16-28.
Emiliani, D. A. 1971. Equipment for holding and releasing shrimp during marking experiments. Fish. Bull. (US.) 69:247-251.
Hollaway, S. L., and K. N Baxer. 1981. A summary of results of Louisiana brown shrimp tagging experiments, 1978. NOAA Tech. Memo.
NMFS-SEFC-78, 118 p. Howe, N. R., and P. R. Hoyt. 1982. Mortality
of juvenile brown shrimp, Penaeus aztecus, associated with streamer tags. Trans. Am. Fish. Soc. 111:317-325.
Klima, E. F. 1964. Mark-recapture experiments with brown and white shrimp in the northern Gulf of Mexico. Proc. Gulf Caribb. Fish. Inst., 16th Annu. Sess., p. 52-64.
1974. A white shrimp mark-recapture study. Trans. Am. Fish. Soc. 103(1):10713.
Knight, C. E .. and R. 1. Berry. 1967. Recoveries of marked pink shrimp, Penaeus duorarum Burkenroad, released on the Florida Tortugas grounds in 1965. U.S. Fish. Wildl. Servo Data Rep. 19, 81 p.
Lindner. M. 1.. and W. W. Anderson. 1956. Growth, migration, spawning and size distrib;Jtion of shrimp. Penaeus seti/ems. Fish. Bull. (U.S.) 106:554-645.
Marullo, F.. D. A. Emiliani. C. W. Caillouet, and S. H. Clark. 1976. A vinyl streamer tag for shrimp (Penaeus spp.). Trans. Am. Fish. Soc. 105(6):658-63.
Menzel, R. W. 1955. Marking of shrimp. Science 121:446.
Neal. R. A. 1969. Methods of marking shrimp. FAO Fish. Rep. 57:1149-65.
Osborn, K. w.. B. W. Maghan, and S. B. Drum· mond. 1969. Gulf of Mexico shrimp atlas. U.S. Dep. Int.. Bur. Commer. Fish. Circ. 312. 20 p.
Parrack. M. 1. 1979. Aspects of brown shrimp, Penaells azteclIS, growth in the northern Gulf of Mexico. Fish. Bull. (US.) 76:827-836.
Sheridan. P. F., F. 1. Patella. Jr.. N. Baxter. and D. A. Emiliani. 1987. Movements of brown shrimp, Penaells azteclIS, and pink shrimp, P duorarum, relative to the US. -Mexican border in the western Gulf of Mexico. Mar. Fish. Rev. 49(1):14-19.
Zimmerman, R. 1.. and 1. 1. Minello. 1984a. Densities of Penaells azteclIs. P setiferlls and other natant macrofauna in a Texas salt marsh. Estuaries 7:421-433.
____ , and 1984b. Fishery habitat requirements: Utilization of nursery habitats by juvenile penaeid shrimp in a Gulf of Mexico salt marsh. In B. 1. Copeland and 1. Rice (editors), Proceedings of the National Estuarine Research Symposium, March 13-18. 1984, p. 371-383. UNC Sea Grant Publ. 84-08. Raleigh, N.C.
____ , , and G. Zamora. Jr. 1984. Selection of vegetated habitat by brown shrimp, Penaeus azteclIS, in a Galveston Bay salt marsh. Fish. Bull (US.) 82:325-336.
Marine Fisheries Review 30