Embed Size (px)
Citation preview

Mexico Real Estate Outlook 1st HALF 2018 | MEXICO UNIT
Mexico Real Estate Outlook / 1st Half 2018 2
Contents
1. Summary 3
2. Situation 5
2a. Construction to start from the foundations 5
2b. The mortgage market in the downside of the cycle 13
3. Special Topics 23
3a. The significance of business expectations in construction 23
3b. Low mortgage debt of households 31
4. Anexo estadístico 35
5. Special topics included in previous issues 39
Closing date: 20 December 2017
Mexico Real Estate Outlook / 1st Half 2018 3
1. Summary
The trend in construction continues to show lower growth than that of the economy in general. In the third quarter, the fall
of the accumulated GDP of the sector is -1.2% as an annual rate, largely due to civil works, which have fallen by 11%.
Building will close with a growth of 0.5%. Civil works will not rebound due to the adjustments in public expenditure.
Meanwhile, the deceleration of building is what has consolidated the fall in the sector. The expected trend for the sector in
2018 is a slight fall.
In the mortgage market, the amount of financing by banks from January to October 2017 decreased by -7.3% in real terms
with respect to the same period of the previous year. In addition, Infonavit has gained ground in the commercial banking
market with an increase of 9.6%. The main variable that explains the demand for housing loans, those insured with the
IMSS, has grown at a rate of 4% per year. However, it has not been enough to maintain the origination of mortgage loans,
since there has been a fall in real wages. On the other hand, consumer confidence has slowed down its decline. Throughout
the year the financing by banks for the acquisition of new housing continues to represent 65% of the loans originated.
Due to the increases in the reference rate by the monetary authority that are transferred to the interest rates for construction,
the cost of financing for building has increased; although in a smaller proportion than the increases by the central bank.
Along with this, the increase in the costs of construction materials and the rental of machinery and equipment have adversely
affected the supply of new housing. However, the lower demand for new housing is the main factor of lower activity.
As well as analysing the effect of consumer confidence on the demand for housing, in this issue of Mexico Real Estate
Outlook we have prepared an analysis of the confidence of entrepreneurs in the construction sector. This confidence
indicator published by INEGI effectively has predictive power over the value of building, mainly in productive building.
The effect of this indicator of business confidence is not limited to construction, but has effects on real estate services, since
this production increases the real estate pool where these services are offered. The GDP of real estate services grew by
2.9% in the third quarter of 2017 and has maintained a good performance. This influences the decision to invest by builders,
who could react to a greater need for real estate such as industrial warehouses or tourist and commercial infrastructure.

Mexico Real Estate Outlook / 1st Half 2018 4
Finally, we have looked to ascertain the perspective of consumers regarding the cost of mortgage credit. We do this through
the National Household Income and Expenditure Survey, conducted every two years by INEGI. Households respond that
they spend on average only 13% of their current monetary income to pay for housing. This shows a low level of indebtedness
consistent with the low delinquency of the bank mortgage portfolio. The level of mortgage debt is lower for those who have
an income equivalent to more than 5 times the minimum wage. This is the same segment that is more likely to grow next
year to return the mortgage market to the path of growth.
Mexico Real Estate Outlook / 1st Half 2018 5
2. Situation
2a. Construction to start from the foundations
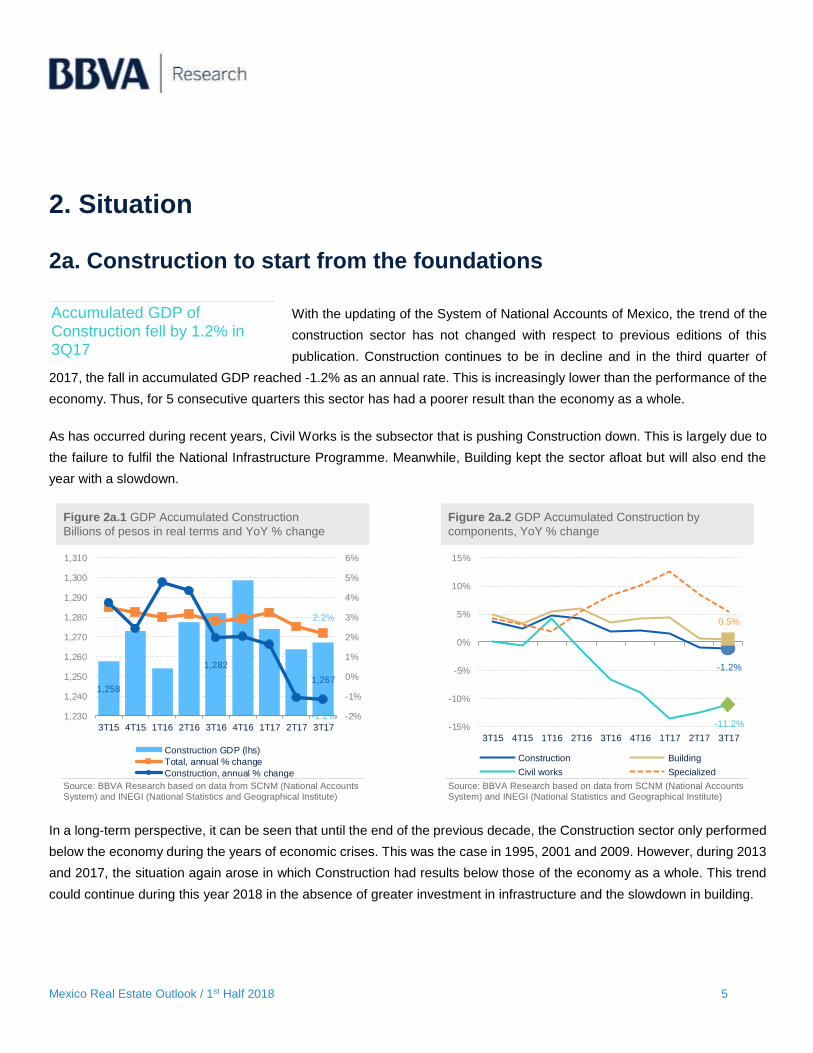
With the updating of the System of National Accounts of Mexico, the trend of the
construction sector has not changed with respect to previous editions of this
publication. Construction continues to be in decline and in the third quarter of
2017, the fall in accumulated GDP reached -1.2% as an annual rate. This is increasingly lower than the performance of the
economy. Thus, for 5 consecutive quarters this sector has had a poorer result than the economy as a whole.
As has occurred during recent years, Civil Works is the subsector that is pushing Construction down. This is largely due to
the failure to fulfil the National Infrastructure Programme. Meanwhile, Building kept the sector afloat but will also end the
year with a slowdown.
Figure 2a.1 GDP Accumulated Construction
Billions of pesos in real terms and YoY % change Figure 2a.2 GDP Accumulated Construction by
components, YoY % change
Source: BBVA Research based on data from SCNM (National Accounts System) and INEGI (National Statistics and Geographical Institute)
Source: BBVA Research based on data from SCNM (National Accounts System) and INEGI (National Statistics and Geographical Institute)
In a long-term perspective, it can be seen that until the end of the previous decade, the Construction sector only performed
below the economy during the years of economic crises. This was the case in 1995, 2001 and 2009. However, during 2013
and 2017, the situation again arose in which Construction had results below those of the economy as a whole. This trend
could continue during this year 2018 in the absence of greater investment in infrastructure and the slowdown in building.
1,258
1,282
1,267
2.2%
-1.2% -2%
-1%
0%
1%
2%
3%
4%
5%
6%
1,230
1,240
1,250
1,260
1,270
1,280
1,290
1,300
1,310
3T15 4T15 1T16 2T16 3T16 4T16 1T17 2T17 3T17
Construction GDP (lhs)
Total, annual % change
Construction, annual % change
-1.2%
0.5%
-11.2%-15%
-10%
-5%
0%
5%
10%
15%
3T15 4T15 1T16 2T16 3T16 4T16 1T17 2T17 3T17
Construction Building
Civil works Specialized
Accumulated GDP of Construction fell by 1.2% in 3Q17
Mexico Real Estate Outlook / 1st Half 2018 6
Figure 2a.3, 2a.4 and 2a.5 Total Gross Domestic Product and Construction (cyclic trend)
YoY % change
Source: BBVA Research based on data from SCNM (National Accounts System) and INEGI (National Statistics and Geographical Institute)
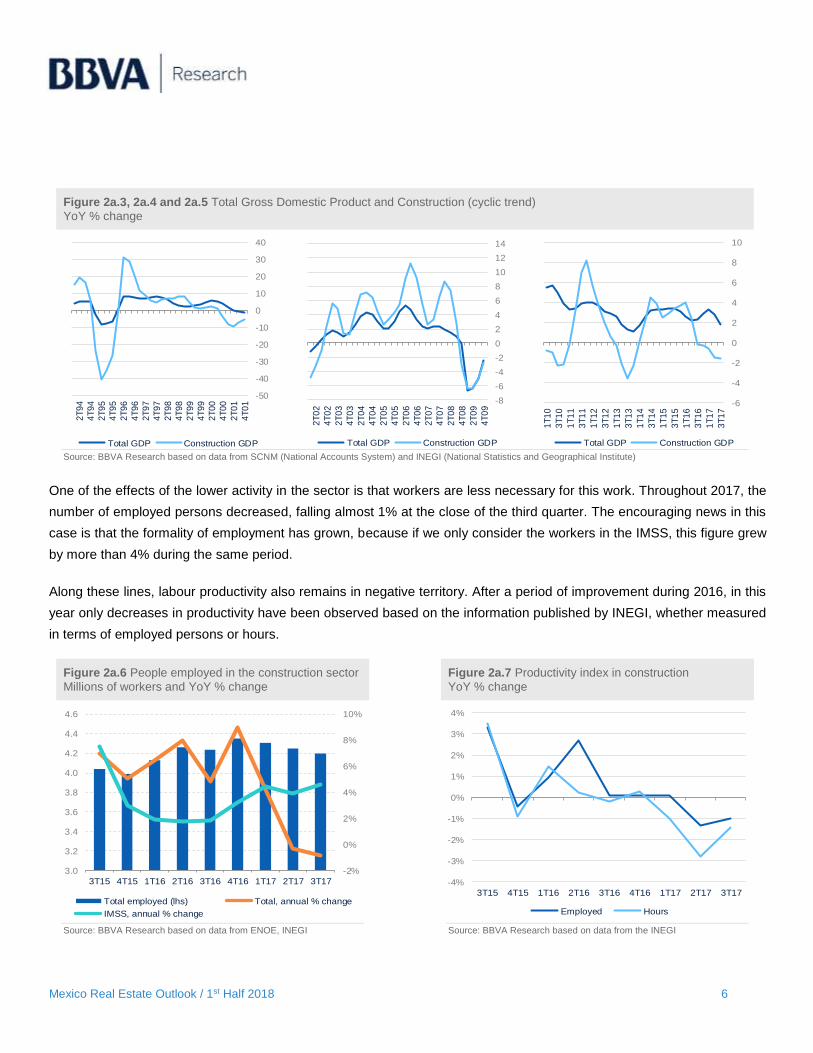
One of the effects of the lower activity in the sector is that workers are less necessary for this work. Throughout 2017, the
number of employed persons decreased, falling almost 1% at the close of the third quarter. The encouraging news in this
case is that the formality of employment has grown, because if we only consider the workers in the IMSS, this figure grew
by more than 4% during the same period.
Along these lines, labour productivity also remains in negative territory. After a period of improvement during 2016, in this
year only decreases in productivity have been observed based on the information published by INEGI, whether measured
in terms of employed persons or hours.
Figure 2a.6 People employed in the construction sector
Millions of workers and YoY % change Figure 2a.7 Productivity index in construction
YoY % change
Source: BBVA Research based on data from ENOE, INEGI Source: BBVA Research based on data from the INEGI
-50
-40
-30
-20
-10
0
10
20
30
404
T0
1
2T
01
4T
00
2T
00
4T
99
2T
99
4T
98
2T
98
4T
97
2T
97
4T
96
2T
96
4T
95
2T
95
4T
94
2T
94
Total GDP Construction GDP
-8
-6
-4
-2
0
2
4
6
8
10
12
14
4T
09
2T
09
4T
08
2T
08
4T
07
2T
07
4T
06
2T
06
4T
05
2T
05
4T
04
2T
04
4T
03
2T
03
4T
02
2T
02
Total GDP Construction GDP
-6
-4
-2
0
2
4
6
8
10
3T
17
1T
17
3T
16
1T
16
3T
15
1T
15
3T
14
1T
14
3T
13
1T
13
3T
12
1T
12
3T
11
1T
11
3T
10
1T
10
Total GDP Construction GDP
-2%
0%
2%
4%
6%
8%
10%
3.0
3.2
3.4
3.6
3.8
4.0
4.2
4.4
4.6
3T15 4T15 1T16 2T16 3T16 4T16 1T17 2T17 3T17
Total employed (lhs) Total, annual % change
IMSS, annual % change
-4%
-3%
-2%
-1%
0%
1%
2%
3%
4%
3T15 4T15 1T16 2T16 3T16 4T16 1T17 2T17 3T17
Employed Hours

Mexico Real Estate Outlook / 1st Half 2018 7
Recently, Construction has also had to bear the increase in the prices of its inputs.
In general, as of September 2017, the National Producer Price Index for
construction increased 9.7%. This variation is quite significant, but looks lower when compared to the 13% increase in costs
in January of last year.
The greatest impact of prices comes in construction materials, where cement and concrete stand out from the rest.
Secondly, the rental prices of machinery and equipment have the highest increases, in this case influenced by the effect of
the increase in the exchange rate.
Figure 2a.8 INPP Construction inputs
YoY % change Figure 2a.9 National Producer Price Index
Base 2008 = 100
Source: BBVA Research based on data from the INEGI Source: BBVA Research based on data from the INEGI
Until mid-2017, the value of private construction had presented advances, sometimes above 10% at an annual rate.
However, starting in August, it also fell to negative rates and converged with the negative performance of the value of public
construction.
As we have commented during these years, the main reason for the deterioration in construction arises from the lower
budget and spending that is dedicated to infrastructure works. This trend has been maintained during the current year, since
as we can see both the budget was lower as well as the expenditure dedicated to physical capital mainly by the applications
at federal level.1
1: Although not all expenditure on physical capital goes to public works or infrastructure projects, the greater part does, and this tends to explain changes in the civil engineering sub-sector.
0%
2%
4%
6%
8%
10%
12%
14%
16%
sep.-16 nov.-16 ene.-17 mar.-17 may.-17 jul.-17 sep.-17
Headline
Construction inputs
Rental of machinery and equipment
Wages
80
90
100
110
120
130
140
sep.-16 nov.-16 ene.-17 mar.-17 may.-17 jul.-17 sep.-17
Construction Building Civil works
Prices of inputs rose at the rate of 9.7% in 3Q17
Mexico Real Estate Outlook / 1st Half 2018 8
Figure 2a.10 Value of construction by sector
YoY % change Figure 2a.11 Public physical capital expenditure
YoY % change
Source: BBVA Research based on data from the INEGI Source: BBVA Research based on data from the INEGI
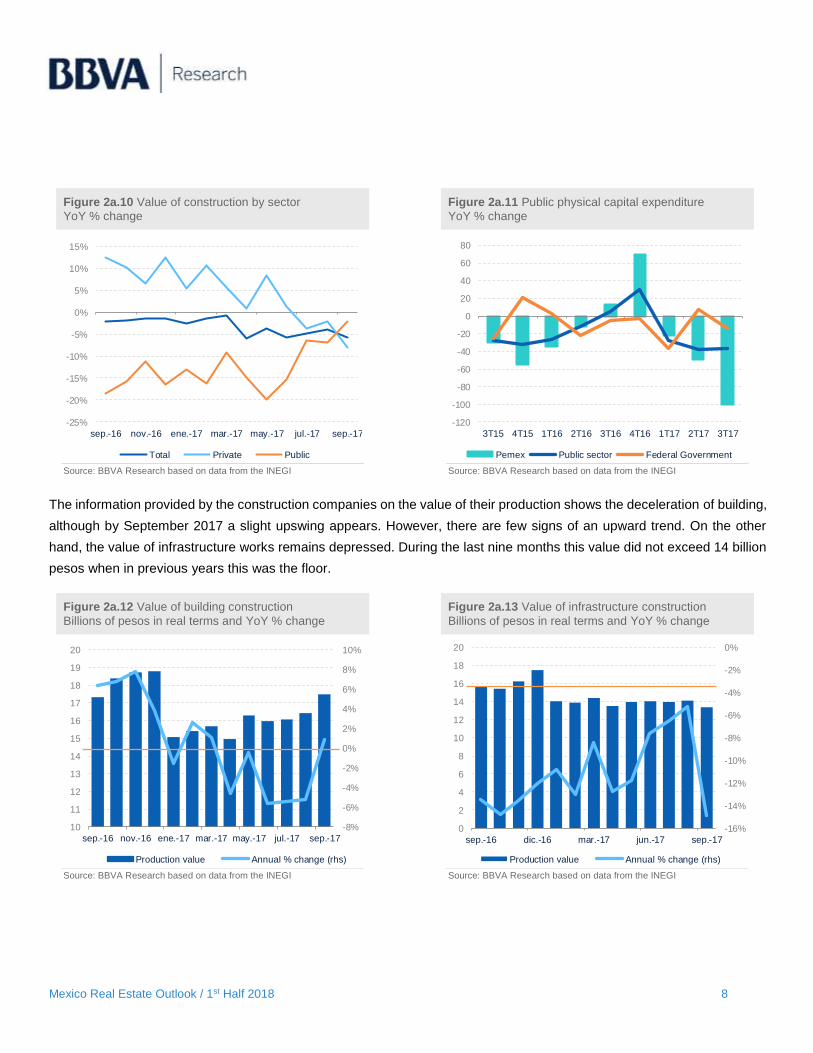
The information provided by the construction companies on the value of their production shows the deceleration of building,
although by September 2017 a slight upswing appears. However, there are few signs of an upward trend. On the other
hand, the value of infrastructure works remains depressed. During the last nine months this value did not exceed 14 billion
pesos when in previous years this was the floor.
Figure 2a.12 Value of building construction
Billions of pesos in real terms and YoY % change Figure 2a.13 Value of infrastructure construction
Billions of pesos in real terms and YoY % change
Source: BBVA Research based on data from the INEGI Source: BBVA Research based on data from the INEGI
-25%
-20%
-15%
-10%
-5%
0%
5%
10%
15%
sep.-16 nov.-16 ene.-17 mar.-17 may.-17 jul.-17 sep.-17
Total Private Public
-120
-100
-80
-60
-40
-20
0
20
40
60
80
3T15 4T15 1T16 2T16 3T16 4T16 1T17 2T17 3T17
Pemex Public sector Federal Government
-8%
-6%
-4%
-2%
0%
2%
4%
6%
8%
10%
10
11
12
13
14
15
16
17
18
19
20
sep.-16 nov.-16 ene.-17 mar.-17 may.-17 jul.-17 sep.-17
Production value Annual % change (rhs)
-16%
-14%
-12%
-10%
-8%
-6%
-4%
-2%
0%
0
2
4
6
8
10
12
14
16
18
20
sep.-16 dic.-16 mar.-17 jun.-17 sep.-17
Production value Annual % change (rhs)
Mexico Real Estate Outlook / 1st Half 2018 9
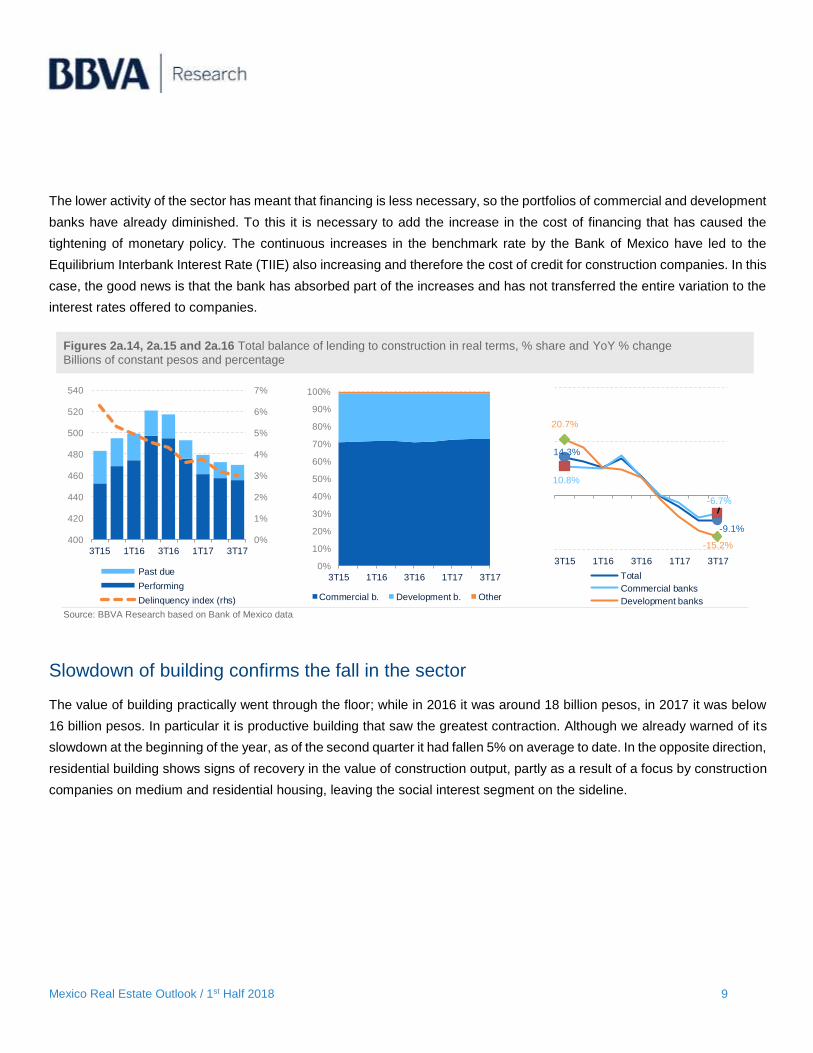
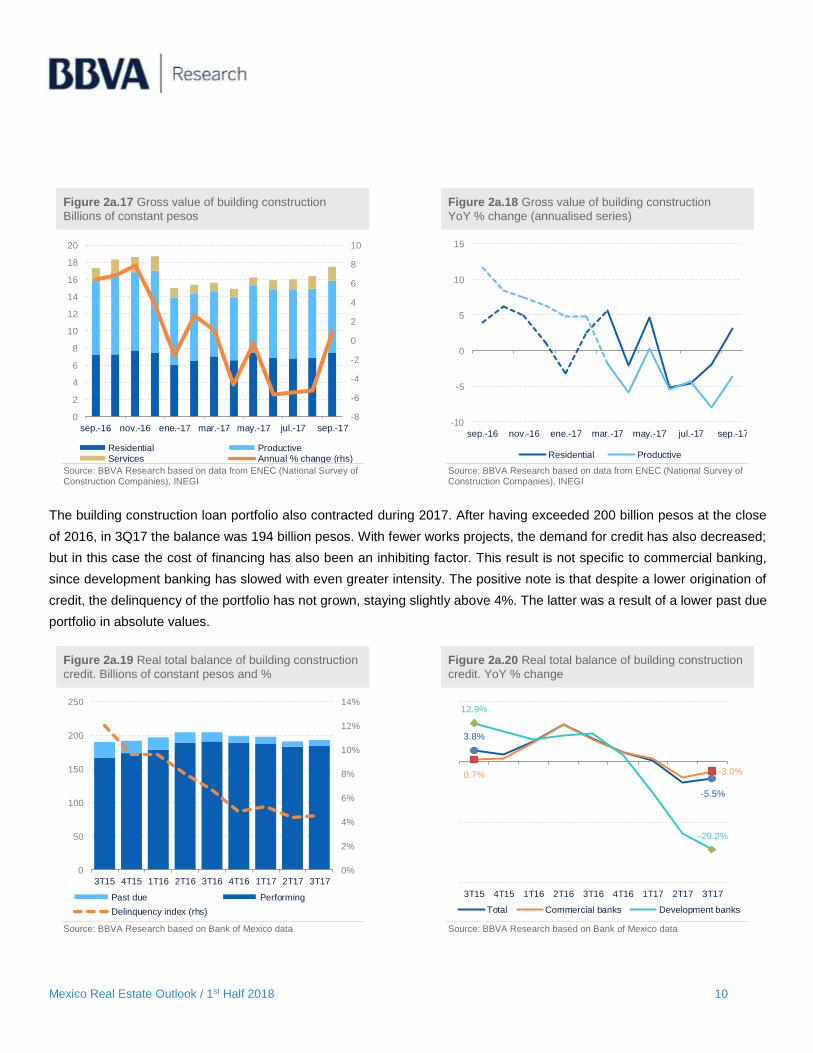
The lower activity of the sector has meant that financing is less necessary, so the portfolios of commercial and development
banks have already diminished. To this it is necessary to add the increase in the cost of financing that has caused the
tightening of monetary policy. The continuous increases in the benchmark rate by the Bank of Mexico have led to the
Equilibrium Interbank Interest Rate (TIIE) also increasing and therefore the cost of credit for construction companies. In this
case, the good news is that the bank has absorbed part of the increases and has not transferred the entire variation to the
interest rates offered to companies.
Figures 2a.14, 2a.15 and 2a.16 Total balance of lending to construction in real terms, % share and YoY % change
Billions of constant pesos and percentage
Source: BBVA Research based on Bank of Mexico data
Slowdown of building confirms the fall in the sector
The value of building practically went through the floor; while in 2016 it was around 18 billion pesos, in 2017 it was below
16 billion pesos. In particular it is productive building that saw the greatest contraction. Although we already warned of its
slowdown at the beginning of the year, as of the second quarter it had fallen 5% on average to date. In the opposite direction,
residential building shows signs of recovery in the value of construction output, partly as a result of a focus by construction
companies on medium and residential housing, leaving the social interest segment on the sideline.
0%
1%
2%
3%
4%
5%
6%
7%
400
420
440
460
480
500
520
540
3T15 1T16 3T16 1T17 3T17
Past due
Performing
Delinquency index (rhs)
0%
10%
20%
30%
40%
50%
60%
70%
80%
90%
100%
3T15 1T16 3T16 1T17 3T17
Commercial b. Development b. Other
14.3%
-9.1%
10.8%
-6.7%
20.7%
-15.2%
3T15 1T16 3T16 1T17 3T17
Total
Commercial banks
Development banks
Mexico Real Estate Outlook / 1st Half 2018 10
Figure 2a.17 Gross value of building construction
Billions of constant pesos Figure 2a.18 Gross value of building construction
YoY % change (annualised series)
Source: BBVA Research based on data from ENEC (National Survey of Construction Companies), INEGI
Source: BBVA Research based on data from ENEC (National Survey of Construction Companies), INEGI
The building construction loan portfolio also contracted during 2017. After having exceeded 200 billion pesos at the close
of 2016, in 3Q17 the balance was 194 billion pesos. With fewer works projects, the demand for credit has also decreased;
but in this case the cost of financing has also been an inhibiting factor. This result is not specific to commercial banking,
since development banking has slowed with even greater intensity. The positive note is that despite a lower origination of
credit, the delinquency of the portfolio has not grown, staying slightly above 4%. The latter was a result of a lower past due
portfolio in absolute values.
Figure 2a.19 Real total balance of building construction
credit. Billions of constant pesos and % Figure 2a.20 Real total balance of building construction
credit. YoY % change
Source: BBVA Research based on Bank of Mexico data Source: BBVA Research based on Bank of Mexico data
-8
-6
-4
-2
0
2
4
6
8
10
0
2
4
6
8
10
12
14
16
18
20
sep.-16 nov.-16 ene.-17 mar.-17 may.-17 jul.-17 sep.-17
Residential ProductiveServices Annual % change (rhs)
-10
-5
0
5
10
15
sep.-16 nov.-16 ene.-17 mar.-17 may.-17 jul.-17 sep.-17
Residential Productive
0%
2%
4%
6%
8%
10%
12%
14%
0
50
100
150
200
250
3T15 4T15 1T16 2T16 3T16 4T16 1T17 2T17 3T17
Past due Performing
Delinquency index (rhs)
3.8%
-5.5%
0.7% -3.0%
12.9%
-29.2%
3T15 4T15 1T16 2T16 3T16 4T16 1T17 2T17 3T17
Total Commercial banks Development banks
Mexico Real Estate Outlook / 1st Half 2018 11
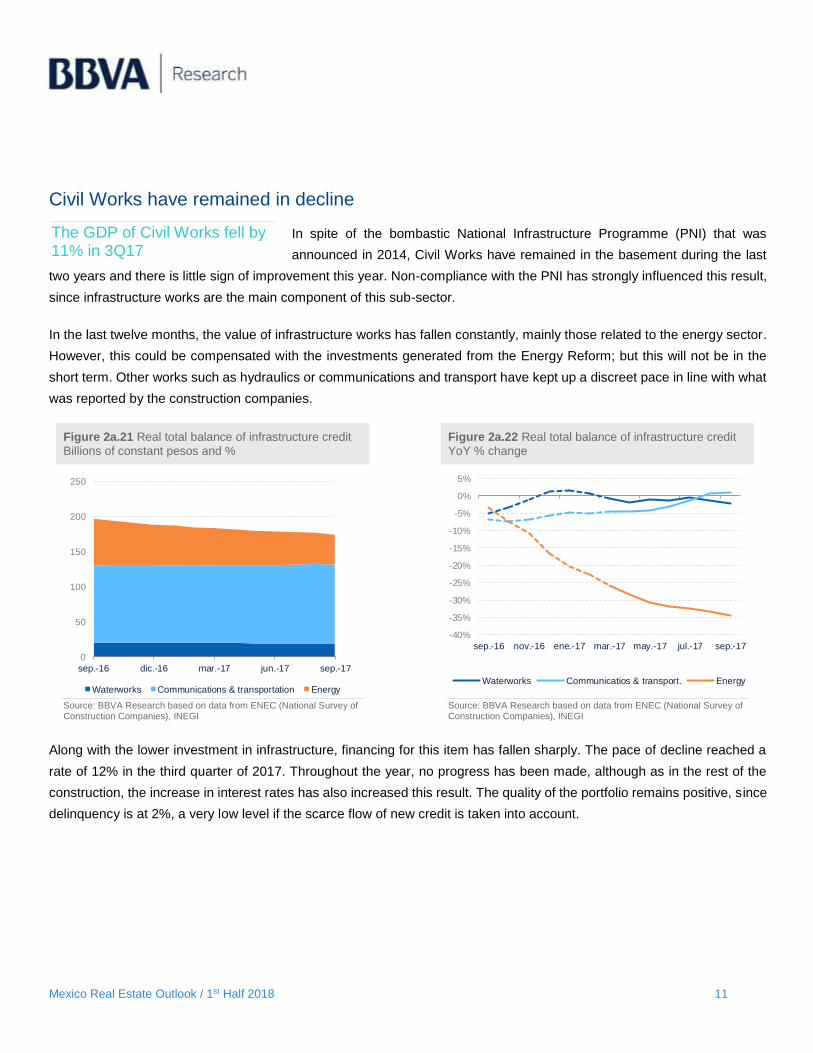
Civil Works have remained in decline
In spite of the bombastic National Infrastructure Programme (PNI) that was
announced in 2014, Civil Works have remained in the basement during the last
two years and there is little sign of improvement this year. Non-compliance with the PNI has strongly influenced this result,
since infrastructure works are the main component of this sub-sector.
In the last twelve months, the value of infrastructure works has fallen constantly, mainly those related to the energy sector.
However, this could be compensated with the investments generated from the Energy Reform; but this will not be in the
short term. Other works such as hydraulics or communications and transport have kept up a discreet pace in line with what
was reported by the construction companies.
Figure 2a.21 Real total balance of infrastructure credit
Billions of constant pesos and % Figure 2a.22 Real total balance of infrastructure credit
YoY % change
Source: BBVA Research based on data from ENEC (National Survey of Construction Companies), INEGI
Source: BBVA Research based on data from ENEC (National Survey of Construction Companies), INEGI
Along with the lower investment in infrastructure, financing for this item has fallen sharply. The pace of decline reached a
rate of 12% in the third quarter of 2017. Throughout the year, no progress has been made, although as in the rest of the
construction, the increase in interest rates has also increased this result. The quality of the portfolio remains positive, since
delinquency is at 2%, a very low level if the scarce flow of new credit is taken into account.
0
50
100
150
200
250
sep.-16 dic.-16 mar.-17 jun.-17 sep.-17
Waterworks Communications & transportation Energy
-40%
-35%
-30%
-25%
-20%
-15%
-10%
-5%
0%
5%
sep.-16 nov.-16 ene.-17 mar.-17 may.-17 jul.-17 sep.-17
Waterworks Communicatios & transport. Energy
The GDP of Civil Works fell by 11% in 3Q17
Mexico Real Estate Outlook / 1st Half 2018 12
Figure 2a.23 Gross value of infrastructure
Billions of pesos in real terms (annualised) Figure 2a.24 Gross value of infrastructure
YoY % change (annualised series)
Source: BBVA Research based on Bank of Mexico data Source: BBVA Research based on Bank of Mexico data
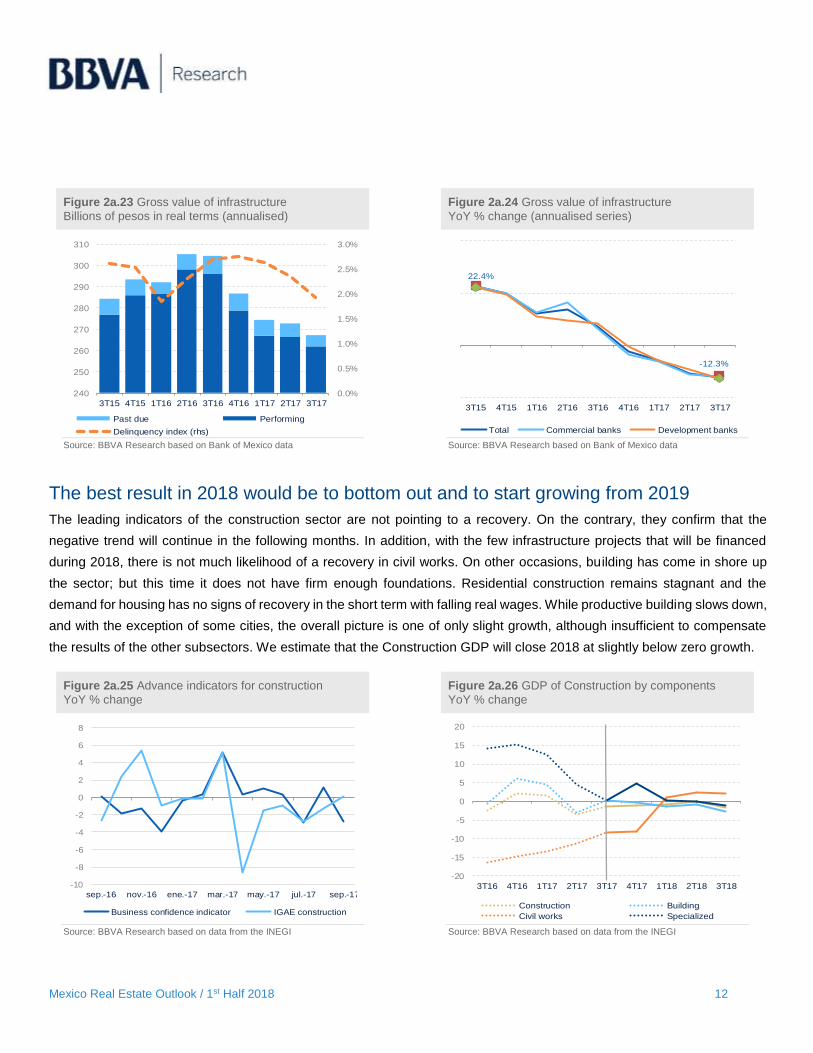
The best result in 2018 would be to bottom out and to start growing from 2019
The leading indicators of the construction sector are not pointing to a recovery. On the contrary, they confirm that the
negative trend will continue in the following months. In addition, with the few infrastructure projects that will be financed
during 2018, there is not much likelihood of a recovery in civil works. On other occasions, building has come in shore up
the sector; but this time it does not have firm enough foundations. Residential construction remains stagnant and the
demand for housing has no signs of recovery in the short term with falling real wages. While productive building slows down,
and with the exception of some cities, the overall picture is one of only slight growth, although insufficient to compensate
the results of the other subsectors. We estimate that the Construction GDP will close 2018 at slightly below zero growth.
Figure 2a.25 Advance indicators for construction
YoY % change Figure 2a.26 GDP of Construction by components
YoY % change
Source: BBVA Research based on data from the INEGI Source: BBVA Research based on data from the INEGI
0.0%
0.5%
1.0%
1.5%
2.0%
2.5%
3.0%
240
250
260
270
280
290
300
310
3T15 4T15 1T16 2T16 3T16 4T16 1T17 2T17 3T17
Past due Performing
Delinquency index (rhs)
22.4%
-12.3%
3T15 4T15 1T16 2T16 3T16 4T16 1T17 2T17 3T17
Total Commercial banks Development banks
-10
-8
-6
-4
-2
0
2
4
6
8
sep.-16 nov.-16 ene.-17 mar.-17 may.-17 jul.-17 sep.-17
Business confidence indicator IGAE construction
-20
-15
-10
-5
0
5
10
15
20
3T16 4T16 1T17 2T17 3T17 4T17 1T18 2T18 3T18
Construction Building
Civil works Specialized
Mexico Real Estate Outlook / 1st Half 2018 13
2b. The mortgage market in the downside of the cycle
In our previous issue we anticipated that the mortgage market could remain stagnant in 2017. The main determinants of
demand such as: lower growth in employment in the higher income segments, as well as an increase (although marginal)
in the mortgage interest rates, had negative effects on consumer confidence during the second half of 2017, which was
reflected in lower origination of mortgages.
On the supply side, construction remained stagnant throughout the year to avoid an accumulation of new units and waiting
for the existing inventory to continue to decline. In this regard, housing prices continue to rise, but at a slower pace, in line
with lower demand and a rise in consumer prices, which rises considerably in 2017 in its cost of use component.
Banking contracts, but Infonavit grows in 2017
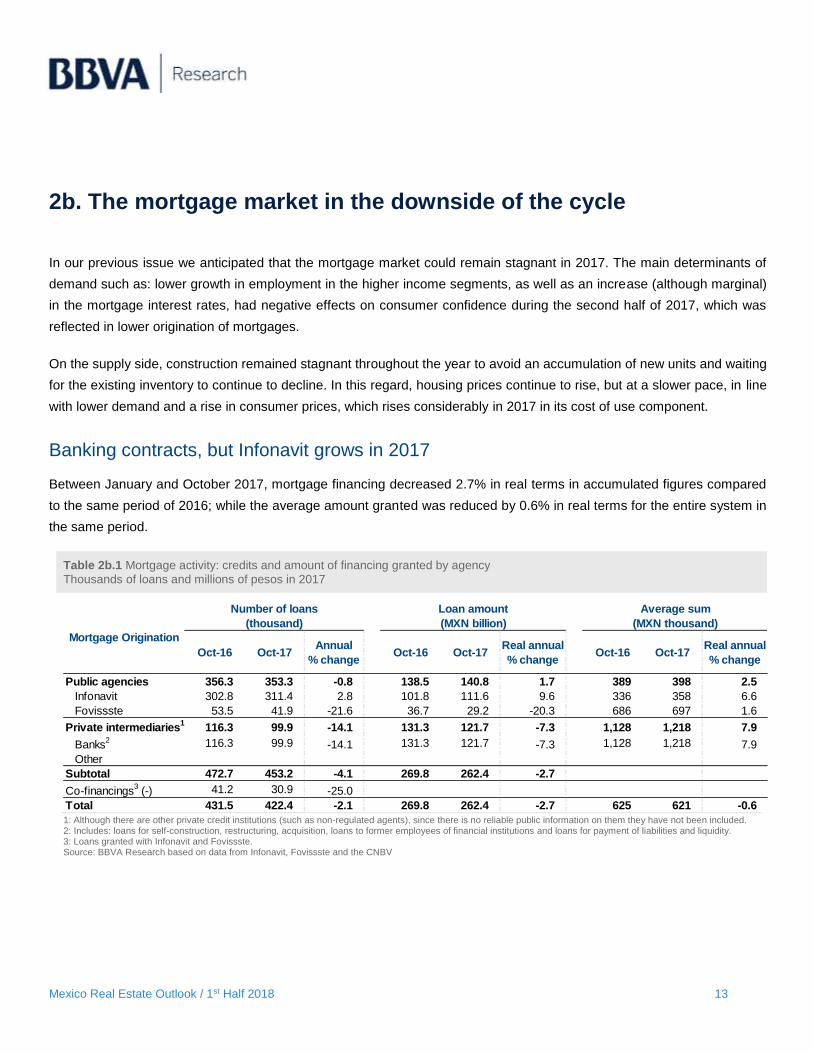
Between January and October 2017, mortgage financing decreased 2.7% in real terms in accumulated figures compared
to the same period of 2016; while the average amount granted was reduced by 0.6% in real terms for the entire system in
the same period.
Table 2b.1 Mortgage activity: credits and amount of financing granted by agency
Thousands of loans and millions of pesos in 2017
1: Although there are other private credit institutions (such as non-regulated agents), since there is no reliable public information on them they have not been included. 2: Includes: loans for self-construction, restructuring, acquisition, loans to former employees of financial institutions and loans for payment of liabilities and liquidity. 3: Loans granted with Infonavit and Fovissste. Source: BBVA Research based on data from Infonavit, Fovissste and the CNBV
Oct-16 Oct-17Annual
% changeOct-16 Oct-17
Real annual
% changeOct-16 Oct-17
Real annual
% change
Public agencies 356.3 353.3 -0.8 138.5 140.8 1.7 389 398 2.5
Infonavit 302.8 311.4 2.8 101.8 111.6 9.6 336 358 6.6
Fovissste 53.5 41.9 -21.6 36.7 29.2 -20.3 686 697 1.6
Private intermediaries1
116.3 99.9 -14.1 131.3 121.7 -7.3 1,128 1,218 7.9
Banks2 116.3 99.9 -14.1 131.3 121.7 -7.3 1,128 1,218 7.9
Other
Subtotal 472.7 453.2 -4.1 269.8 262.4 -2.7
Co-financings3 (-) 41.2 30.9 -25.0
Total 431.5 422.4 -2.1 269.8 262.4 -2.7 625 621 -0.6
Mortgage Origination
Number of loans Loan amount Average sum
(thousand) (MXN billion) (MXN thousand)
Mexico Real Estate Outlook / 1st Half 2018 14
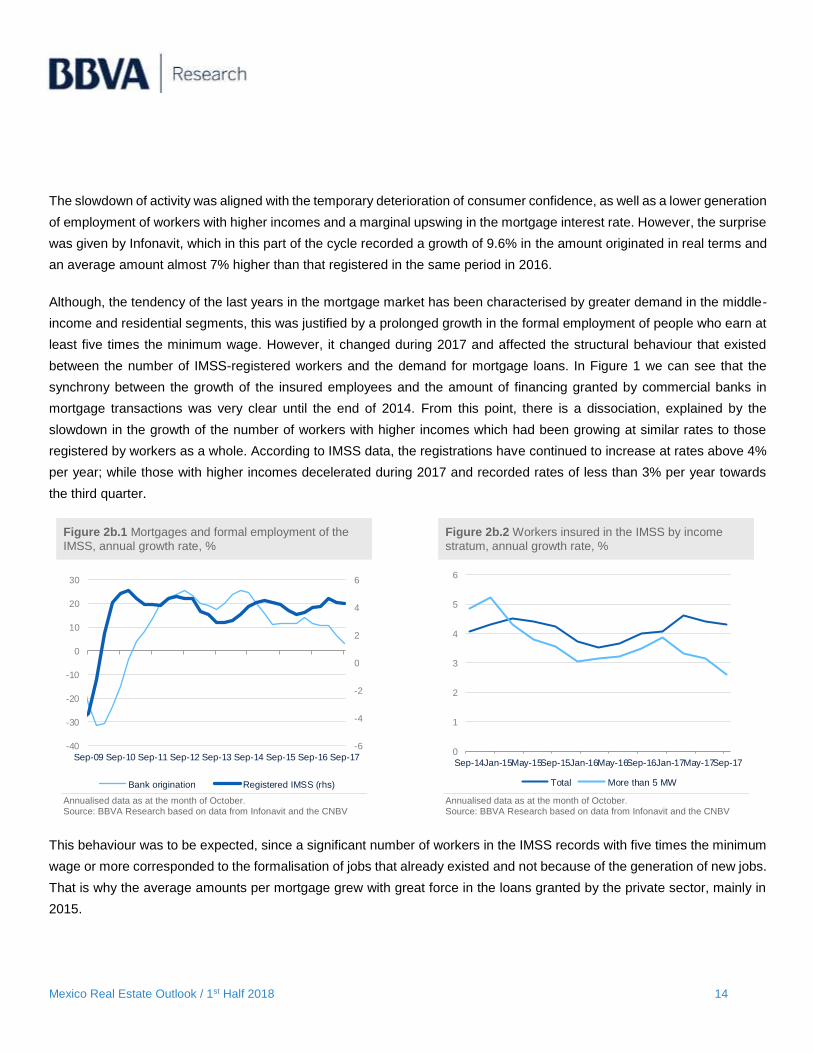
The slowdown of activity was aligned with the temporary deterioration of consumer confidence, as well as a lower generation
of employment of workers with higher incomes and a marginal upswing in the mortgage interest rate. However, the surprise
was given by Infonavit, which in this part of the cycle recorded a growth of 9.6% in the amount originated in real terms and
an average amount almost 7% higher than that registered in the same period in 2016.
Although, the tendency of the last years in the mortgage market has been characterised by greater demand in the middle-
income and residential segments, this was justified by a prolonged growth in the formal employment of people who earn at
least five times the minimum wage. However, it changed during 2017 and affected the structural behaviour that existed
between the number of IMSS-registered workers and the demand for mortgage loans. In Figure 1 we can see that the
synchrony between the growth of the insured employees and the amount of financing granted by commercial banks in
mortgage transactions was very clear until the end of 2014. From this point, there is a dissociation, explained by the
slowdown in the growth of the number of workers with higher incomes which had been growing at similar rates to those
registered by workers as a whole. According to IMSS data, the registrations have continued to increase at rates above 4%
per year; while those with higher incomes decelerated during 2017 and recorded rates of less than 3% per year towards
the third quarter.
Figure 2b.1 Mortgages and formal employment of the
IMSS, annual growth rate, % Figure 2b.2 Workers insured in the IMSS by income
stratum, annual growth rate, %
Annualised data as at the month of October. Source: BBVA Research based on data from Infonavit and the CNBV
Annualised data as at the month of October. Source: BBVA Research based on data from Infonavit and the CNBV
This behaviour was to be expected, since a significant number of workers in the IMSS records with five times the minimum
wage or more corresponded to the formalisation of jobs that already existed and not because of the generation of new jobs.
That is why the average amounts per mortgage grew with great force in the loans granted by the private sector, mainly in
2015.
-6
-4
-2
0
2
4
6
-40
-30
-20
-10
0
10
20
30
Sep-09 Sep-10 Sep-11 Sep-12 Sep-13 Sep-14 Sep-15 Sep-16 Sep-17
Bank origination Registered IMSS (rhs)
0
1
2
3
4
5
6
Sep-14Jan-15May-15Sep-15Jan-16May-16Sep-16Jan-17May-17Sep-17
Total More than 5 MW
Mexico Real Estate Outlook / 1st Half 2018 15
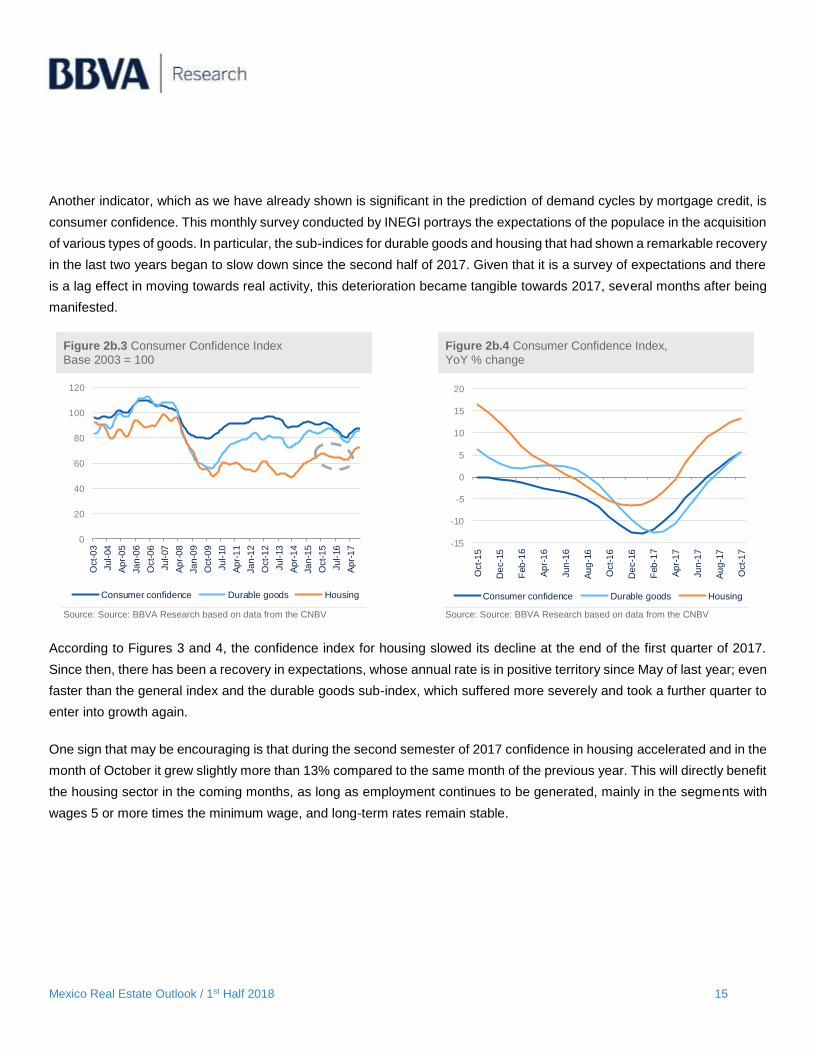
Another indicator, which as we have already shown is significant in the prediction of demand cycles by mortgage credit, is
consumer confidence. This monthly survey conducted by INEGI portrays the expectations of the populace in the acquisition
of various types of goods. In particular, the sub-indices for durable goods and housing that had shown a remarkable recovery
in the last two years began to slow down since the second half of 2017. Given that it is a survey of expectations and there
is a lag effect in moving towards real activity, this deterioration became tangible towards 2017, several months after being
manifested.
Figure 2b.3 Consumer Confidence Index
Base 2003 = 100 Figure 2b.4 Consumer Confidence Index,
YoY % change
Source: Source: BBVA Research based on data from the CNBV
Source: Source: BBVA Research based on data from the CNBV
According to Figures 3 and 4, the confidence index for housing slowed its decline at the end of the first quarter of 2017.
Since then, there has been a recovery in expectations, whose annual rate is in positive territory since May of last year; even
faster than the general index and the durable goods sub-index, which suffered more severely and took a further quarter to
enter into growth again.
One sign that may be encouraging is that during the second semester of 2017 confidence in housing accelerated and in the
month of October it grew slightly more than 13% compared to the same month of the previous year. This will directly benefit
the housing sector in the coming months, as long as employment continues to be generated, mainly in the segments with
wages 5 or more times the minimum wage, and long-term rates remain stable.
0
20
40
60
80
100
120
Oct-
03
Ju
l-04
Ap
r-0
5
Ja
n-0
6
Oct-
06
Ju
l-07
Ap
r-0
8
Ja
n-0
9
Oct-
09
Ju
l-10
Ap
r-1
1
Ja
n-1
2
Oct-
12
Ju
l-13
Ap
r-1
4
Ja
n-1
5
Oct-
15
Ju
l-16
Ap
r-1
7
Consumer confidence Durable goods Housing
-15
-10
-5
0
5
10
15
20
Oct-
15
De
c-1
5
Feb
-16
Ap
r-1
6
Ju
n-1
6
Au
g-1
6
Oct-
16
De
c-1
6
Feb
-17
Ap
r-1
7
Ju
n-1
7
Au
g-1
7
Oct-
17
Consumer confidence Durable goods Housing
Mexico Real Estate Outlook / 1st Half 2018 16
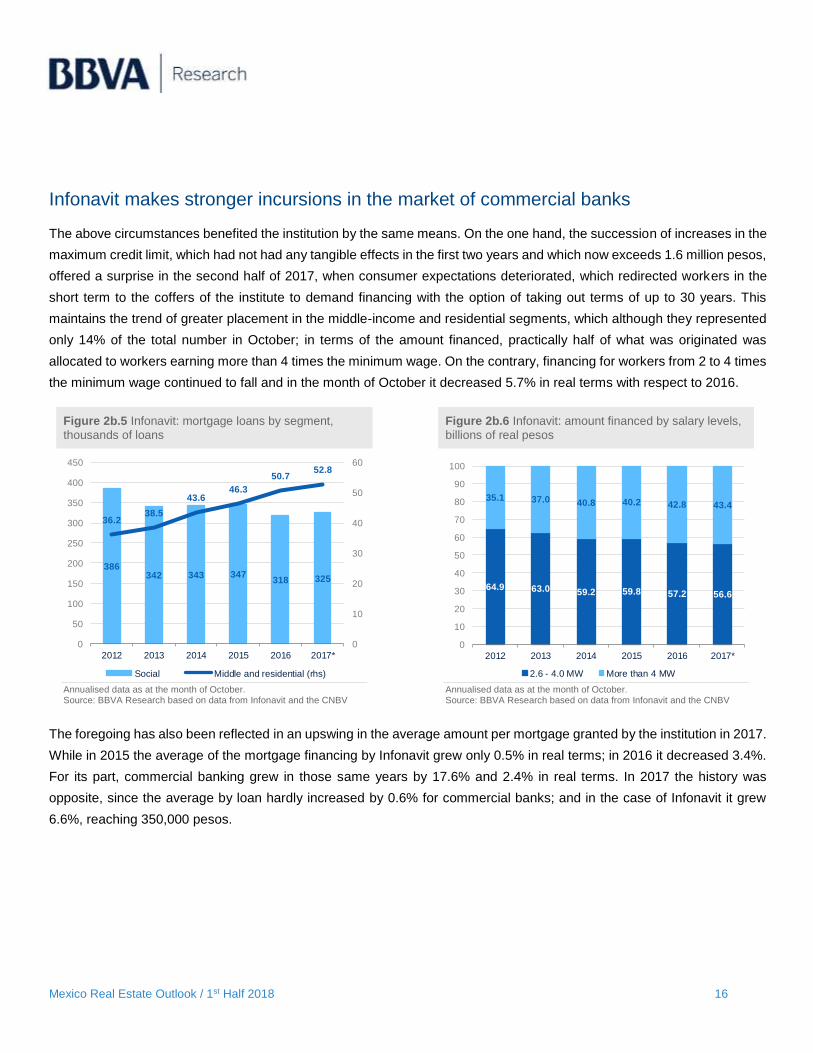
Infonavit makes stronger incursions in the market of commercial banks
The above circumstances benefited the institution by the same means. On the one hand, the succession of increases in the
maximum credit limit, which had not had any tangible effects in the first two years and which now exceeds 1.6 million pesos,
offered a surprise in the second half of 2017, when consumer expectations deteriorated, which redirected workers in the
short term to the coffers of the institute to demand financing with the option of taking out terms of up to 30 years. This
maintains the trend of greater placement in the middle-income and residential segments, which although they represented
only 14% of the total number in October; in terms of the amount financed, practically half of what was originated was
allocated to workers earning more than 4 times the minimum wage. On the contrary, financing for workers from 2 to 4 times
the minimum wage continued to fall and in the month of October it decreased 5.7% in real terms with respect to 2016.
Figure 2b.5 Infonavit: mortgage loans by segment,
thousands of loans Figure 2b.6 Infonavit: amount financed by salary levels,
billions of real pesos
Annualised data as at the month of October. Source: BBVA Research based on data from Infonavit and the CNBV
Annualised data as at the month of October. Source: BBVA Research based on data from Infonavit and the CNBV
The foregoing has also been reflected in an upswing in the average amount per mortgage granted by the institution in 2017.
While in 2015 the average of the mortgage financing by Infonavit grew only 0.5% in real terms; in 2016 it decreased 3.4%.
For its part, commercial banking grew in those same years by 17.6% and 2.4% in real terms. In 2017 the history was
opposite, since the average by loan hardly increased by 0.6% for commercial banks; and in the case of Infonavit it grew
6.6%, reaching 350,000 pesos.
386342 343 347
318 325
36.238.5
43.646.3
50.752.8
0
10
20
30
40
50
60
0
50
100
150
200
250
300
350
400
450
2012 2013 2014 2015 2016 2017*
Social Middle and residential (rhs)
64.9 63.0 59.2 59.8 57.2 56.6
35.1 37.0 40.8 40.2 42.8 43.4
0
10
20
30
40
50
60
70
80
90
100
2012 2013 2014 2015 2016 2017*
2.6 - 4.0 MW More than 4 MW

Mexico Real Estate Outlook / 1st Half 2018 17
Figure 2b.7 Average amount per mortgage,
thousands of constant pesos Figure 2b.8 Average amount per mortgage,
YoY % change
Annualised data as at the month of October. Source: BBVA Research based on data from Infonavit and the CNBV
Annualised data as at the month of October. Source: BBVA Research based on data from Infonavit and the CNBV
Bank credit conditions are still the best
Despite the problems the mortgage cycle is going through, we cannot say that credit conditions have deteriorated, since
the brake on the fall in rates is a natural process that is part of the economic cycle in which competition between banks has
favoured development of a wide variety of fixed rate products; at the same time that the contracting periods continue to be
maintained in horizons close to 20 years in the private sector.
Figure 2b.9 Weighted average interest rate and
mortgage term, nominal rate and years Figure 2b.10 Mortgage and long-term interest rates,
percentage
Source: BBVA Research based on data from Infonavit and the CNBV Source: BBVA Research based on data from Infonavit and the CNBV
0
200
400
600
800
1000
1200
1400
2012 2013 2014 2015 2016 2017
Infonavit Banks
6.6
0.6
-5
0
5
10
15
20
2013 2014 2015 2016 2017
Infonavit Banks
18.0
18.2
18.4
18.6
18.8
19.0
19.2
19.4
9.0
9.2
9.4
9.6
9.8
10.0
10.2
10.4
Oct-
15
De
c-1
5
Feb
-16
Ap
r-1
6
Ju
n-1
6
Au
g-1
6
Oct-
16
De
c-1
6
Feb
-17
Ap
r-1
7
Ju
n-1
7
Au
g-1
7
Oct-
17
Weighted average interest rateWeighted average mortgage term (rhs)
-
2
4
6
8
10
12
May-1
5
Ju
l-15
Se
p-1
5
No
v-1
5
Ja
n-1
6
Mar-
16
May-1
6
Ju
l-16
Se
p-1
6
No
v-1
6
Ja
n-1
7
Mar-
17
May-1
7
Ju
l-17
Se
p-1
7
Reference rate M10 bond Mortgage rate

Mexico Real Estate Outlook / 1st Half 2018 18
On the other hand, the increase in mortgage interest rates, although limited with respect to that recorded by the benchmark
interest rate, incorporated the performance of the yields in the 10-year Treasury notes of the United States and, in particular,
the Mexican 10 year government bond, which increased from 6% to 7.6% and thus maintained is level during the first half
of 2017. Although in the third quarter it stabilised at 6.5% and no additional increases are expected, the mortgage interest
rate barely increased 50 basis points during 2017 and in September it closed at 10.2% on average.
Financing for new housing from commercial banks accounted for 65% of the total originated. Loans for payment of liabilities
and liquidity, which came to represent more than 13% of the mortgage transactions between January and October 2016,
ceased in 2017 due to the slowing in the fall in interest rates and represented 8%. However, other options such as loans
for construction and for the purchase of used homes increased their share and went from 22% to 26% respectively.
Figure 2b.11 Origination of bank credit for housing Figure 2b.12 Bank loans for housing acquisition
Source: Source: BBVA Research based on data from the CNBV Source: Source: BBVA Research based on data from the CNBV
The partial offsetting through greater demand for loans for alternative products has maintained the growth of the portfolio,
albeit at lower rates. In the month of October it increased 3.5% annually in real terms, while the overdue portfolio, which up
to mid-2017 had registered negative rates of over 10% up to the middle of last year, decreased by 5% in October compared
to the previous year. On the other hand, mortgage delinquency remained stable during the second half of 2017 and
averaged 2.4%. This maintains the health of the portfolio despite the decrease in origination.
0
5
10
15
20
Oct-
14
De
c-1
4
Feb
-15
Ap
r-1
5
Ju
n-1
5
Au
g-1
5
Oct-
15
De
c-1
5
Feb
-16
Ap
r-1
6
Ju
n-1
6
Au
g-1
6
Oct-
16
De
c-1
6
Feb
-17
Ap
r-1
7
Ju
n-1
7
Au
g-1
7
Oct-
17
Payment of mortgage liabilities Liquidity
Former employees Construction
Acquisition of used house Acquisition of new house
0
20
40
60
80
100
120
140
160O
ct-
15
De
c-1
5
Feb
-16
Ap
r-1
6
Ju
n-1
6
Au
g-1
6
Oct-
16
De
c-1
6
Feb
-17
Ap
r-1
7
Ju
n-1
7
Au
g-1
7
Oct-
17
New homes Used homes
Mexico Real Estate Outlook / 1st Half 2018 19
Figure 2b.13 Balance of bank credit to housing,
billions of constant pesos and delinquency, % Figure 2b.14 Balance of bank credit to housing,
YoY % change
Source: BBVA Research based on data from Bank of Mexico Source: Source: BBVA Research based on data from the CNBV
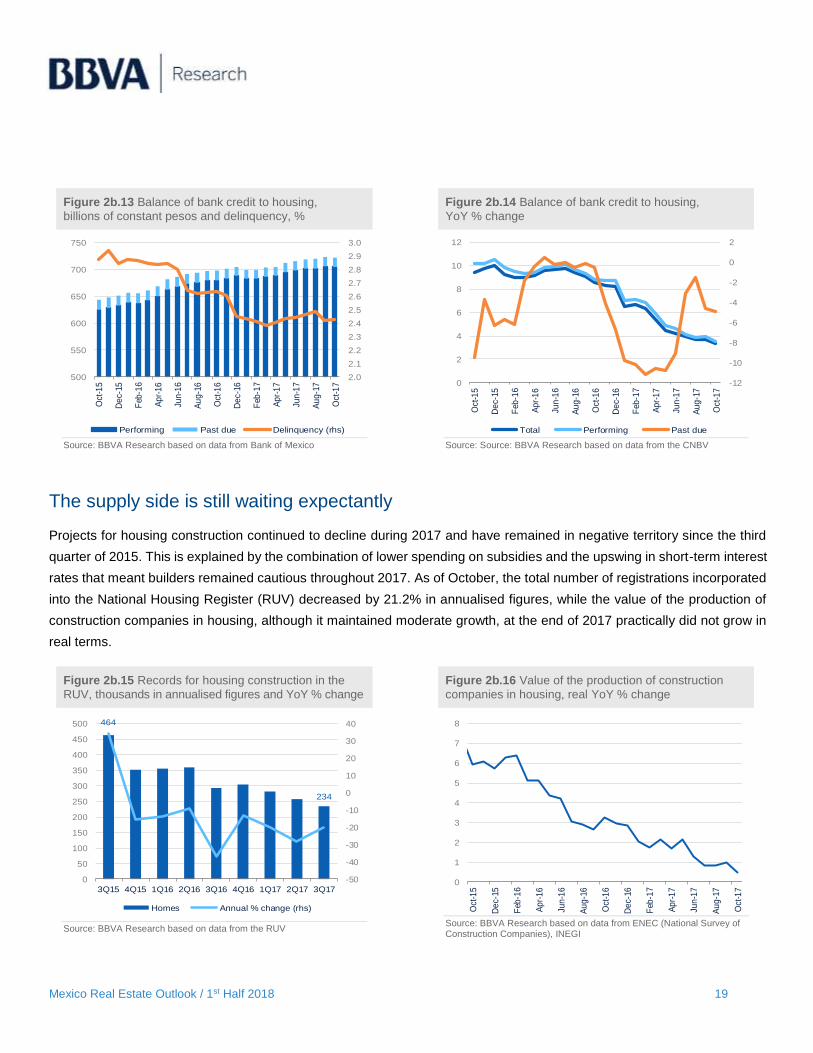
The supply side is still waiting expectantly
Projects for housing construction continued to decline during 2017 and have remained in negative territory since the third
quarter of 2015. This is explained by the combination of lower spending on subsidies and the upswing in short-term interest
rates that meant builders remained cautious throughout 2017. As of October, the total number of registrations incorporated
into the National Housing Register (RUV) decreased by 21.2% in annualised figures, while the value of the production of
construction companies in housing, although it maintained moderate growth, at the end of 2017 practically did not grow in
real terms.
Figure 2b.15 Records for housing construction in the
RUV, thousands in annualised figures and YoY % change Figure 2b.16 Value of the production of construction
companies in housing, real YoY % change
Source: BBVA Research based on data from the RUV Source: BBVA Research based on data from ENEC (National Survey of
Construction Companies), INEGI
2.0
2.1
2.2
2.3
2.4
2.5
2.6
2.7
2.8
2.9
3.0
500
550
600
650
700
750
Oct
-15
De
c-15
Feb
-16
Ap
r-1
6
Jun
-16
Au
g-1
6
Oct
-16
De
c-16
Feb
-17
Ap
r-1
7
Jun
-17
Au
g-1
7
Oct
-17
Performing Past due Delinquency (rhs)
-12
-10
-8
-6
-4
-2
0
2
0
2
4
6
8
10
12
Oct
-15
De
c-15
Feb
-16
Ap
r-1
6
Jun
-16
Au
g-1
6
Oct
-16
De
c-16
Feb
-17
Ap
r-1
7
Jun
-17
Au
g-1
7
Oct
-17
Total Performing Past due
464
234
-50
-40
-30
-20
-10
0
10
20
30
40
0
50
100
150
200
250
300
350
400
450
500
3Q15 4Q15 1Q16 2Q16 3Q16 4Q16 1Q17 2Q17 3Q17
Homes Annual % change (rhs)
0
1
2
3
4
5
6
7
8
Oct
-15
De
c-15
Feb
-16
Ap
r-1
6
Jun
-16
Au
g-1
6
Oct
-16
De
c-16
Feb
-17
Ap
r-1
7
Jun
-17
Au
g-1
7
Oct
-17
Mexico Real Estate Outlook / 1st Half 2018 20
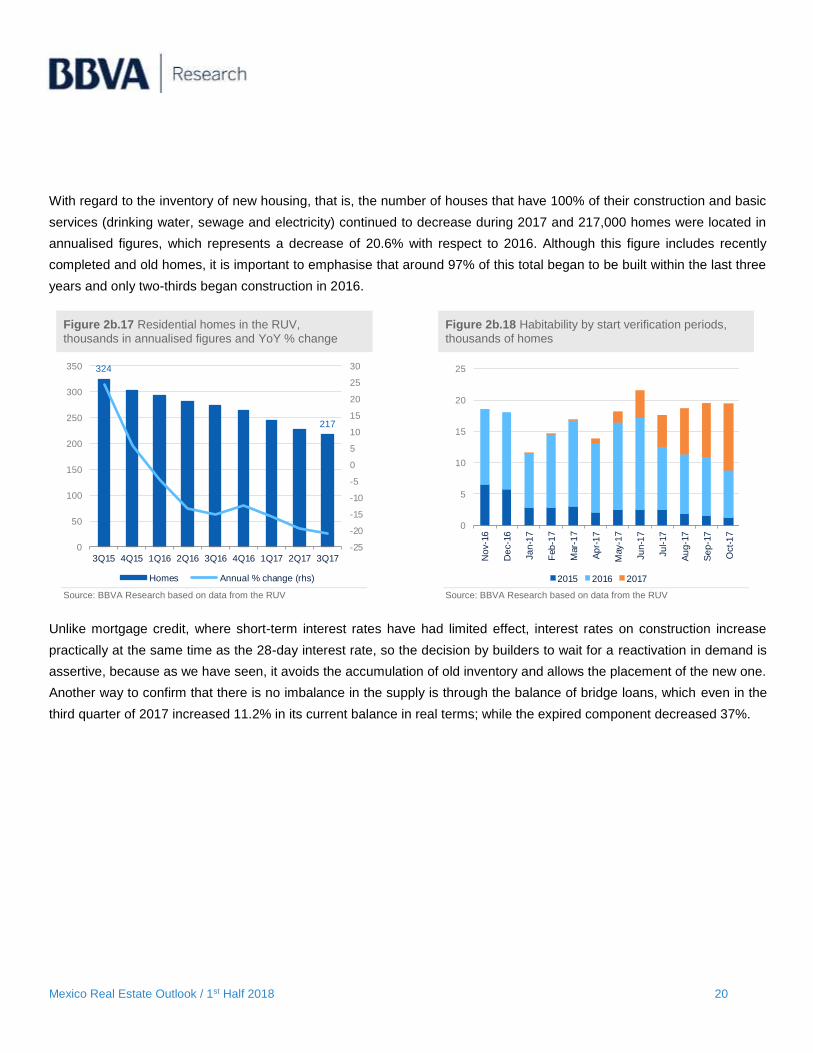
With regard to the inventory of new housing, that is, the number of houses that have 100% of their construction and basic
services (drinking water, sewage and electricity) continued to decrease during 2017 and 217,000 homes were located in
annualised figures, which represents a decrease of 20.6% with respect to 2016. Although this figure includes recently
completed and old homes, it is important to emphasise that around 97% of this total began to be built within the last three
years and only two-thirds began construction in 2016.
Figure 2b.17 Residential homes in the RUV,
thousands in annualised figures and YoY % change Figure 2b.18 Habitability by start verification periods,
thousands of homes
Source: BBVA Research based on data from the RUV Source: BBVA Research based on data from the RUV
Unlike mortgage credit, where short-term interest rates have had limited effect, interest rates on construction increase
practically at the same time as the 28-day interest rate, so the decision by builders to wait for a reactivation in demand is
assertive, because as we have seen, it avoids the accumulation of old inventory and allows the placement of the new one.
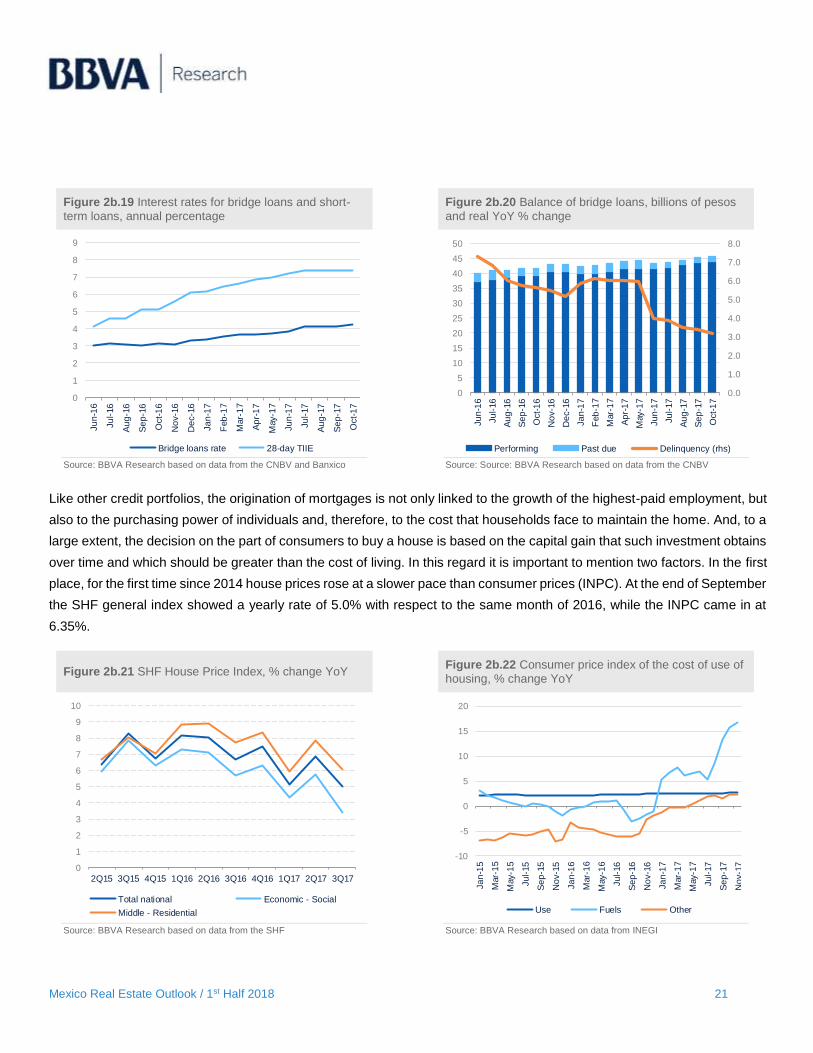
Another way to confirm that there is no imbalance in the supply is through the balance of bridge loans, which even in the
third quarter of 2017 increased 11.2% in its current balance in real terms; while the expired component decreased 37%.
324
217
-25
-20
-15
-10
-5
0
5
10
15
20
25
30
0
50
100
150
200
250
300
350
3Q15 4Q15 1Q16 2Q16 3Q16 4Q16 1Q17 2Q17 3Q17
Homes Annual % change (rhs)
0
5
10
15
20
25
No
v-1
6
De
c-1
6
Ja
n-1
7
Feb
-17
Mar-
17
Ap
r-1
7
May-1
7
Ju
n-1
7
Ju
l-17
Au
g-1
7
Se
p-1
7
Oct-
17
2015 2016 2017
Mexico Real Estate Outlook / 1st Half 2018 21
Figure 2b.19 Interest rates for bridge loans and short-
term loans, annual percentage Figure 2b.20 Balance of bridge loans, billions of pesos
and real YoY % change
Source: BBVA Research based on data from the CNBV and Banxico Source: Source: BBVA Research based on data from the CNBV
Like other credit portfolios, the origination of mortgages is not only linked to the growth of the highest-paid employment, but
also to the purchasing power of individuals and, therefore, to the cost that households face to maintain the home. And, to a
large extent, the decision on the part of consumers to buy a house is based on the capital gain that such investment obtains
over time and which should be greater than the cost of living. In this regard it is important to mention two factors. In the first
place, for the first time since 2014 house prices rose at a slower pace than consumer prices (INPC). At the end of September
the SHF general index showed a yearly rate of 5.0% with respect to the same month of 2016, while the INPC came in at
6.35%.
Figure 2b.21 SHF House Price Index, % change YoY Figure 2b.22 Consumer price index of the cost of use of
housing, % change YoY
Source: BBVA Research based on data from the SHF Source: BBVA Research based on data from INEGI
0
1
2
3
4
5
6
7
8
9
Ju
n-1
6
Ju
l-16
Au
g-1
6
Se
p-1
6
Oct-
16
No
v-1
6
De
c-1
6
Ja
n-1
7
Feb
-17
Mar-
17
Ap
r-1
7
May-1
7
Ju
n-1
7
Ju
l-17
Au
g-1
7
Se
p-1
7
Oct-
17
Bridge loans rate 28-day TIIE
0.0
1.0
2.0
3.0
4.0
5.0
6.0
7.0
8.0
0
5
10
15
20
25
30
35
40
45
50
Ju
n-1
6
Ju
l-16
Au
g-1
6
Se
p-1
6
Oct-
16
No
v-1
6
De
c-1
6
Ja
n-1
7
Feb
-17
Mar-
17
Ap
r-1
7
May-1
7
Ju
n-1
7
Ju
l-17
Au
g-1
7
Se
p-1
7
Oct-
17
Performing Past due Delinquency (rhs)
0
1
2
3
4
5
6
7
8
9
10
2Q15 3Q15 4Q15 1Q16 2Q16 3Q16 4Q16 1Q17 2Q17 3Q17
Total national Economic - Social
Middle - Residential
-10
-5
0
5
10
15
20
Ja
n-1
5
Mar-
15
May-1
5
Ju
l-15
Se
p-1
5
No
v-1
5
Ja
n-1
6
Mar-
16
May-1
6
Ju
l-16
Se
p-1
6
No
v-1
6
Ja
n-1
7
Mar-
17
May-1
7
Ju
l-17
Se
p-1
7
No
v-1
7
Use Fuels Other
Mexico Real Estate Outlook / 1st Half 2018 22
The mid-range and residential segments grew by 6% during the period, while the social housing segments grew by just
3.4%, their lowest rate since the second quarter of 2014. This combination of a lower rate of appreciation of real estate,
which is explained by lower demand, could be reinforced by the increase in the cost of living.
Secondly, the deterioration of the real wage could have a long-term effect, since the component of the cost of usage of
housing, a component of consumer prices, grew by more than 5% during 2017, after only having grown less than 1% on
average during the last three years. Only the transmission of the cost of using energy in homes increased more than 16%
in 2017.
Conclusions
The demand for mortgage credit is at its lowest level of the last five years. The generation of well-paid employment has
slowed down and a fall in expectations during the first half of 2017 was consolidated with lower demand for financing from
commercial banks. The surprise came from Infonavit, which after a succession of increases in the maximum credit limits
finally managed to penetrate the middle-income and residential market strongly. This was reflected in greater amounts of
financing and terms that can reach up to thirty years.
The current credit of the commercial banks will show greater momentum once inflation is reduced significantly, which will
allow real salaries to grow again and the economic activity will allow the recovery of employment for better-paid workers.
However, in the short term we expect that the housing market will maintain little momentum in 2018 and could even remain
in negative territory.
Mexico Real Estate Outlook / 1st Half 2018 23
3. Special Topics
3a. The significance of business expectations in construction
In the edition for the First Half of 2015, we presented the significance of consumer expectations in the demand for financing
for the purchase of a home. However, there has been little exploration of the role that builders’ confidence plays in the
making of investment decisions, mainly in the short term. Unlike the individual market, in which the decisions of the families
involve loans for up to 20 years, we have pointed out that supply cycles respond more quickly to the demands of the market
in search of adaptation. That is why, in this issue of Mexico Real Estate Outlook, we study in greater detail the economic
relationship between business confidence in the construction sector and both residential and productive production.
Business confidence indexes in Mexico
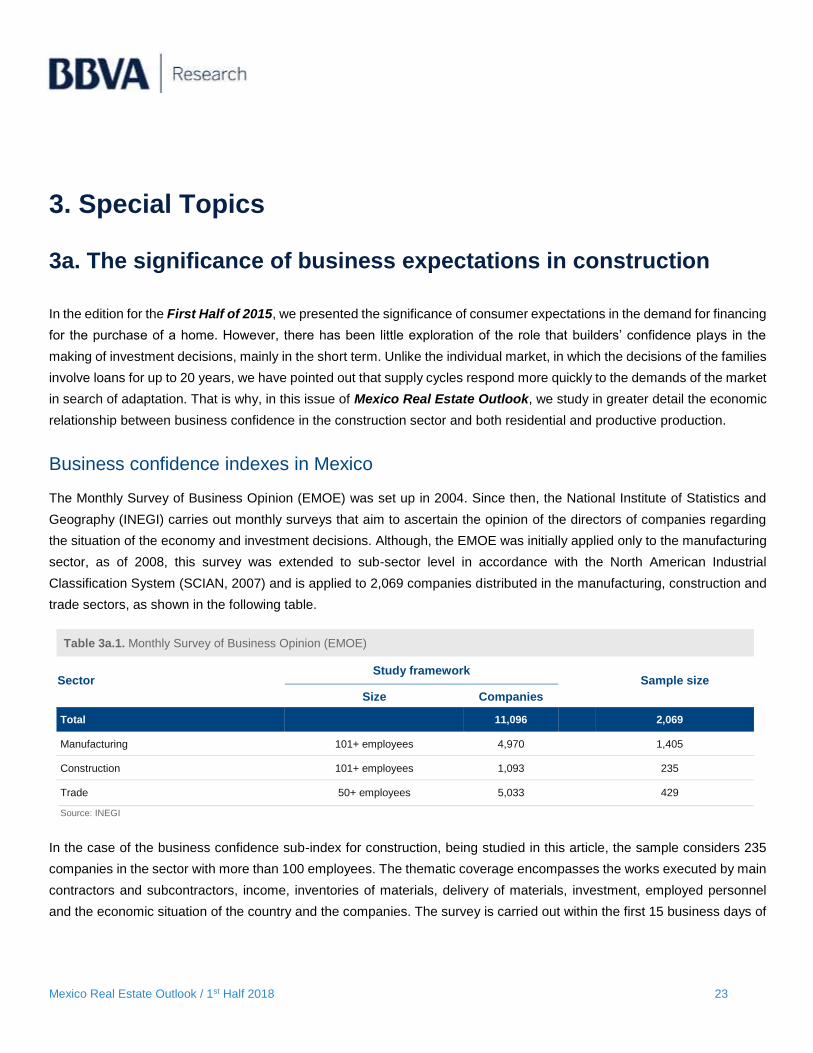
The Monthly Survey of Business Opinion (EMOE) was set up in 2004. Since then, the National Institute of Statistics and
Geography (INEGI) carries out monthly surveys that aim to ascertain the opinion of the directors of companies regarding
the situation of the economy and investment decisions. Although, the EMOE was initially applied only to the manufacturing
sector, as of 2008, this survey was extended to sub-sector level in accordance with the North American Industrial
Classification System (SCIAN, 2007) and is applied to 2,069 companies distributed in the manufacturing, construction and
trade sectors, as shown in the following table.
Table 3a.1. Monthly Survey of Business Opinion (EMOE)
Sector Study framework
Sample size
Size Companies
Total 11,096 2,069
Manufacturing 101+ employees 4,970 1,405
Construction 101+ employees 1,093 235
Trade 50+ employees 5,033 429
Source: INEGI
In the case of the business confidence sub-index for construction, being studied in this article, the sample considers 235
companies in the sector with more than 100 employees. The thematic coverage encompasses the works executed by main
contractors and subcontractors, income, inventories of materials, delivery of materials, investment, employed personnel
and the economic situation of the country and the companies. The survey is carried out within the first 15 business days of
Mexico Real Estate Outlook / 1st Half 2018 24
each month through two channels. A traditional one by means of a questionnaire and an interview, and the other via internet
through an electronic questionnaire. The questions that make up the survey are the following:
1. Comparing the current situation of the country and of your company with that of a year ago... Do you think this is a good
time for investments to be made?
2. How do you see the economic situation of the country today compared to 12 months ago?
3. What do you think the economic situation of the country will be like in 12 months, compared to the current one?
4. What do you think of the economic situation of your company today compared to 12 months ago?
5. What do you think the economic situation of your company will be like in 12 months, compared to the current one?
The first question has three answer options, which are: yes, no and not sure. The rest of the questions have five options to
answer, and include the weightings from the following table.
Answer Weighting
Much better 1.00
Better 0.75
The same 0.50
Worse 0.25
Much worse 0.00
As with other indicators such as consumer confidence, which fluctuate between 0 and 100, the value of 50 could be
considered the threshold between pessimism and optimism. However, this would be inaccurate if the percentage of
responses between optimism and pessimism are balanced. For this reason, and given that the business confidence indicator
for construction is available as of June 2011, in this analysis we use the annual growth rate to compare it with other indicators
of the construction industry. In this way it is more visible to associate behaviours between economic cycles and the
perception of entrepreneurs.
In Figure 1 we can see in levels that the general indicator of business confidence in construction has followed a downward
trend since 2012. On the other hand, the sub-index corresponding to the question about the feasibility of making investments
has had episodes of marked growth, mainly in 2013, 2014 and most recently in 2017.

Mexico Real Estate Outlook / 1st Half 2018 25
Figure 3a.1 Business confidence construction, points Figure 3a.2 Business confidence construction,
annual growth rate, %
Source: Source: BBVA Research based on data from the BCI. INEGI Source: Source: BBVA Research based on data from the BCI. INEGI
When looking at the growth rates for these same indices in Figure 2, we can see that between 2015 and 2016 both the
general indicator and the one that reflects the confidence in making investments were in negative territory and it was not
until the second half of 2017 that they began to grow. In the month of October they registered rates of 8.2% and 28.4%
respectively. The period of the greatest boom in terms of improvement of investment decisions by construction companies
was 2013, which coincides with the beginning of the decrease in short-term interest rates and, as we will see in the next
section, was reinforced by an increase in demand towards the sector.
Business confidence and the construction cycle of construction companies
The production by construction companies consists of various types of buildings. However, approximately 90% of the value
produced by building is aimed at housing and at industrial, commercial and service buildings. The remaining 10% is
dedicated to the construction of schools, hospitals and clinics. Given that the implementation of the latter is highly correlated
with public investment, that is why we focus on the value generated by construction companies whose main focus is on the
residential and commercial sector.
Entrepreneurs make investment decisions based on the expectations they may have regarding two main factors. On the
one hand, when they think that they will have greater sales of the goods they produce and, on the other, a decrease in the
costs incurred in the preparation of said goods. Figure 3 shows a clear correlation between business confidence and the
value of building production by construction companies, although the prospects of the owners of the firms take approximately
8 to 10 months to move to the productive cycle.
0
10
20
30
40
50
60
Ju
n-1
1
Oct-
11
Feb
-12
Ju
n-1
2
Oct-
12
Feb
-13
Ju
n-1
3
Oct-
13
Feb
-14
Ju
n-1
4
Oct-
14
Feb
-15
Ju
n-1
5
Oct-
15
Feb
-16
Ju
n-1
6
Oct-
16
Feb
-17
Ju
n-1
7
Oct-
17
Business confidence construction Right time to invest
8.2
28.4
-50
-40
-30
-20
-10
0
10
20
30
40
50
Ju
n-1
2
Oct-
12
Feb
-13
Ju
n-1
3
Oct-
13
Feb
-14
Ju
n-1
4
Oct-
14
Feb
-15
Ju
n-1
5
Oct-
15
Feb
-16
Ju
n-1
6
Oct-
16
Feb
-17
Ju
n-1
7
Oct-
17
Business confidence construction Right time to invest
Mexico Real Estate Outlook / 1st Half 2018 26
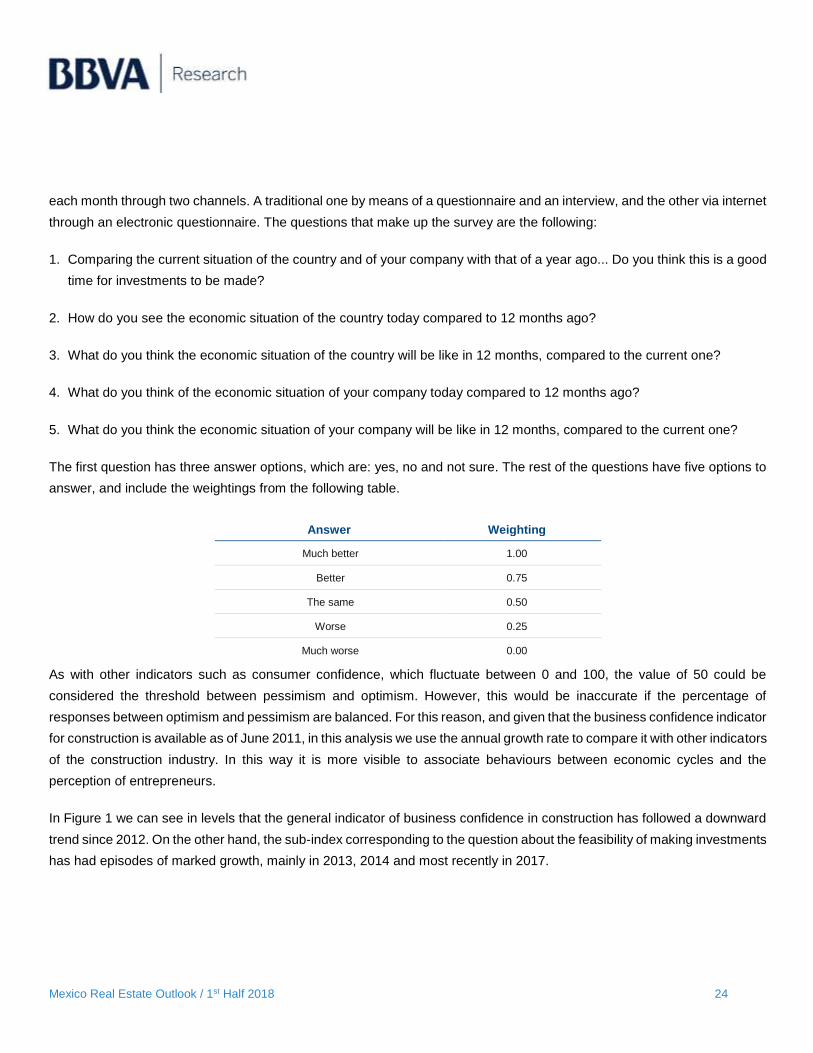
The cycle of greatest growth in confidence in construction during 2014 was largely motivated by the reduction in short-term
interest rates, which is presented in Figure 4.
Figure 3a.3 Value of building production and
construction confidence, YoY % change Figure 3a.4 TIIE at 28 days, % annual
Source: BBVA Research based on data from EMOE, ENEC. INEGI Source: BBVA Research based on Bank of Mexico data
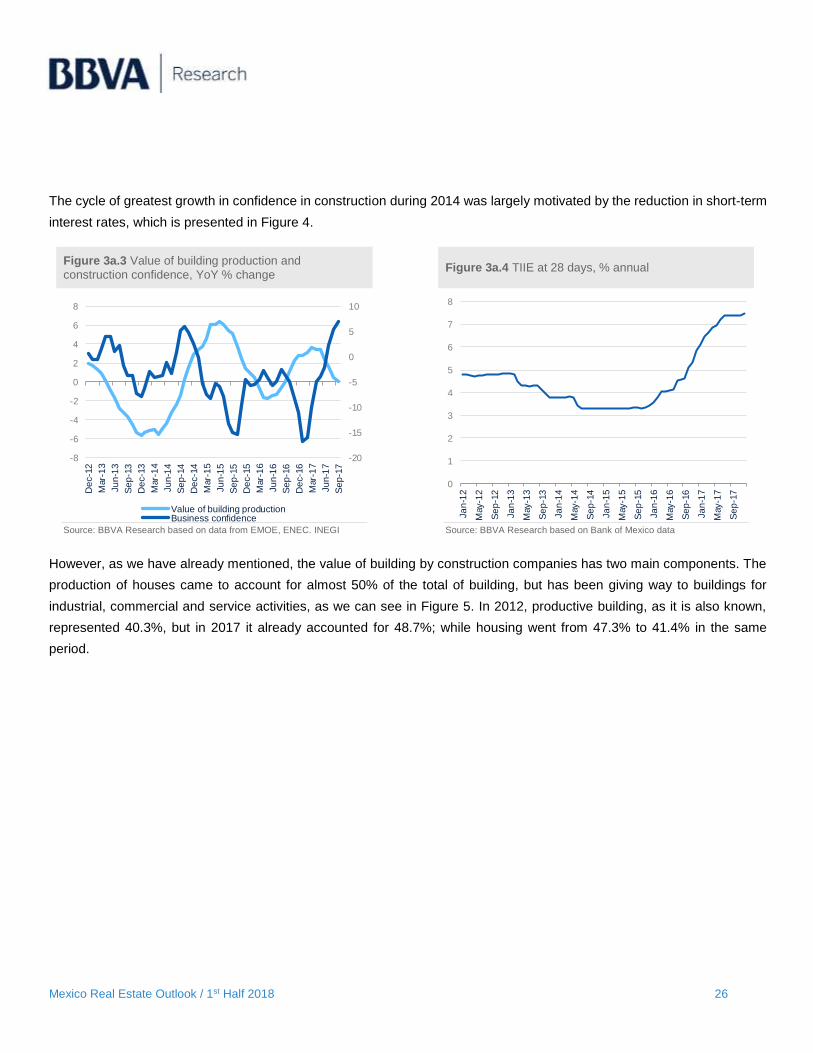
However, as we have already mentioned, the value of building by construction companies has two main components. The
production of houses came to account for almost 50% of the total of building, but has been giving way to buildings for
industrial, commercial and service activities, as we can see in Figure 5. In 2012, productive building, as it is also known,
represented 40.3%, but in 2017 it already accounted for 48.7%; while housing went from 47.3% to 41.4% in the same
period.
-20
-15
-10
-5
0
5
10
-8
-6
-4
-2
0
2
4
6
8
De
c-1
2
Mar-
13
Ju
n-1
3
Se
p-1
3
De
c-1
3
Mar-
14
Ju
n-1
4
Se
p-1
4
De
c-1
4
Mar-
15
Ju
n-1
5
Se
p-1
5
De
c-1
5
Mar-
16
Ju
n-1
6
Se
p-1
6
De
c-1
6
Mar-
17
Ju
n-1
7
Se
p-1
7
Value of building productionBusiness confidence
0
1
2
3
4
5
6
7
8
Ja
n-1
2
May-1
2
Se
p-1
2
Ja
n-1
3
May-1
3
Se
p-1
3
Ja
n-1
4
May-1
4
Se
p-1
4
Ja
n-1
5
May-1
5
Se
p-1
5
Ja
n-1
6
May-1
6
Se
p-1
6
Ja
n-1
7
May-1
7
Se
p-1
7
Mexico Real Estate Outlook / 1st Half 2018 27
Graph 3a.5 Value of production in building,
% share by components Graph 3a.6 Confidence and investment in construction
YoY % change
Source: Source: BBVA Research based on data from the ENEC. INEGI Source: BBVA Research based on data from INEGI
The foregoing would also cause a change in the trends of investment in construction from 2015, which would be more
evident by 2017. According to Figure 6, business confidence in construction followed very similar trajectories with residential
and non-residential investment. However, from 2015, residential investment separated from the historical trend and
continued to grow. This is explained, as we have already mentioned in previous issues, by the impact of subsidies for the
acquisition of new housing in those years, which practically doubled their historical average.
On the other hand, the non-residential investment remained aligned with a contraction in the confidence of the builders,
since those companies that were dedicated to sectors other than housing were more strongly affected by the upswing in
the short-term interest rate, which we know is highly correlated with commercial banking rates for construction financing. It
is not until the second half of 2017 when we appreciate that business confidence picks up, so it could be reflecting greater
dynamism in other activities in the real estate sector which could be reflected in an increase in production in the coming
months.
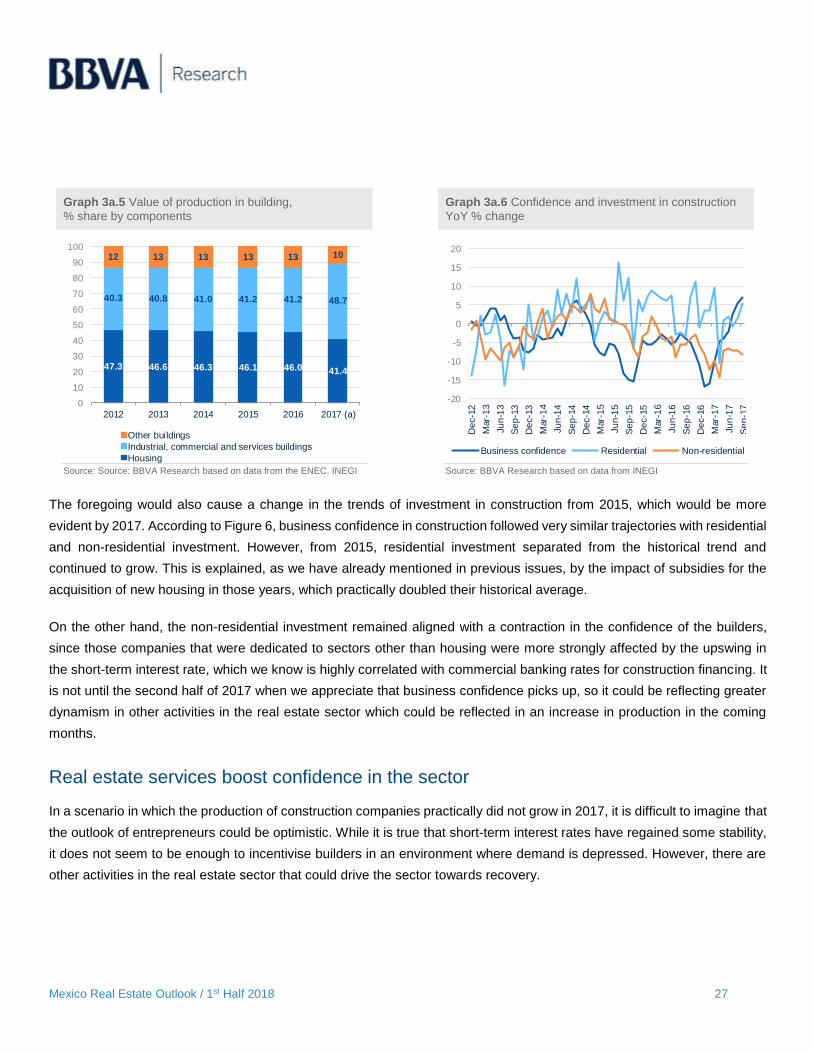
Real estate services boost confidence in the sector
In a scenario in which the production of construction companies practically did not grow in 2017, it is difficult to imagine that
the outlook of entrepreneurs could be optimistic. While it is true that short-term interest rates have regained some stability,
it does not seem to be enough to incentivise builders in an environment where demand is depressed. However, there are
other activities in the real estate sector that could drive the sector towards recovery.
47.3 46.6 46.3 46.1 46.0 41.4
40.3 40.8 41.0 41.2 41.2 48.7
12 13 13 13 13 10
0
10
20
30
40
50
60
70
80
90
100
2012 2013 2014 2015 2016 2017 (a)
Other buildings
Industrial, commercial and services buildings
Housing
-20
-15
-10
-5
0
5
10
15
20
De
c-1
2
Mar-
13
Ju
n-1
3
Se
p-1
3
De
c-1
3
Mar-
14
Ju
n-1
4
Se
p-1
4
De
c-1
4
Mar-
15
Ju
n-1
5
Se
p-1
5
De
c-1
5
Mar-
16
Ju
n-1
6
Se
p-1
6
De
c-1
6
Mar-
17
Ju
n-1
7
Se
p-1
7
Business confidence Residential Non-residential
Mexico Real Estate Outlook / 1st Half 2018 28
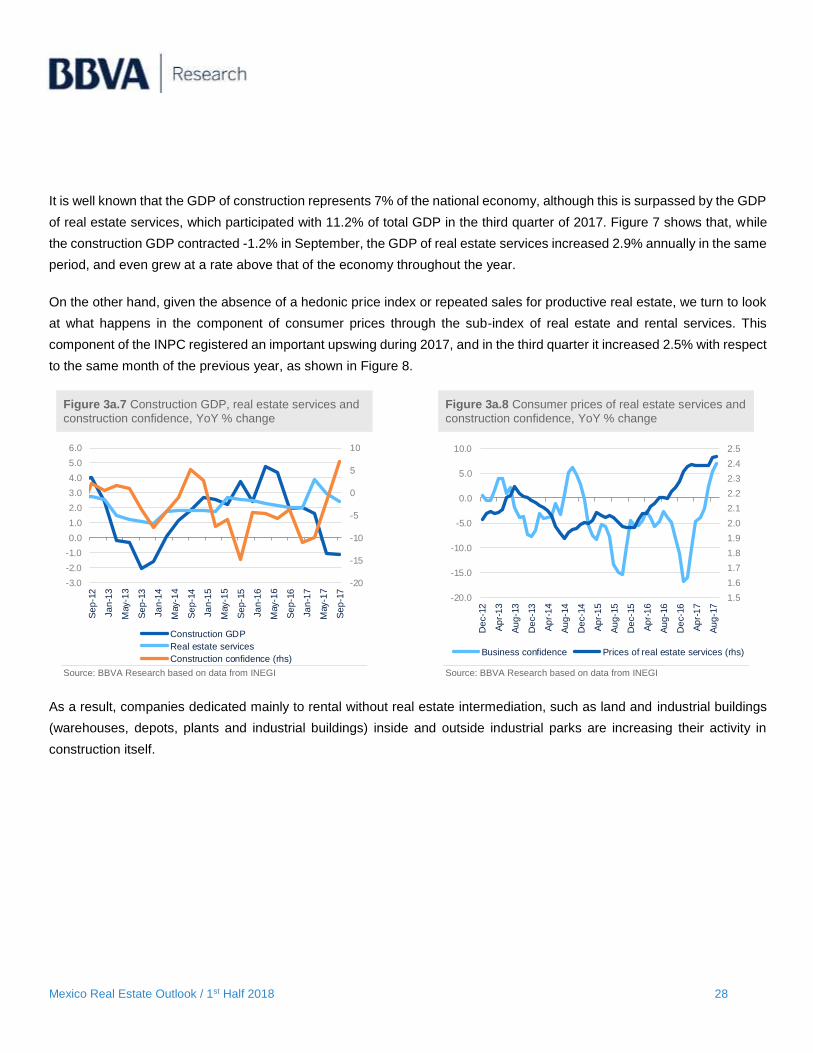
It is well known that the GDP of construction represents 7% of the national economy, although this is surpassed by the GDP
of real estate services, which participated with 11.2% of total GDP in the third quarter of 2017. Figure 7 shows that, while
the construction GDP contracted -1.2% in September, the GDP of real estate services increased 2.9% annually in the same
period, and even grew at a rate above that of the economy throughout the year.
On the other hand, given the absence of a hedonic price index or repeated sales for productive real estate, we turn to look
at what happens in the component of consumer prices through the sub-index of real estate and rental services. This
component of the INPC registered an important upswing during 2017, and in the third quarter it increased 2.5% with respect
to the same month of the previous year, as shown in Figure 8.
Figure 3a.7 Construction GDP, real estate services and
construction confidence, YoY % change Figure 3a.8 Consumer prices of real estate services and
construction confidence, YoY % change
Source: BBVA Research based on data from INEGI Source: BBVA Research based on data from INEGI
As a result, companies dedicated mainly to rental without real estate intermediation, such as land and industrial buildings
(warehouses, depots, plants and industrial buildings) inside and outside industrial parks are increasing their activity in
construction itself.
-20
-15
-10
-5
0
5
10
-3.0
-2.0
-1.0
0.0
1.0
2.0
3.0
4.0
5.0
6.0
Se
p-1
2
Ja
n-1
3
May-1
3
Se
p-1
3
Ja
n-1
4
May-1
4
Se
p-1
4
Ja
n-1
5
May-1
5
Se
p-1
5
Ja
n-1
6
May-1
6
Se
p-1
6
Ja
n-1
7
May-1
7
Se
p-1
7
Construction GDP
Real estate services
Construction confidence (rhs)
1.5
1.6
1.7
1.8
1.9
2.0
2.1
2.2
2.3
2.4
2.5
-20.0
-15.0
-10.0
-5.0
0.0
5.0
10.0
De
c-1
2
Ap
r-1
3
Au
g-1
3
De
c-1
3
Ap
r-1
4
Au
g-1
4
De
c-1
4
Ap
r-1
5
Au
g-1
5
De
c-1
5
Ap
r-1
6
Au
g-1
6
De
c-1
6
Ap
r-1
7
Au
g-1
7
Business confidence Prices of real estate services (rhs)
Mexico Real Estate Outlook / 1st Half 2018 29
Figure 3a.9 Consumer prices for real estate rental and
other services, YoY % change Figure 3a.10 Business confidence in construction and
holding bonds resident in the country, YoY % change
Source: BBVA Research based on data from INEGI Source: Source: BBVA Research based on data from EMOE, INEGI and
Bank of Mexico
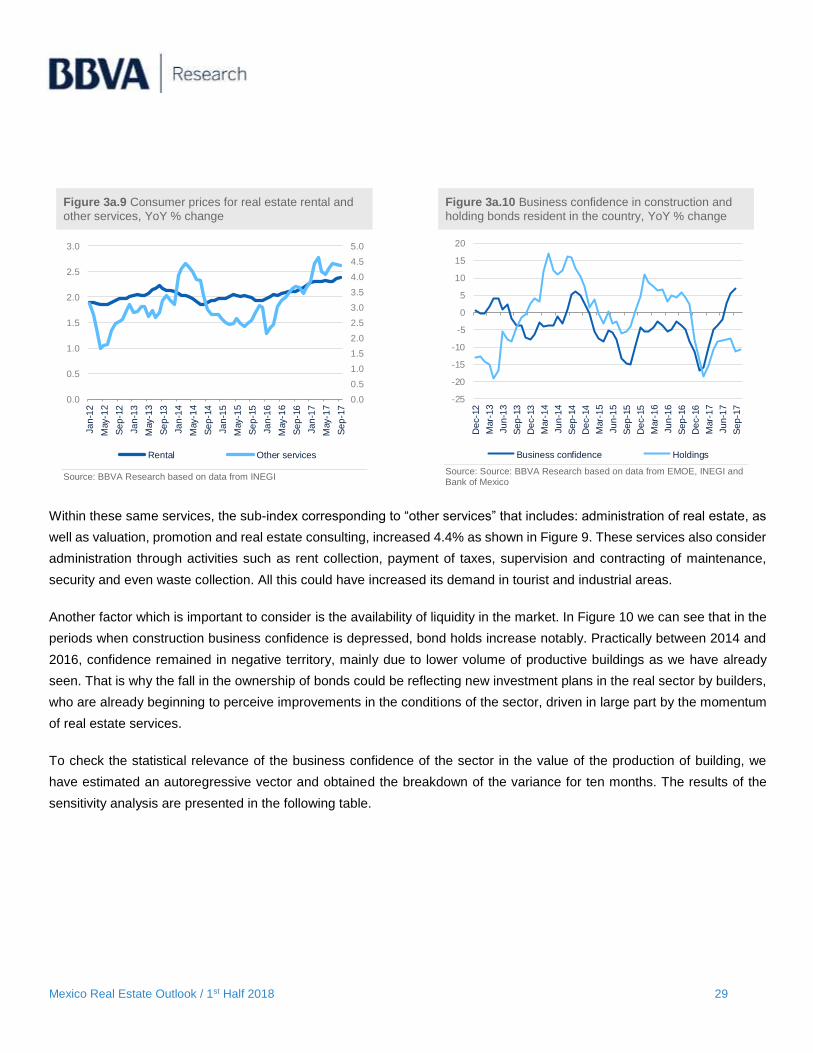
Within these same services, the sub-index corresponding to “other services” that includes: administration of real estate, as
well as valuation, promotion and real estate consulting, increased 4.4% as shown in Figure 9. These services also consider
administration through activities such as rent collection, payment of taxes, supervision and contracting of maintenance,
security and even waste collection. All this could have increased its demand in tourist and industrial areas.
Another factor which is important to consider is the availability of liquidity in the market. In Figure 10 we can see that in the
periods when construction business confidence is depressed, bond holds increase notably. Practically between 2014 and
2016, confidence remained in negative territory, mainly due to lower volume of productive buildings as we have already
seen. That is why the fall in the ownership of bonds could be reflecting new investment plans in the real sector by builders,
who are already beginning to perceive improvements in the conditions of the sector, driven in large part by the momentum
of real estate services.
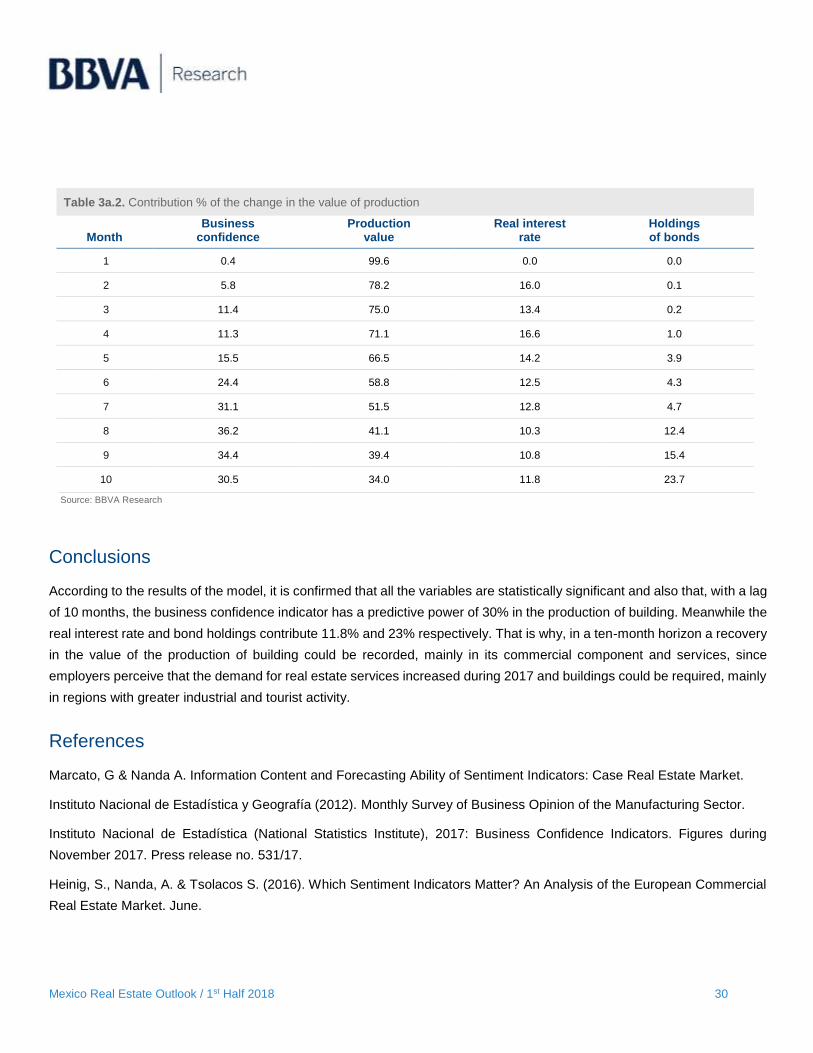
To check the statistical relevance of the business confidence of the sector in the value of the production of building, we
have estimated an autoregressive vector and obtained the breakdown of the variance for ten months. The results of the
sensitivity analysis are presented in the following table.
0.0
0.5
1.0
1.5
2.0
2.5
3.0
3.5
4.0
4.5
5.0
0.0
0.5
1.0
1.5
2.0
2.5
3.0
Ja
n-1
2
May-1
2
Se
p-1
2
Ja
n-1
3
May-1
3
Se
p-1
3
Ja
n-1
4
May-1
4
Se
p-1
4
Ja
n-1
5
May-1
5
Se
p-1
5
Ja
n-1
6
May-1
6
Se
p-1
6
Ja
n-1
7
May-1
7
Se
p-1
7
Rental Other services
-25
-20
-15
-10
-5
0
5
10
15
20
De
c-1
2
Mar-
13
Ju
n-1
3
Se
p-1
3
De
c-1
3
Mar-
14
Ju
n-1
4
Se
p-1
4
De
c-1
4
Mar-
15
Ju
n-1
5
Se
p-1
5
De
c-1
5
Mar-
16
Ju
n-1
6
Se
p-1
6
De
c-1
6
Mar-
17
Ju
n-1
7
Se
p-1
7
Business confidence Holdings
Mexico Real Estate Outlook / 1st Half 2018 30
Table 3a.2. Contribution % of the change in the value of production
Month Business
confidence Production
value Real interest
rate Holdings of bonds
1 0.4 99.6 0.0 0.0
2 5.8 78.2 16.0 0.1
3 11.4 75.0 13.4 0.2
4 11.3 71.1 16.6 1.0
5 15.5 66.5 14.2 3.9
6 24.4 58.8 12.5 4.3
7 31.1 51.5 12.8 4.7
8 36.2 41.1 10.3 12.4
9 34.4 39.4 10.8 15.4
10 30.5 34.0 11.8 23.7
Source: BBVA Research
Conclusions
According to the results of the model, it is confirmed that all the variables are statistically significant and also that, with a lag
of 10 months, the business confidence indicator has a predictive power of 30% in the production of building. Meanwhile the
real interest rate and bond holdings contribute 11.8% and 23% respectively. That is why, in a ten-month horizon a recovery
in the value of the production of building could be recorded, mainly in its commercial component and services, since
employers perceive that the demand for real estate services increased during 2017 and buildings could be required, mainly
in regions with greater industrial and tourist activity.
References
Marcato, G & Nanda A. Information Content and Forecasting Ability of Sentiment Indicators: Case Real Estate Market.
Instituto Nacional de Estadística y Geografía (2012). Monthly Survey of Business Opinion of the Manufacturing Sector.
Instituto Nacional de Estadística (National Statistics Institute), 2017: Business Confidence Indicators. Figures during
November 2017. Press release no. 531/17.
Heinig, S., Nanda, A. & Tsolacos S. (2016). Which Sentiment Indicators Matter? An Analysis of the European Commercial
Real Estate Market. June.
Mexico Real Estate Outlook / 1st Half 2018 31
3b. Low mortgage debt of households
The economic analysis that we present most frequently here in Mexico Real Estate Outlook focuses on the supply side
perspective. Even though we have emphasised the significance of studying demand more, the lower availability of
information makes it difficult to focus on the consumer.
Now, with the housing market contracting, the analysis of demand becomes paramount in order to know what has been
done well, what can be improved and where there could be an opportunity to expand the market. One of these aspects to
know in detail is the level of indebtedness of those households that have opted for a mortgage loan. We usually rely on the
figures published by banks or authorities based on information from them; but consumers may have a different perspective.
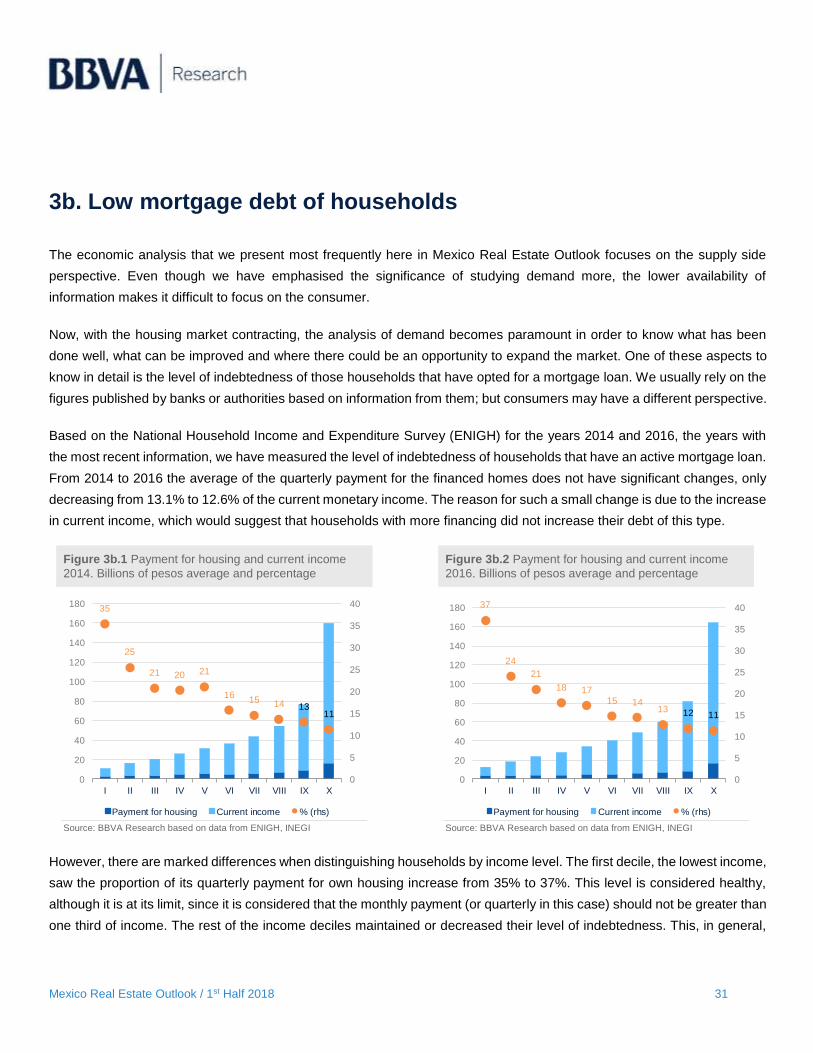
Based on the National Household Income and Expenditure Survey (ENIGH) for the years 2014 and 2016, the years with
the most recent information, we have measured the level of indebtedness of households that have an active mortgage loan.
From 2014 to 2016 the average of the quarterly payment for the financed homes does not have significant changes, only
decreasing from 13.1% to 12.6% of the current monetary income. The reason for such a small change is due to the increase
in current income, which would suggest that households with more financing did not increase their debt of this type.
Figure 3b.1 Payment for housing and current income
2014. Billions of pesos average and percentage Figure 3b.2 Payment for housing and current income
2016. Billions of pesos average and percentage
Source: BBVA Research based on data from ENIGH, INEGI Source: BBVA Research based on data from ENIGH, INEGI
However, there are marked differences when distinguishing households by income level. The first decile, the lowest income,
saw the proportion of its quarterly payment for own housing increase from 35% to 37%. This level is considered healthy,
although it is at its limit, since it is considered that the monthly payment (or quarterly in this case) should not be greater than
one third of income. The rest of the income deciles maintained or decreased their level of indebtedness. This, in general,
35
25
21 20 21
1615 14 13
11
0
5
10
15
20
25
30
35
40
0
20
40
60
80
100
120
140
160
180
I II III IV V VI VII VIII IX X
Payment for housing Current income % (rhs)
37
24
21
18 1715 14
13 12 11
0
5
10
15
20
25
30
35
40
0
20
40
60
80
100
120
140
160
180
I II III IV V VI VII VIII IX X
Payment for housing Current income % (rhs)
Mexico Real Estate Outlook / 1st Half 2018 32
indicates that the level of indebtedness remains at a low and stable level. An expected trend is that the higher the income,
the lower the proportion of payment for housing, even when the value of the housing being paid for could be higher.
Low indebtedness even with access to higher value housing
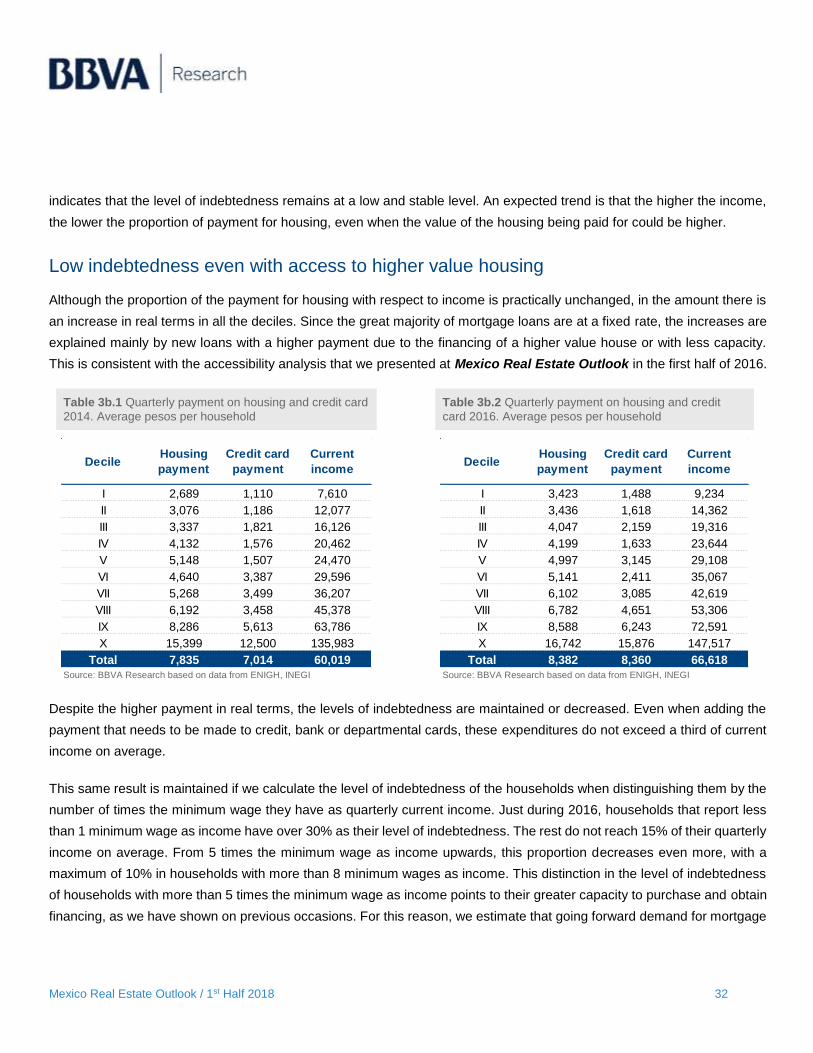
Although the proportion of the payment for housing with respect to income is practically unchanged, in the amount there is
an increase in real terms in all the deciles. Since the great majority of mortgage loans are at a fixed rate, the increases are
explained mainly by new loans with a higher payment due to the financing of a higher value house or with less capacity.
This is consistent with the accessibility analysis that we presented at Mexico Real Estate Outlook in the first half of 2016.
Table 3b.1 Quarterly payment on housing and credit card
2014. Average pesos per household Table 3b.2 Quarterly payment on housing and credit
card 2016. Average pesos per household
Source: BBVA Research based on data from ENIGH, INEGI Source: BBVA Research based on data from ENIGH, INEGI
Despite the higher payment in real terms, the levels of indebtedness are maintained or decreased. Even when adding the
payment that needs to be made to credit, bank or departmental cards, these expenditures do not exceed a third of current
income on average.
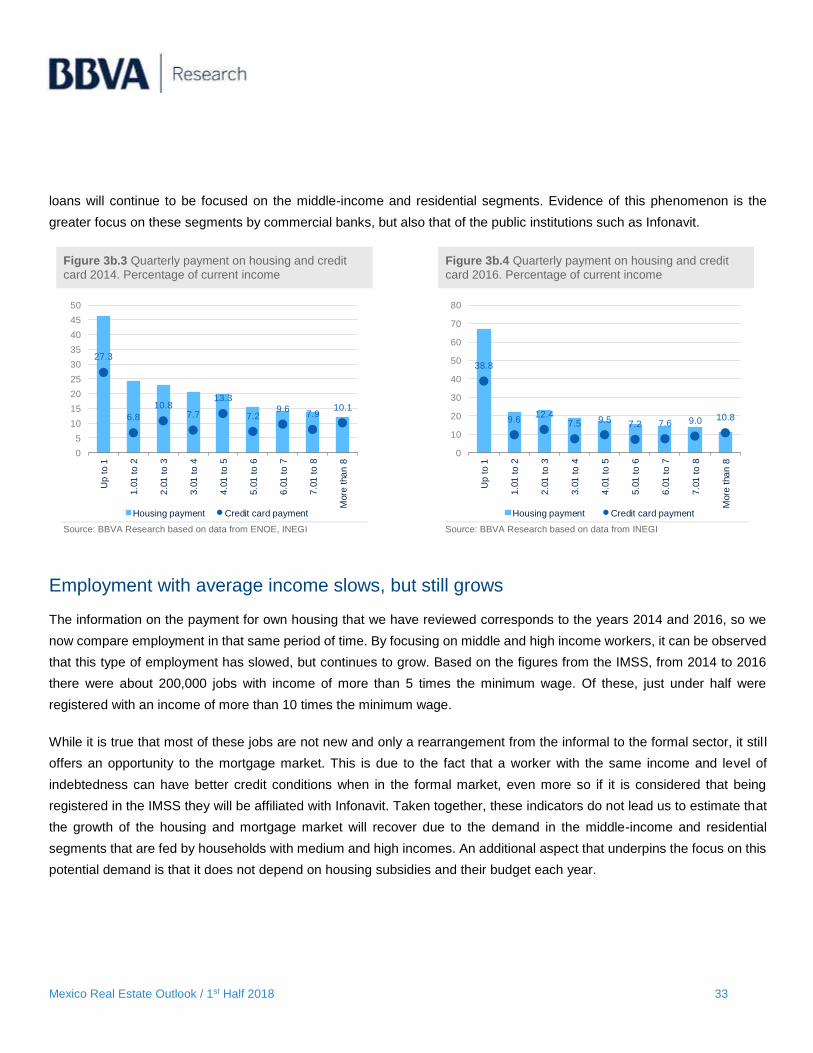
This same result is maintained if we calculate the level of indebtedness of the households when distinguishing them by the
number of times the minimum wage they have as quarterly current income. Just during 2016, households that report less
than 1 minimum wage as income have over 30% as their level of indebtedness. The rest do not reach 15% of their quarterly
income on average. From 5 times the minimum wage as income upwards, this proportion decreases even more, with a
maximum of 10% in households with more than 8 minimum wages as income. This distinction in the level of indebtedness
of households with more than 5 times the minimum wage as income points to their greater capacity to purchase and obtain
financing, as we have shown on previous occasions. For this reason, we estimate that going forward demand for mortgage
DecileHousing
payment
Credit card
payment
Current
income
I 2,689 1,110 7,610
II 3,076 1,186 12,077
III 3,337 1,821 16,126
IV 4,132 1,576 20,462
V 5,148 1,507 24,470
VI 4,640 3,387 29,596
VII 5,268 3,499 36,207
VIII 6,192 3,458 45,378
IX 8,286 5,613 63,786
X 15,399 12,500 135,983
Total 7,835 7,014 60,019
DecileHousing
payment
Credit card
payment
Current
income
I 3,423 1,488 9,234
II 3,436 1,618 14,362
III 4,047 2,159 19,316
IV 4,199 1,633 23,644
V 4,997 3,145 29,108
VI 5,141 2,411 35,067
VII 6,102 3,085 42,619
VIII 6,782 4,651 53,306
IX 8,588 6,243 72,591
X 16,742 15,876 147,517
Total 8,382 8,360 66,618
Mexico Real Estate Outlook / 1st Half 2018 33
loans will continue to be focused on the middle-income and residential segments. Evidence of this phenomenon is the
greater focus on these segments by commercial banks, but also that of the public institutions such as Infonavit.
Figure 3b.3 Quarterly payment on housing and credit
card 2014. Percentage of current income Figure 3b.4 Quarterly payment on housing and credit
card 2016. Percentage of current income
Source: BBVA Research based on data from ENOE, INEGI Source: BBVA Research based on data from INEGI
Employment with average income slows, but still grows
The information on the payment for own housing that we have reviewed corresponds to the years 2014 and 2016, so we
now compare employment in that same period of time. By focusing on middle and high income workers, it can be observed
that this type of employment has slowed, but continues to grow. Based on the figures from the IMSS, from 2014 to 2016
there were about 200,000 jobs with income of more than 5 times the minimum wage. Of these, just under half were
registered with an income of more than 10 times the minimum wage.
While it is true that most of these jobs are not new and only a rearrangement from the informal to the formal sector, it stil l
offers an opportunity to the mortgage market. This is due to the fact that a worker with the same income and level of
indebtedness can have better credit conditions when in the formal market, even more so if it is considered that being
registered in the IMSS they will be affiliated with Infonavit. Taken together, these indicators do not lead us to estimate that
the growth of the housing and mortgage market will recover due to the demand in the middle-income and residential
segments that are fed by households with medium and high incomes. An additional aspect that underpins the focus on this
potential demand is that it does not depend on housing subsidies and their budget each year.
27.3
6.8
10.87.7
13.3
7.29.6
7.910.1
0
5
10
15
20
25
30
35
40
45
50
Up
to 1
1.0
1 t
o 2
2.0
1 t
o 3
3.0
1 t
o 4
4.0
1 t
o 5
5.0
1 t
o 6
6.0
1 t
o 7
7.0
1 t
o 8
More
tha
n 8
Housing payment Credit card payment
38.8
9.612.4
7.5 9.5 7.2 7.6 9.0 10.8
0
10
20
30
40
50
60
70
80
Up
to 1
1.0
1 t
o 2
2.0
1 t
o 3
3.0
1 t
o 4
4.0
1 t
o 5
5.0
1 t
o 6
6.0
1 t
o 7
7.0
1 t
o 8
More
tha
n 8
Housing payment Credit card payment
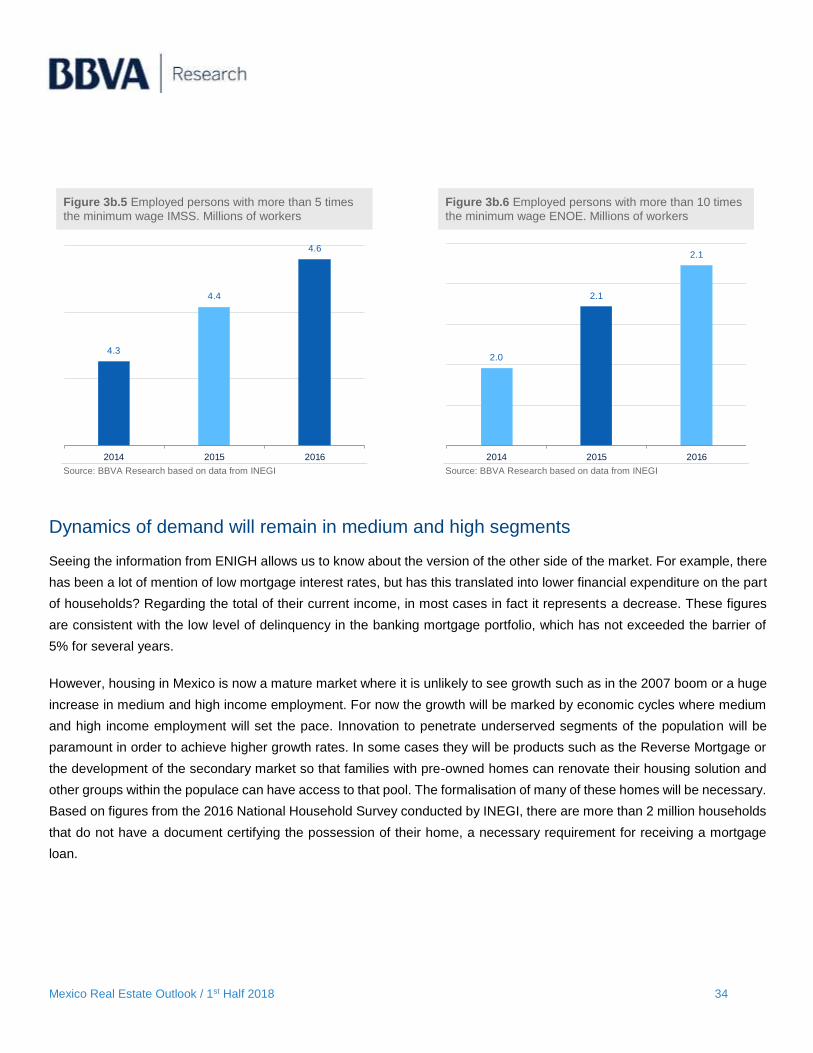
Mexico Real Estate Outlook / 1st Half 2018 34
Figure 3b.5 Employed persons with more than 5 times
the minimum wage IMSS. Millions of workers Figure 3b.6 Employed persons with more than 10 times
the minimum wage ENOE. Millions of workers
Source: BBVA Research based on data from INEGI Source: BBVA Research based on data from INEGI
Dynamics of demand will remain in medium and high segments
Seeing the information from ENIGH allows us to know about the version of the other side of the market. For example, there
has been a lot of mention of low mortgage interest rates, but has this translated into lower financial expenditure on the part
of households? Regarding the total of their current income, in most cases in fact it represents a decrease. These figures
are consistent with the low level of delinquency in the banking mortgage portfolio, which has not exceeded the barrier of
5% for several years.
However, housing in Mexico is now a mature market where it is unlikely to see growth such as in the 2007 boom or a huge
increase in medium and high income employment. For now the growth will be marked by economic cycles where medium
and high income employment will set the pace. Innovation to penetrate underserved segments of the population will be
paramount in order to achieve higher growth rates. In some cases they will be products such as the Reverse Mortgage or
the development of the secondary market so that families with pre-owned homes can renovate their housing solution and
other groups within the populace can have access to that pool. The formalisation of many of these homes will be necessary.
Based on figures from the 2016 National Household Survey conducted by INEGI, there are more than 2 million households
that do not have a document certifying the possession of their home, a necessary requirement for receiving a mortgage
loan.
4.3
4.4
4.6
2014 2015 2016
2.0
2.1
2.1
2014 2015 2016

Mexico Real Estate Outlook / 1st Half 2018 35
4. Statistical appendix
Table 4.1 Annual macroeconomic indicators
Source: BBVA Bancomer with Banco de Mexico, Conasami, Inegi & IMSS data
Table 4.2 Annual construction and housing indicators
1: Considers companies affiliated and not affiliated to the Mexican Chamber of the Construction Industry. Source: BBVA Bancomer with Banco de Mexico, Conasami, Inegi, IMSS, Infonavit and Fovissste data
2010 2011 2012 2013 2014 2015 2016 2017 2018
Real GDP
Annual % change 5.1 3.7 3.4 1.6 2.8 3.3 2.7 2.2 2.0
Real private consumption
Annual % change 3.6 3.4 2.1 2.0 2.1 3.3 3.4 3.4 3.2
Real government consumption
Annual % change 2.3 3.0 3.4 0.5 2.9 1.9 2.4 0.1 1.2
Real construction investment (annual % chge.) -0.3 3.5 2.1 -5.3 2.2 1.5 -0.3 -4.9
Residential -0.7 4.2 1.4 -5.0 3.2 3.7 4.2 0.7
Non-residential 0.0 2.9 2.7 -5.5 1.5 -0.1 -3.8 -9.7
Total formal private employment (IMSS)
Thousands of persons (average, sa) 14,524 15,154 15,856 16,409 16,991 17,724 18,401 19,206
Annual % change 3.8 4.3 4.6 3.5 3.5 4.3 3.8 4.4
Average salary (IMSS)
Nominal pesos per day, average 248.7 260.1 270.8 281.5 294.1 306.4 317.9 333.1
Real annual % change -0.5 1.1 0.0 0.1 0.4 1.4 0.9 -0.5
Real total wages (IMSS)
Annual % change 2.3 6.1 5.1 3.6 4.0 5.8 4.8 3.1
Minimum general salary (daily) 55.8 58.1 60.5 63.1 65.6 69.2 73.0 80.0
Nominal pesos
Real annual % change 0.6 1.0 -0.1 0.4 -0.1 0.2 0.8 1.6
Consumer prices (end of period) 4.4 3.8 3.6 4.0 4.1 2.1 3.4 6.7
Annual % change
TIIE 28 average (%) 4.9 4.8 4.8 4.3 3.5 3.3 4.5 7.1
10-year interest rate, 10 year Govt bond (M10) 6.9 6.8 5.7 5.7 6.0 5.9 6.2 7.2
2010 2011 2012 2013 2014 2015 2016 2017 2018
Real GDP (annual % change) 0.0 4.0 2.4 -1.6 2.7 2.4 2.0 -1.3 -1.0
Building -0.9 4.2 2.7 -3.0 3.2 3.3 4.2 -0.3 -1.0
Civil engineering and major works 1.8 2.8 0.7 3.0 -1.9 -0.5 -8.9 -8.2 -1.8
Specialized construction work 1.9 5.6 4.2 -2.3 9.2 3.1 10.1 4.8 0.2
Construction employment (IMSS)
Thousands people, average 1,145.5 1,199.5 1,275.2 1,289.8 1,383.5 1,504.0 1,506.4
Annual % change 3.8 4.7 6.3 1.1 7.3 8.7 0.2
Hydraulic cement sales (tons)
Annual % change -2.9 1.5 2.1 -5.9 5.1 7.4 1.5
National cement consumption (tons)
Annual % change -5.3 1.4 2.5 -6.0 4.9 7.4 1.5
Construction companies1
Real production value (annual % change)
Total 3.3 3.2 3.4 -3.7 -0.1 0.1 -1.4
Building -5.3 6.3 2.0 -5.6 2.7 1.6 3.0
Public works 9.8 0.3 0.5 -4.4 -3.1 0.2 -8.4
Water, irrigation and sanitation 3.7 10.5 1.9 -6.0 -7.4 -7.0 1.2
Electricity and communications 27.0 21.4 -6.8 -2.2 -10.5 9.1 23.3
Transportation 8.0 -2.8 -2.7 -7.8 2.6 -4.0 -6.2
Oil and petrochemicals 9.5 -7.7 14.7 3.6 -9.9 9.5 -35.3
Other 21.5 6.2 36.4 10.6 2.2 -6.7 14.0
Construction prices (annual % change)
Headline 4.8 9.3 0.4 -0.7 6.5 2.3 8.7
Construction materials 5.2 10.6 -0.2 -1.4 4.5 4.5 9.8
Labor 3.3 3.8 3.2 2.9 3.5 4.2 2.9
Equipment rental 3.2 5.3 -0.2 1.4 4.1 7.8 7.9
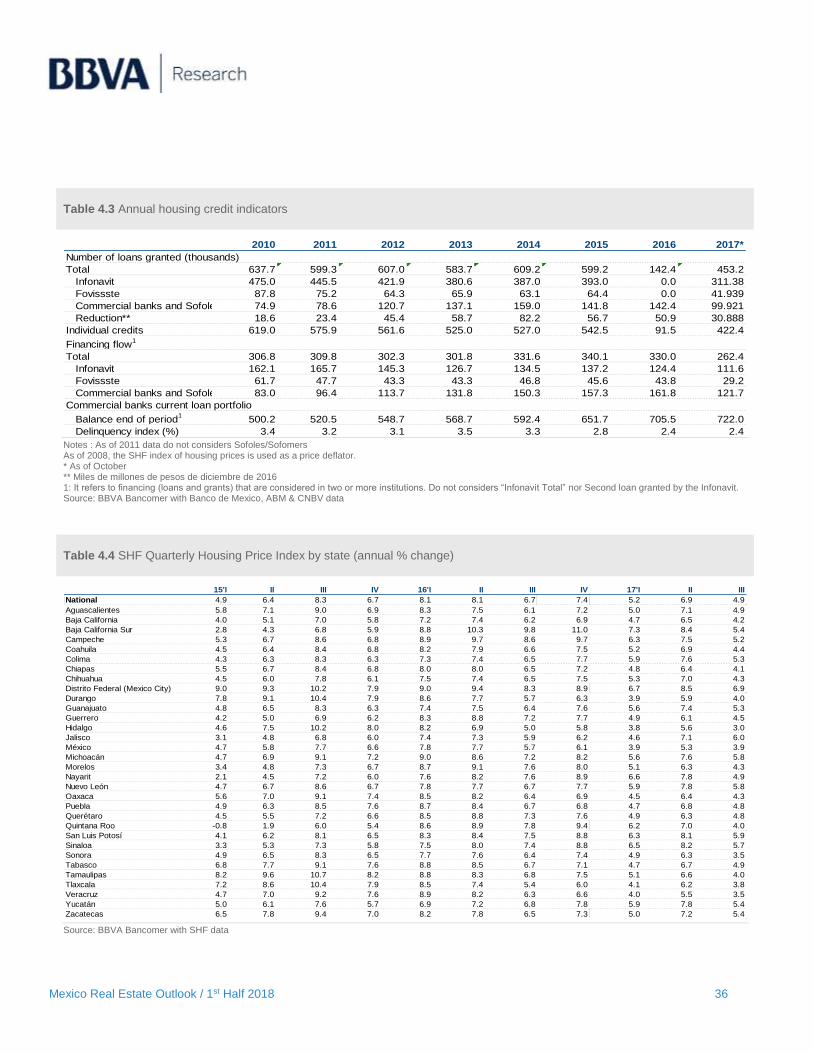
Mexico Real Estate Outlook / 1st Half 2018 36
Table 4.3 Annual housing credit indicators
Notes : As of 2011 data do not considers Sofoles/Sofomers As of 2008, the SHF index of housing prices is used as a price deflator. * As of October ** Miles de millones de pesos de diciembre de 2016 1: It refers to financing (loans and grants) that are considered in two or more institutions. Do not considers “Infonavit Total” nor Second loan granted by the Infonavit. Source: BBVA Bancomer with Banco de Mexico, ABM & CNBV data
Table 4.4 SHF Quarterly Housing Price Index by state (annual % change)
Source: BBVA Bancomer with SHF data
2010 2011 2012 2013 2014 2015 2016 2017*
Number of loans granted (thousands)
Total 637.7 599.3 607.0 583.7 609.2 599.2 142.4 453.2
Infonavit 475.0 445.5 421.9 380.6 387.0 393.0 0.0 311.38
Fovissste 87.8 75.2 64.3 65.9 63.1 64.4 0.0 41.939
Commercial banks and Sofoles 74.9 78.6 120.7 137.1 159.0 141.8 142.4 99.921
Reduction** 18.6 23.4 45.4 58.7 82.2 56.7 50.9 30.888
Individual credits 619.0 575.9 561.6 525.0 527.0 542.5 91.5 422.4
Financing flow1
Total 306.8 309.8 302.3 301.8 331.6 340.1 330.0 262.4
Infonavit 162.1 165.7 145.3 126.7 134.5 137.2 124.4 111.6
Fovissste 61.7 47.7 43.3 43.3 46.8 45.6 43.8 29.2
Commercial banks and Sofoles 83.0 96.4 113.7 131.8 150.3 157.3 161.8 121.7
Commercial banks current loan portfolio
Balance end of period1
500.2 520.5 548.7 568.7 592.4 651.7 705.5 722.0
Delinquency index (%) 3.4 3.2 3.1 3.5 3.3 2.8 2.4 2.4
15'I II III IV 16'I II III IV 17'I II III
National 4.9 6.4 8.3 6.7 8.1 8.1 6.7 7.4 5.2 6.9 4.9
Aguascalientes 5.8 7.1 9.0 6.9 8.3 7.5 6.1 7.2 5.0 7.1 4.9
Baja California 4.0 5.1 7.0 5.8 7.2 7.4 6.2 6.9 4.7 6.5 4.2
Baja California Sur 2.8 4.3 6.8 5.9 8.8 10.3 9.8 11.0 7.3 8.4 5.4
Campeche 5.3 6.7 8.6 6.8 8.9 9.7 8.6 9.7 6.3 7.5 5.2
Coahuila 4.5 6.4 8.4 6.8 8.2 7.9 6.6 7.5 5.2 6.9 4.4
Colima 4.3 6.3 8.3 6.3 7.3 7.4 6.5 7.7 5.9 7.6 5.3
Chiapas 5.5 6.7 8.4 6.8 8.0 8.0 6.5 7.2 4.8 6.4 4.1
Chihuahua 4.5 6.0 7.8 6.1 7.5 7.4 6.5 7.5 5.3 7.0 4.3
Distrito Federal (Mexico City) 9.0 9.3 10.2 7.9 9.0 9.4 8.3 8.9 6.7 8.5 6.9
Durango 7.8 9.1 10.4 7.9 8.6 7.7 5.7 6.3 3.9 5.9 4.0
Guanajuato 4.8 6.5 8.3 6.3 7.4 7.5 6.4 7.6 5.6 7.4 5.3
Guerrero 4.2 5.0 6.9 6.2 8.3 8.8 7.2 7.7 4.9 6.1 4.5
Hidalgo 4.6 7.5 10.2 8.0 8.2 6.9 5.0 5.8 3.8 5.6 3.0
Jalisco 3.1 4.8 6.8 6.0 7.4 7.3 5.9 6.2 4.6 7.1 6.0
México 4.7 5.8 7.7 6.6 7.8 7.7 5.7 6.1 3.9 5.3 3.9
Michoacán 4.7 6.9 9.1 7.2 9.0 8.6 7.2 8.2 5.6 7.6 5.8
Morelos 3.4 4.8 7.3 6.7 8.7 9.1 7.6 8.0 5.1 6.3 4.3
Nayarit 2.1 4.5 7.2 6.0 7.6 8.2 7.6 8.9 6.6 7.8 4.9
Nuevo León 4.7 6.7 8.6 6.7 7.8 7.7 6.7 7.7 5.9 7.8 5.8
Oaxaca 5.6 7.0 9.1 7.4 8.5 8.2 6.4 6.9 4.5 6.4 4.3
Puebla 4.9 6.3 8.5 7.6 8.7 8.4 6.7 6.8 4.7 6.8 4.8
Querétaro 4.5 5.5 7.2 6.6 8.5 8.8 7.3 7.6 4.9 6.3 4.8
Quintana Roo -0.8 1.9 6.0 5.4 8.6 8.9 7.8 9.4 6.2 7.0 4.0
San Luis Potosí 4.1 6.2 8.1 6.5 8.3 8.4 7.5 8.8 6.3 8.1 5.9
Sinaloa 3.3 5.3 7.3 5.8 7.5 8.0 7.4 8.8 6.5 8.2 5.7
Sonora 4.9 6.5 8.3 6.5 7.7 7.6 6.4 7.4 4.9 6.3 3.5
Tabasco 6.8 7.7 9.1 7.6 8.8 8.5 6.7 7.1 4.7 6.7 4.9
Tamaulipas 8.2 9.6 10.7 8.2 8.8 8.3 6.8 7.5 5.1 6.6 4.0
Tlaxcala 7.2 8.6 10.4 7.9 8.5 7.4 5.4 6.0 4.1 6.2 3.8
Veracruz 4.7 7.0 9.2 7.6 8.9 8.2 6.3 6.6 4.0 5.5 3.5
Yucatán 5.0 6.1 7.6 5.7 6.9 7.2 6.8 7.8 5.9 7.8 5.4
Zacatecas 6.5 7.8 9.4 7.0 8.2 7.8 6.5 7.3 5.0 7.2 5.4
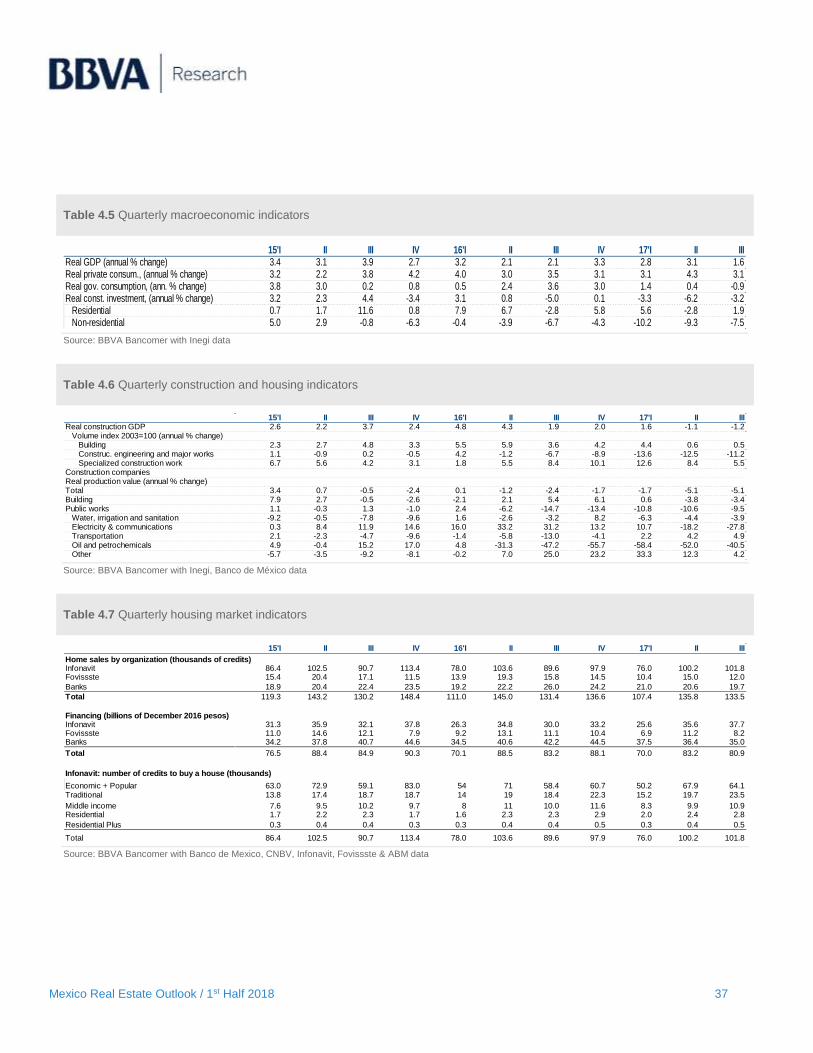
Mexico Real Estate Outlook / 1st Half 2018 37
Table 4.5 Quarterly macroeconomic indicators
Source: BBVA Bancomer with Inegi data
Table 4.6 Quarterly construction and housing indicators
Source: BBVA Bancomer with Inegi, Banco de México data
Table 4.7 Quarterly housing market indicators
Source: BBVA Bancomer with Banco de Mexico, CNBV, Infonavit, Fovissste & ABM data
15'I II III IV 16'I II III IV 17'I II IIIReal GDP (annual % change) 3.4 3.1 3.9 2.7 3.2 2.1 2.1 3.3 2.8 3.1 1.6Real private consum., (annual % change) 3.2 2.2 3.8 4.2 4.0 3.0 3.5 3.1 3.1 4.3 3.1Real gov. consumption, (ann. % change) 3.8 3.0 0.2 0.8 0.5 2.4 3.6 3.0 1.4 0.4 -0.9Real const. investment, (annual % change) 3.2 2.3 4.4 -3.4 3.1 0.8 -5.0 0.1 -3.3 -6.2 -3.2 Residential 0.7 1.7 11.6 0.8 7.9 6.7 -2.8 5.8 5.6 -2.8 1.9 Non-residential 5.0 2.9 -0.8 -6.3 -0.4 -3.9 -6.7 -4.3 -10.2 -9.3 -7.5
15'I II III IV 16'I II III IV 17'I II IIIReal construction GDP 2.6 2.2 3.7 2.4 4.8 4.3 1.9 2.0 1.6 -1.1 -1.2 Volume index 2003=100 (annual % change) Building 2.3 2.7 4.8 3.3 5.5 5.9 3.6 4.2 4.4 0.6 0.5 Construc. engineering and major works 1.1 -0.9 0.2 -0.5 4.2 -1.2 -6.7 -8.9 -13.6 -12.5 -11.2 Specialized construction work 6.7 5.6 4.2 3.1 1.8 5.5 8.4 10.1 12.6 8.4 5.5Construction companiesReal production value (annual % change)Total 3.4 0.7 -0.5 -2.4 0.1 -1.2 -2.4 -1.7 -1.7 -5.1 -5.1Building 7.9 2.7 -0.5 -2.6 -2.1 2.1 5.4 6.1 0.6 -3.8 -3.4Public works 1.1 -0.3 1.3 -1.0 2.4 -6.2 -14.7 -13.4 -10.8 -10.6 -9.5 Water, irrigation and sanitation -9.2 -0.5 -7.8 -9.6 1.6 -2.6 -3.2 8.2 -6.3 -4.4 -3.9 Electricity & communications 0.3 8.4 11.9 14.6 16.0 33.2 31.2 13.2 10.7 -18.2 -27.8 Transportation 2.1 -2.3 -4.7 -9.6 -1.4 -5.8 -13.0 -4.1 2.2 4.2 4.9 Oil and petrochemicals 4.9 -0.4 15.2 17.0 4.8 -31.3 -47.2 -55.7 -58.4 -52.0 -40.5 Other -5.7 -3.5 -9.2 -8.1 -0.2 7.0 25.0 23.2 33.3 12.3 4.2
15'I II III IV 16'I II III IV 17'I II III
Home sales by organization (thousands of credits)Infonavit 86.4 102.5 90.7 113.4 78.0 103.6 89.6 97.9 76.0 100.2 101.8Fovissste 15.4 20.4 17.1 11.5 13.9 19.3 15.8 14.5 10.4 15.0 12.0
Banks 18.9 20.4 22.4 23.5 19.2 22.2 26.0 24.2 21.0 20.6 19.7
Total 119.3 143.2 130.2 148.4 111.0 145.0 131.4 136.6 107.4 135.8 133.5
Financing (billions of December 2016 pesos)Infonavit 31.3 35.9 32.1 37.8 26.3 34.8 30.0 33.2 25.6 35.6 37.7Fovissste 11.0 14.6 12.1 7.9 9.2 13.1 11.1 10.4 6.9 11.2 8.2Banks 34.2 37.8 40.7 44.6 34.5 40.6 42.2 44.5 37.5 36.4 35.0
Total 76.5 88.4 84.9 90.3 70.1 88.5 83.2 88.1 70.0 83.2 80.9
Infonavit: number of credits to buy a house (thousands)
Economic + Popular 63.0 72.9 59.1 83.0 54 71 58.4 60.7 50.2 67.9 64.1Traditional 13.8 17.4 18.7 18.7 14 19 18.4 22.3 15.2 19.7 23.5
Middle income 7.6 9.5 10.2 9.7 8 11 10.0 11.6 8.3 9.9 10.9Residential 1.7 2.2 2.3 1.7 1.6 2.3 2.3 2.9 2.0 2.4 2.8
Residential Plus 0.3 0.4 0.4 0.3 0.3 0.4 0.4 0.5 0.3 0.4 0.5
Total 86.4 102.5 90.7 113.4 78.0 103.6 89.6 97.9 76.0 100.2 101.8
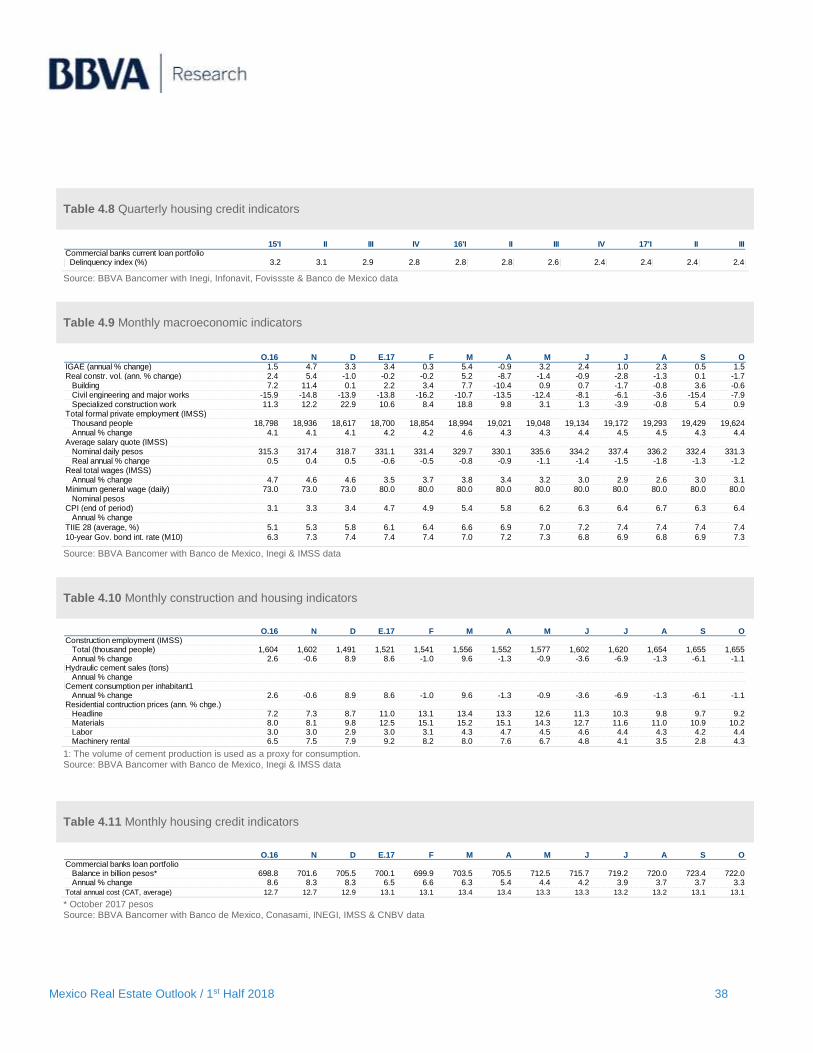
Mexico Real Estate Outlook / 1st Half 2018 38
Table 4.8 Quarterly housing credit indicators
Source: BBVA Bancomer with Inegi, Infonavit, Fovissste & Banco de Mexico data
Table 4.9 Monthly macroeconomic indicators
Source: BBVA Bancomer with Banco de Mexico, Inegi & IMSS data
Table 4.10 Monthly construction and housing indicators
1: The volume of cement production is used as a proxy for consumption. Source: BBVA Bancomer with Banco de Mexico, Inegi & IMSS data
Table 4.11 Monthly housing credit indicators
* October 2017 pesos Source: BBVA Bancomer with Banco de Mexico, Conasami, INEGI, IMSS & CNBV data
15'I II III IV 16'I II III IV 17'I II IIICommercial banks current loan portfolio Delinquency index (%) 3.2 3.1 2.9 2.8 2.8 2.8 2.6 2.4 2.4 2.4 2.4
O.16 N D E.17 F M A M J J A S OIGAE (annual % change) 1.5 4.7 3.3 3.4 0.3 5.4 -0.9 3.2 2.4 1.0 2.3 0.5 1.5Real constr. vol. (ann. % change) 2.4 5.4 -1.0 -0.2 -0.2 5.2 -8.7 -1.4 -0.9 -2.8 -1.3 0.1 -1.7 Building 7.2 11.4 0.1 2.2 3.4 7.7 -10.4 0.9 0.7 -1.7 -0.8 3.6 -0.6 Civil engineering and major works -15.9 -14.8 -13.9 -13.8 -16.2 -10.7 -13.5 -12.4 -8.1 -6.1 -3.6 -15.4 -7.9 Specialized construction work 11.3 12.2 22.9 10.6 8.4 18.8 9.8 3.1 1.3 -3.9 -0.8 5.4 0.9Total formal private employment (IMSS) Thousand people 18,798 18,936 18,617 18,700 18,854 18,994 19,021 19,048 19,134 19,172 19,293 19,429 19,624 Annual % change 4.1 4.1 4.1 4.2 4.2 4.6 4.3 4.3 4.4 4.5 4.5 4.3 4.4Average salary quote (IMSS) Nominal daily pesos 315.3 317.4 318.7 331.1 331.4 329.7 330.1 335.6 334.2 337.4 336.2 332.4 331.3 Real annual % change 0.5 0.4 0.5 -0.6 -0.5 -0.8 -0.9 -1.1 -1.4 -1.5 -1.8 -1.3 -1.2Real total wages (IMSS) Annual % change 4.7 4.6 4.6 3.5 3.7 3.8 3.4 3.2 3.0 2.9 2.6 3.0 3.1Minimum general wage (daily) 73.0 73.0 73.0 80.0 80.0 80.0 80.0 80.0 80.0 80.0 80.0 80.0 80.0 Nominal pesosCPI (end of period) 3.1 3.3 3.4 4.7 4.9 5.4 5.8 6.2 6.3 6.4 6.7 6.3 6.4 Annual % change
TIIE 28 (average, %) 5.1 5.3 5.8 6.1 6.4 6.6 6.9 7.0 7.2 7.4 7.4 7.4 7.4
10-year Gov. bond int. rate (M10) 6.3 7.3 7.4 7.4 7.4 7.0 7.2 7.3 6.8 6.9 6.8 6.9 7.3
O.16 N D E.17 F M A M J J A S OConstruction employment (IMSS) Total (thousand people) 1,604 1,602 1,491 1,521 1,541 1,556 1,552 1,577 1,602 1,620 1,654 1,655 1,655 Annual % change 2.6 -0.6 8.9 8.6 -1.0 9.6 -1.3 -0.9 -3.6 -6.9 -1.3 -6.1 -1.1Hydraulic cement sales (tons) Annual % changeCement consumption per inhabitant1 Annual % change 2.6 -0.6 8.9 8.6 -1.0 9.6 -1.3 -0.9 -3.6 -6.9 -1.3 -6.1 -1.1Residential contruction prices (ann. % chge.) Headline 7.2 7.3 8.7 11.0 13.1 13.4 13.3 12.6 11.3 10.3 9.8 9.7 9.2 Materials 8.0 8.1 9.8 12.5 15.1 15.2 15.1 14.3 12.7 11.6 11.0 10.9 10.2 Labor 3.0 3.0 2.9 3.0 3.1 4.3 4.7 4.5 4.6 4.4 4.3 4.2 4.4 Machinery rental 6.5 7.5 7.9 9.2 8.2 8.0 7.6 6.7 4.8 4.1 3.5 2.8 4.3
O.16 N D E.17 F M A M J J A S OCommercial banks loan portfolio Balance in billion pesos* 698.8 701.6 705.5 700.1 699.9 703.5 705.5 712.5 715.7 719.2 720.0 723.4 722.0 Annual % change 8.6 8.3 8.3 6.5 6.6 6.3 5.4 4.4 4.2 3.9 3.7 3.7 3.3
Total annual cost (CAT, average) 12.7 12.7 12.9 13.1 13.1 13.4 13.4 13.3 13.3 13.2 13.2 13.1 13.1
Mexico Real Estate Outlook / 1st Half 2018 39
5. Special topics included in previous issues
First Half 2017 The determining factors of the housing supply in Mexico
Infrastructure still awaits reform effect
Second Half 2016
Commercial building construction and its cycle of appreciation
Rising house prices due to increased costs
First Half 2016
The evolution of housing prices in regional clusters in Mexico
Methodology to assess the spatial dependence of housing prices
Mortgage essential in housing demand
Infonavit maintains credit placement stable
First Half 2015
Drivers of housing prices in Mexico
The significance of consumer expectations in mortgage lending
The Infonavit 2015-19 Financial Plan. Financial soundness and a greater amount of lending are key features
Second Half 2014
Transmission of monetary policy to the mortgage market
The lower benchmark interest rate could drive residential building
Mortgage portability
First Half 2014
Demand for mortgage credit: employment is the key
New housing after the real estate boom
Financing retirement with real estate assets
The Infonavit Financial Plan 2014-2018. A focus on quality
August 2013
Medium-term housing needs
The new housing policy: between short and long term
Financial reform and mortgage lending
The “Ésta es tu casa” subsidy program 2014 operating rules
Listed Homebuilders: a Foretold Ending?
The impact of the crisis of public-sector developers
Available in www.bbvaresearch.com in Spanish and English
Mexico Real Estate Outlook / 1st Half 2018 40
DISCLAIMER
This document and the information, opinions, estimates and recommendations expressed herein, have been prepared by Banco Bilbao Vizcaya Argentaria,
S.A. (hereinafter called “BBVA”) to provide its customers with general information regarding the date of issue of the report and are subject to changes
without prior notice. BBVA is not liable for giving notice of such changes or for updating the contents hereof.
This document and its contents do not constitute an offer, invitation or solicitation to purchase or subscribe to any securities or other instruments, or to
undertake or divest investments. Neither shall this document nor its contents form the basis of any contract, commitment or decision of any kind.
Investors who have access to this document should be aware that the securities, instruments or investments to which it refers may not be
appropriate for them due to their specific investment goals, financial positions or risk profiles, as these have not been taken into account to
prepare this report. Therefore, investors should make their own investment decisions considering the said circumstances and obtaining such specialized
advice as may be necessary. The contents of this document is based upon information available to the public that has been obtained from sources
considered to be reliable. However, such information has not been independently verified by BBVA and therefore no warranty, either express or implicit,
is given regarding its accuracy, integrity or correctness. BBVA accepts no liability of any type for any direct or indirect losses arising from the use of the
document or its contents. Investors should note that the past performance of securities or instruments or the historical results of investments do not
guarantee future performance.
The market prices of securities or instruments or the results of investments could fluctuate against the interests of investors. Investors should
be aware that they could even face a loss of their investment. Transactions in futures, options and securities or high-yield securities can involve
high risks and are not appropriate for every investor. Indeed, in the case of some investments, the potential losses may exceed the amount of
initial investment and, in such circumstances, investors may be required to pay more money to support those losses. Thus, before undertaking
any transaction with these instruments, investors should be aware of their operation, as well as the rights, liabilities and risks implied by the
same and the underlying stocks. Investors should also be aware that secondary markets for the said instruments may be limited or even not
exist.
BBVA or any of its affiliates, as well as their respective executives and employees, may have a position in any of the securities or instruments referred to,
directly or indirectly, in this document, or in any other related thereto; they may trade for their own account or for third-party account in those securities,
provide consulting or other services to the issuer of the aforementioned securities or instruments or to companies related thereto or to their shareholders,
executives or employees, or may have interests or perform transactions in those securities or instruments or related investments before or after the
publication of this report, to the extent permitted by the applicable law.
BBVA or any of its affiliates´ salespeople, traders, and other professionals may provide oral or written market commentary or trading strategies to its clients
that reflect opinions that are contrary to the opinions expressed herein. Furthermore, BBVA or any of its affiliates’ proprietary trading and investing
businesses may make investment decisions that are inconsistent with the recommendations expressed herein. No part of this document may be (i) copied,
photocopied or duplicated by any other form or means (ii) redistributed or (iii) quoted, without the prior written consent of BBVA. No part of this report may
be copied, conveyed, distributed or furnished to any person or entity in any country (or persons or entities in the same) in which its distribution is prohibited
by law. Failure to comply with these restrictions may breach the laws of the relevant jurisdiction.
This document is provided in the United Kingdom solely to those persons to whom it may be addressed according to the Financial Services and Markets
Act 2000 (Financial Promotion) Order 2001 and it is not to be directly or indirectly delivered to or distributed among any other type of persons or entities.
In particular, this document is only aimed at and can be delivered to the following persons or entities (i) those outside the United Kingdom, (ii) those with
expertise regarding investments as mentioned under Section 19(5) of Order 2001, (iii) high net worth entities and any other person or entity under Section
49(1) of Order 2001 to whom the contents hereof can be legally revealed.
The remuneration system concerning the analyst/s author/s of this report is based on multiple criteria, including the revenues obtained by BBVA and,
indirectly, the results of BBVA Group in the fiscal year, which, in turn, include the results generated by the investment banking business; nevertheless,
they do not receive any remuneration based on revenues from any specific transaction in investment banking.
BBVA Bancomer and the rest of BBVA Group who are not members of FINRA (Financial Industry Regulatory Authority), are not subject to the rules of
disclosure for these members.
“BBVA Bancomer, BBVA and its subsidiaries, among which is BBVA Global Markets Research, are subject to the Corporate Policy Group in
the field of BBVA Securities Markets. In each jurisdiction in which BBVA is active in the Securities Markets, the policy is complemented by an
Internal Code of Conduct which complements the policy and guidelines in conjunction with other established guidelines to prevent and avoid
conflicts of interest with respect to recommendations issued by analysts among which is the separation of areas. Corporate Policy is available
at: www.bbva.com / Corporate Governance / Conduct in Securities Markets”.
Mexico Real Estate Outlook / 1st Half 2018 41
This report has been produced by the real estate área of the unit of Mexico
Chief Economist Carlos Serrano [email protected]
Samuel Vázquez [email protected]
Fernando Balbuena [email protected]
BBVA Research
Group Chief Economist Jorge Sicilia Serrano
Macroeconomic Analysis Rafael Doménech [email protected]
Global Macroeconomic Scenarios Miguel Jiménez [email protected]
Global Financial Markets Sonsoles Castillo [email protected]
Long Term Global Modelling and Analysis Julián Cubero [email protected]
Innovation and Processes Oscar de las Peñas [email protected]
Financial Systems and Regulation Santiago Fernández de Lis [email protected]
Countries Coordination Olga Cerqueira [email protected]
Digital Regulation Álvaro Martín [email protected]
Regulation
María Abascal [email protected]
Financial Systems
Ana Rubio [email protected]
Spain and Portugal Miguel Cardoso [email protected]
United States Nathaniel Karp [email protected]
Mexico
Carlos Serrano [email protected]
Middle East, Asia and Geopolitical Álvaro Ortiz [email protected]
Turkey Álvaro Ortiz [email protected]
Asia Le Xia [email protected]
South America Juan Manuel Ruiz [email protected]
Argentina Gloria Sorensen [email protected]
Chile Jorge Selaive [email protected]
Colombia
Juana Téllez [email protected]
Peru
Hugo Perea [email protected]
Venezuela Julio Pineda [email protected]
CONTACT DETAILS: BBVA Research – BBVA Bancomer: Paseo de la Reforma 510, Colonia Juárez, C.P. 06600 México D.F., México
e-mail: [email protected] - [email protected] www.bbvaresearch.com