Embed Size (px)
Citation preview
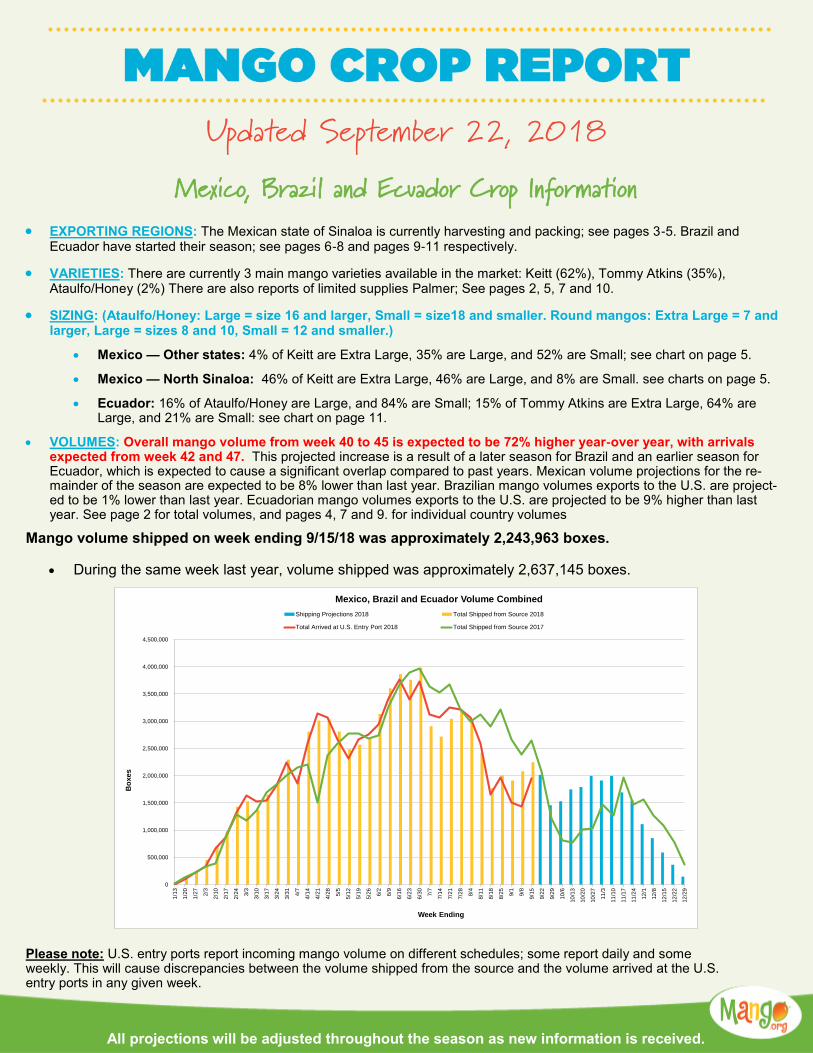
Updated September 22, 2018 Mexico, Brazil and Ecuador Crop Information
• EXPORTING REGIONS: The Mexican state of Sinaloa is currently harvesting and packing; see pages 3-5. Brazil and Ecuador have started their season; see pages 6-8 and pages 9-11 respectively.
• VARIETIES: There are currently 3 main mango varieties available in the market: Keitt (62%), Tommy Atkins (35%), Ataulfo/Honey (2%) There are also reports of limited supplies Palmer; See pages 2, 5, 7 and 10.
• SIZING: (Ataulfo/Honey: Large = size 16 and larger, Small = size18 and smaller. Round mangos: Extra Large = 7 and larger, Large = sizes 8 and 10, Small = 12 and smaller.)
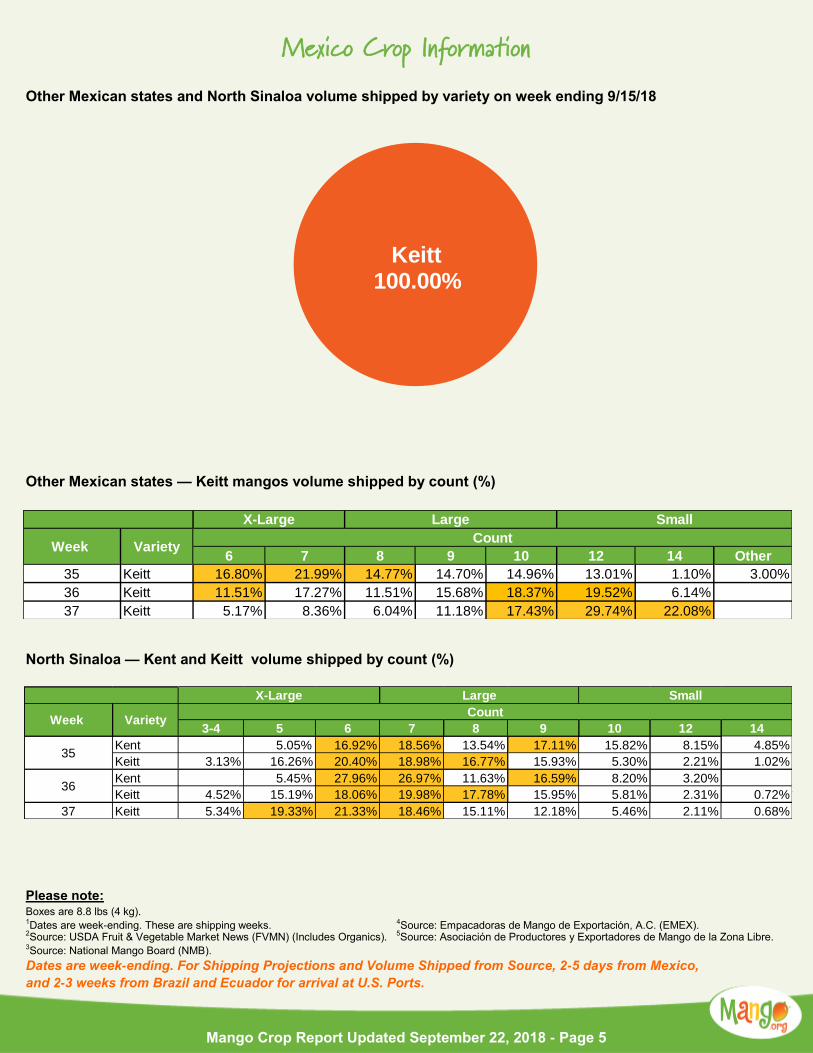
• Mexico — Other states: 4% of Keitt are Extra Large, 35% are Large, and 52% are Small; see chart on page 5.
• Mexico — North Sinaloa: 46% of Keitt are Extra Large, 46% are Large, and 8% are Small. see charts on page 5.
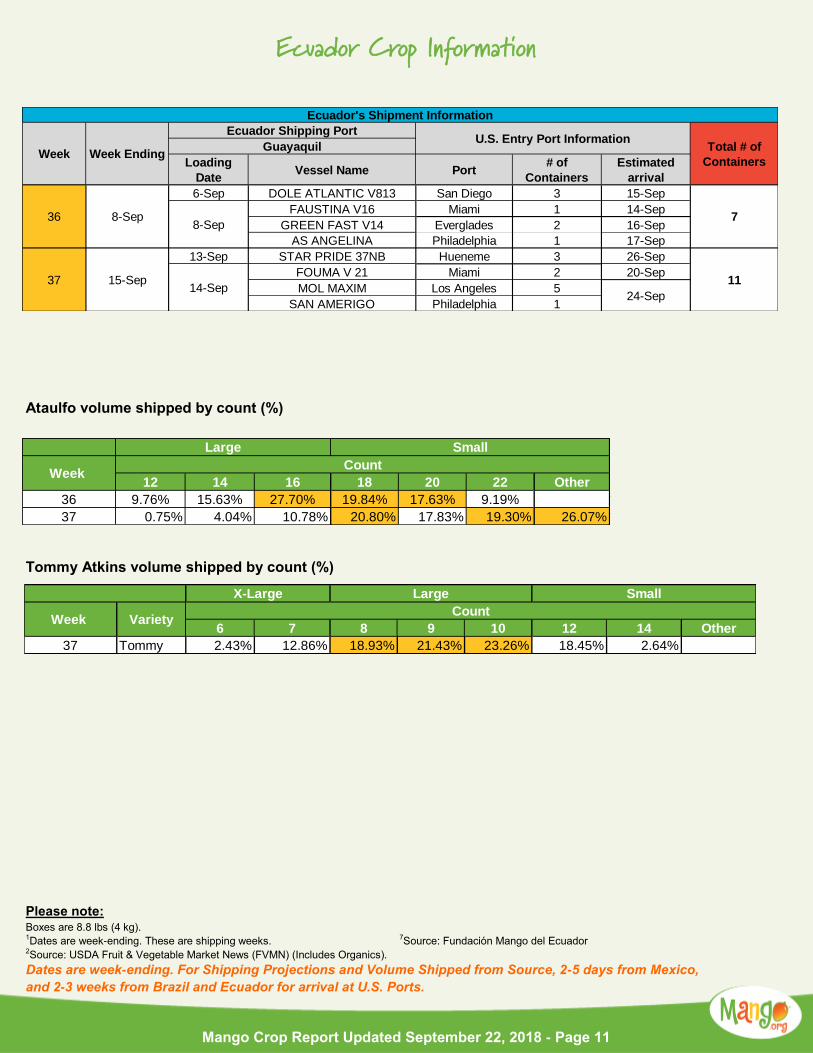
• Ecuador: 16% of Ataulfo/Honey are Large, and 84% are Small; 15% of Tommy Atkins are Extra Large, 64% are Large, and 21% are Small: see chart on page 11.
• VOLUMES: Overall mango volume from week 40 to 45 is expected to be 72% higher year-over year, with arrivals expected from week 42 and 47. This projected increase is a result of a later season for Brazil and an earlier season for Ecuador, which is expected to cause a significant overlap compared to past years. Mexican volume projections for the re-mainder of the season are expected to be 8% lower than last year. Brazilian mango volumes exports to the U.S. are project-ed to be 1% lower than last year. Ecuadorian mango volumes exports to the U.S. are projected to be 9% higher than last year. See page 2 for total volumes, and pages 4, 7 and 9. for individual country volumes
Mango volume shipped on week ending 9/15/18 was approximately 2,243,963 boxes.
• During the same week last year, volume shipped was approximately 2,637,145 boxes.
Please note: U.S. entry ports report incoming mango volume on different schedules; some report daily and some weekly. This will cause discrepancies between the volume shipped from the source and the volume arrived at the U.S. entry ports in any given week.
All projections will be adjusted throughout the season as new information is received.
0
500,000
1,000,000
1,500,000
2,000,000
2,500,000
3,000,000
3,500,000
4,000,000
4,500,000
1/1
3
1/2
0
1/2
7
2/3
2/1
0
2/1
7
2/2
4
3/3
3/1
0
3/1
7
3/2
4
3/3
1
4/7
4/1
4
4/2
1
4/2
8
5/5
5/1
2
5/1
9
5/2
6
6/2
6/9
6/1
6
6/2
3
6/3
0
7/7
7/1
4
7/2
1
7/2
8
8/4
8/1
1
8/1
8
8/2
5
9/1
9/8
9/1
5
9/2
2
9/2
9
10
/6
10
/13
10
/20
10
/27
11
/3
11
/10
11
/17
11
/24
12
/1
12
/8
12
/15
12
/22
12
/29
Bo
xes
Week Ending
Mexico, Brazil and Ecuador Volume Combined
Shipping Projections 2018 Total Shipped from Source 2018
Total Arrived at U.S. Entry Port 2018 Total Shipped from Source 2017
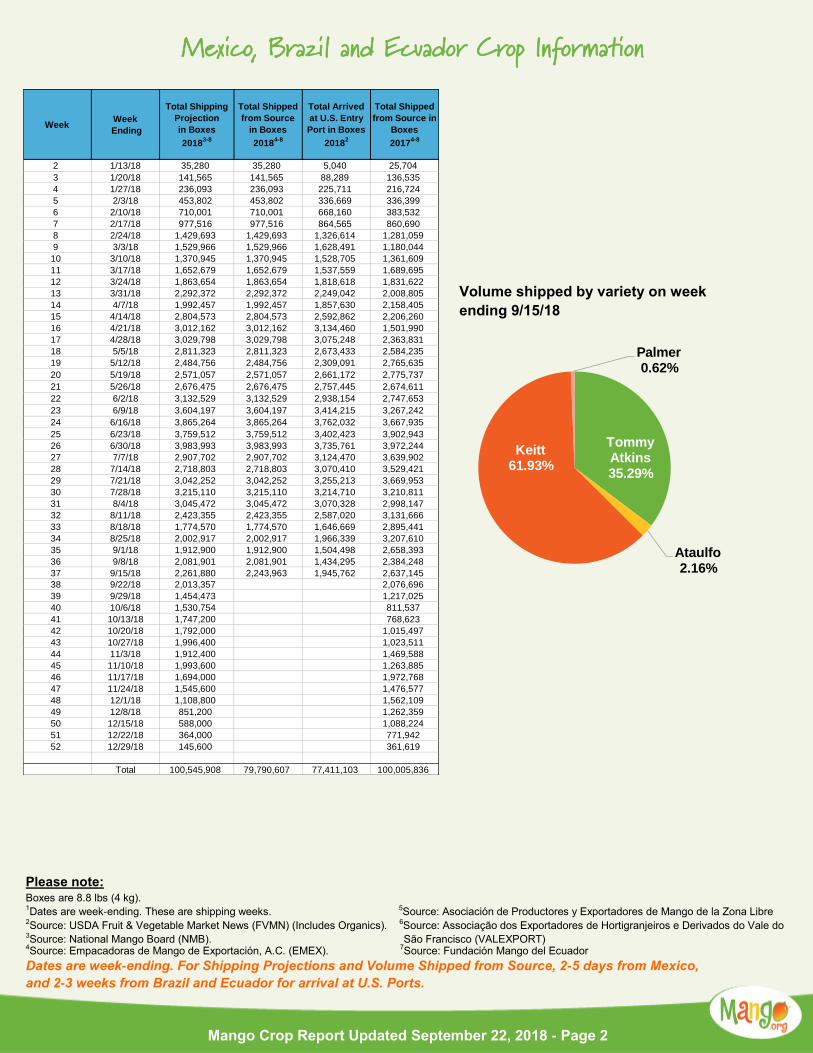
Mexico, Brazil and Ecuador Crop Information
Volume shipped by variety on week
ending 9/15/18
Please note: Boxes are 8.8 lbs (4 kg). 1Dates are week-ending. These are shipping weeks. 5Source: Asociación de Productores y Exportadores de Mango de la Zona Libre 2Source: USDA Fruit & Vegetable Market News (FVMN) (Includes Organics). 6Source: Associação dos Exportadores de Hortigranjeiros e Derivados do Vale do 3Source: National Mango Board (NMB). São Francisco (VALEXPORT) 4Source: Empacadoras de Mango de Exportación, A.C. (EMEX). 7Source: Fundación Mango del Ecuador
Dates are week-ending. For Shipping Projections and Volume Shipped from Source, 2-5 days from Mexico,
and 2-3 weeks from Brazil and Ecuador for arrival at U.S. Ports.
Mango Crop Report Updated September 22, 2018 - Page 2
Tommy Atkins35.29%
Ataulfo 2.16%
Keitt61.93%
Palmer0.62%
WeekWeek
Ending
Total Shipping
Projection
in Boxes
20183-8
Total Shipped
from Source
in Boxes
20184-8
Total Arrived
at U.S. Entry
Port in Boxes
20182
Total Shipped
from Source in
Boxes
20174-8
2 1/13/18 35,280 35,280 5,040 25,704
3 1/20/18 141,565 141,565 88,289 136,535
4 1/27/18 236,093 236,093 225,711 216,724
5 2/3/18 453,802 453,802 336,669 336,399
6 2/10/18 710,001 710,001 668,160 383,532
7 2/17/18 977,516 977,516 864,565 860,690
8 2/24/18 1,429,693 1,429,693 1,326,614 1,281,059
9 3/3/18 1,529,966 1,529,966 1,628,491 1,180,044
10 3/10/18 1,370,945 1,370,945 1,528,705 1,361,609
11 3/17/18 1,652,679 1,652,679 1,537,559 1,689,695
12 3/24/18 1,863,654 1,863,654 1,818,618 1,831,622
13 3/31/18 2,292,372 2,292,372 2,249,042 2,008,805
14 4/7/18 1,992,457 1,992,457 1,857,630 2,158,405
15 4/14/18 2,804,573 2,804,573 2,592,862 2,206,260
16 4/21/18 3,012,162 3,012,162 3,134,460 1,501,990
17 4/28/18 3,029,798 3,029,798 3,075,248 2,363,831
18 5/5/18 2,811,323 2,811,323 2,673,433 2,584,235
19 5/12/18 2,484,756 2,484,756 2,309,091 2,765,635
20 5/19/18 2,571,057 2,571,057 2,661,172 2,775,737
21 5/26/18 2,676,475 2,676,475 2,757,445 2,674,611
22 6/2/18 3,132,529 3,132,529 2,938,154 2,747,653
23 6/9/18 3,604,197 3,604,197 3,414,215 3,267,242
24 6/16/18 3,865,264 3,865,264 3,762,032 3,667,935
25 6/23/18 3,759,512 3,759,512 3,402,423 3,902,943
26 6/30/18 3,983,993 3,983,993 3,735,761 3,972,244
27 7/7/18 2,907,702 2,907,702 3,124,470 3,639,902
28 7/14/18 2,718,803 2,718,803 3,070,410 3,529,421
29 7/21/18 3,042,252 3,042,252 3,255,213 3,669,953
30 7/28/18 3,215,110 3,215,110 3,214,710 3,210,811
31 8/4/18 3,045,472 3,045,472 3,070,328 2,998,147
32 8/11/18 2,423,355 2,423,355 2,587,020 3,131,666
33 8/18/18 1,774,570 1,774,570 1,646,669 2,895,441
34 8/25/18 2,002,917 2,002,917 1,966,339 3,207,610
35 9/1/18 1,912,900 1,912,900 1,504,498 2,658,393
36 9/8/18 2,081,901 2,081,901 1,434,295 2,384,248
37 9/15/18 2,261,880 2,243,963 1,945,762 2,637,145
38 9/22/18 2,013,357 2,076,696
39 9/29/18 1,454,473 1,217,025
40 10/6/18 1,530,754 811,537
41 10/13/18 1,747,200 768,623
42 10/20/18 1,792,000 1,015,497
43 10/27/18 1,996,400 1,023,511
44 11/3/18 1,912,400 1,469,588
45 11/10/18 1,993,600 1,263,885
46 11/17/18 1,694,000 1,972,768
47 11/24/18 1,545,600 1,476,577
48 12/1/18 1,108,800 1,562,109
49 12/8/18 851,200 1,262,359
50 12/15/18 588,000 1,088,224
51 12/22/18 364,000 771,942
52 12/29/18 145,600 361,619
Total 100,545,908 79,790,607 77,411,103 100,005,836
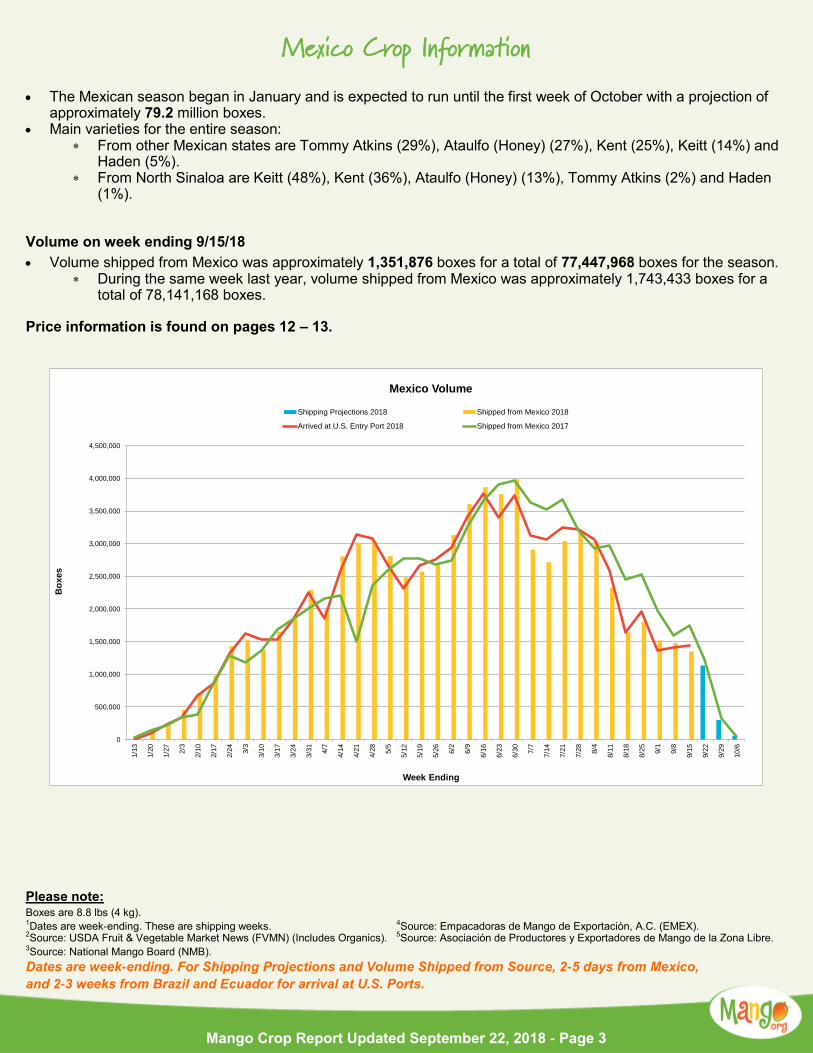
Mexico Crop Information
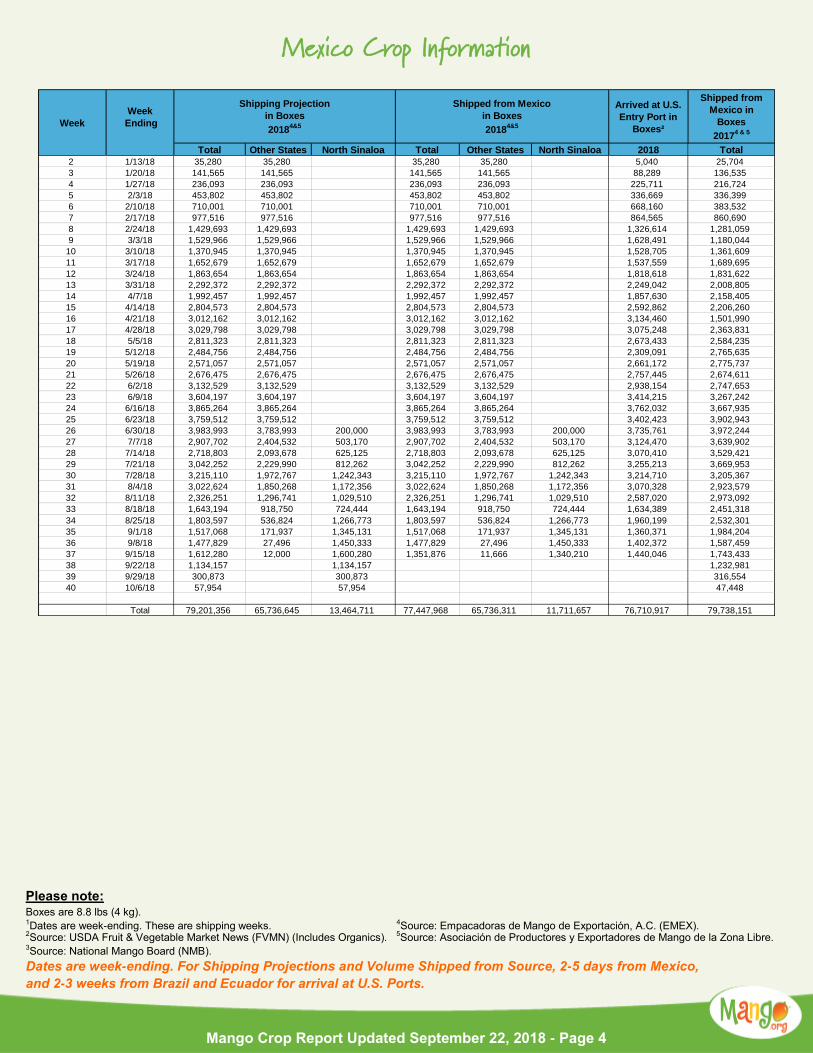
• The Mexican season began in January and is expected to run until the first week of October with a projection of approximately 79.2 million boxes.
• Main varieties for the entire season: From other Mexican states are Tommy Atkins (29%), Ataulfo (Honey) (27%), Kent (25%), Keitt (14%) and
Haden (5%). From North Sinaloa are Keitt (48%), Kent (36%), Ataulfo (Honey) (13%), Tommy Atkins (2%) and Haden
(1%).
Volume on week ending 9/15/18
• Volume shipped from Mexico was approximately 1,351,876 boxes for a total of 77,447,968 boxes for the season. During the same week last year, volume shipped from Mexico was approximately 1,743,433 boxes for a
total of 78,141,168 boxes. Price information is found on pages 12 – 13.
Please note: Boxes are 8.8 lbs (4 kg). 1Dates are week-ending. These are shipping weeks. 4Source: Empacadoras de Mango de Exportación, A.C. (EMEX). 2Source: USDA Fruit & Vegetable Market News (FVMN) (Includes Organics). 5Source: Asociación de Productores y Exportadores de Mango de la Zona Libre. 3Source: National Mango Board (NMB).
Dates are week-ending. For Shipping Projections and Volume Shipped from Source, 2-5 days from Mexico,
and 2-3 weeks from Brazil and Ecuador for arrival at U.S. Ports.
Mango Crop Report Updated September 22, 2018 - Page 3
0
500,000
1,000,000
1,500,000
2,000,000
2,500,000
3,000,000
3,500,000
4,000,000
4,500,000
1/1
3
1/2
0
1/2
7
2/3
2/1
0
2/1
7
2/2
4
3/3
3/1
0
3/1
7
3/2
4
3/3
1
4/7
4/1
4
4/2
1
4/2
8
5/5
5/1
2
5/1
9
5/2
6
6/2
6/9
6/1
6
6/2
3
6/3
0
7/7
7/1
4
7/2
1
7/2
8
8/4
8/1
1
8/1
8
8/2
5
9/1
9/8
9/1
5
9/2
2
9/2
9
10
/6
Bo
xes
Week Ending
Mexico Volume
Shipping Projections 2018 Shipped from Mexico 2018
Arrived at U.S. Entry Port 2018 Shipped from Mexico 2017
Mexico Crop Information
Please note: Boxes are 8.8 lbs (4 kg). 1Dates are week-ending. These are shipping weeks. 4Source: Empacadoras de Mango de Exportación, A.C. (EMEX). 2Source: USDA Fruit & Vegetable Market News (FVMN) (Includes Organics). 5Source: Asociación de Productores y Exportadores de Mango de la Zona Libre. 3Source: National Mango Board (NMB).
Dates are week-ending. For Shipping Projections and Volume Shipped from Source, 2-5 days from Mexico,
and 2-3 weeks from Brazil and Ecuador for arrival at U.S. Ports.
Mango Crop Report Updated September 22, 2018 - Page 4
Arrived at U.S.
Entry Port in
Boxes²
Shipped from
Mexico in
Boxes
20174 & 5
Total Other States North Sinaloa Total Other States North Sinaloa 2018 Total
2 1/13/18 35,280 35,280 35,280 35,280 5,040 25,704
3 1/20/18 141,565 141,565 141,565 141,565 88,289 136,535
4 1/27/18 236,093 236,093 236,093 236,093 225,711 216,724
5 2/3/18 453,802 453,802 453,802 453,802 336,669 336,399
6 2/10/18 710,001 710,001 710,001 710,001 668,160 383,532
7 2/17/18 977,516 977,516 977,516 977,516 864,565 860,690
8 2/24/18 1,429,693 1,429,693 1,429,693 1,429,693 1,326,614 1,281,059
9 3/3/18 1,529,966 1,529,966 1,529,966 1,529,966 1,628,491 1,180,044
10 3/10/18 1,370,945 1,370,945 1,370,945 1,370,945 1,528,705 1,361,609
11 3/17/18 1,652,679 1,652,679 1,652,679 1,652,679 1,537,559 1,689,695
12 3/24/18 1,863,654 1,863,654 1,863,654 1,863,654 1,818,618 1,831,622
13 3/31/18 2,292,372 2,292,372 2,292,372 2,292,372 2,249,042 2,008,805
14 4/7/18 1,992,457 1,992,457 1,992,457 1,992,457 1,857,630 2,158,405
15 4/14/18 2,804,573 2,804,573 2,804,573 2,804,573 2,592,862 2,206,260
16 4/21/18 3,012,162 3,012,162 3,012,162 3,012,162 3,134,460 1,501,990
17 4/28/18 3,029,798 3,029,798 3,029,798 3,029,798 3,075,248 2,363,831
18 5/5/18 2,811,323 2,811,323 2,811,323 2,811,323 2,673,433 2,584,235
19 5/12/18 2,484,756 2,484,756 2,484,756 2,484,756 2,309,091 2,765,635
20 5/19/18 2,571,057 2,571,057 2,571,057 2,571,057 2,661,172 2,775,737
21 5/26/18 2,676,475 2,676,475 2,676,475 2,676,475 2,757,445 2,674,611
22 6/2/18 3,132,529 3,132,529 3,132,529 3,132,529 2,938,154 2,747,653
23 6/9/18 3,604,197 3,604,197 3,604,197 3,604,197 3,414,215 3,267,242
24 6/16/18 3,865,264 3,865,264 3,865,264 3,865,264 3,762,032 3,667,935
25 6/23/18 3,759,512 3,759,512 3,759,512 3,759,512 3,402,423 3,902,943
26 6/30/18 3,983,993 3,783,993 200,000 3,983,993 3,783,993 200,000 3,735,761 3,972,244
27 7/7/18 2,907,702 2,404,532 503,170 2,907,702 2,404,532 503,170 3,124,470 3,639,902
28 7/14/18 2,718,803 2,093,678 625,125 2,718,803 2,093,678 625,125 3,070,410 3,529,421
29 7/21/18 3,042,252 2,229,990 812,262 3,042,252 2,229,990 812,262 3,255,213 3,669,953
30 7/28/18 3,215,110 1,972,767 1,242,343 3,215,110 1,972,767 1,242,343 3,214,710 3,205,367
31 8/4/18 3,022,624 1,850,268 1,172,356 3,022,624 1,850,268 1,172,356 3,070,328 2,923,579
32 8/11/18 2,326,251 1,296,741 1,029,510 2,326,251 1,296,741 1,029,510 2,587,020 2,973,092
33 8/18/18 1,643,194 918,750 724,444 1,643,194 918,750 724,444 1,634,389 2,451,318
34 8/25/18 1,803,597 536,824 1,266,773 1,803,597 536,824 1,266,773 1,960,199 2,532,301
35 9/1/18 1,517,068 171,937 1,345,131 1,517,068 171,937 1,345,131 1,360,371 1,984,204
36 9/8/18 1,477,829 27,496 1,450,333 1,477,829 27,496 1,450,333 1,402,372 1,587,459
37 9/15/18 1,612,280 12,000 1,600,280 1,351,876 11,666 1,340,210 1,440,046 1,743,433
38 9/22/18 1,134,157 1,134,157 1,232,981
39 9/29/18 300,873 300,873 316,554
40 10/6/18 57,954 57,954 47,448
Total 79,201,356 65,736,645 13,464,711 77,447,968 65,736,311 11,711,657 76,710,917 79,738,151
Week
Week
Ending
Shipping Projection
in Boxes
20184&5
Shipped from Mexico
in Boxes
20184&5
Mexico Crop Information
Other Mexican states and North Sinaloa volume shipped by variety on week ending 9/15/18
Other Mexican states — Keitt mangos volume shipped by count (%)
North Sinaloa — Kent and Keitt volume shipped by count (%)
Please note: Boxes are 8.8 lbs (4 kg). 1Dates are week-ending. These are shipping weeks. 4Source: Empacadoras de Mango de Exportación, A.C. (EMEX). 2Source: USDA Fruit & Vegetable Market News (FVMN) (Includes Organics). 5Source: Asociación de Productores y Exportadores de Mango de la Zona Libre. 3Source: National Mango Board (NMB).
Dates are week-ending. For Shipping Projections and Volume Shipped from Source, 2-5 days from Mexico,
and 2-3 weeks from Brazil and Ecuador for arrival at U.S. Ports.
Mango Crop Report Updated September 22, 2018 - Page 5
Keitt100.00%
6 7 8 9 10 12 14 Other
35 Keitt 16.80% 21.99% 14.77% 14.70% 14.96% 13.01% 1.10% 3.00%
36 Keitt 11.51% 17.27% 11.51% 15.68% 18.37% 19.52% 6.14%
37 Keitt 5.17% 8.36% 6.04% 11.18% 17.43% 29.74% 22.08%
X-Large
VarietyCount
Large Small
Week
3-4 5 6 7 8 9 10 12 14
Kent 5.05% 16.92% 18.56% 13.54% 17.11% 15.82% 8.15% 4.85%
Keitt 3.13% 16.26% 20.40% 18.98% 16.77% 15.93% 5.30% 2.21% 1.02%
Kent 5.45% 27.96% 26.97% 11.63% 16.59% 8.20% 3.20%
Keitt 4.52% 15.19% 18.06% 19.98% 17.78% 15.95% 5.81% 2.31% 0.72%
37 Keitt 5.34% 19.33% 21.33% 18.46% 15.11% 12.18% 5.46% 2.11% 0.68%
36
35
Week Variety
X-Large Large Small
Count
Brazil Crop Information
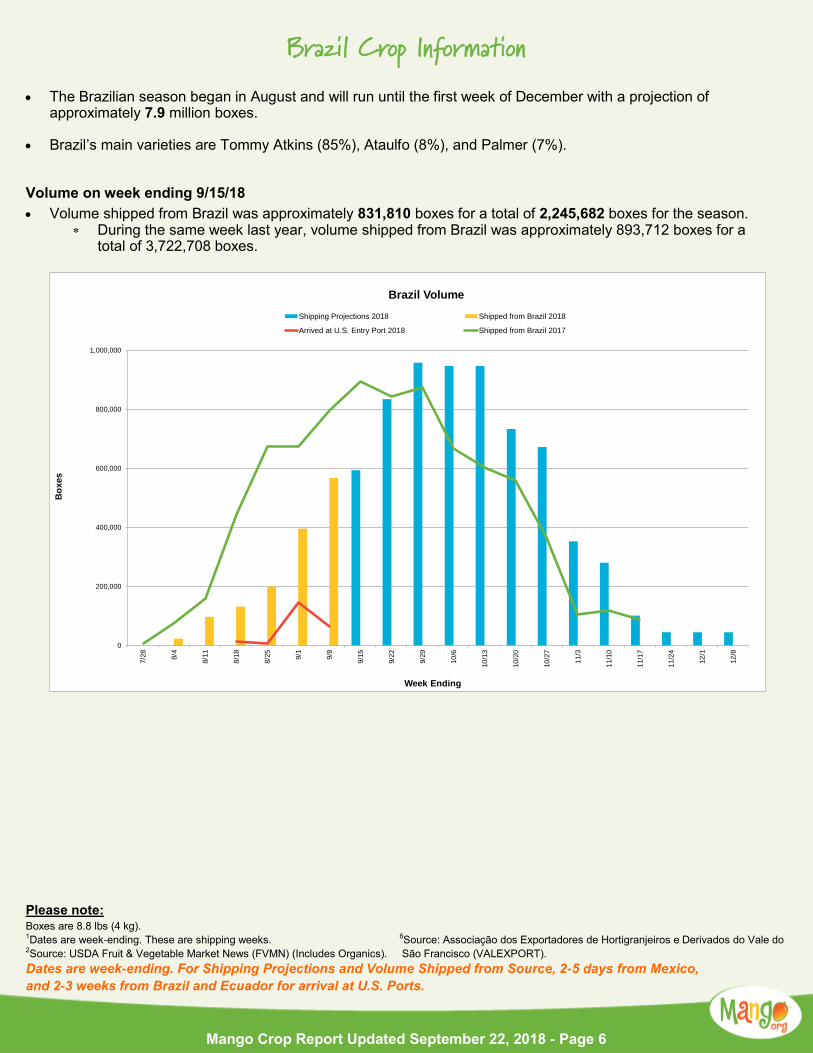
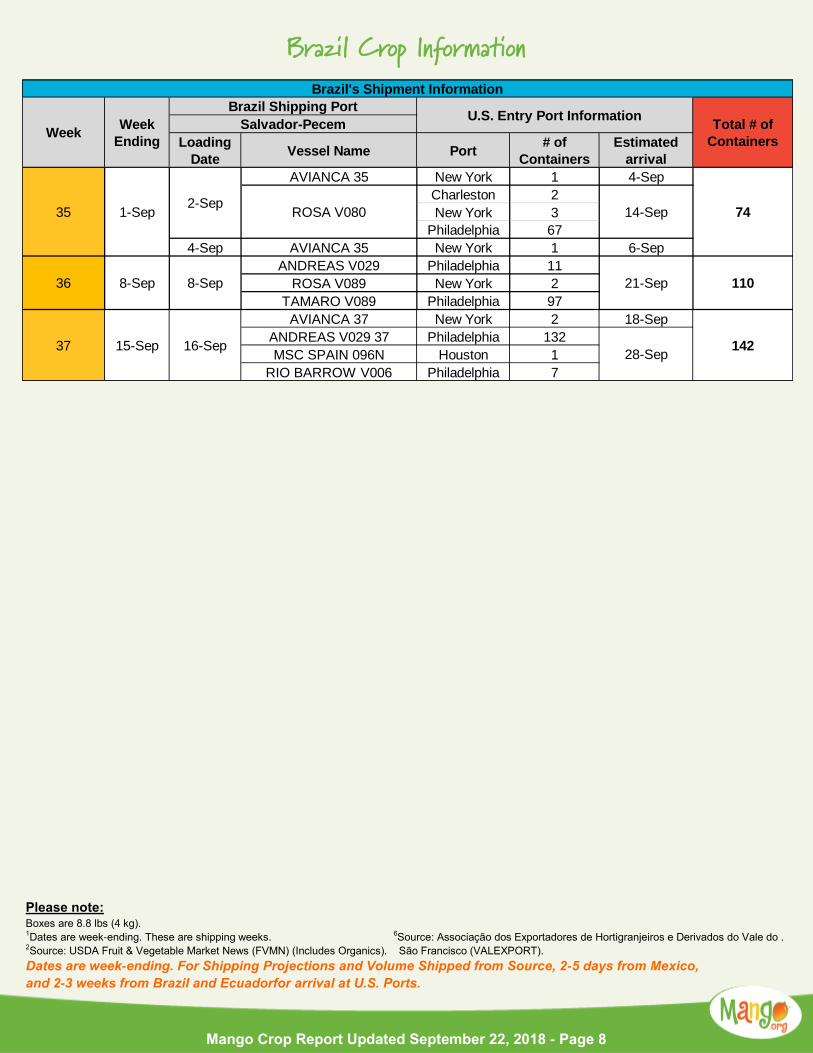
• The Brazilian season began in August and will run until the first week of December with a projection of approximately 7.9 million boxes.
• Brazil’s main varieties are Tommy Atkins (85%), Ataulfo (8%), and Palmer (7%). Volume on week ending 9/15/18
• Volume shipped from Brazil was approximately 831,810 boxes for a total of 2,245,682 boxes for the season. During the same week last year, volume shipped from Brazil was approximately 893,712 boxes for a
total of 3,722,708 boxes.
Please note: Boxes are 8.8 lbs (4 kg). 1Dates are week-ending. These are shipping weeks. 6Source: Associação dos Exportadores de Hortigranjeiros e Derivados do Vale do 2Source: USDA Fruit & Vegetable Market News (FVMN) (Includes Organics). São Francisco (VALEXPORT).
Dates are week-ending. For Shipping Projections and Volume Shipped from Source, 2-5 days from Mexico,
and 2-3 weeks from Brazil and Ecuador for arrival at U.S. Ports.
Mango Crop Report Updated September 22, 2018 - Page 6
0
200,000
400,000
600,000
800,000
1,000,000
7/2
8
8/4
8/1
1
8/1
8
8/2
5
9/1
9/8
9/1
5
9/2
2
9/2
9
10
/6
10
/13
10
/20
10
/27
11
/3
11
/10
11
/17
11
/24
12
/1
12
/8
Bo
xes
Week Ending
Brazil Volume
Shipping Projections 2018 Shipped from Brazil 2018
Arrived at U.S. Entry Port 2018 Shipped from Brazil 2017
Brazil Crop Information
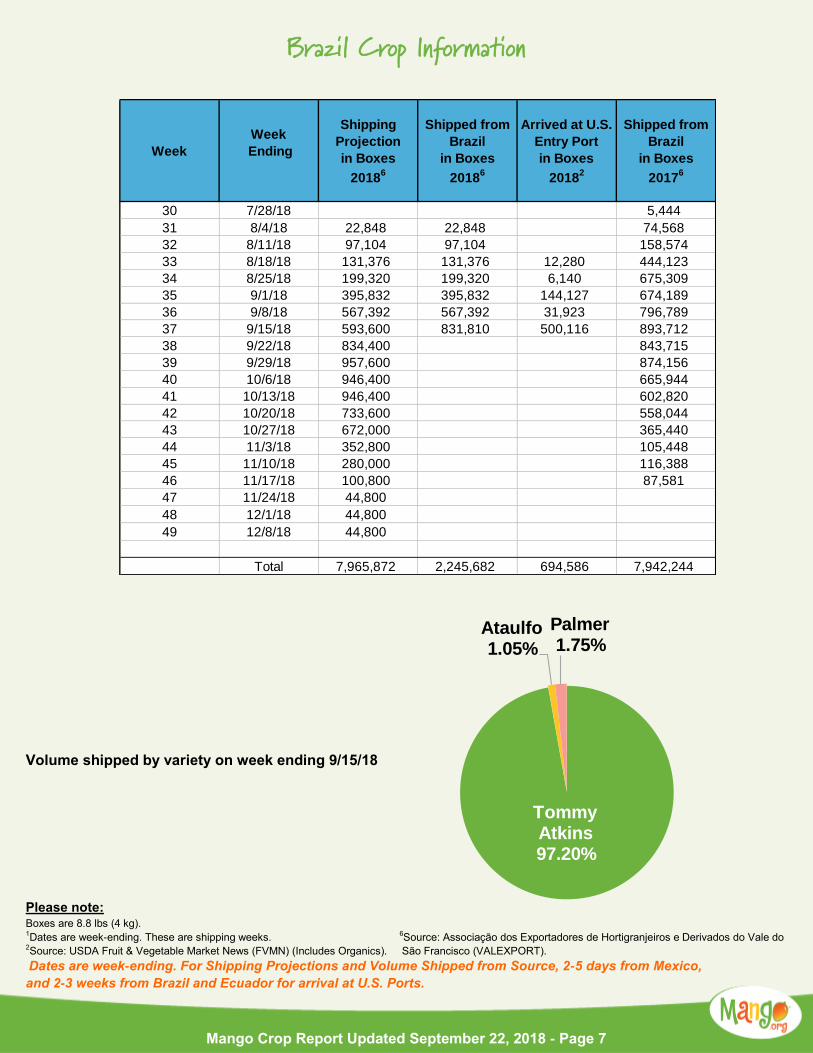
Volume shipped by variety on week ending 9/15/18
Please note: Boxes are 8.8 lbs (4 kg). 1Dates are week-ending. These are shipping weeks. 6Source: Associação dos Exportadores de Hortigranjeiros e Derivados do Vale do 2Source: USDA Fruit & Vegetable Market News (FVMN) (Includes Organics). São Francisco (VALEXPORT).
Dates are week-ending. For Shipping Projections and Volume Shipped from Source, 2-5 days from Mexico,
and 2-3 weeks from Brazil and Ecuador for arrival at U.S. Ports.
Mango Crop Report Updated September 22, 2018 - Page 7
Tommy Atkins97.20%
Ataulfo1.05%
Palmer1.75%
Week
Week
Ending
Shipping
Projection
in Boxes
20186
Shipped from
Brazil
in Boxes
20186
Arrived at U.S.
Entry Port
in Boxes
20182
Shipped from
Brazil
in Boxes
20176
30 7/28/18 5,444
31 8/4/18 22,848 22,848 74,568
32 8/11/18 97,104 97,104 158,574
33 8/18/18 131,376 131,376 12,280 444,123
34 8/25/18 199,320 199,320 6,140 675,309
35 9/1/18 395,832 395,832 144,127 674,189
36 9/8/18 567,392 567,392 31,923 796,789
37 9/15/18 593,600 831,810 500,116 893,712
38 9/22/18 834,400 843,715
39 9/29/18 957,600 874,156
40 10/6/18 946,400 665,944
41 10/13/18 946,400 602,820
42 10/20/18 733,600 558,044
43 10/27/18 672,000 365,440
44 11/3/18 352,800 105,448
45 11/10/18 280,000 116,388
46 11/17/18 100,800 87,581
47 11/24/18 44,800
48 12/1/18 44,800
49 12/8/18 44,800
Total 7,965,872 2,245,682 694,586 7,942,244
Brazil Crop Information
Please note: Boxes are 8.8 lbs (4 kg). 1Dates are week-ending. These are shipping weeks. 6Source: Associação dos Exportadores de Hortigranjeiros e Derivados do Vale do . 2Source: USDA Fruit & Vegetable Market News (FVMN) (Includes Organics). São Francisco (VALEXPORT).
Dates are week-ending. For Shipping Projections and Volume Shipped from Source, 2-5 days from Mexico,
and 2-3 weeks from Brazil and Ecuadorfor arrival at U.S. Ports.
Mango Crop Report Updated September 22, 2018 - Page 8
Loading
DateVessel Name Port
# of
Containers
Estimated
arrival
AVIANCA 35 New York 1 4-Sep
Charleston 2
New York 3
Philadelphia 67
4-Sep AVIANCA 35 New York 1 6-Sep
ANDREAS V029 Philadelphia 11
ROSA V089 New York 2
TAMARO V089 Philadelphia 97
AVIANCA 37 New York 2 18-Sep
ANDREAS V029 37 Philadelphia 132
MSC SPAIN 096N Houston 1
RIO BARROW V006 Philadelphia 7
28-Sep37 15-Sep 16-Sep 142
11036 8-Sep 8-Sep 21-Sep
7414-Sep35 1-Sep2-Sep
ROSA V080
Brazil's Shipment Information
WeekWeek
Ending
Brazil Shipping PortU.S. Entry Port Information
Total # of
Containers
Salvador-Pecem
Ecuador Crop Information
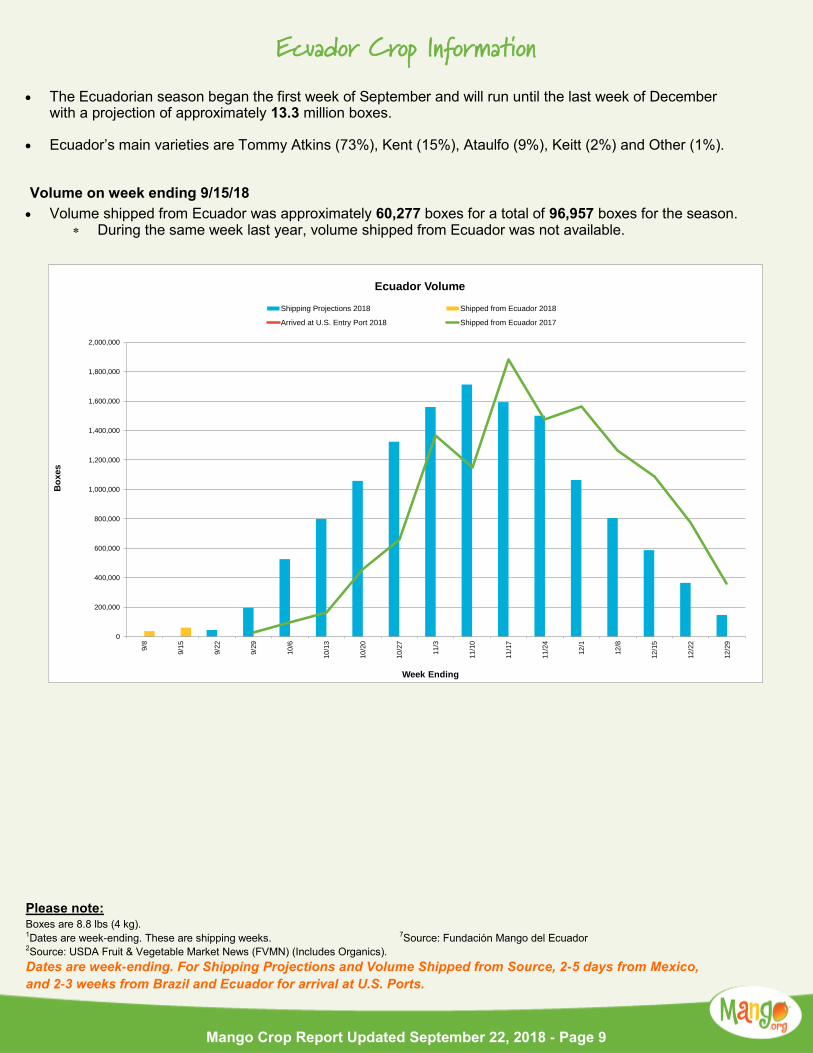
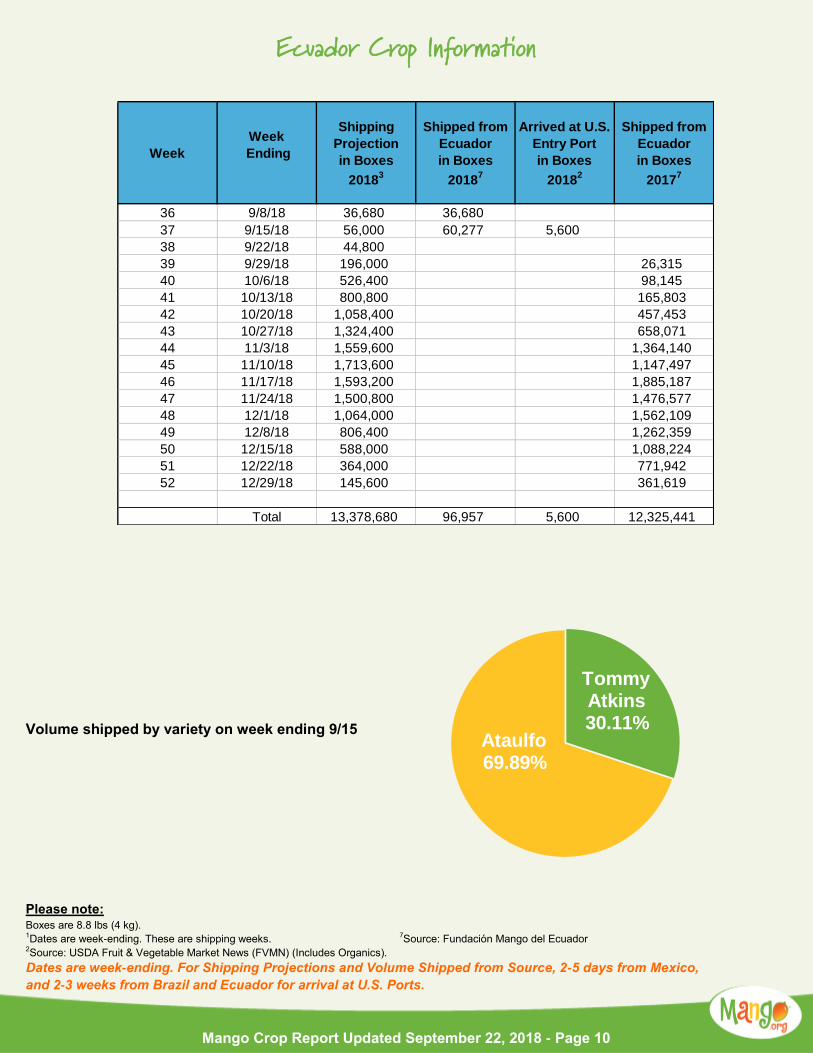
• The Ecuadorian season began the first week of September and will run until the last week of December with a projection of approximately 13.3 million boxes.
• Ecuador’s main varieties are Tommy Atkins (73%), Kent (15%), Ataulfo (9%), Keitt (2%) and Other (1%). Volume on week ending 9/15/18
• Volume shipped from Ecuador was approximately 60,277 boxes for a total of 96,957 boxes for the season. During the same week last year, volume shipped from Ecuador was not available.
Please note: Boxes are 8.8 lbs (4 kg). 1Dates are week-ending. These are shipping weeks. 7Source: Fundación Mango del Ecuador 2Source: USDA Fruit & Vegetable Market News (FVMN) (Includes Organics).
Dates are week-ending. For Shipping Projections and Volume Shipped from Source, 2-5 days from Mexico,
and 2-3 weeks from Brazil and Ecuador for arrival at U.S. Ports.
Mango Crop Report Updated September 22, 2018 - Page 9
0
200,000
400,000
600,000
800,000
1,000,000
1,200,000
1,400,000
1,600,000
1,800,000
2,000,000
9/8
9/1
5
9/2
2
9/2
9
10
/6
10
/13
10
/20
10
/27
11
/3
11
/10
11
/17
11
/24
12
/1
12
/8
12
/15
12
/22
12
/29
Bo
xes
Week Ending
Ecuador Volume
Shipping Projections 2018 Shipped from Ecuador 2018
Arrived at U.S. Entry Port 2018 Shipped from Ecuador 2017
Ecuador Crop Information
Volume shipped by variety on week ending 9/15
Please note: Boxes are 8.8 lbs (4 kg). 1Dates are week-ending. These are shipping weeks. 7Source: Fundación Mango del Ecuador 2Source: USDA Fruit & Vegetable Market News (FVMN) (Includes Organics).
Dates are week-ending. For Shipping Projections and Volume Shipped from Source, 2-5 days from Mexico,
and 2-3 weeks from Brazil and Ecuador for arrival at U.S. Ports.
Mango Crop Report Updated September 22, 2018 - Page 10
Tommy Atkins30.11%
Ataulfo69.89%
Week
Week
Ending
Shipping
Projection
in Boxes
20183
Shipped from
Ecuador
in Boxes
20187
Arrived at U.S.
Entry Port
in Boxes
20182
Shipped from
Ecuador
in Boxes
20177
36 9/8/18 36,680 36,680
37 9/15/18 56,000 60,277 5,600
38 9/22/18 44,800
39 9/29/18 196,000 26,315
40 10/6/18 526,400 98,145
41 10/13/18 800,800 165,803
42 10/20/18 1,058,400 457,453
43 10/27/18 1,324,400 658,071
44 11/3/18 1,559,600 1,364,140
45 11/10/18 1,713,600 1,147,497
46 11/17/18 1,593,200 1,885,187
47 11/24/18 1,500,800 1,476,577
48 12/1/18 1,064,000 1,562,109
49 12/8/18 806,400 1,262,359
50 12/15/18 588,000 1,088,224
51 12/22/18 364,000 771,942
52 12/29/18 145,600 361,619
Total 13,378,680 96,957 5,600 12,325,441
Ecuador Crop Information
Ataulfo volume shipped by count (%)
Tommy Atkins volume shipped by count (%)
Please note: Boxes are 8.8 lbs (4 kg). 1Dates are week-ending. These are shipping weeks. 7Source: Fundación Mango del Ecuador 2Source: USDA Fruit & Vegetable Market News (FVMN) (Includes Organics).
Dates are week-ending. For Shipping Projections and Volume Shipped from Source, 2-5 days from Mexico,
and 2-3 weeks from Brazil and Ecuador for arrival at U.S. Ports.
1
Mango Crop Report Updated September 22, 2018 - Page 11
Loading
DateVessel Name Port
# of
Containers
Estimated
arrival
6-Sep DOLE ATLANTIC V813 San Diego 3 15-Sep
FAUSTINA V16 Miami 1 14-Sep
GREEN FAST V14 Everglades 2 16-Sep
AS ANGELINA Philadelphia 1 17-Sep
13-Sep STAR PRIDE 37NB Hueneme 3 26-Sep
FOUMA V 21 Miami 2 20-Sep
MOL MAXIM Los Angeles 5
SAN AMERIGO Philadelphia 1
37 15-Sep 1114-Sep
24-Sep
36 8-Sep8-Sep
7
Total # of
Containers
GuayaquilWeek Week Ending
Ecuador Shipping Port
Ecuador's Shipment Information
U.S. Entry Port Information
6 7 8 9 10 12 14 Other
37 Tommy 2.43% 12.86% 18.93% 21.43% 23.26% 18.45% 2.64%
Week VarietyCount
X-Large Large Small
12 14 16 18 20 22 Other
36 9.76% 15.63% 27.70% 19.84% 17.63% 9.19%
37 0.75% 4.04% 10.78% 20.80% 17.83% 19.30% 26.07%
Large Small
Week Count
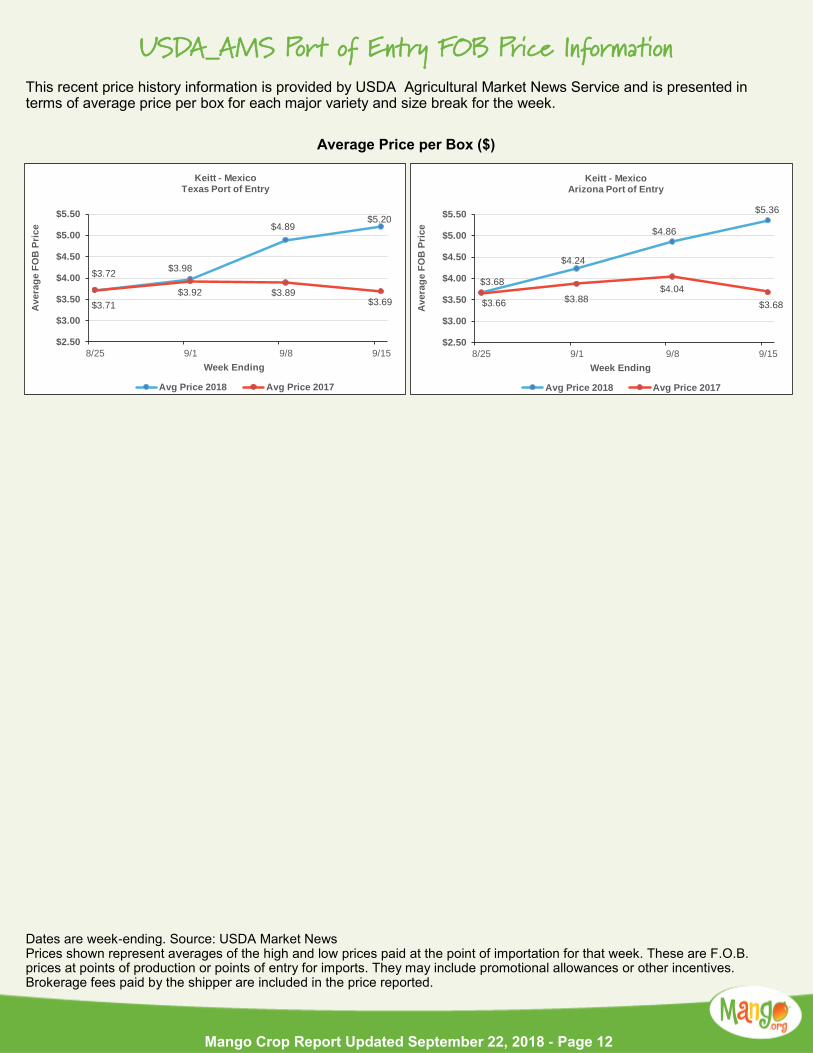
USDA_AMS Port of Entry FOB Price Information
This recent price history information is provided by USDA Agricultural Market News Service and is presented in terms of average price per box for each major variety and size break for the week.
Average Price per Box ($)
Dates are week-ending. Source: USDA Market News Prices shown represent averages of the high and low prices paid at the point of importation for that week. These are F.O.B. prices at points of production or points of entry for imports. They may include promotional allowances or other incentives. Brokerage fees paid by the shipper are included in the price reported.
Mango Crop Report Updated September 22, 2018 - Page 12
$3.72$3.98
$4.89$5.20
$3.71
$3.92 $3.89$3.69
$2.50
$3.00
$3.50
$4.00
$4.50
$5.00
$5.50
8/25 9/1 9/8 9/15
Av
era
ge
FO
B P
ric
e
Week Ending
Keitt - MexicoTexas Port of Entry
Avg Price 2018 Avg Price 2017
$3.68
$4.24
$4.86
$5.36
$3.66 $3.88$4.04
$3.68
$2.50
$3.00
$3.50
$4.00
$4.50
$5.00
$5.50
8/25 9/1 9/8 9/15
Avera
ge F
OB
Pri
ce
Week Ending
Keitt - MexicoArizona Port of Entry
Avg Price 2018 Avg Price 2017
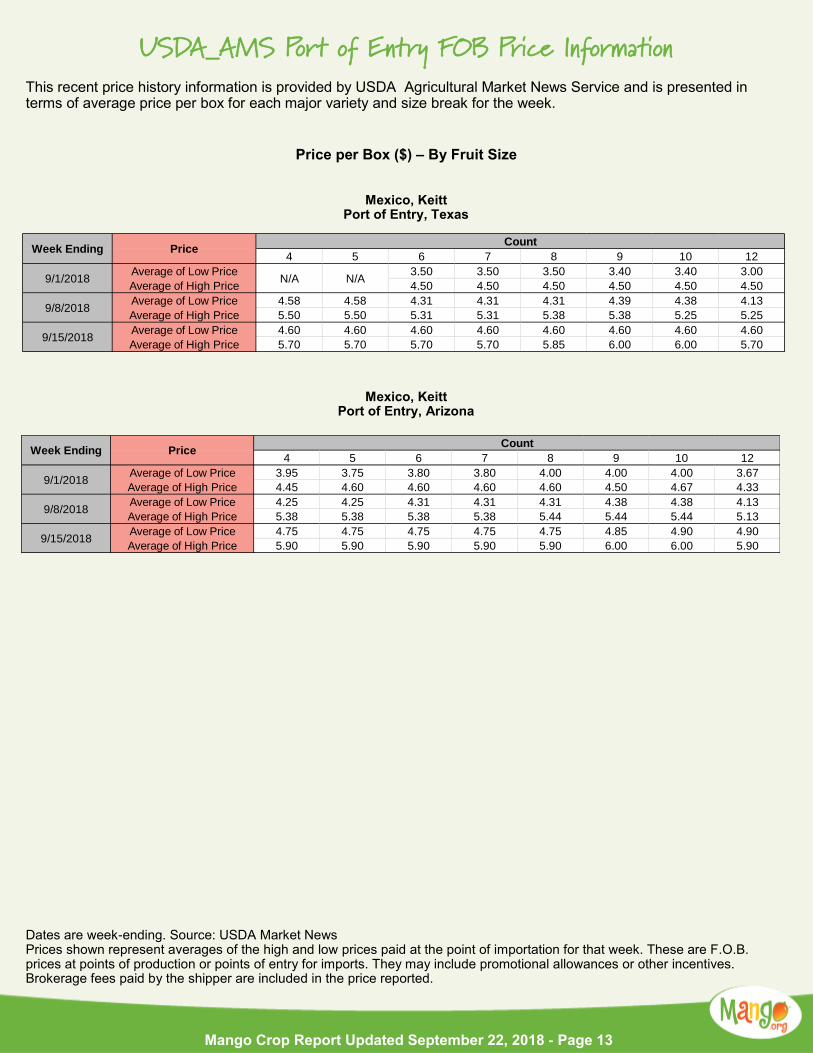
USDA_AMS Port of Entry FOB Price Information
This recent price history information is provided by USDA Agricultural Market News Service and is presented in terms of average price per box for each major variety and size break for the week.
Price per Box ($) – By Fruit Size
Mexico, Keitt Port of Entry, Texas
Mexico, Keitt
Port of Entry, Arizona
Dates are week-ending. Source: USDA Market News Prices shown represent averages of the high and low prices paid at the point of importation for that week. These are F.O.B. prices at points of production or points of entry for imports. They may include promotional allowances or other incentives. Brokerage fees paid by the shipper are included in the price reported.
Mango Crop Report Updated September 22, 2018 - Page 13
4 5 6 7 8 9 10 12
Average of Low Price 3.95 3.75 3.80 3.80 4.00 4.00 4.00 3.67
Average of High Price 4.45 4.60 4.60 4.60 4.60 4.50 4.67 4.33
Average of Low Price 4.25 4.25 4.31 4.31 4.31 4.38 4.38 4.13
Average of High Price 5.38 5.38 5.38 5.38 5.44 5.44 5.44 5.13
Average of Low Price 4.75 4.75 4.75 4.75 4.75 4.85 4.90 4.90
Average of High Price 5.90 5.90 5.90 5.90 5.90 6.00 6.00 5.90
CountWeek Ending Price
9/1/2018
9/8/2018
9/15/2018
4 5 6 7 8 9 10 12
Average of Low Price 3.50 3.50 3.50 3.40 3.40 3.00
Average of High Price 4.50 4.50 4.50 4.50 4.50 4.50
Average of Low Price 4.58 4.58 4.31 4.31 4.31 4.39 4.38 4.13
Average of High Price 5.50 5.50 5.31 5.31 5.38 5.38 5.25 5.25
Average of Low Price 4.60 4.60 4.60 4.60 4.60 4.60 4.60 4.60
Average of High Price 5.70 5.70 5.70 5.70 5.85 6.00 6.00 5.70
Count
N/A N/A
Week Ending Price
9/8/2018
9/15/2018
9/1/2018
Crop Report Tools and Resources The Mango Crop Report is updated weekly and can be found at mango.org/crop.
Note: the National Mango Board is working with organizations in the mango-producing countries to get projections of
what will be shipped to the U.S. This document contains information from countries that are currently shipping or
planning to ship in the near future to the U.S. and does not represent the entire year. The crop report document will
be updated as we receive new information from each country. Other valuable tools include (these are links):
Three-Year Trend by Country & Month Mango Crop Report Application Virtual Graphs
4
Mango Crop Report Updated September 22, 2018 - Page 14