Embed Size (px)
Citation preview
0-5178-P3
Authors Chandra Bhat
Stacey Bricka Jeffrey La Mondia Aarti Kapur
Jessica Guo Sudeshna Sen
TxDOT Project 0-5178: Measuring Access to Public Transportation Service
September 2006

�
Table of Contents
Chapter 1: How to Use this Guidebook...............................................................................1
Chapter 2: Background Information and Supporting Literature.......................................3 2.1 Introduction...............................................................................................................................4 2.2 Review of Transit Performance Measures.............................................................................5 2.3 Transit Submarkets..................................................................................................................19 2.4 Transit Needs...........................................................................................................................22 2.5 Conclusions...............................................................................................................................25 References.......................................................................................................................................27
Chapter 3: Formulation of Indices....................................................................................33 3.1 Introduction.............................................................................................................................33 3.2 Considerations for the Transit Accessibility Indices..........................................................34 3.3 Development of Transit Accessibility Measures.................................................................39 3.4 Consideration and Development of a Dependence Index...............................................42 3.5 Conclusions...............................................................................................................................43 References.......................................................................................................................................44
Chapter 4: Software Introduction......................................................................................45 4.1 What is Included on the DVD.............................................................................................45 4.2 General Information...............................................................................................................46 4.3 What You Need to Run the Software...................................................................................48 4.4 Complete Descriptions of Data Requirements...................................................................50
Chapter 5: Software User’s Manual....................................................................................55 5.1 Installing the Software............................................................................................................55 5.2 Running the Software.............................................................................................................56 5.3 Understanding the Results......................................................................................................64
Chapter 6: Applications..................................................................................................65 6.1 Service Expansion/Enhancement........................................................................................65 6.2 Stop Design/Placement..........................................................................................................66 6.3 Additional Data Requirements..............................................................................................66 6.4 Contact Information...............................................................................................................67

�

TAM User’s Manual — �
1. How To Use This GuidebookThis guide is designed for those interested in measuring the level of transit accessibility for a fixed route transit system. The purpose of this document is to provide users of the Trans-CAD-based Transit Accessibility Measure (TAM) software tool with instructions for installing and using the software. This comprehensive guide provides background information, pertinent literature, and describes the methodology used to formulate the transit accessibility index that forms the core of the software application.
The TAM software was developed to provide Texas Department of Transportation (TxDOT) Public Transportation Division staff and other transportation professionals within the state of Texas a tool to measure the level of transit accessibility for a fixed route transit system. Using this software, the level of transit accessibility for a fixed route transit system can be determined for the urban region as a whole, for specific geographic subareas within the region, or for spe-cific population subgroups. The goal is to provide decision-makers with detailed information that will enable them to pinpoint areas where the transit system needs improvement or where future expansion should be considered.
The software is unique in that it evaluates the level of accessibility from the customer, or public transportation passenger, perspective rather than from a system performance standpoint. While the transit network and service details are integral parts of transit accessibility, ultimately the service must provide convenient connectivity between origins and destinations of interest to the user in order to be “accessible.” As most systems serve multiple rider groups, detailed data and the ability to identify “weak links” in the current transit service are essential to providing a balanced service that addresses the needs of each rider group.
An extensive literature review and synthesis (discussed in Chapter 2) was used to develop the underlying framework for the software tool (Chapter 3). The software requires data inputs in specific formats, which are detailed in Chapter 4 of this manual. The final chapter provides the user with examples of how the software can be used to both measure and improve transit acces-sibility for any region. Each of these chapters is summarized in more detail below.
Chapter 2: Background Information and Supporting Literature This chapter presents a synthesis of existing literature relevant to the interpretation and measurement of transit service quality from a customer-oriented perspective, with a focus on evaluating fixed-route transit systems. The synthesis contributed to the software development in three ways:
The limitations of existing transit service indices were identified. Oriented towards system performance, these measures did not reflect the ease with which customers could participate in desired activities using transit.
The need for this measure to provide the software user with the ability to distinguish among different population subgroups was recognized, since the trip destinations and trip purposes could vary widely among them.
1.
2.

2 — TAM User’s Manual
In addition to providing geographic- or population-specific measures, it was determined that the software tool needed to also provide the user with the ability to aggregate this measure, so an overall service level for a region could be determined.
Chapter 3: Formulation of Indices This chapter of the user’s guide presents the development of the two indices that together provide the accessibility measures that are output from the software: a transit accessibility index (TAI) and a transit dependence index (TDI). The TAI reflects the level of transit service supply, while the TDI indicates the potential level of transit needs. Together, the TAI and TDI provide a means for transit agencies to identify patterns of disparity in service provision to population groups with different levels of need.
Chapter 4: Software Introduction This chapter provides a very brief overview of the underlying concepts of the software tool and what it was designed to do. In addition, the software strengths and weaknesses are reviewed, along with the specific data needs for a user to proceed with actual use of the software tool.
Chapter 5: User’s Guide In Chapter 5, the User is provided step-by-step instructions for assembling the necessary data inputs, installing the software, and conducting an assessment of transit accessibility. Examples for aggregating by demographic or geographic characteristics are also provided.
Chapter 6: Data Needs and Application Examples The current version of this software tool will allow the user to develop appropriate measures that can be used to improve transit service. Chapter 6 of the manual provides details on the limitations of this software tool and data needs that would enable the development of an enhanced software tool that can distinguish accessibility when multiple transit modes exist (i.e., bus and rail) or for specific time periods of the day. Chapter 6 also provides examples of various analyses that the user can perform.
This guidebook is designed to enable the user to effectively use the software in identifying service improvements and to understand the theories and research underlying the development of the software tool. Each chapter is self-contained, enabling the user to extract the level of information desired.
3.
If you want more details about the development of the software tool, proceed to Chapter 2 and/or 3.
To install and use the software, proceed to Chapter 4.

TAM User’s Manual — 3
2. Background Information and Supporting Literature
This chapter synthesizes knowledge from existing literature relating to the interpretation and measurement of transit service quality from a customer-oriented perspective. The focus is on the evaluation of fixed-route transit systems. In addition, earlier studies that offer conceptual and operational ways of identifying different transit sub-markets, their characteristics, and their varying activity and mobility needs are summarized. The review suggests that existing transit service delivery measures are limited in their capabilities of reflecting the ease with which differ-ent population subgroups are able to participate in their desired activities using transit.
As a result of this literature review, it was determined that existing transit service indices, which were system performance oriented, were limited in their ability to reflect the ease with which customers could participate in desired activities using transit. As a result, this software includes two important features that were lacking in earlier measures, but which are critical for under-standing accessibility from the perspective of the user:
The software allows for the calculation of accessibility levels for distinct population sub-groups traveling for specific trip purposes. This was a result of the literature pointing to a need for the software user to have the ability to distinguish among different population subgroups, since the trip destinations and trip purposes could vary widely among them.
The software allows for aggregation across user groups and geographies. In addition to providing geographic- or population-specific measures, the literature review indicated that this software tool needed to also provide the user with the ability to aggregate this measure so an overall accessibility level for a given area could be determined.
This chapter contains 5 sections:
Section 2.1 is an introduction to the role of transit and the use of transit performance measures.
Section 2.2 surveys existing measures of transit service quality that reflect the custom-ers’ points of view. The section also discusses the comprehensiveness and limitations of these existing measures.
Section 2.3 represents a synthesis of earlier studies that offer conceptual and operational ways of identifying different transit submarkets and their characteristics. This is impor-tant to our objective because the goal of the software was to provide users with measures that quantify the level of equitable distributions of transit service.
Section 2.4 discusses the varying activity and mobility needs of the transit submarkets.
Section 2.5 concludes with recommendations for the formulation of accessibility mea-sures.
1.
2.
4
4
4
4
4
4 — TAM User’s Manual
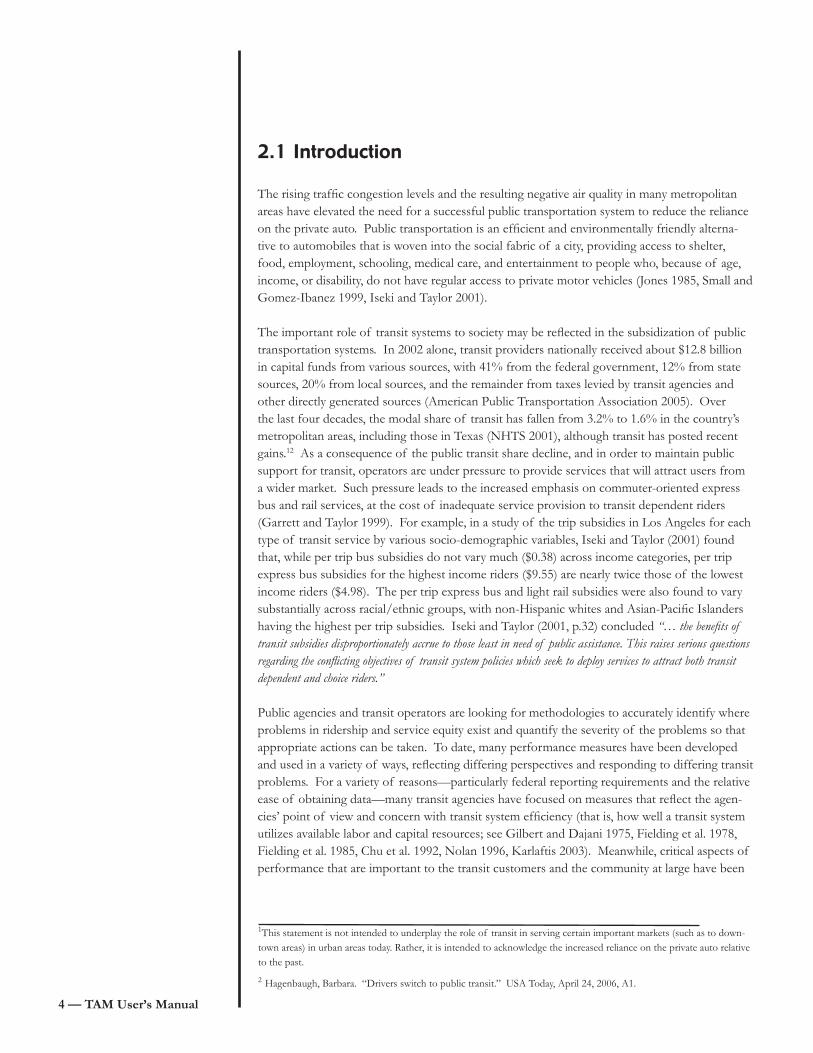
2.1 Introduction
The rising traffic congestion levels and the resulting negative air quality in many metropolitan areas have elevated the need for a successful public transportation system to reduce the reliance on the private auto. Public transportation is an efficient and environmentally friendly alterna-tive to automobiles that is woven into the social fabric of a city, providing access to shelter, food, employment, schooling, medical care, and entertainment to people who, because of age, income, or disability, do not have regular access to private motor vehicles (Jones 1985, Small and Gomez-Ibanez 1999, Iseki and Taylor 2001).
The important role of transit systems to society may be reflected in the subsidization of public transportation systems. In 2002 alone, transit providers nationally received about $12.8 billion in capital funds from various sources, with 41% from the federal government, 12% from state sources, 20% from local sources, and the remainder from taxes levied by transit agencies and other directly generated sources (American Public Transportation Association 2005). Over the last four decades, the modal share of transit has fallen from 3.2% to 1.6% in the country’s metropolitan areas, including those in Texas (NHTS 2001), although transit has posted recent gains.12 As a consequence of the public transit share decline, and in order to maintain public support for transit, operators are under pressure to provide services that will attract users from a wider market. Such pressure leads to the increased emphasis on commuter-oriented express bus and rail services, at the cost of inadequate service provision to transit dependent riders (Garrett and Taylor 1999). For example, in a study of the trip subsidies in Los Angeles for each type of transit service by various socio-demographic variables, Iseki and Taylor (2001) found that, while per trip bus subsidies do not vary much ($0.38) across income categories, per trip express bus subsidies for the highest income riders ($9.55) are nearly twice those of the lowest income riders ($4.98). The per trip express bus and light rail subsidies were also found to vary substantially across racial/ethnic groups, with non-Hispanic whites and Asian-Pacific Islanders having the highest per trip subsidies. Iseki and Taylor (2001, p.32) concluded “… the benefits of transit subsidies disproportionately accrue to those least in need of public assistance. This raises serious questions regarding the conflicting objectives of transit system policies which seek to deploy services to attract both transit dependent and choice riders.”
Public agencies and transit operators are looking for methodologies to accurately identify where problems in ridership and service equity exist and quantify the severity of the problems so that appropriate actions can be taken. To date, many performance measures have been developed and used in a variety of ways, reflecting differing perspectives and responding to differing transit problems. For a variety of reasons—particularly federal reporting requirements and the relative ease of obtaining data—many transit agencies have focused on measures that reflect the agen-cies’ point of view and concern with transit system efficiency (that is, how well a transit system utilizes available labor and capital resources; see Gilbert and Dajani 1975, Fielding et al. 1978, Fielding et al. 1985, Chu et al. 1992, Nolan 1996, Karlaftis 2003). Meanwhile, critical aspects of performance that are important to the transit customers and the community at large have been
1This statement is not intended to underplay the role of transit in serving certain important markets (such as to down-town areas) in urban areas today. Rather, it is intended to acknowledge the increased reliance on the private auto relative to the past.
2 Hagenbaugh, Barbara. “Drivers switch to public transit.” USA Today, April 24, 2006, A1.

TAM User’s Manual — 5
insufficiently addressed (Kittelson & Associates, Inc. et al. 2003). For example, analysis directed toward assessing the effectiveness of subsidies in achieving equitable transit service provision is rarely required or produced (Murray and Davis 2001).
The social-welfare role of transit and the need to improve public transportation customer ser-vice as a means to increase transit ridership have begun to receive more serious consideration, including the use of customer-oriented performance measures to evaluate transit service (Takyi 1993, Murray and Davis 2001). Moreover, the notion of equity in travel opportunities offered by transit requires that these measures reflect how well a transit system meets the customers’ needs in accessing the necessities, and perhaps also luxuries, of life. With such measures, one can evaluate service equity of an existing transit system against that of other alternatives. One can also regularly assess the equity in service in an environment of constantly evolving land use and population characteristics to ensure that a transit system continually meets the needs of its customers.
2.2 Review of Transit Performance Measures
This section reviews past transit performance studies that reflect a customer-oriented perspec-tive (as opposed to an agency-oriented perspective), with a specific emphasis on the notion of service equity. Before discussing these studies in detail, an overview of several characteristics along which existing measures may be differentiated is presented. A three-dimensional classifi-cation scheme is then used to position past performance measures and discuss existing measures as they relate to the three dimensions of our classification scheme. Composite measures that attempt to account for more than one of the three dimensions of the classification scheme are then presented. This section concludes with a discussion of the limitations of existing measures for the purpose of assessing transit service equity.
2.2.1 OverviewMuch has been written about performance measurement in the transit industry and many per-formance measures have been developed in the past. Different measures have been designed to reflect differing points of view (e.g., customer versus agency) and for different modes (e.g., fixed-route versus demand-responsive transit). The measures that are of interest to this report (i.e., customer-oriented measures for fixed-route service) differ in the scale of analysis, type of mathematical structure used, and the underlying goals and objectives of measurement. Each of these three characteristics is discussed in turn in the next three sections.
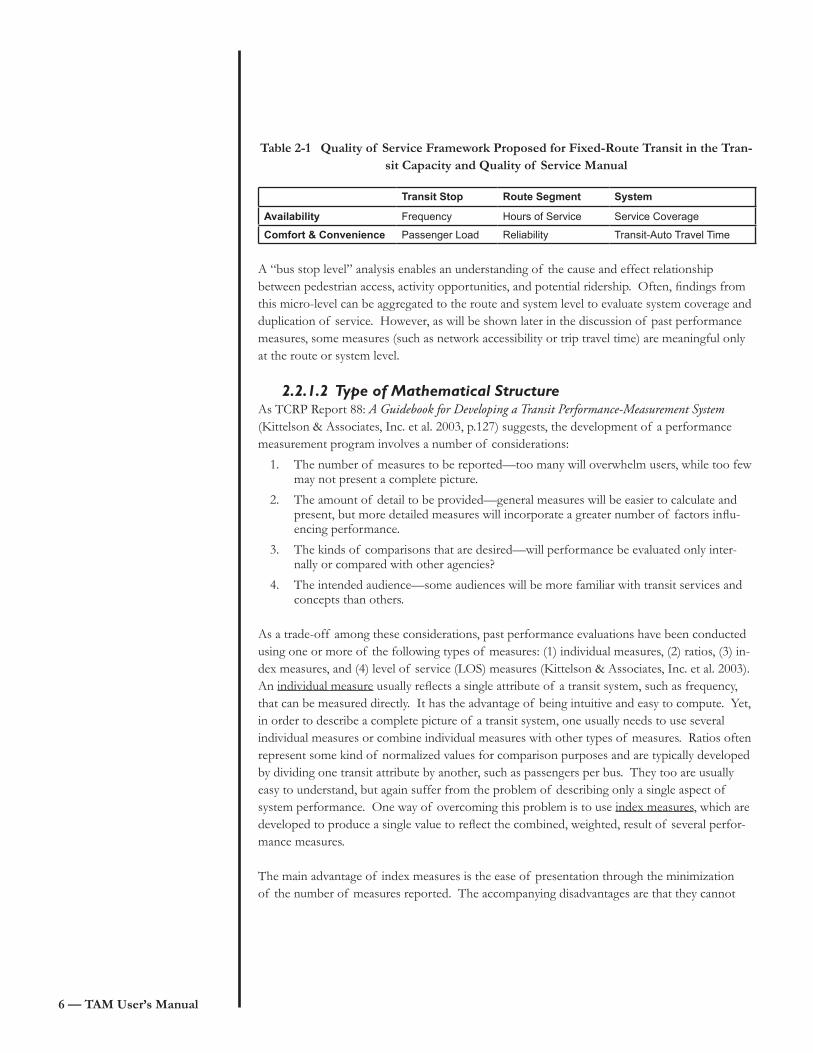
2.2.1.1 Scale of AnalysisThe scale of analysis may range from individual bus stops to individual routes to the entire tran-sit system. For instance, the Quality of Service Framework proposed in the Transit Capacity and Quality of Service Manual (TCQSM, TRB 2003) consists of different measures for differ-ent scales of analysis (see Table 2-1).
6 — TAM User’s Manual
Table 2-� Quality of Service Framework Proposed for Fixed-Route Transit in the Tran-sit Capacity and Quality of Service Manual
A “bus stop level” analysis enables an understanding of the cause and effect relationship between pedestrian access, activity opportunities, and potential ridership. Often, findings from this micro-level can be aggregated to the route and system level to evaluate system coverage and duplication of service. However, as will be shown later in the discussion of past performance measures, some measures (such as network accessibility or trip travel time) are meaningful only at the route or system level.
2.2.1.2 Type of Mathematical StructureAs TCRP Report 88: A Guidebook for Developing a Transit Performance-Measurement System (Kittelson & Associates, Inc. et al. 2003, p.127) suggests, the development of a performance measurement program involves a number of considerations:
The number of measures to be reported—too many will overwhelm users, while too few may not present a complete picture.
The amount of detail to be provided—general measures will be easier to calculate and present, but more detailed measures will incorporate a greater number of factors influ-encing performance.
The kinds of comparisons that are desired—will performance be evaluated only inter-nally or compared with other agencies?
The intended audience—some audiences will be more familiar with transit services and concepts than others.
As a trade-off among these considerations, past performance evaluations have been conducted using one or more of the following types of measures: (1) individual measures, (2) ratios, (3) in-dex measures, and (4) level of service (LOS) measures (Kittelson & Associates, Inc. et al. 2003). An individual measure usually reflects a single attribute of a transit system, such as frequency, that can be measured directly. It has the advantage of being intuitive and easy to compute. Yet, in order to describe a complete picture of a transit system, one usually needs to use several individual measures or combine individual measures with other types of measures. Ratios often represent some kind of normalized values for comparison purposes and are typically developed by dividing one transit attribute by another, such as passengers per bus. They too are usually easy to understand, but again suffer from the problem of describing only a single aspect of system performance. One way of overcoming this problem is to use index measures, which are developed to produce a single value to reflect the combined, weighted, result of several perfor-mance measures.
The main advantage of index measures is the ease of presentation through the minimization of the number of measures reported. The accompanying disadvantages are that they cannot
1.
2.
3.
4.
Transit Stop Route Segment System
Availability Frequency Hours of Service Service Coverage
Comfort & Convenience Passenger Load Reliability Transit-Auto Travel Time
TAM User’s Manual — �
be directly measured in the field, may not be particularly intuitive, and may mask significant changes in their constituting measures. The LOS measures are developed by assigning “A” to “F” letter scores to predefined ranges of values of a particular measure. They are analogous to the roadway LOS measures originally proposed by the Highway Capacity Manual. As with index measures, the LOS measures provide a simple way to present evaluation results to the public and to decision makers, yet they mask performance changes and trends occurring in the underlying measures.
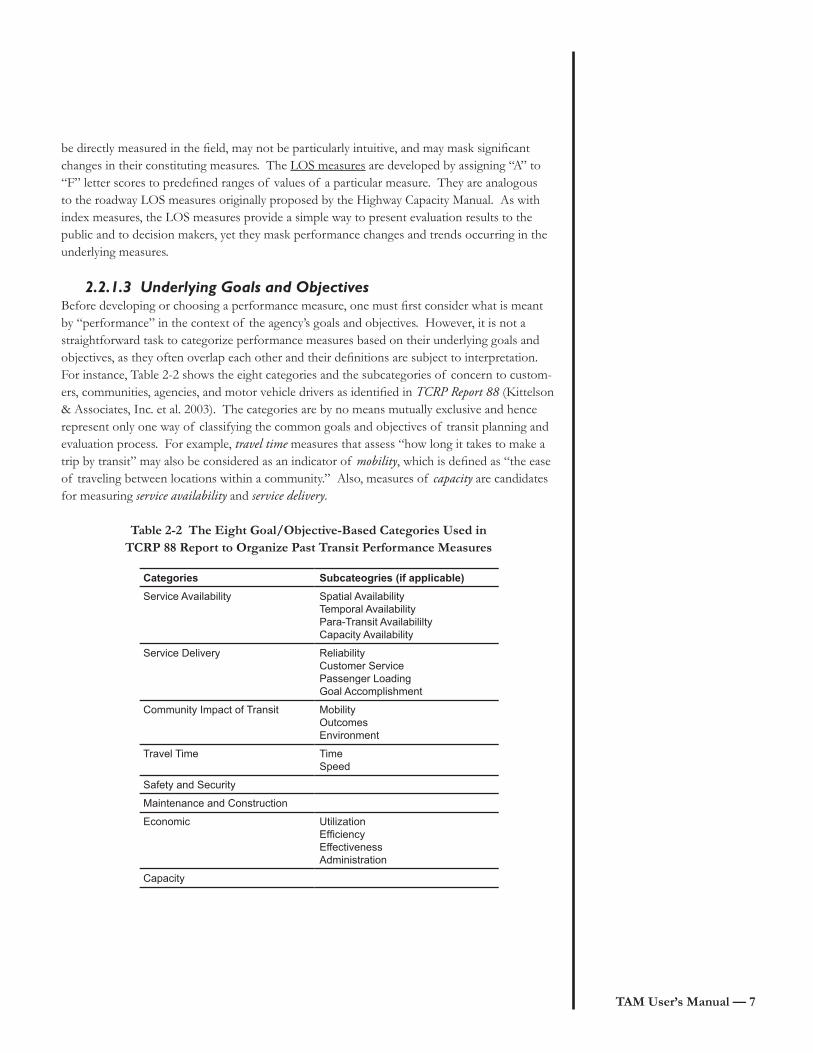
2.2.1.3 Underlying Goals and Objectives Before developing or choosing a performance measure, one must first consider what is meant by “performance” in the context of the agency’s goals and objectives. However, it is not a straightforward task to categorize performance measures based on their underlying goals and objectives, as they often overlap each other and their definitions are subject to interpretation. For instance, Table 2-2 shows the eight categories and the subcategories of concern to custom-ers, communities, agencies, and motor vehicle drivers as identified in TCRP Report 88 (Kittelson & Associates, Inc. et al. 2003). The categories are by no means mutually exclusive and hence represent only one way of classifying the common goals and objectives of transit planning and evaluation process. For example, travel time measures that assess “how long it takes to make a trip by transit” may also be considered as an indicator of mobility, which is defined as “the ease of traveling between locations within a community.” Also, measures of capacity are candidates for measuring service availability and service delivery.
Table 2-2 The Eight Goal/Objective-Based Categories Used in TCRP 88 Report to Organize Past Transit Performance Measures
Categories Subcateogries (if applicable)
Service Availability Spatial AvailabilityTemporal AvailabilityPara-Transit AvailabililtyCapacity Availability
Service Delivery ReliabilityCustomer ServicePassenger LoadingGoal Accomplishment
Community Impact of Transit MobilityOutcomesEnvironment
Travel Time TimeSpeed
Safety and Security
Maintenance and Construction
Economic UtilizationEfficiencyEffectivenessAdministration
Capacity
8 — TAM User’s Manual
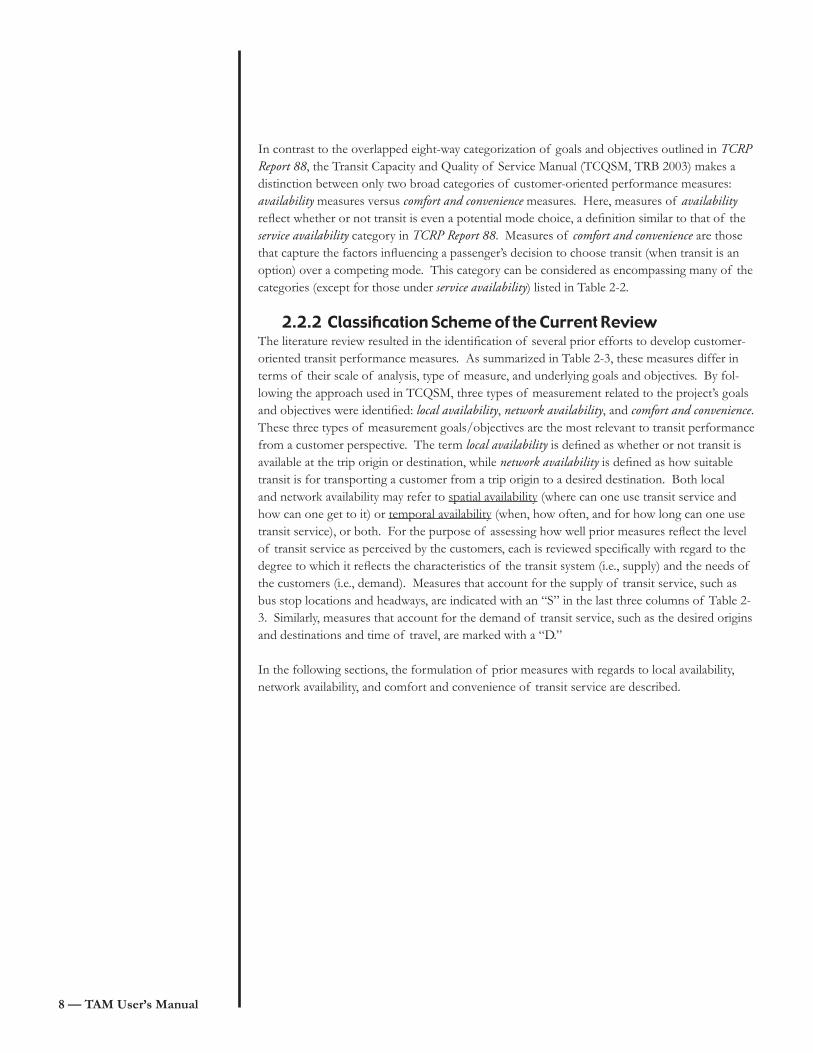
In contrast to the overlapped eight-way categorization of goals and objectives outlined in TCRP Report 88, the Transit Capacity and Quality of Service Manual (TCQSM, TRB 2003) makes a distinction between only two broad categories of customer-oriented performance measures: availability measures versus comfort and convenience measures. Here, measures of availability reflect whether or not transit is even a potential mode choice, a definition similar to that of the service availability category in TCRP Report 88. Measures of comfort and convenience are those that capture the factors influencing a passenger’s decision to choose transit (when transit is an option) over a competing mode. This category can be considered as encompassing many of the categories (except for those under service availability) listed in Table 2-2.
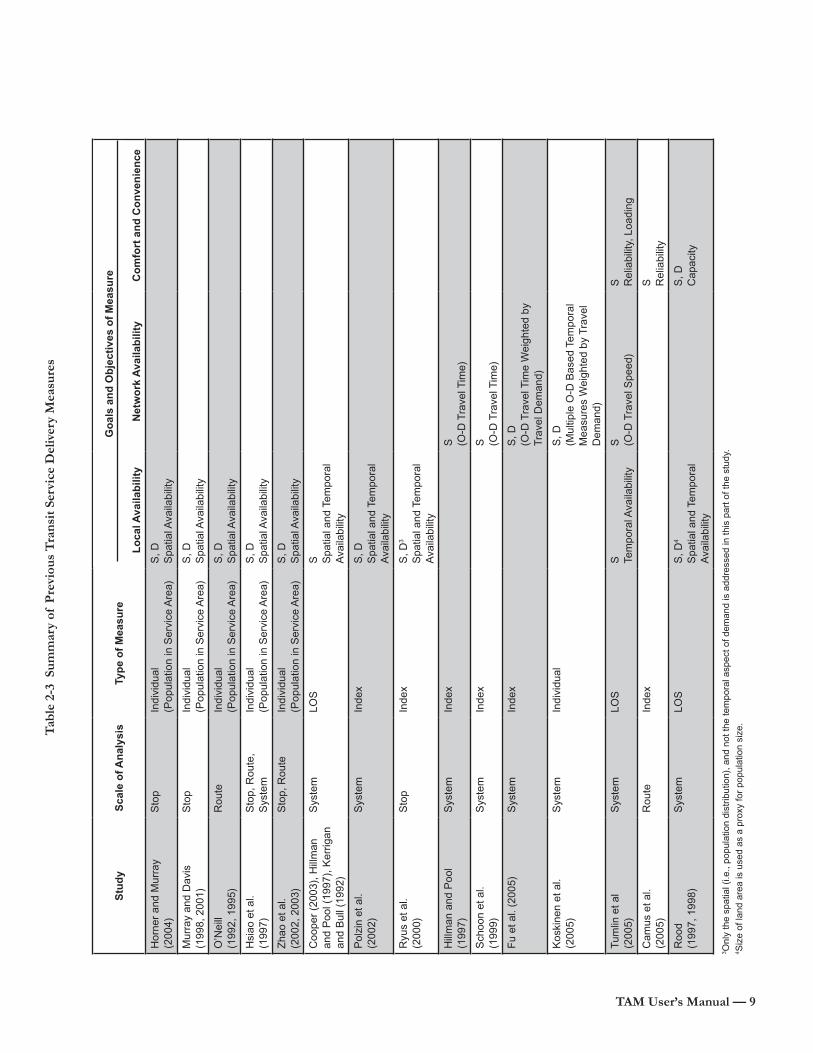
2.2.2 Classification Scheme of the Current ReviewThe literature review resulted in the identification of several prior efforts to develop customer-oriented transit performance measures. As summarized in Table 2-3, these measures differ in terms of their scale of analysis, type of measure, and underlying goals and objectives. By fol-lowing the approach used in TCQSM, three types of measurement related to the project’s goals and objectives were identified: local availability, network availability, and comfort and convenience. These three types of measurement goals/objectives are the most relevant to transit performance from a customer perspective. The term local availability is defined as whether or not transit is available at the trip origin or destination, while network availability is defined as how suitable transit is for transporting a customer from a trip origin to a desired destination. Both local and network availability may refer to spatial availability (where can one use transit service and how can one get to it) or temporal availability (when, how often, and for how long can one use transit service), or both. For the purpose of assessing how well prior measures reflect the level of transit service as perceived by the customers, each is reviewed specifically with regard to the degree to which it reflects the characteristics of the transit system (i.e., supply) and the needs of the customers (i.e., demand). Measures that account for the supply of transit service, such as bus stop locations and headways, are indicated with an “S” in the last three columns of Table 2-3. Similarly, measures that account for the demand of transit service, such as the desired origins and destinations and time of travel, are marked with a “D.”
In the following sections, the formulation of prior measures with regards to local availability, network availability, and comfort and convenience of transit service are described.
TAM User’s Manual — �
Tab
le 2
-3 S
umm
ary
of P
revi
ous
Tra
nsit
Ser
vice
Del
iver
y M
easu
res
Stu
dy
Sca
le o
f A
nal
ysis
Typ
e o
f M
easu
re
Lo
cal A
vaila
bili
tyN
etw
ork
Ava
ilab
ility
Co
mfo
rt a
nd
Co
nve
nie
nce
Hor
ner
and
Mur
ray
(2
004)
Sto
pIn
divi
dual
(Pop
ulat
ion
in S
ervi
ce A
rea)
S, D
Spa
tial A
vaila
bilit
y
Mur
ray
and
Dav
is
(199
8, 2
001)
Sto
pIn
divi
dual
(Pop
ulat
ion
in S
ervi
ce A
rea)
S, D
Spa
tial A
vaila
bilit
y
O’N
eill
(1
992,
199
5)R
oute
Indi
vidu
al(P
opul
atio
n in
Ser
vice
Are
a)S
, DS
patia
l Ava
ilabi
lity
Hsi
ao e
t al.
(1
997)
Sto
p, R
oute
, S
yste
mIn
divi
dual
(Pop
ulat
ion
in S
ervi
ce A
rea)
S, D
Spa
tial A
vaila
bilit
y
Zha
o et
al.
(2
002,
200
3)S
top,
Rou
teIn
divi
dual
(Pop
ulat
ion
in S
ervi
ce A
rea)
S, D
Spa
tial A
vaila
bilit
y
Coo
per
(200
3), H
illm
an
and
Poo
l (19
97),
Ker
rigan
an
d B
ull (
1992
)
Sys
tem
LOS
S Spa
tial a
nd T
empo
ral
Ava
ilabi
lity
Pol
zin
et a
l.
(200
2)S
yste
mIn
dex
S, D
Spa
tial a
nd T
empo
ral
Ava
ilabi
lity
Ryu
s et
al.
(2
000)
Sto
pIn
dex
S, D
3
Spa
tial a
nd T
empo
ral
Ava
ilabi
lity
Hill
man
and
Poo
l (1
997)
Sys
tem
Inde
xS
(O
-D T
rave
l Tim
e)
Sch
oon
et a
l.
(199
9)S
yste
mIn
dex
S
(O-D
Tra
vel T
ime)
Fu
et a
l. (2
005)
Sys
tem
Inde
xS
, D(O
-D T
rave
l Tim
e W
eigh
ted
by
Tra
vel D
eman
d)
Kos
kine
n et
al.
(2
005)
Sys
tem
Indi
vidu
alS
, D(M
ultip
le O
-D B
ased
Tem
pora
l M
easu
res
Wei
ghte
d by
Tra
vel
Dem
and)
Tum
lin e
t al
(200
5)S
yste
mLO
SS
Te
mpo
ral A
vaila
bilit
yS
(O
-D T
rave
l Spe
ed)
S
Rel
iabi
lity,
Loa
ding
Cam
us e
t al.
(2
005)
Rou
teIn
dex
S Rel
iabi
lity
Roo
d
(199
7, 1
998)
Sys
tem
LOS
S, D
4 S
patia
l and
Tem
pora
l A
vaila
bilit
y
S, D
Cap
acity
Go
als
and
Ob
ject
ives
of
Mea
sure
3 Onl
y th
e sp
atia
l (i.e
., po
pula
tion
dist
ribut
ion)
, and
not
the
tem
pora
l asp
ect o
f dem
and
is a
ddre
ssed
in th
is p
art o
f the
stu
dy.
4 Siz
e of
land
are
a is
use
d as
a p
roxy
for
popu
latio
n si
ze.
�0 — TAM User’s Manual
2.2.3 Measures of Local AvailabilityThe availability of transit service is vital for potential passengers: if transit service is not pro-vided to the locations where people want to go and at the times they need to travel, transit is not a viable option (Kittelson & Associates, Inc. et al. 2003). In this section, the approaches for measuring local availability of transit service are summarized. Such measures are sometimes referred to as measures of “local accessibility” (Hillman and Pool 1997) or “access” (Murray et al. 1998).
First, prior measures of local spatial availability—measures of how easy it is to have access to transit from a trip origin or destination—are described. These measures usually focus on the quality of the transit stops and the configuration of walk networks in relation to transit stops. Then the focus shifts to prior measures of local temporal availability—measures of the opportu-nity for transit use based upon attributes such as service frequency and operation hours. Finally, a review of measures that account for both local spatial and temporal availability is presented.
2.2.3.1 Local Spatial AvailabilityBecause most transit riders walk from their trip origins to bus stops and from bus stops to their trip destination, local spatial availability is often evaluated in terms of pedestrian (walk) access, as opposed to park and ride or transfers (Hsiao et al. 1997). Assessment of local spatial avail-ability typically requires estimating the population in the service area of a transit stop or route, thus accounting for the location characteristics of both the supply and demand of the transit service. The estimation of the population served involves a two-step procedure: (1) identifying the service area that is accessible by pedestrians and (2) estimating the potential ridership based on the population and/or land use within the service area. As discussed below, there are a num-ber of different ways to implement the two steps of the procedure.
2.2.3.1.1 Identifying Service AreaThe identification of service areas is typically achieved using a GIS buffering operation by constructing lines of equal proximity around each transit stop (for example, see Hsiao et al. 1997, Ryus et al. 2000, Murray and Davis 2001, Zhao 2003) or each transit route (for example, see O’Neill et al. 1992 and Polzin et al. 2002). The buffering operation clearly involves at least two decisions. The first decision is whether routes or stops should be used as the reference of measurement. As Horner and Murray (2004) demonstrated in their empirical study, the two approaches may lead to very different values of spatial availability. Horner and Murray contend that transit stops offer a more appropriate basis than routes for estimating service area coverage because stops are the actual locations where transit users access the system. The other decision involved in the buffering operation is the buffer size. A common practice in transit planning is to assume that people are served by transit if they are within 0.25 mi (or 400 m) of either a transit route or stop (Murray 2001, Peng et al. 1997, Ramirez and Seneviratne 1996). However, a study conducted by Alshalalfah et al. (2005) suggests that the 0.25 mi criterion underestimates how far people are willing to walk to access transit.
TAM User’s Manual — ��
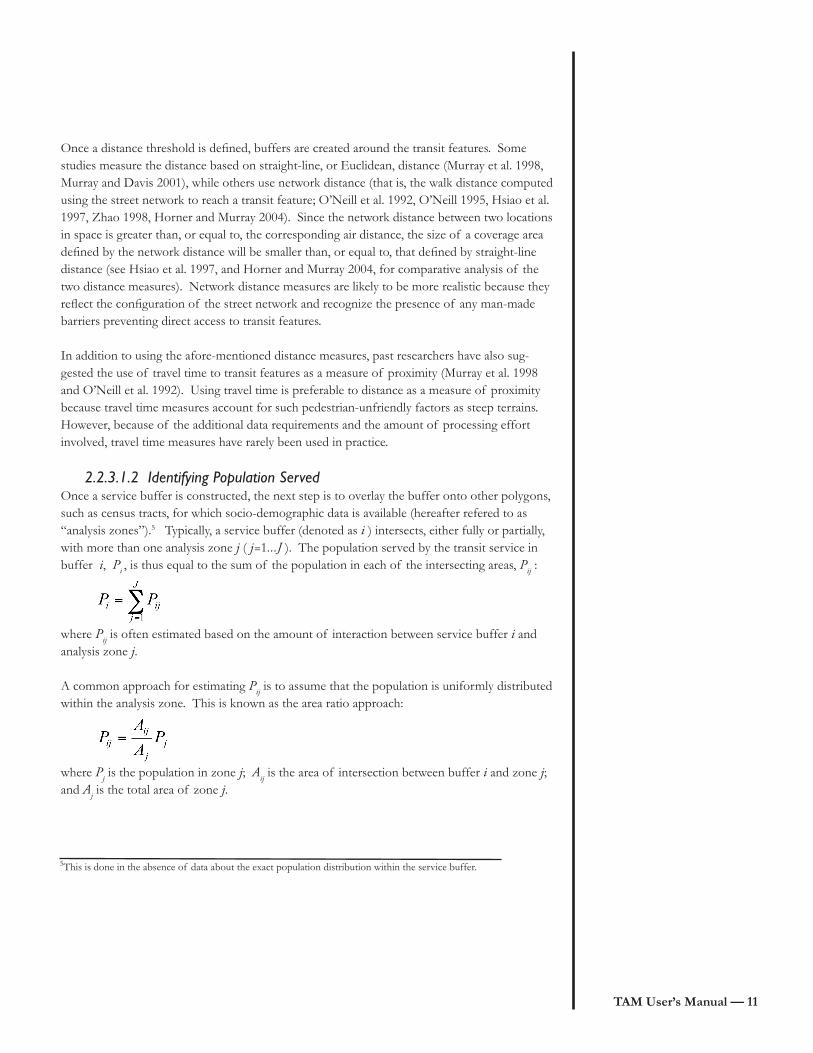
Once a distance threshold is defined, buffers are created around the transit features. Some studies measure the distance based on straight-line, or Euclidean, distance (Murray et al. 1998, Murray and Davis 2001), while others use network distance (that is, the walk distance computed using the street network to reach a transit feature; O’Neill et al. 1992, O’Neill 1995, Hsiao et al. 1997, Zhao 1998, Horner and Murray 2004). Since the network distance between two locations in space is greater than, or equal to, the corresponding air distance, the size of a coverage area defined by the network distance will be smaller than, or equal to, that defined by straight-line distance (see Hsiao et al. 1997, and Horner and Murray 2004, for comparative analysis of the two distance measures). Network distance measures are likely to be more realistic because they reflect the configuration of the street network and recognize the presence of any man-made barriers preventing direct access to transit features.
In addition to using the afore-mentioned distance measures, past researchers have also sug-gested the use of travel time to transit features as a measure of proximity (Murray et al. 1998 and O’Neill et al. 1992). Using travel time is preferable to distance as a measure of proximity because travel time measures account for such pedestrian-unfriendly factors as steep terrains. However, because of the additional data requirements and the amount of processing effort involved, travel time measures have rarely been used in practice.
2.2.3.1.2 Identifying Population ServedOnce a service buffer is constructed, the next step is to overlay the buffer onto other polygons, such as census tracts, for which socio-demographic data is available (hereafter refered to as “analysis zones”).5 Typically, a service buffer (denoted as i ) intersects, either fully or partially, with more than one analysis zone j ( j=1...J ). The population served by the transit service in buffer i, Pi , is thus equal to the sum of the population in each of the intersecting areas, Pij :
where Pij is often estimated based on the amount of interaction between service buffer i and analysis zone j.
A common approach for estimating Pij is to assume that the population is uniformly distributed within the analysis zone. This is known as the area ratio approach:
where Pj is the population in zone j; Aij is the area of intersection between buffer i and zone j; and Aj is the total area of zone j.
5This is done in the absence of data about the exact population distribution within the service buffer.
�2 — TAM User’s Manual
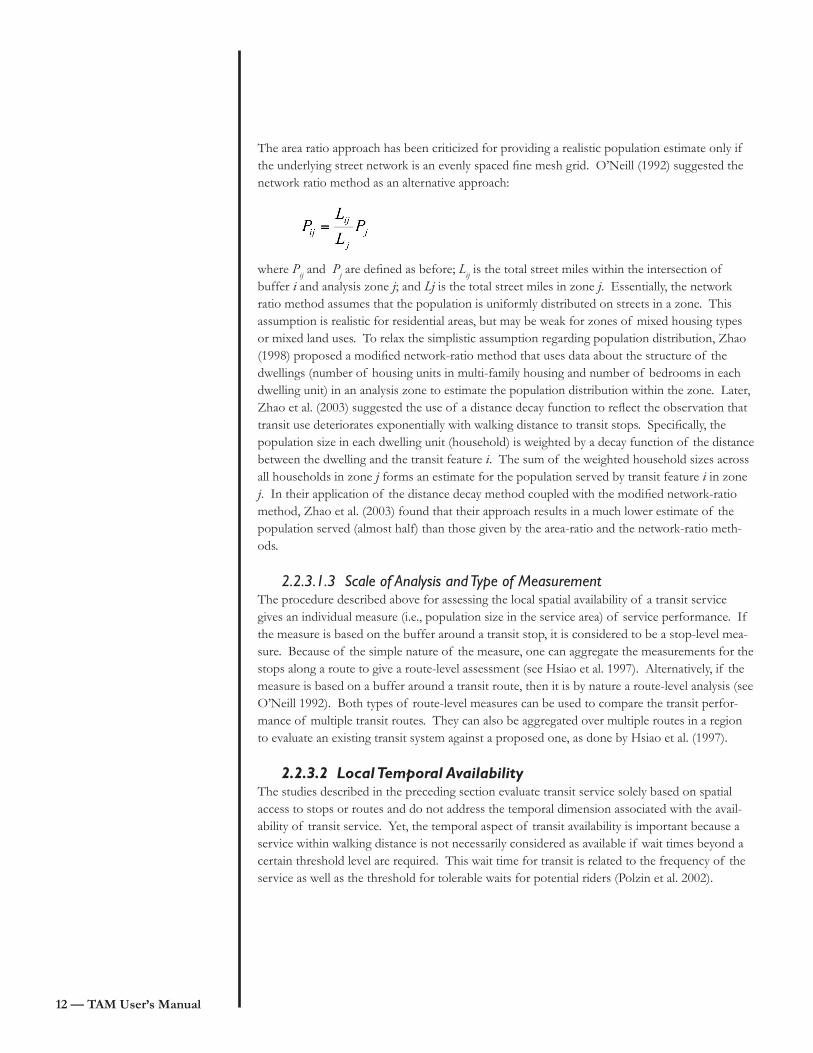
The area ratio approach has been criticized for providing a realistic population estimate only if the underlying street network is an evenly spaced fine mesh grid. O’Neill (1992) suggested the network ratio method as an alternative approach:
where Pij and Pj are defined as before; Lij is the total street miles within the intersection of buffer i and analysis zone j; and Lj is the total street miles in zone j. Essentially, the network ratio method assumes that the population is uniformly distributed on streets in a zone. This assumption is realistic for residential areas, but may be weak for zones of mixed housing types or mixed land uses. To relax the simplistic assumption regarding population distribution, Zhao (1998) proposed a modified network-ratio method that uses data about the structure of the dwellings (number of housing units in multi-family housing and number of bedrooms in each dwelling unit) in an analysis zone to estimate the population distribution within the zone. Later, Zhao et al. (2003) suggested the use of a distance decay function to reflect the observation that transit use deteriorates exponentially with walking distance to transit stops. Specifically, the population size in each dwelling unit (household) is weighted by a decay function of the distance between the dwelling and the transit feature i. The sum of the weighted household sizes across all households in zone j forms an estimate for the population served by transit feature i in zone j. In their application of the distance decay method coupled with the modified network-ratio method, Zhao et al. (2003) found that their approach results in a much lower estimate of the population served (almost half) than those given by the area-ratio and the network-ratio meth-ods.
2.2.3.1.3 Scale of Analysis and Type of MeasurementThe procedure described above for assessing the local spatial availability of a transit service gives an individual measure (i.e., population size in the service area) of service performance. If the measure is based on the buffer around a transit stop, it is considered to be a stop-level mea-sure. Because of the simple nature of the measure, one can aggregate the measurements for the stops along a route to give a route-level assessment (see Hsiao et al. 1997). Alternatively, if the measure is based on a buffer around a transit route, then it is by nature a route-level analysis (see O’Neill 1992). Both types of route-level measures can be used to compare the transit perfor-mance of multiple transit routes. They can also be aggregated over multiple routes in a region to evaluate an existing transit system against a proposed one, as done by Hsiao et al. (1997).
2.2.3.2 Local Temporal AvailabilityThe studies described in the preceding section evaluate transit service solely based on spatial access to stops or routes and do not address the temporal dimension associated with the avail-ability of transit service. Yet, the temporal aspect of transit availability is important because a service within walking distance is not necessarily considered as available if wait times beyond a certain threshold level are required. This wait time for transit is related to the frequency of the service as well as the threshold for tolerable waits for potential riders (Polzin et al. 2002).
TAM User’s Manual — �3
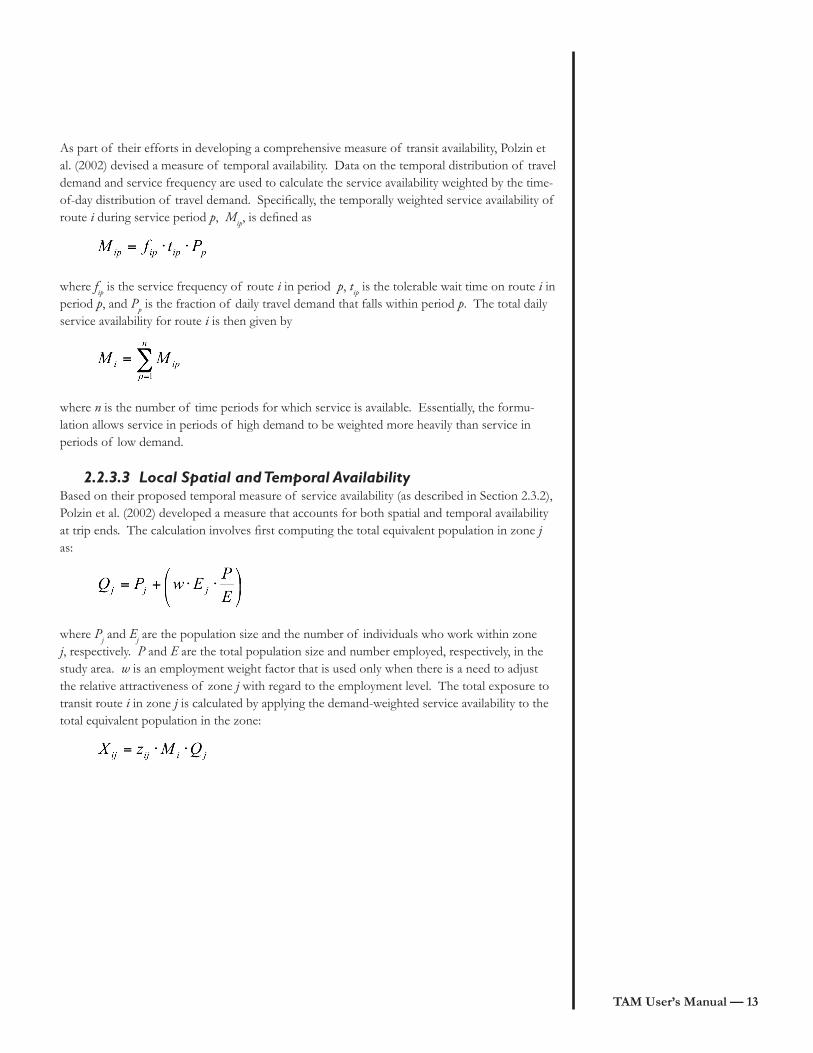
As part of their efforts in developing a comprehensive measure of transit availability, Polzin et al. (2002) devised a measure of temporal availability. Data on the temporal distribution of travel demand and service frequency are used to calculate the service availability weighted by the time-of-day distribution of travel demand. Specifically, the temporally weighted service availability of route i during service period p, Mip, is defined as
where fip is the service frequency of route i in period p, tip is the tolerable wait time on route i in period p, and Pp is the fraction of daily travel demand that falls within period p. The total daily service availability for route i is then given by
where n is the number of time periods for which service is available. Essentially, the formu-lation allows service in periods of high demand to be weighted more heavily than service in periods of low demand.
2.2.3.3 Local Spatial and Temporal AvailabilityBased on their proposed temporal measure of service availability (as described in Section 2.3.2), Polzin et al. (2002) developed a measure that accounts for both spatial and temporal availability at trip ends. The calculation involves first computing the total equivalent population in zone j as:
where Pj and Ej are the population size and the number of individuals who work within zone j, respectively. P and E are the total population size and number employed, respectively, in the study area. w is an employment weight factor that is used only when there is a need to adjust the relative attractiveness of zone j with regard to the employment level. The total exposure to transit route i in zone j is calculated by applying the demand-weighted service availability to the total equivalent population in the zone:
�4 — TAM User’s Manual
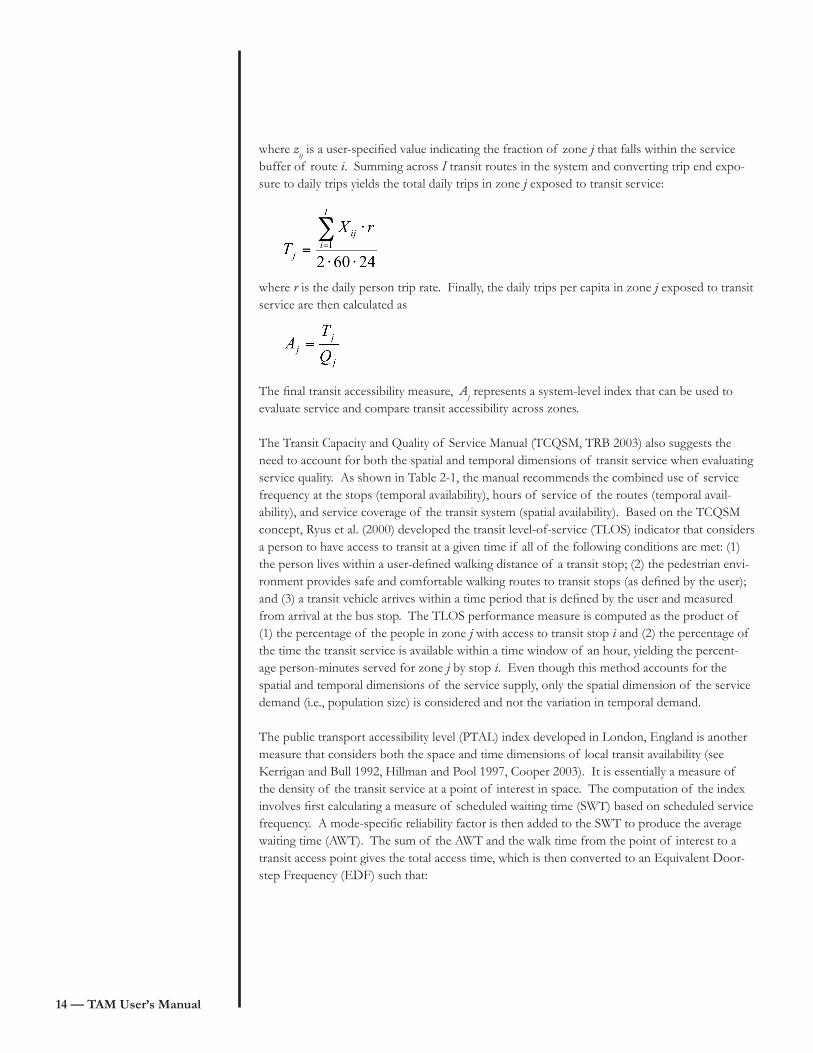
where zij is a user-specified value indicating the fraction of zone j that falls within the service buffer of route i. Summing across I transit routes in the system and converting trip end expo-sure to daily trips yields the total daily trips in zone j exposed to transit service:
where r is the daily person trip rate. Finally, the daily trips per capita in zone j exposed to transit service are then calculated as
The final transit accessibility measure, Aj represents a system-level index that can be used to evaluate service and compare transit accessibility across zones.
The Transit Capacity and Quality of Service Manual (TCQSM, TRB 2003) also suggests the need to account for both the spatial and temporal dimensions of transit service when evaluating service quality. As shown in Table 2-1, the manual recommends the combined use of service frequency at the stops (temporal availability), hours of service of the routes (temporal avail-ability), and service coverage of the transit system (spatial availability). Based on the TCQSM concept, Ryus et al. (2000) developed the transit level-of-service (TLOS) indicator that considers a person to have access to transit at a given time if all of the following conditions are met: (1) the person lives within a user-defined walking distance of a transit stop; (2) the pedestrian envi-ronment provides safe and comfortable walking routes to transit stops (as defined by the user); and (3) a transit vehicle arrives within a time period that is defined by the user and measured from arrival at the bus stop. The TLOS performance measure is computed as the product of (1) the percentage of the people in zone j with access to transit stop i and (2) the percentage of the time the transit service is available within a time window of an hour, yielding the percent-age person-minutes served for zone j by stop i. Even though this method accounts for the spatial and temporal dimensions of the service supply, only the spatial dimension of the service demand (i.e., population size) is considered and not the variation in temporal demand.
The public transport accessibility level (PTAL) index developed in London, England is another measure that considers both the space and time dimensions of local transit availability (see Kerrigan and Bull 1992, Hillman and Pool 1997, Cooper 2003). It is essentially a measure of the density of the transit service at a point of interest in space. The computation of the index involves first calculating a measure of scheduled waiting time (SWT) based on scheduled service frequency. A mode-specific reliability factor is then added to the SWT to produce the average waiting time (AWT). The sum of the AWT and the walk time from the point of interest to a transit access point gives the total access time, which is then converted to an Equivalent Door-step Frequency (EDF) such that:
TAM User’s Manual — �5
EDF (min) = 30/total access time (min).
The EDF values corresponding to all the routes within the catchment area of the point of inter-est are combined to give an accessibility index (AI):
AI = EDFmax + (0.5 ∙ Sum of All Other EDFs)
In the above equation, the EDF values for all but the most accessible or dominant route is halved to compensate for the fact that (1) the number of routes actually considered by a user are likely to be fewer than that included in the calculation; and (2) riders often have to change routes in order to reach the desired destination, leading to significant transfer delays to the journey. If more than one transit mode is present in the catchment area, the AI calculation is repeated for each available mode and the values are summed across all modes to give the public transport accessibility index (PTAI). The value of the PTAI is then mapped to six levels of PTAL, with level 1 being the lowest level of accessibility and 6 being the highest. It should be noted that since the computation of PTAL is with reference to a point of interest and not the customers themselves, the measure accounts for the supply but not the demand of transit service.
2.2.4 Measures of Network AvailabilityMeasures of network availability are concerned with how easy it is to get from an origin to a specific destination by using transit. These measures reflect the configuration of the transit network itself and, therefore, are applicable to the route or system level analysis and not the stop level. In the literature, the measures are also known as measures of “network accessibility” (Hillman and Pool 1997) or simply “accessibility” (Murray et al. 1998). Typically, past measures of network availability represent a combined assessment of the quality of the transit system in terms of both the spatial and temporal dimensions.
Hillman and Pool (1997) described a measure that has been applied by the London borough of Croydon to examine the effects of implementing a new tramline serving a new sports arena on network accessibility. This measure of network accessibility is calculated by defining a set of destinations (such as schools, hospitals, and other activity centers) and identifying the transit routes that link residential zones (i.e., origins) to the trip attractors (i.e., destinations). For each origin, the time taken to walk from the origin to a stop, the time spent waiting at the stop, the time spent traveling and waiting at any interchanges, and the time spent walking to the destina-tion from the bus stop is aggregated to give a total travel time using transit.
Hillman and Pool’s (1997) idea of assessing network accessibility by travel time between origin-destination (O-D) pairs is also used in several later studies. Schoon et al. (1999) described an accessibility index (AI) for comparing the accessibility by alternative modes between an origin-destination O-D pair. For a given mode, such as transit for example, the AI is defined as:

�6 — TAM User’s Manual
The travel time by bus includes the on-board travel time, access to and from bus stops, and wait-ing time at stops. The travel time by car includes in-vehicle travel time and access time between parking facility and destination. Similarly, the travel time by cycling includes the cycling time and access time at the destination. Fu et al. (2005) also take the approach of comparing travel time by transit against that by car when evaluating transit network accessibility. Their approach differs from that of Schoon et al. (1999) in that the travel time between each O-D pair for a given time period of the day is weighted by the associated travel demand (observed or forecasted). The weighted travel times are then summed over all the time periods and normalized by the total daily travel demand. The weighting allows the demand aspect, together with the supply characteristics, to be incorporated into a single index measure.
Koskinen et al. (2005) also take the O-D based approach to examine transit performance. Instead of combining the various temporal attributes into one composite measure, as is done in Fu et al. (2005), Schoon et al. (1999), and Hillman and Pool (1997), Koskinen et al. devel-oped a tool that calculated then graphically displayed the individual measures for each O-D pair. These measures include the number of connections required, the different components of transit travel time (in-vehicle time, walking time, waiting time), transit-auto travel time ratio, travel speed, headway, number of boardings, and service coverage. The tool has the capability of identifying multiple optimal and feasible paths on the transit network between an origin and a destination for an individual for multiple arrival and departure times. The average, minimum, and maximum values over the optimal and feasible paths are then calculated for each of the aforementioned measures. The average of a performance measure can be further weighted by the O-D demand and summed across all origins for a given destination. This gives the acces-sibility by transit for a given zone.
2.2.5 Measures of Comfort and ConvenienceAs has been argued in several past studies of transit performance, when measuring the per-ceived performance of transit service from the customer’s point of view, it is important to take into consideration factors other than those related to spatial and temporal availability (Benn 1995, Potts 2002, Kittelson & Associates, Inc. et al. 2003, TRB 2003, Tumlin et al. 2005). In this report, the terminology used in the Transit Capacity and Quality of Service Manual (TCQSM, TRB 2003) is adopted by lumping these factors into the category of comfort and convenience, which may include factors relating to safety and security (such as accidents), service delivery (such as on-time performance and headway adherence), capacity (and passenger loading), and passenger environment (such as vehicle cleanliness).
The comfort and convenience associated with transit service is usually excluded from existing transit performance measures because data about these factors are often unavailable and many of the factors are difficult to quantify. Of the many factors in this category, reliability is perhaps the one that is easiest to measure in the field. Tumlin et al. (2005) suggest using the coefficient of variation in headway gap, calculated as the standard deviation of actual headway divided by the scheduled headway. Alternatively, the probability of a vehicle’s headway being off by more
TAM User’s Manual — ��
than one-half of the scheduled headway may be a more intuitive measure of reliability. Or, the probability of different degrees of headway variation occurring can be mapped to predefined LOS grades. In addition to the reliability indicator, Tumlin et al. (2005) also define separate LOS indicators for frequency, span of service, loading, and travel speed. Passenger load, which is measured in terms of percentage of vehicle capacity, is considered as another important measure of comfort. Notably, a high vehicle capacity is viewed positively from a transit system efficiency standpoint, but a high vehicle capacity is viewed negatively as a measure of passenger comfort.
The study by Camus et al. (2005) is devoted to the assessment of transit reliability. The pro-posed measure, which the authors refer to as the “weighted delay index,” is defined as:
where H is the scheduled headway, k is the generic delay value in minutes (0 ≤ k ≤ H ), and p(k) is the observed probability for delay k. R is expected to take a value between 0 and 1, with a higher value indicating lower reliability. This reliability measure takes into consideration both the amount of delay associated with transit trips compared to single-occupant vehicle trips and the number of late trips due to transit service failure.
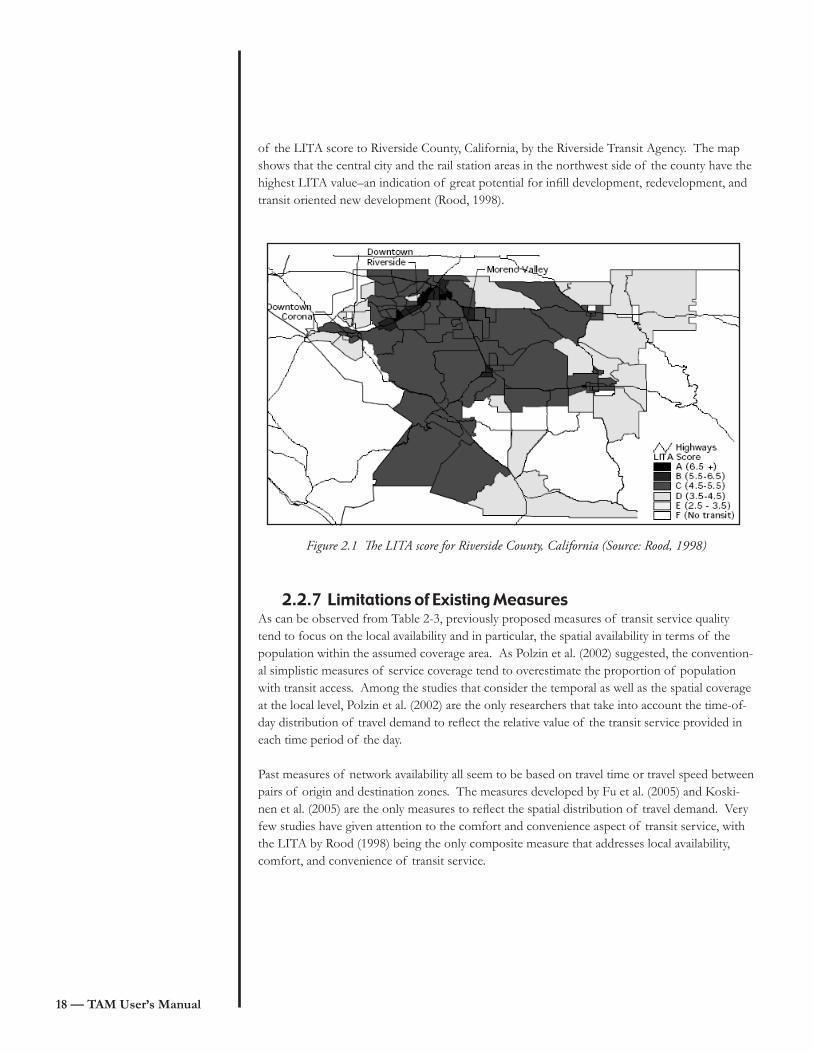
2.2.6 Other Composite MeasuresThe Local Index of Transit Availability (LITA), developed by Rood (1998) for the Sacra-mento-based Local Government Commission, is one of the more comprehensive performance measures as it combines three aspects of service: route coverage (spatial availability), frequency (temporal availability), and capacity (comfort and convenience). By relating the amount of transit service in an analysis zone to the population of both residents and workers in the zone, the LITA addresses both the supply and the demand of the service in one composite LOS score. The computation of the overall LITA score involves first calculating separate scores for route coverage, frequency, and capacity. The service coverage score is given by the number of stops in a zone divided by the square mileage of the land area in the zone. The frequency score is defined as the total number of transit vehicles for the line. The capacity score is in seat-miles per capita, calculated as total daily seats on a transit line (which is vehicle capacity multiplied by number of vehicles per day) multiplied by route-miles of transit line in zone, and then divided by the total population in the zone (residential population plus worker popula-tion). Each of these three scores is then standardized across all the zones in the study area to provide a measure of relative accessibility. The standardization is achieved by (1) taking the difference between the raw score and the mean of the distribution and (2) dividing the differ-ence by the standard deviation of the distribution of that score. The overall LITA score is the average of the three standardized scores. For ease of interpretation, the authors add 5 to the overall score so that the score is always positive and takes a value from 1 to 10. The adjusted score is then mapped to grades A through F, with grade “A” corresponding to an adjusted score of 6.5 or higher, indicating the highest level of accessibility. Figure 2.1 illustrates the application
�8 — TAM User’s Manual
of the LITA score to Riverside County, California, by the Riverside Transit Agency. The map shows that the central city and the rail station areas in the northwest side of the county have the highest LITA value–an indication of great potential for infill development, redevelopment, and transit oriented new development (Rood, 1998).
Figure 2.1 The LITA score for Riverside County, California (Source: Rood, 1998)
2.2.7 Limitations of Existing MeasuresAs can be observed from Table 2-3, previously proposed measures of transit service quality tend to focus on the local availability and in particular, the spatial availability in terms of the population within the assumed coverage area. As Polzin et al. (2002) suggested, the convention-al simplistic measures of service coverage tend to overestimate the proportion of population with transit access. Among the studies that consider the temporal as well as the spatial coverage at the local level, Polzin et al. (2002) are the only researchers that take into account the time-of-day distribution of travel demand to reflect the relative value of the transit service provided in each time period of the day.
Past measures of network availability all seem to be based on travel time or travel speed between pairs of origin and destination zones. The measures developed by Fu et al. (2005) and Koski-nen et al. (2005) are the only measures to reflect the spatial distribution of travel demand. Very few studies have given attention to the comfort and convenience aspect of transit service, with the LITA by Rood (1998) being the only composite measure that addresses local availability, comfort, and convenience of transit service.
TAM User’s Manual — ��
As revealed in this literature review, an area for additional research in transit performance measure development is the formulation of a single, comprehensive measure to simultaneously address local availability, network availability, comfort, and convenience. Moreover, in order for such a measure to be truly “customer-oriented,” the measure needs to contain three primary sets of variables (Hillman and Pool, 1997): (1) the location and characteristics of the individual or person type, for example, where they live, their mobility and car ownership status; (2) the opportunities available within their area for the necessities (and perhaps luxuries) of life—for example, jobs, shops, schools, and medical facilities; and (3) the transport systems that link the two together, including walk and cycle routes, roads and car parks, and public transport services. This need is supported, in part, by the empirical findings of Alshalalfah et al. (2005) that the location characteristics and socio-demographic characteristics of transit users have a significant impact on the perceived local accessibility of transit. Yet, past studies on the subject have made little or no distinction among transit users of different socio-demographic characteristics. For the purpose of assessing equity in transit service delivery, it is especially important to fac-tor into the performance measures the different service needs of various population groups. The development of such comprehensive and customer-oriented measures requires a good understanding of the differences among transit customers—their personal characteristics, their activity preferences, and their specific travel needs. It also requires a means to identify individual transit market sectors across space, so that the level of service experienced by individual sectors can be measured separately. These issues are discussed in the next two sections of this chapter.
2.3 Transit SubmarketsThis section examines three different transit user groups: transit-dependent, transit-inclined, and choice-riders. In addition, specifics on how these user groups were operationalized in empirical studies in order to identify specific transit submarkets are presented.
2.3.1 Transit Dependent UsersThe term “transit-dependent” is often used in transit planning literature without being specifi-cally defined (Benson 1974, Cervero 1981). There also seems to be no consensus regarding this term among those researchers who do offer a definition. These definitions range from: the car-less and those dependent on transit for all non-walking trips (Falocchio et al. 1972); low-income households and households with few or no cars (Kendall 1980); the poor, elderly, young, and the car-less (Doxsey and Spear 1981, McLaughlin and Boyle 1997, Grengs 2001); and the elderly, poor, and the handicapped (Perrin 1982). It has been largely left to the individual researcher to define the transit-dependent population in a way suitable for his or her research.
The American Public Transportation Association (APTA) offers a broader definition of “tran-sit-dependent” in the 1997 Transit Fact Book:
20 — TAM User’s Manual
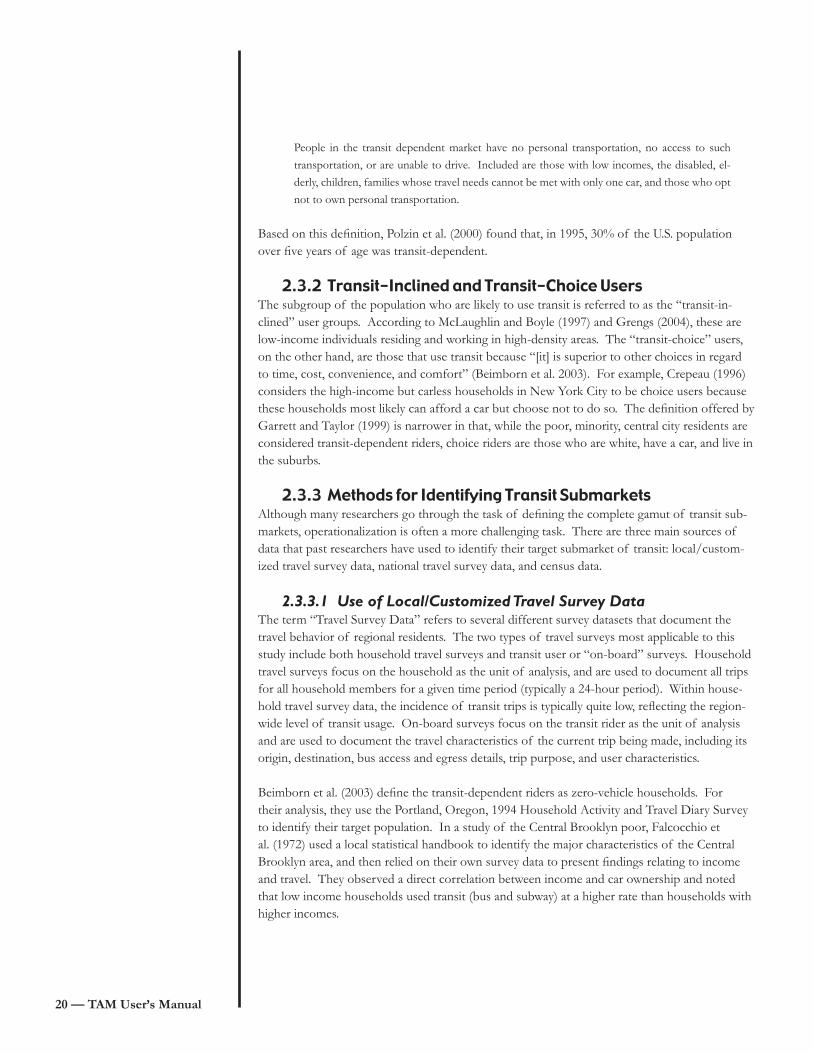
People in the transit dependent market have no personal transportation, no access to such transportation, or are unable to drive. Included are those with low incomes, the disabled, el-derly, children, families whose travel needs cannot be met with only one car, and those who opt not to own personal transportation.
Based on this definition, Polzin et al. (2000) found that, in 1995, 30% of the U.S. population over five years of age was transit-dependent.
2.3.2 Transit-Inclined and Transit-Choice UsersThe subgroup of the population who are likely to use transit is referred to as the “transit-in-clined” user groups. According to McLaughlin and Boyle (1997) and Grengs (2004), these are low-income individuals residing and working in high-density areas. The “transit-choice” users, on the other hand, are those that use transit because “[it] is superior to other choices in regard to time, cost, convenience, and comfort” (Beimborn et al. 2003). For example, Crepeau (1996) considers the high-income but carless households in New York City to be choice users because these households most likely can afford a car but choose not to do so. The definition offered by Garrett and Taylor (1999) is narrower in that, while the poor, minority, central city residents are considered transit-dependent riders, choice riders are those who are white, have a car, and live in the suburbs.
2.3.3 Methods for Identifying Transit SubmarketsAlthough many researchers go through the task of defining the complete gamut of transit sub-markets, operationalization is often a more challenging task. There are three main sources of data that past researchers have used to identify their target submarket of transit: local/custom-ized travel survey data, national travel survey data, and census data.
2.3.3.1 Use of Local/Customized Travel Survey DataThe term “Travel Survey Data” refers to several different survey datasets that document the travel behavior of regional residents. The two types of travel surveys most applicable to this study include both household travel surveys and transit user or “on-board” surveys. Household travel surveys focus on the household as the unit of analysis, and are used to document all trips for all household members for a given time period (typically a 24-hour period). Within house-hold travel survey data, the incidence of transit trips is typically quite low, reflecting the region-wide level of transit usage. On-board surveys focus on the transit rider as the unit of analysis and are used to document the travel characteristics of the current trip being made, including its origin, destination, bus access and egress details, trip purpose, and user characteristics.
Beimborn et al. (2003) define the transit-dependent riders as zero-vehicle households. For their analysis, they use the Portland, Oregon, 1994 Household Activity and Travel Diary Survey to identify their target population. In a study of the Central Brooklyn poor, Falcocchio et al. (1972) used a local statistical handbook to identify the major characteristics of the Central Brooklyn area, and then relied on their own survey data to present findings relating to income and travel. They observed a direct correlation between income and car ownership and noted that low income households used transit (bus and subway) at a higher rate than households with higher incomes.
TAM User’s Manual — 2�
2.3.3.2 Use of National Travel Survey DataPolzin et al. (2000) used the National Household Travel Survey (NHTS) data to study transit travel. Their analysis is conducted using the APTA definition of transit-dependent rider as cited above, but excluded those households whose travel needs cannot be met by only one car. All other households are designated as choice riders. Since the national travel survey data has been weighted, it was used to estimate the national figures of the transit-dependent population from 1969 through 1995. Polzin et al. note that the increase in household car ownership has de-creased the transit-dependent population over the time period being studied. Crepeau (1996) also uses the NHTS data for his analysis of the car-less. By definition, his inter-est is strictly on households that do not have a vehicle available. He uses the national survey data from 1990 (minus New York City residents) to construct a socio-demographic description of car-less households. Crepeau finds that car-less households typically do not include people who are in the workforce, have a lower than average income, and are situated in the central cities of urban areas. In addition, they are often made up of elderly people or single adults without children. Most car-less households are headed by women (Crepeau 1996). Crepeau also found that recent immigrants are less likely to own vehicles; however, the longer they are in the U.S., the more likely they are to own a vehicle.
2.3.3.3 Use of Census DataThe census data is the most commonly used source for identifying transit submarkets. McLaughlin and Boyle (1997) use census block group level data to identify the population below the poverty line, the young, the elderly, and households without a car, as well as residential den-sity as a proxy for incentive to use transit.
Grengs (2001) focused on “vulnerable” households; that is, those households who do not have a vehicle or reasonable access to transit. In his development of a measure of accessibility to grocery stores, Grengs relies on U.S. Census topographically integrated geographic data files as well as socioeconomic data. Assuming that census tracts are homogeneous with respect to so-cioeconomic factors and generally larger than the Transportation Analysis Zones (TAZ), Grengs uses the census data to describe the TAZ, which are his unit of analysis. In a later study, Grengs (2004) measures transit accessibility using block-group level data. He contends that, since access to transit is associated with short distances that might not be well represented using TAZ-level measures, the block-group areas are better suited to a study of transit accessibility. The actual unit of his analysis is a “neighborhood,” which consists of four to six census tracts that meet his definition of being racially isolated and high in poverty. In creating his accessibility measure, Grengs uses the U.S. Census Bureau TIGER files for street, infrastructure, and census tract boundaries; the Economic Census ZIP Code Files for employment and trade service data; and the Census of Population and Housing for demographic and socioeconomic data.
22 — TAM User’s Manual
A variety of U.S. Census Bureau products are also used by Kawabata (2003) to evaluate access to employment by low-skilled workers from zero-vehicle households. Three U.S. metropolitan areas are examined in this research, with the unit of analysis being the TAZ. Kawabata relies on the 1980 Urban Transportation Planning Package and the 1990 Census Transportation Planning Package (CTPP) for employment data (number of workers by job type) and the 5% Public Use Microdata Samples (PUMS) to calculate the percentage of low-skill workers in each occupation category. The PUMS data is identified by the Public Use Microdata Area (PUMA). Because PUMAs are larger than tracts, the author aggregated TAZ-level data (the jobs-access measure) in order to make a final comparison of job access to low-skilled workers. The CTPP is also the source for car ownership in this study.
2.4 Transit NeedsAs discussed earlier, different users may perceive the quality of transit service differently, given their specific activity and mobility needs. The questions associated with the differing needs of transit submarkets are especially relevant to the assessment of equity issues of transit service allocation. Where, or what services, do users need to access? When do they need transit service the most? What other transit service needs do they have? Do the needs differ for different user groups? Below, the literature that addresses some of these questions is examined.
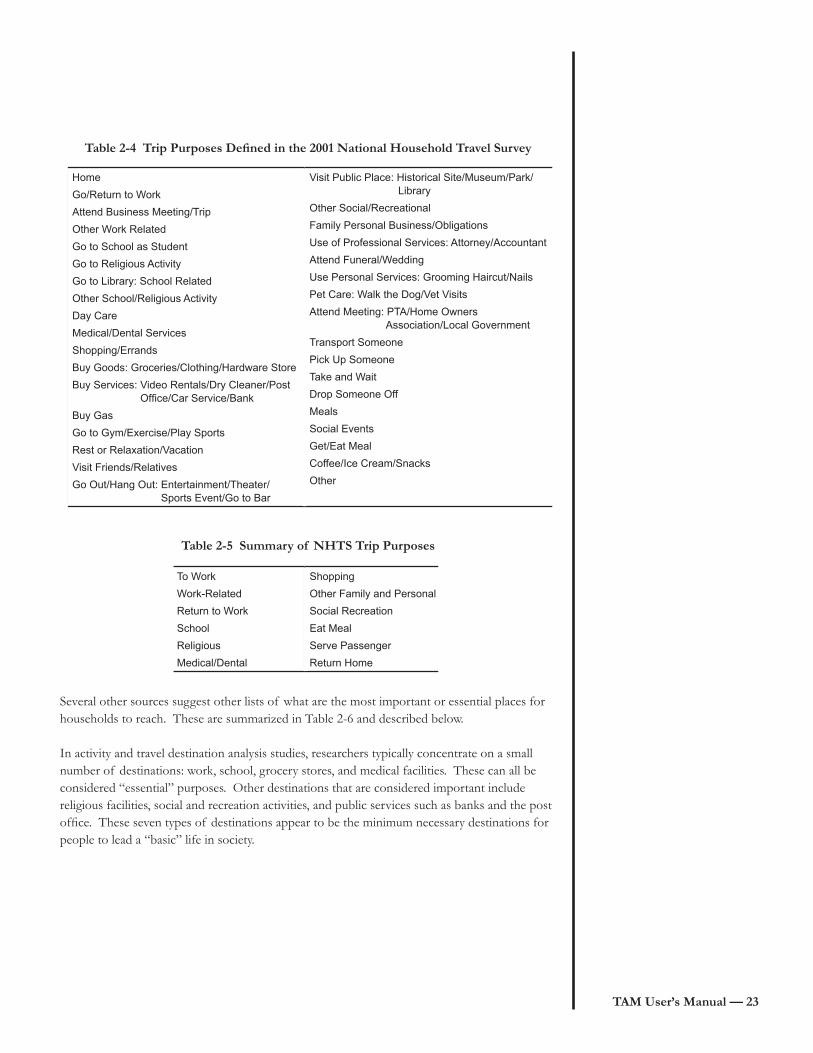
2.4.1 Location and Activity NeedsOne way to assess where people need to go is to consider what their travel reveals about where they go already. The 2001 National Household Travel Survey collects data regarding individuals’ travel to a wide variety of places, as shown in Table 2-4. This long list of places can be col-lapsed further into a smaller number of categories as shown in Table 2-5. The list reflects the type of destinations and services that a transit system can potentially access.
TAM User’s Manual — 23
Table 2-4 Trip Purposes Defined in the 2001 National Household Travel Survey
Table 2-5 Summary of NHTS Trip Purposes
Several other sources suggest other lists of what are the most important or essential places for households to reach. These are summarized in Table 2-6 and described below.
In activity and travel destination analysis studies, researchers typically concentrate on a small number of destinations: work, school, grocery stores, and medical facilities. These can all be considered “essential” purposes. Other destinations that are considered important include religious facilities, social and recreation activities, and public services such as banks and the post office. These seven types of destinations appear to be the minimum necessary destinations for people to lead a “basic” life in society.
Home
Go/Return to Work
Attend Business Meeting/Trip
Other Work Related
Go to School as Student
Go to Religious Activity
Go to Library: School Related
Other School/Religious Activity
Day Care
Medical/Dental Services
Shopping/Errands
Buy Goods: Groceries/Clothing/Hardware Store
Buy Services: Video Rentals/Dry Cleaner/Post Office/Car Service/Bank
Buy Gas
Go to Gym/Exercise/Play Sports
Rest or Relaxation/Vacation
Visit Friends/Relatives
Go Out/Hang Out: Entertainment/Theater/ Sports Event/Go to Bar
Visit Public Place: Historical Site/Museum/Park/ Library
Other Social/Recreational
Family Personal Business/Obligations
Use of Professional Services: Attorney/Accountant
Attend Funeral/Wedding
Use Personal Services: Grooming Haircut/Nails
Pet Care: Walk the Dog/Vet Visits
Attend Meeting: PTA/Home Owners Association/Local Government
Transport Someone
Pick Up Someone
Take and Wait
Drop Someone Off
Meals
Social Events
Get/Eat Meal
Coffee/Ice Cream/Snacks
Other
To Work
Work-Related
Return to Work
School
Religious
Medical/Dental
Shopping
Other Family and Personal
Social Recreation
Eat Meal
Serve Passenger
Return Home
24 — TAM User’s Manual
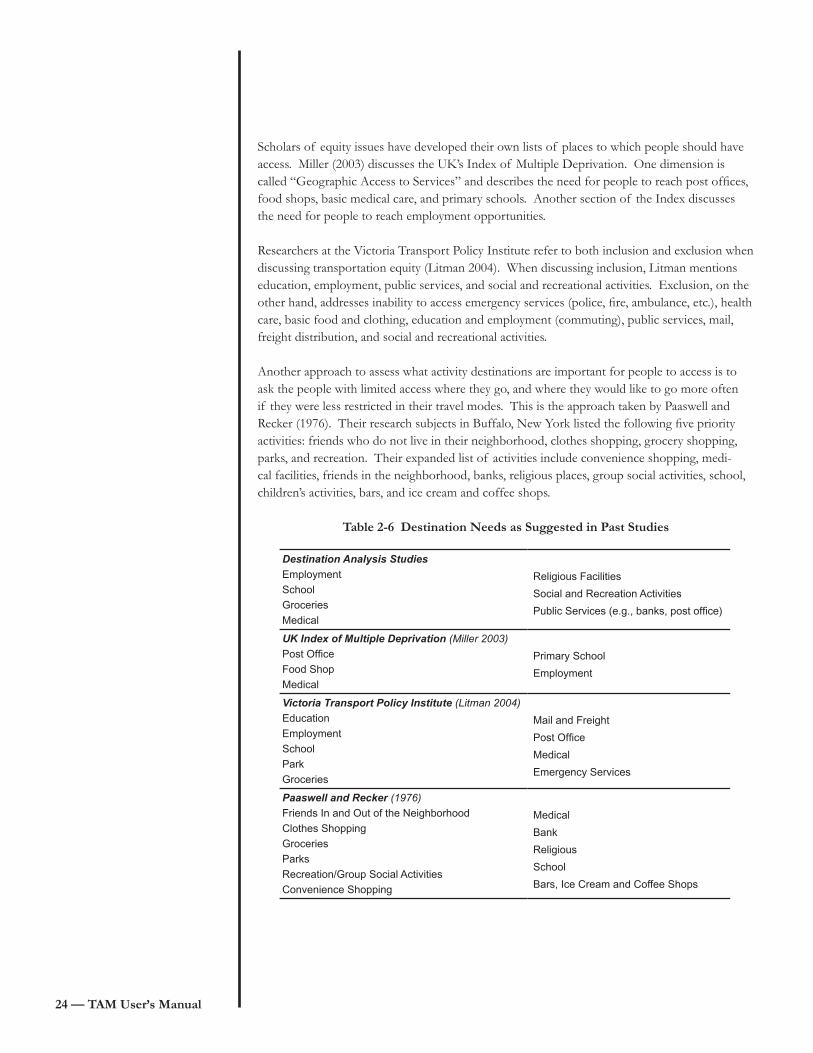
Scholars of equity issues have developed their own lists of places to which people should have access. Miller (2003) discusses the UK’s Index of Multiple Deprivation. One dimension is called “Geographic Access to Services” and describes the need for people to reach post offices, food shops, basic medical care, and primary schools. Another section of the Index discusses the need for people to reach employment opportunities.
Researchers at the Victoria Transport Policy Institute refer to both inclusion and exclusion when discussing transportation equity (Litman 2004). When discussing inclusion, Litman mentions education, employment, public services, and social and recreational activities. Exclusion, on the other hand, addresses inability to access emergency services (police, fire, ambulance, etc.), health care, basic food and clothing, education and employment (commuting), public services, mail, freight distribution, and social and recreational activities.
Another approach to assess what activity destinations are important for people to access is to ask the people with limited access where they go, and where they would like to go more often if they were less restricted in their travel modes. This is the approach taken by Paaswell and Recker (1976). Their research subjects in Buffalo, New York listed the following five priority activities: friends who do not live in their neighborhood, clothes shopping, grocery shopping, parks, and recreation. Their expanded list of activities include convenience shopping, medi-cal facilities, friends in the neighborhood, banks, religious places, group social activities, school, children’s activities, bars, and ice cream and coffee shops.
Table 2-6 Destination Needs as Suggested in Past Studies
Destination Analysis Studies
Employment
School
Groceries
Medical
Religious Facilities
Social and Recreation Activities
Public Services (e.g., banks, post office)
UK Index of Multiple Deprivation (Miller 2003)
Post Office
Food Shop
Medical
Primary School
Employment
Victoria Transport Policy Institute (Litman 2004)
Education
Employment
School
Park
Groceries
Mail and Freight
Post Office
Medical
Emergency Services
Paaswell and Recker (1976)
Friends In and Out of the Neighborhood
Clothes Shopping
Groceries
Parks
Recreation/Group Social Activities
Convenience Shopping
Medical
Bank
Religious
School
Bars, Ice Cream and Coffee Shops

TAM User’s Manual — 25
2.4.2 Differential Needs Among User GroupsAs revealed by many activity-based travel analysis efforts, the activity and travel needs may differ significantly for people of different socio-demographic characteristics. For instance, Schintler et al. (2000) point out that women exhibit more trip-chaining behavior than do men, with over 60% of American women making stops on their way home from work and 25% making more than one stop. The destinations of travel also differ, with women tending more often to visit schools, daycare centers, and shops, while men are more likely to visit restaurants or bars. Age is also an important factor that leads to different travel patterns. In studying the departure time choice for non-work trips, Steed and Bhat (2000) find that, while older individuals are most likely to participate in recreational and shopping activities during the mid-day, employed individuals and students are most likely to do so during the latter parts of the day. Moreover, individuals with very young children (under 5 years) in their households are unlikely to pursue recreational activities during the afternoon peak and evening. In his study that discusses transit service quality specifically from the perspective of older travelers, Burkhardt (2003) used focus groups of older travelers to probe their travel preferences and perceptions concerning transit services. The study revealed that seniors value the following features the most: reliable depar-ture and arrival times, door-to-door service, frequent service, and connection between a wide range of origins and destinations. Comfortable vehicles and waiting areas were also key factors. The specific needs and demands of different population groups have significant implications on evaluating transit service performance—whether against social equity or other goals. For instance, since women are more likely to combine work and non-work activities into one jour-ney, their value of time may differ from that of men. This difference needs to be reflected in the evaluation of transit service quality. Similarly, as seniors have less tolerance for wait time than other population groups, measures of transit service frequency should be weighted by demo-graphic classes. By reflecting the differential needs of users, as opposed to treating the popu-lation as one homogeneous group, transit availability and accessibility measures will be more effective in assessing the service quality as perceived by the transit users.
2.5 ConclusionsMany performance indicators and measures have been developed and used in the transit indus-try in response to a wide range of planning and operational goals and objectives. One of the goals that has become increasingly important to the industry is the provision of equitable and “fair” public transportation services. This is important for certain population groups because access to adequate transit may be the difference between holding a job or not, or between get-ting poorly paid and better paid work. At the same time, improving the access to areas with a high proportion of transportation disadvantaged groups (such as senior citizens, physically challenged individuals, and low income earners) or in areas with specific dwelling types (such as high occupancy buildings or public housing) will also help increase the efficiency and the sustainability of the public transport system (Murray et al. 1998). Administrative agencies and transit operators are therefore looking for measures to accurately identify where the disparities in service delivery are and to quantify the severity of the problems so that development projects can be prioritized appropriately to maximize investment benefits in a regionally equitable and cost-effective manner. The measurement outcome may also help substantiate the need for con-tinued public funding for transit services.
26 — TAM User’s Manual
In this chapter, existing performance measures that are relevant to a comprehensive evaluation of service delivery are examined. In particular, measures that address the aspects of transit ser-vice crucial to service delivery are reviewed: availability, comfort, convenience, and accessibility. The consideration of spatial and, to a lesser degree, temporal dimensions of transit availability was found to be common to these studies. The levels of comfort, convenience, and spatial con-nectivity associated with transit service tend to be overlooked. Literature from the areas of transit planning and activity-based travel analysis to examine the different user groups of transit is also synthesized here. In doing so, it was found that the definitions of the transit-dependent, transit-inclined, and choice-riders are not always clear and sometimes overlap. It is also apparent that, depending on socio-demographic status, individuals have different activity and travel needs and therefore different levels of transit dependency and preference. Of course, one’s sociodemographic status evolves over time and so do the transit needs of the community as a whole. It is therefore important for the transit service delivery to be evaluated in relation to the level and distribution of potential need for the service. The overall recommendation for the future development of transit service delivery measures is to emphasize the ease with which people are able to participate in activities they would like to pursue using transit service. This puts service evaluation in the context of demand-supply interaction along the spatial, temporal, and other dimensions, such as comfort and convenience, at the local and the network level. Preferably, separate indices should be developed for different population subgroups for different trip purposes. At the same time, there should be a mecha-nism to consolidate these indices into successively more aggregate measures and ultimately into a single generalized measure that represents the overall service level for a fixed route system.

TAM User’s Manual — 2�
References
Alshalalfah, B., and Shalaby, A. (2005) Relationship between walk access distance to transit and socioeconomic, demographic and transit service characteristics. Presented at the 84th Annual Meeting of Transportation Research Record.
American Public Transportation Association (APTA) (2005) http://www.apta.com/research/stats/fundcap/capfund.cfm,accessed on January 15, 2005.
Beimborn, E.A., Greenwald, M.J., and Jin, X. (2003) Accessibility, connectivity, and captivity:
impacts on transit choice. Transportation Research Record 1835, 1–9.
Benson, D.E. (1974) Suburban transit planning and forecasting. Transportation Research Record 519, 36–45.
Benn, H. (1995) Bus route evaluation standards, TCRP Synthesis of Transit Practice 10, National Academy Press, Washington, DC. http://nationalacademies.org/trb/publications/tcrp/tsyn10.pdf
Burkhardt, J.E. (2003) Critical measures of transit service quality in the eyes of older travelers. Transportation Research Record 1835, 84–92.
Camus, R., Longo, G., and Macorini, C. (2005) Transit reliability level-of-service estimation based on automatic vehicle location data. Presented at the 84th Annual Meeting of Transporta-tion Research Record.
Cervero, R. (1981) Efficiency and equity impacts of current transit fare policies. Transportation Research Record 799, 7–15.
Chu, X., Fielding, G.J., and Lamar, B.W. (1992) Measuring transit performance using data envel-opment analysis. Transportation Research 26A (3), 223–230.
Cooper, S. (2003) Measuring public transport accessibility levels: sub matter 5b parking strategy, transport for London.
Crepeau, R. (1996) Travel by carless households. Access 9, 29–31.
Doxsey, L.B., and Spear, B.D. (1981) Free-fare transit: some empirical findings. Transportation Research Record 799, 47–49.
Falcocchio, J.C., Pignataro, L.J., and Cantilli, E.J. (1972) Modal choices and travel attributes of inner-city poor. Transportation Research Record 403, 6–17.

28 — TAM User’s Manual
Fielding, G.J., Babitsky, T.T., and Brenner, M.E. (1985) Performance evaluation for bus transit. Transportation Research 19A (1), 73–82.
Fielding, G.J., Glauthier, R.E., and Lave, C.A. (1978) Performance indicators for transit manage-ment. Transportation 7, 365–379.
Fu, L., Saccomanno, F., and Xin, Y. (2005) A new performance index for evaluating transit qual-ity of service. Presented at the 84th Annual Meeting of Transportation Research Record.
Garrett, M., and Taylor, B. (1999) Reconsidering social equity in public transit. Berkeley Planning Journal 13, 6–27.
Gilbert, G., and Dajani, J. (1975) Measuring the performance of transit service, University of North Carolina Press: Chapel Hill, N.C.
Grengs, J. (2001) Does public transit counteract the segregation of carless households? Trans-portation Research Record 1753, 3–10.
Grengs, J. (2004) Measuring change in small-scale transit accessibility with GIS: the cases of Buffalo and Rochester. TRB 2004 Annual Meeting CD-ROM.
Hillman, R., and Pool, G. (1997) GIS-based innovations for modeling public transport accessi-bility. Traffic Engineering and Control 38(10), 554–559.
Horner, M.W., and Murray, A.T. (2004) Spatial representation and scale impacts in transit service assessment. Environment and Planning B 31, 785–797.
Hsiao, S., Lu, J., Sterling, J., and Weatherford, M. (1997) Use of geographic information system for analysis of transit pedestrian access. Transportation Research Record 1604, Transportation Research Board, National Research Council, Washington, D.C., pp. 50–59.
Iseki, H., and Taylor, B.D. (2001) The demographics of public transit subsidies: a case study of Los Angeles.
Jones, D.W., Jr. (1985) Urban transit policy: an economic and political history. Englewood Cliffs, N.J.: Prentice-Hall.
Karlaftis, M.G. (2003) Investigating transit production and performance: a programming ap-proach, Transportation Research 37A, 225–240.
Kawabata, M. (2003) Job access and employment among low-skilled autoless workers in U.S. metropolitan areas. Environment and Planning A 35, 1651–1668.

TAM User’s Manual — 2�
Kendall, D. (1980) Comparison of findings from projects that employ user-side subsidies for taxi and bus travel. Transportation Research Record 784, 45–52.
Kerrigan, M., and Bull, D. (1992) Measuring accessibility: a public transport accessibility index. Environmental Issues: Selected Proceedings of the Seminar B PTRC Summer Annual Meeting, PTRC Education and Research Services, pp. 245–256.
Kittelson & Associates, Inc. et al. (2003) TCRP Report 88: A Guidebook for Developing a Transit Performance-Measurement System.
Koskinen, V., Sarkka, T., and Blomqvist, P. (2005) Measuring scheduled travel time and service availability factors of a fixed route transit system. Presented at the 84th Annual Meeting of Transportation Research Record.
Litman, T. (2003) Social inclusion as a transport planning issue in Canada. Transport and Social Exclusion G7 Comparison Seminar.
McLaughlin, J., and Boyle, D. K. (1997) Transit incentive programs for transit-dependent riders. Transportation Research Record 1604, 139–145.
Miller, H. J. (2003) Travel chances and social exclusion. Presented at the 2003 International As-sociation of Travel Behavior Research.
Murray, A.T. (2001) Strategic analysis of transport coverage. Socio-Economic Planning Sciences 35, 175–188.
Murray, A.T., and Davis, R. (2001) Equity in regional service provision. Journal of Regional Sci-ence 41, 577–600.
Murray, A.T., Davis, R., Stimson, R.J., and Ferreira, L. (1998) Public transportation access. Trans-portation Research Part D 3 (5) 319–328.
NHTS (2001) Nationwide Household Transportation Survey.
Nolan, R. (1996) Determinants of productive efficiency in urban transit. Logistics and Transport Review 32(3), 319–342.
O’Neill, W.A., Ramsey, R.D., and Chou, J. (1992) Analysis of transit service areas using Geo-graphic Information Systems. Transportation Research Record 1364, 131–138.
O’Neill, W. (1995) A comparison of accuracy and cost of attribute data in analysis of transit service areas using GIS. Journal of Advanced Transportation 29 (3), 299–320.
30 — TAM User’s Manual
Paaswell, R.E., and Recker, W.W. (1976) Problems of the Carless, DOT-OS-30098.
Peng, A., Dueker, K., Strathman, J., and Hopper, J. (1997) A simultaneous route level transit patronage model: demand, supply and inter-route relationship. Transportation Research Record 24, 159–181.
Perrin, C. (1982) Implications of social and spatial trends for transit operations and research. Transportation Research Record 877, 97–103.
Polzin, S.E., Chu, X., and Rey, J.R. (2000) Density and captivity in public transit success: ob-servations from the 1995 nationwide personal transportation study. Transportation Research Record 1735, 10–18.
Polzin, S.E., Pendyala, R.M., and Navari, S. (2002) Development of time-of-day-based transit accessibility analysis tool. Transportation Research Record 1799, 35–41.
Potts, J. (2002) Customer focused transit: a synthesis of transit practice. TCRP Synthesis 45, National Academy Press, Washington, DC.
Pucher, J., Hendrickson, C., and McNeil, S. (1981) Socio-economic characteristics of transit rid-ers: some recent evidence. Traffic Quarterly 35(3), 461–483.
Ramirez, A., and Seneviratne, P. (1996) Transit route design applications using Geographic Information Systems. Transportation Research Record 1305, 123–139.
Rood, T. (1997) Local Index of Transit Availability, Riverside County, California Case Study Report. Local Government Commission, Sacramento, California.
Rood, T. (1998) The Local Index of Transit Availability: An Implementation Manual. Local Gov-ernment Commission, Sacramento, California.
Ryus, P., Ausman, J., and Teaf, D. (2000) Development of Florida’s transit level-of-service indi-cator. Transportation Research Record 1731, 123–129.
Schintler, L., Root, A., and Button, K. (2000) Women’s travel patterns and the environment: an agenda for research. Transportation Research Record 1726, 33–40.
Schoon, J.G., McDonald, M., and Lee, A. (1999) Accessibility indices: pilot study and poten-tial use in strategic planning. Transportation Research Record 1685, National Academy Press, Washington, DC.
TAM User’s Manual — 3�
Small, K.A., and Gómez-Ibáñez, J.A. (1999) Urban transportation. In P. Cheshire and E.S. Mills (Eds.), Handbook of Regional and Urban Economics, Volume 3: Applied Urban Economics (pp 1937–1999). Amsterdam.
Steed, J.L., and Bhat, C.R. (2000) On modeling departure-time choice for home-based social/recreational and shopping trips. Transportation Research Record 1706, 152–159.
TRB (2003) Transit Capacity and Quality of Service Manual.
Tumlin, T., Walker, J., Hoffman, J., and Hutabarat, R. (2005) Performance measures for the urban village transit network. Presented at the 84th Annual Meeting of Transportation Research Record.
Zhao, F., Li, M., Chow, L., Li, M., Gan, A., and Ubaka, I. (2003) Forecasting transit walk acces-sibility: a regression model alternative to the buffer method. Presented at the 82nd Annual Meeting of Transportation Research Record.
Zhao, F., Li M., Chow, L., Gan, A., and Shen, L.D. (2002) FSUTMS mode choice modeling: fac-tors affecting transit use and access. Prepared for National Center for Transportation Research, University of South Florida.
Zhao, F. (1998) GIS analysis of the impact of community design on transit accessibility. Proceed-ings of the ASCE South Florida Section Annual Meeting. Sanibel Islands, Florida.

TAM User’s Manual — 33
3. Formulation of Indices
This chapter describes the development of a transit accessibility index (TAI) and a transit dependence index (TDI). The TAI reflects the level of transit service supply, whereas the TDI indicates the potential level of transit needs. Together, the TAI and TDI provide a means for transit agencies to identify patterns of disparity in service provision to population groups with different levels of need. They can also help track and monitor changes in transit service delivery due to shifts in the population and/or land use distribution.
This chapter of the user’s guide contains the following sections:
Section 3.1 introduces the reader to the concepts discussed in this chapter.
Section 3.2 discusses the various considerations involved in the development of the TAI.
Section 3.3 describes the development of the TAI.
Section 3.4 presents the considerations and the development of the TDI.
Section 3.5 concludes the chapter with a discussion on further development of the TAI and the TDI.
3.1 IntroductionPublic agencies and transit operators are looking for methodologies to accurately identify transit service delivery problems in terms of ridership and service equity and to quantify the severity of the problems so that appropriate actions can be taken. To date, many performance measures have been developed and used in a variety of ways, reflecting differing perspectives and re-sponding to differing transit problems. For a variety of reasons—particularly federal reporting requirements and the relative ease of obtaining data—many transit agencies have focused on measures that reflect their point of view and their concerns with transit system efficiency (that is, how well a transit system utilizes available labor and capital resources). However, critical aspects of performance that are important to the transit customers and the community at large have often been overlooked. The social welfare role of transit and the need to improve public transportation customer service as a means to increase transit ridership call for customer-oriented performance measures to evaluate transit service. This chapter of the user’s guide describes the development of customer-oriented measures of the transit level of service for fixed-route systems. The measures presented here will ultimately be packaged into a GIS-based software program for use by TxDOT and other transportation agencies to design transit systems that provide equitable and accessible transit services. Two types of measures are presented here: transit accessibility indices (TAI) and the transit depen-dence index (TDI). The objectives for developing the TAI are to:
4
4
4
4
4
34 — TAM User’s Manual
identify areas with relatively low accessibility to provide a basis to develop or expand service;
evaluate estimated impacts of projects;
evaluate estimated impacts of land use changes; and
provide information for designing policies to target specific aspects of transit service.
The objective for developing the TDI is to identify areas with relatively higher transit needs (i.e. more transit dependent users) than other areas. The TDI will help transit agencies to correlate the level of service supply with the demand level of the public to ensure that the system reaches the users who need the service the most.
3.2 Considerations for the Transit Accessibility Indices This section discusses the various considerations through which the proposed TAI were devel-oped. These considerations have been drawn from the development of the Urban Accessibility Index (Bhat et al. 2002) and the review of existing transit service delivery measures presented in the preceding chapter. The considerations include:
the mathematical structure of the measure;
the behavioral dimensions and service characteristics to be incorporated in the measure; and
the ability to aggregate the measure across various dimensions
3.2.1 Mathematical Structure of the TAI Four types of accessibility indices have emerged from past research on the subject (Bhat et al 2000). These include spatial separation measures, cumulative opportunity measures, grav-ity measures, and utility measures. The nature of these measures and their applicability in the context of evaluating transit service are described below.
3.2.1.1 Spatial Separation MeasuresThis is the simplest form of an accessibility measure and it represents the spatial separation (in terms of distance or travel time) between the origin and the destination. This form of measure is undesirable for the purpose of this project because the measure does not account for the attraction level (for example, land use intensity) at the destination end, nor does it reflect the sensitivity and needs of users with different characteristics.
3.2.1.2 Cumulative Opportunity MeasuresThis measure calculates the accessibility for a given origin as the total number of attractions (for example, the number of grocery stores) within a pre-specified travel time or distance. The main criticism for this form of measure is its lack of behavioral foundation. Specifically, the uniform application of a travel time threshold would disregard the differential sensitivity to travel time of various types of transit users.
1.
2.
3.
4.
1.
2.
3.

TAM User’s Manual — 35
3.2.1.3 Gravity MeasuresGravity measures incorporate a separation factor and an attraction factor. They usually take the form of the sum of attraction-to-separation ratios across destinations. The separation factor provides a dampening effect that devalues the attractions far from the origin. Similar to the spatial separation and cumulative opportunity measures, the gravity measures also suffer from the limitation of assigning the same accessibility value to all individuals in the same origin zone.
3.2.1.4 Utility MeasuresUtility measures represent the utility an individual perceives from travel alternatives. Specifi-cally, the accessibility for an individual is generally calculated as the expected maximum (or the logsum) utility from a random utility model. Usually, such measures are derived from a multino-mial model of destination choice or a nested logit model of destination and mode choice. Since utility is generally formulated as a function of the characteristics of the individual, as well as the characteristics of the choice alternatives, the utility measures have the capability of representing accessibility at an individual level according to individual preferences and taste differences. This is why the utility measures have been considered the most suitable form for the purpose of this project.
In the past, the utility approach to measuring accessibility has been criticized for its underlying assumption that all individuals consider the same choice set of alternative destinations. This is especially a problem in the context of measuring transit accessibility because any single bus, or a collection of buses, usually covers only a portion of a given study area. Thus, while an indi-vidual can potentially drive a car to reach any of the alternative destinations in the area, only a subset of destinations may be accessed by transit. For instance, consider an individual residing at o, and let a, b, and c be activity centers (see Figure 3.1).
All of these activity centers are accessible by car, but only c is serviced by transit. Thus, only when a destination is considered as reachable by transit can the associated utility based on the service available for reaching the destination be calculated. The utility can then in turn be incor-porated into the final accessibility index.
The application of a utility-based approach to measuring transit accessibility therefore involves two stages. In the first stage, the feasibility of using transit to reach a potential destination is considered. If it is indeed feasible, the utility associated with traveling to the destination using transit is determined. The discussion presented in the next section (3.2.2) represents the prem-ise for modeling transit feasibility and utility with respect to a given destination. The second stage of our utility-based approach is concerned with consolidating the utilities associated with all feasible destinations to form a single measure of transit accessibility. This consolidation process is further discussed in section 3.2.3.

36 — TAM User’s Manual
Figure 3.1 Relevance of a Destination Depends on Transit Service Coverage
3.2.2 Elements of the Utility Measure for the TAIIn this section, the various elements considered as relevant to the perceived feasibility and utility associated with using transit to reach a given destination are discussed. As depicted in Figure 3.2, the perceived feasibility and utility depend on both the ease of reaching boarding and destination points, referred to as local accessibility, and the ease of travel between boarding and egress points, referred to as network accessibility. While local accessibility is related to the place-ment of transit stops, network accessibility is mainly concerned with the actual transit operation, particularly the alignment of routes and the scheduling of service. Travel to a destination by transit is feasible only if the local and network accessibilities meet an individual’s desired level of service. Once a destination is regarded as feasible, the utility associated with using the transit service to reach the destination is the combined levels of local and network accessibilities.
Below, the elements of transit service that constitute the local and network accessibility are discussed.
3.2.2.1 Local AccessibilityThe level of local accessibility can be characterized along spatial, temporal and other dimensions as follows (see Figure 3.2).
3.2.2.1.1 SpatialIf transit service is not provided within the proximity of where an individual lives and wants to go, then, as far as the individual is concerned, transit service does not exist.Thus, spatial proxim-ity is one of the elements, and probably the most important one, that determines local acces-sibility. The definition of proximity should be dependent on the individual. For example, a distance of a quarter-mile may be considered walkable, and thus accessible, by a young adult but perhaps not by a senior adult. Proximity should also be defined based on the available access mode, that is, whether the individual walks, bicycles, drives, or gets a ride from home to a given
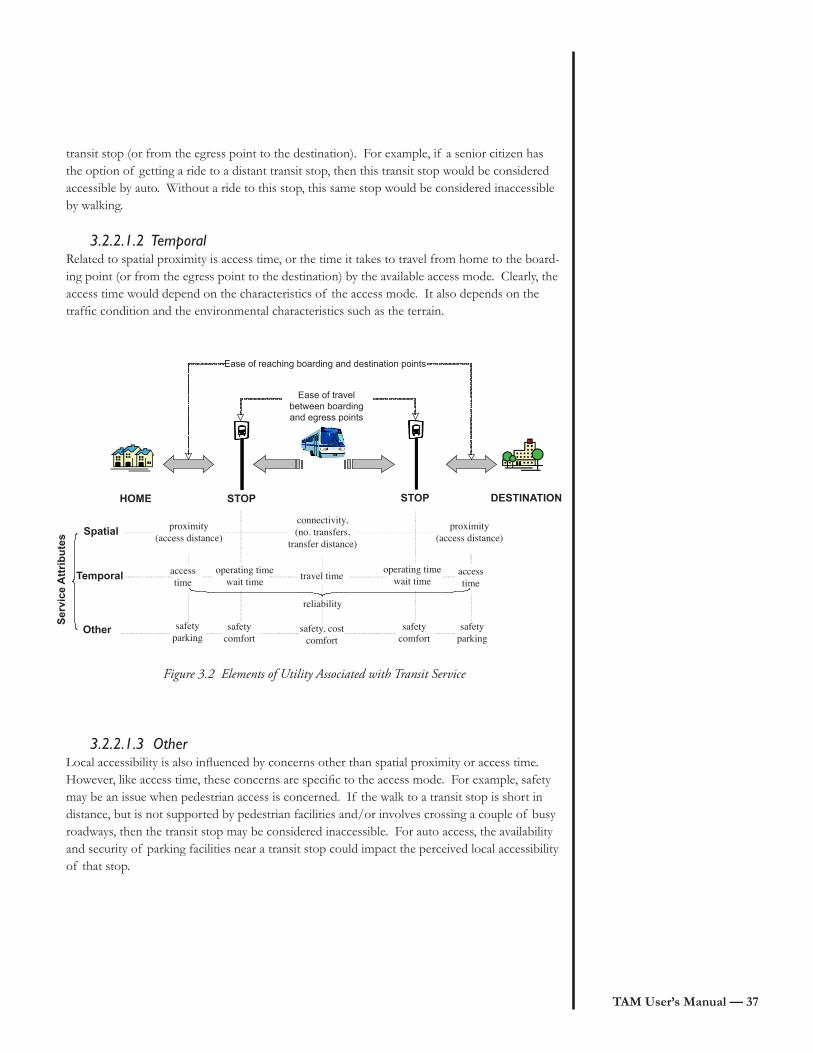
TAM User’s Manual — 3�
transit stop (or from the egress point to the destination). For example, if a senior citizen has the option of getting a ride to a distant transit stop, then this transit stop would be considered accessible by auto. Without a ride to this stop, this same stop would be considered inaccessible by walking.
3.2.2.1.2 TemporalRelated to spatial proximity is access time, or the time it takes to travel from home to the board-ing point (or from the egress point to the destination) by the available access mode. Clearly, the access time would depend on the characteristics of the access mode. It also depends on the traffic condition and the environmental characteristics such as the terrain.
Figure 3.2 Elements of Utility Associated with Transit Service
3.2.2.1.3 OtherLocal accessibility is also influenced by concerns other than spatial proximity or access time. However, like access time, these concerns are specific to the access mode. For example, safety may be an issue when pedestrian access is concerned. If the walk to a transit stop is short in distance, but is not supported by pedestrian facilities and/or involves crossing a couple of busy roadways, then the transit stop may be considered inaccessible. For auto access, the availability and security of parking facilities near a transit stop could impact the perceived local accessibility of that stop.
STOP
Ease of travel between boardingand egress points
Ease of reaching boarding and destination points
HOME STOP DESTINATION
connectivity(no. transfers,
transfer distance)
Spatial
travel timeTemporal
Othersafety, cost
comfort
proximity(access distance)
safetyparking
operation timewait time
safetycomfort
safetyparking
safetycomfort
operating timewait time
ServiceAttributes
accesstime
accesstime
proximity(access distance)
reliability
Ser
vice
Att
rib
ute
s Spatial
Temporal
Other
HOME STOP STOP DESTINATION
Ease of reaching boarding and destination points
Ease of travel between boarding and egress points
proximity (access distance)
access time
safety parking
operating timewait time
safetycomfort
safety, cost comfort
reliability
travel time
connectivity,(no. transfers,
transfer distance)
safetycomfort
safety parking
access time
operating timewait time
proximity (access distance)
38 — TAM User’s Manual
3.2.2.2 Network AccessibilitySimilar to local accessibility, network accessibility can also be characterized along spatial, tempo-ral and other dimensions (see Figure 3.2).
3.2.2.2.1 SpatialNetwork accessibility refers to the provision of service between a given pair of accessible boarding and egress stops. The spatial aspect of the service that contributes to network acces-sibility is network connectivity—that is, whether there is a route, or a combination of routes, that connects the boarding and the egress stops. For any path that involves transfers between different routes, the concept of connectivity would depend on an individual’s sensitivity to the number of transfers required and the walk distance between transfer stops.
3.2.2.2.2 TemporalOnce a connecting path is identified, an individual would need to consider the temporal provi-sion of the service along that path. The considerations include the time span over which service is provided, the service frequency, and the service reliability at the trip ends (note that service frequency and service reliability together determine the wait time experienced at a transit stop). The temporal considerations also include the various elements that impact the total travel time, including the total in-vehicle travel time, the total transfer time (which is usually the walk time), the service frequencies for intermediate routes, and the travel time reliability. It should be noted that the sensitivity to these various temporal service characteristics is likely to vary from individual to individual, and also from one travel occasion to another. For instance, if transit is being considered for a work trip or appointment, then the individual would probably be more sensitive to service reliability, and be more inflexible about service hours, than if it was for shop-ping or other personal errands.
3.2.2.2.3 OtherConcerns about safety at transit stops (including the trip ends and the transfer locations) may also influence individuals’ perceptions of network accessibility. Such concerns include appropri-ate lighting and shelter at the waiting area. Other non-spatial, non-temporal service attributes that impact network accessibility include the cost of travel and the comfort level in terms of the occupancy levels vis-à-vis the transit vehicle capacity.
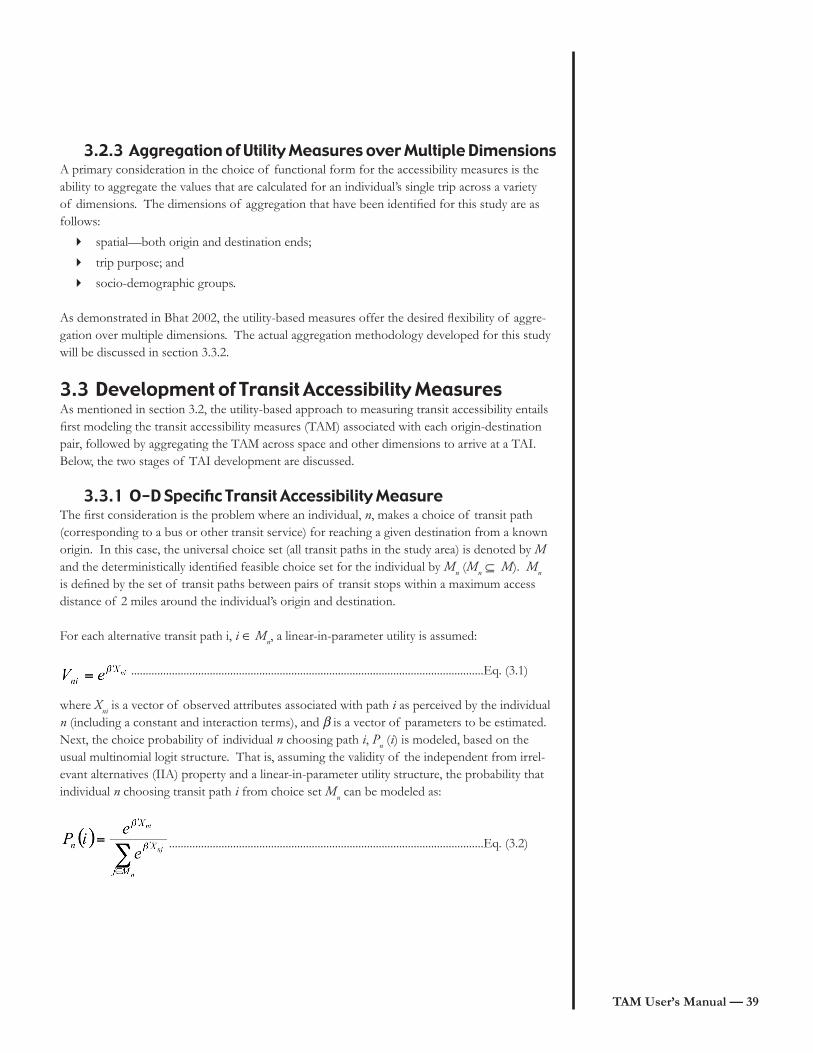
TAM User’s Manual — 3�
3.2.3 Aggregation of Utility Measures over Multiple DimensionsA primary consideration in the choice of functional form for the accessibility measures is the ability to aggregate the values that are calculated for an individual’s single trip across a variety of dimensions. The dimensions of aggregation that have been identified for this study are as follows:
spatial—both origin and destination ends;
trip purpose; and
socio-demographic groups.
As demonstrated in Bhat 2002, the utility-based measures offer the desired flexibility of aggre-gation over multiple dimensions. The actual aggregation methodology developed for this study will be discussed in section 3.3.2.
3.3 Development of Transit Accessibility Measures As mentioned in section 3.2, the utility-based approach to measuring transit accessibility entails first modeling the transit accessibility measures (TAM) associated with each origin-destination pair, followed by aggregating the TAM across space and other dimensions to arrive at a TAI. Below, the two stages of TAI development are discussed.
3.3.1 O-D Specific Transit Accessibility MeasureThe first consideration is the problem where an individual, n, makes a choice of transit path (corresponding to a bus or other transit service) for reaching a given destination from a known origin. In this case, the universal choice set (all transit paths in the study area) is denoted by M and the deterministically identified feasible choice set for the individual by Mn (Mn � M). Mn is defined by the set of transit paths between pairs of transit stops within a maximum access distance of 2 miles around the individual’s origin and destination.
For each alternative transit path i, i � Mn, a linear-in-parameter utility is assumed:
.........................................................................................................................Eq. (3.1)
where Xni is a vector of observed attributes associated with path i as perceived by the individual n (including a constant and interaction terms), and � is a vector of parameters to be estimated. Next, the choice probability of individual n choosing path i, Pn (i) is modeled, based on the usual multinomial logit structure. That is, assuming the validity of the independent from irrel-evant alternatives (IIA) property and a linear-in-parameter utility structure, the probability that individual n choosing transit path i from choice set Mn can be modeled as:
............................................................................................................Eq. (3.2)
4
4
4
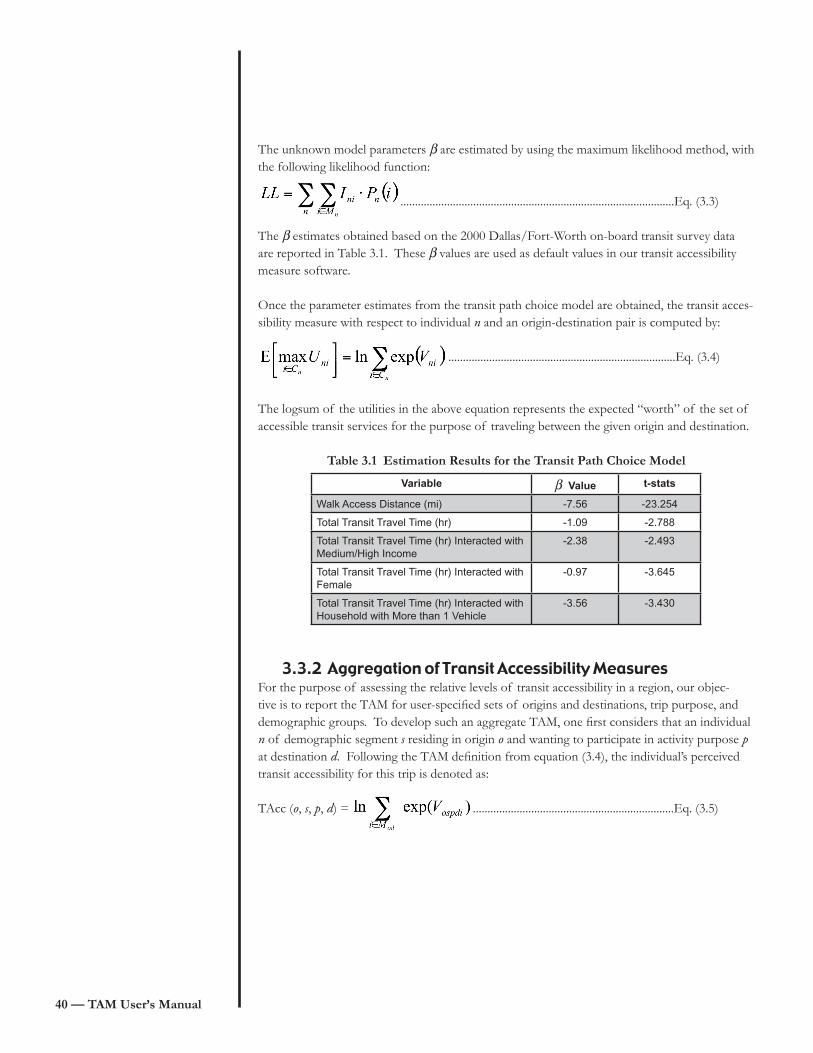
40 — TAM User’s Manual
The unknown model parameters � are estimated by using the maximum likelihood method, with the following likelihood function:
..............................................................................................Eq. (3.3)
The � estimates obtained based on the 2000 Dallas/Fort-Worth on-board transit survey data are reported in Table 3.1. These � values are used as default values in our transit accessibility measure software. Once the parameter estimates from the transit path choice model are obtained, the transit acces-sibility measure with respect to individual n and an origin-destination pair is computed by:
..............................................................................Eq. (3.4)
The logsum of the utilities in the above equation represents the expected “worth” of the set of accessible transit services for the purpose of traveling between the given origin and destination.
Table 3.� Estimation Results for the Transit Path Choice Model
3.3.2 Aggregation of Transit Accessibility MeasuresFor the purpose of assessing the relative levels of transit accessibility in a region, our objec-tive is to report the TAM for user-specified sets of origins and destinations, trip purpose, and demographic groups. To develop such an aggregate TAM, one first considers that an individual n of demographic segment s residing in origin o and wanting to participate in activity purpose p at destination d. Following the TAM definition from equation (3.4), the individual’s perceived transit accessibility for this trip is denoted as:
TAcc (o, s, p, d) = .....................................................................Eq. (3.5)
Variable � Value t-stats
Walk Access Distance (mi) -7.56 -23.254
Total Transit Travel Time (hr) -1.09 -2.788
Total Transit Travel Time (hr) Interacted with Medium/High Income
-2.38 -2.493
Total Transit Travel Time (hr) Interacted with Female
-0.97 -3.645
Total Transit Travel Time (hr) Interacted with Household with More than 1 Vehicle
-3.56 -3.430
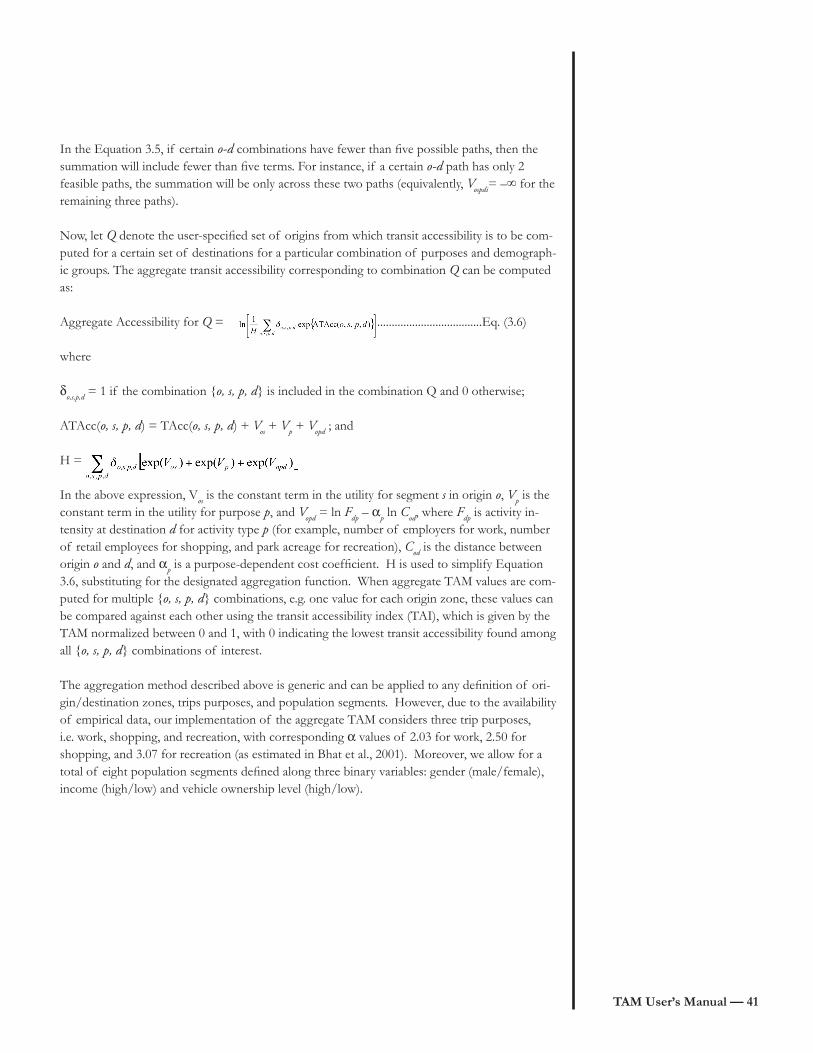
TAM User’s Manual — 4�
In the Equation 3.5, if certain o-d combinations have fewer than five possible paths, then the summation will include fewer than five terms. For instance, if a certain o-d path has only 2 feasible paths, the summation will be only across these two paths (equivalently, Vospdi= –∞ for the remaining three paths).
Now, let Q denote the user-specified set of origins from which transit accessibility is to be com-puted for a certain set of destinations for a particular combination of purposes and demograph-ic groups. The aggregate transit accessibility corresponding to combination Q can be computed as:
Aggregate Accessibility for Q = ....................................Eq. (3.6)
where
�o,s,p,d = 1 if the combination {o, s, p, d} is included in the combination Q and 0 otherwise;
ATAcc(o, s, p, d) = TAcc(o, s, p, d) + Vos + Vp + Vopd ; and
H =
In the above expression, Vos is the constant term in the utility for segment s in origin o, Vp is the constant term in the utility for purpose p, and Vopd = ln Fdp – �p ln Cod, where Fdp is activity in-tensity at destination d for activity type p (for example, number of employers for work, number of retail employees for shopping, and park acreage for recreation), Cod is the distance between origin o and d, and �p is a purpose-dependent cost coefficient. H is used to simplify Equation 3.6, substituting for the designated aggregation function. When aggregate TAM values are com-puted for multiple {o, s, p, d} combinations, e.g. one value for each origin zone, these values can be compared against each other using the transit accessibility index (TAI), which is given by the TAM normalized between 0 and 1, with 0 indicating the lowest transit accessibility found among all {o, s, p, d} combinations of interest.
The aggregation method described above is generic and can be applied to any definition of ori-gin/destination zones, trips purposes, and population segments. However, due to the availability of empirical data, our implementation of the aggregate TAM considers three trip purposes, i.e. work, shopping, and recreation, with corresponding � values of 2.03 for work, 2.50 for shopping, and 3.07 for recreation (as estimated in Bhat et al., 2001). Moreover, we allow for a total of eight population segments defined along three binary variables: gender (male/female), income (high/low) and vehicle ownership level (high/low).
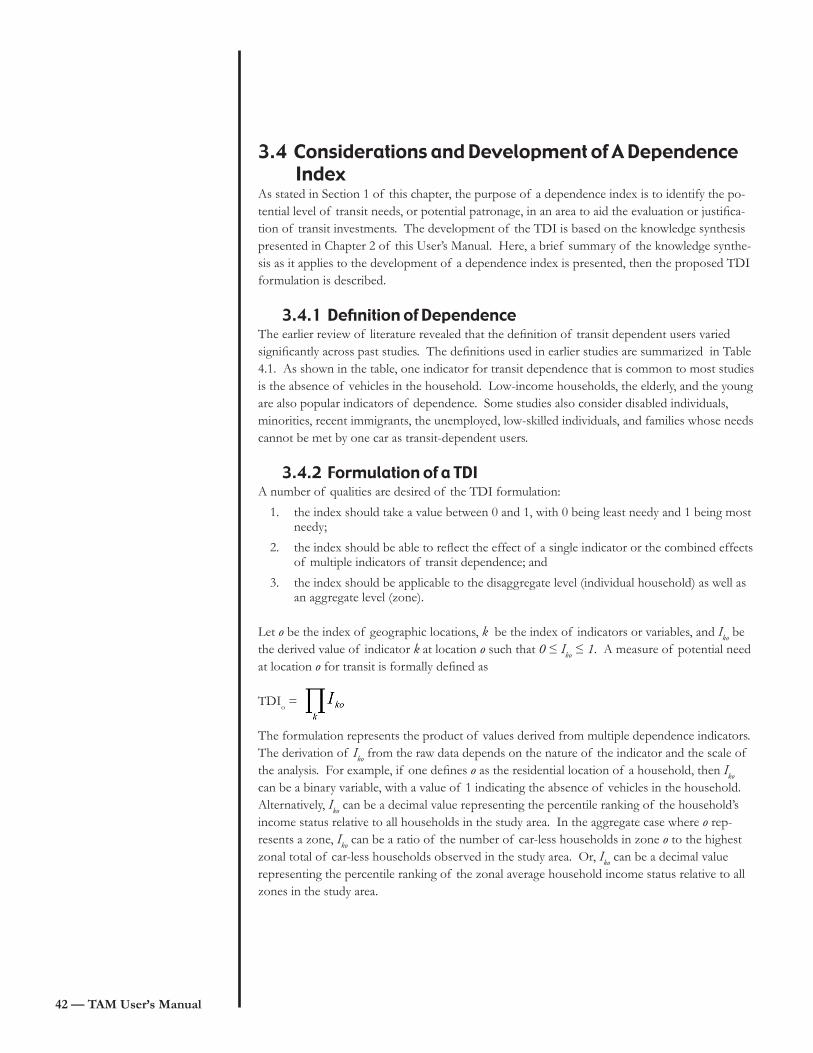
42 — TAM User’s Manual
3.4 Considerations and Development of A Dependence IndexAs stated in Section 1 of this chapter, the purpose of a dependence index is to identify the po-tential level of transit needs, or potential patronage, in an area to aid the evaluation or justifica-tion of transit investments. The development of the TDI is based on the knowledge synthesis presented in Chapter 2 of this User’s Manual. Here, a brief summary of the knowledge synthe-sis as it applies to the development of a dependence index is presented, then the proposed TDI formulation is described.
3.4.1 Definition of DependenceThe earlier review of literature revealed that the definition of transit dependent users varied significantly across past studies. The definitions used in earlier studies are summarized in Table 4.1. As shown in the table, one indicator for transit dependence that is common to most studies is the absence of vehicles in the household. Low-income households, the elderly, and the young are also popular indicators of dependence. Some studies also consider disabled individuals, minorities, recent immigrants, the unemployed, low-skilled individuals, and families whose needs cannot be met by one car as transit-dependent users.
3.4.2 Formulation of a TDIA number of qualities are desired of the TDI formulation:
the index should take a value between 0 and 1, with 0 being least needy and 1 being most needy;
the index should be able to reflect the effect of a single indicator or the combined effects of multiple indicators of transit dependence; and
the index should be applicable to the disaggregate level (individual household) as well as an aggregate level (zone).
Let o be the index of geographic locations, k be the index of indicators or variables, and Iko be the derived value of indicator k at location o such that 0 ≤ Iko ≤ 1. A measure of potential need at location o for transit is formally defined as
TDIo =
The formulation represents the product of values derived from multiple dependence indicators. The derivation of Iko from the raw data depends on the nature of the indicator and the scale of the analysis. For example, if one defines o as the residential location of a household, then Iko can be a binary variable, with a value of 1 indicating the absence of vehicles in the household. Alternatively, Iko can be a decimal value representing the percentile ranking of the household’s income status relative to all households in the study area. In the aggregate case where o rep-resents a zone, Iko can be a ratio of the number of car-less households in zone o to the highest zonal total of car-less households observed in the study area. Or, Iko can be a decimal value representing the percentile ranking of the zonal average household income status relative to all zones in the study area.
1.
2.
3.
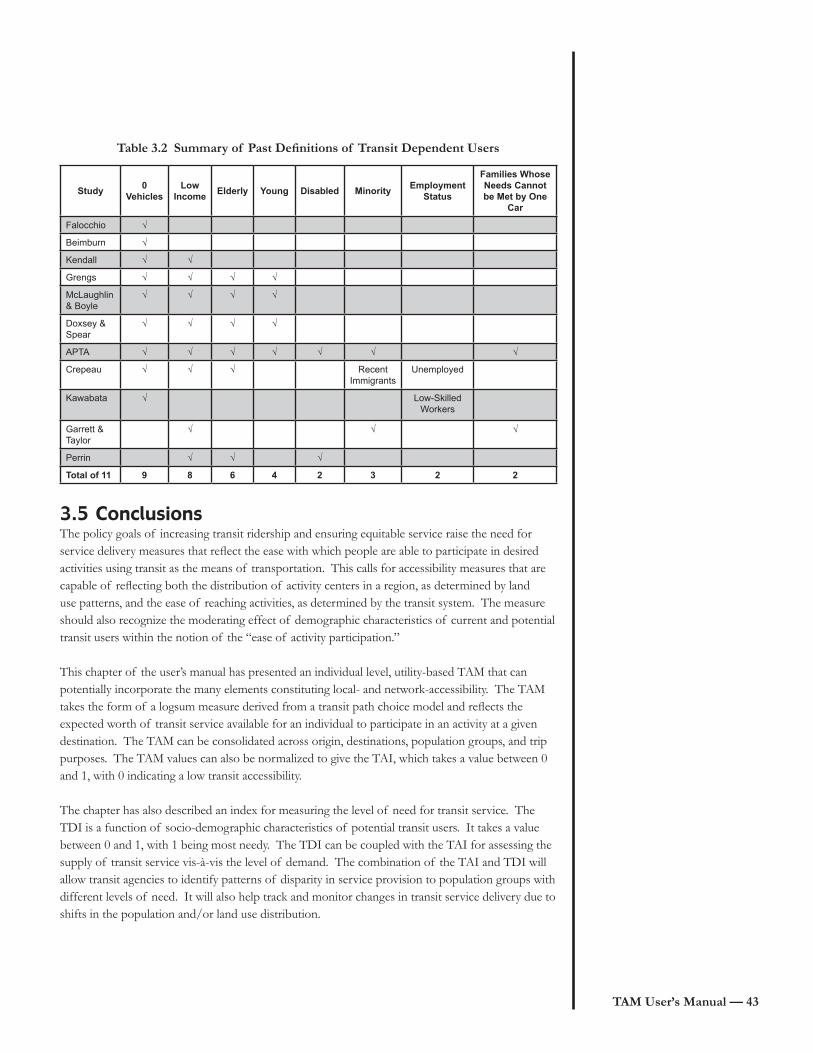
TAM User’s Manual — 43
Table 3.2 Summary of Past Definitions of Transit Dependent Users
3.5 ConclusionsThe policy goals of increasing transit ridership and ensuring equitable service raise the need for service delivery measures that reflect the ease with which people are able to participate in desired activities using transit as the means of transportation. This calls for accessibility measures that are capable of reflecting both the distribution of activity centers in a region, as determined by land use patterns, and the ease of reaching activities, as determined by the transit system. The measure should also recognize the moderating effect of demographic characteristics of current and potential transit users within the notion of the “ease of activity participation.”
This chapter of the user’s manual has presented an individual level, utility-based TAM that can potentially incorporate the many elements constituting local- and network-accessibility. The TAM takes the form of a logsum measure derived from a transit path choice model and reflects the expected worth of transit service available for an individual to participate in an activity at a given destination. The TAM can be consolidated across origin, destinations, population groups, and trip purposes. The TAM values can also be normalized to give the TAI, which takes a value between 0 and 1, with 0 indicating a low transit accessibility.
The chapter has also described an index for measuring the level of need for transit service. The TDI is a function of socio-demographic characteristics of potential transit users. It takes a value between 0 and 1, with 1 being most needy. The TDI can be coupled with the TAI for assessing the supply of transit service vis-à-vis the level of demand. The combination of the TAI and TDI will allow transit agencies to identify patterns of disparity in service provision to population groups with different levels of need. It will also help track and monitor changes in transit service delivery due to shifts in the population and/or land use distribution.
Study0
VehiclesLow
IncomeElderly Young Disabled Minority
Employment Status
Families Whose Needs Cannot be Met by One
Car
Falocchio √
Beimburn √
Kendall √ √
Grengs √ √ √ √
McLaughlin & Boyle
√ √ √ √
Doxsey & Spear
√ √ √ √
APTA √ √ √ √ √ √ √
Crepeau √ √ √ Recent Immigrants
Unemployed
Kawabata √ Low-Skilled Workers
Garrett & Taylor
√ √ √
Perrin √ √ √
Total of 11 9 8 6 4 2 3 2 2

44 — TAM User’s Manual
References
Basar, G. and Bhat, C.R., “A Parameterized Consideration Set Model for Airport Choice: An Application to the San Francisco Bay Area,” Transportation Research Part B, Vol. 38, No. 10, pp. 889-904, 2004.
Bhat, C.R., Handy, S., Kockelman, K., Mahmassani, H., Chen, Q., Srour, I., and Weston, L., “Development of an Urban Accessibility Index: Literature Review,” Report 0-4938-1, pre-pared for the Texas Department of Transportation, October 2000.
Bhat, C., Handy, S., Kockelman, K., Mahmassani, H., Gopal, A., Srour, I. and Weston, L., “De-velopment of an Urban Accessibility Index: Formulations, Aggregation, and Application,” Report 0-4938-4, Prepared for the Texas Department of Transportation, October, 2002.
Bhat, C.R. Guo, J.Y., Sen, S. and Weston, L., “Measuring Access to Public Transportation Services: Review of Customer-Oriented Transit Performance Measures and Methods of Transit Submarket Identification,” Report 0-5178-1, Prepared for the Texas Department of Transportation, October, 2005.
Ben-Akiva, M. and Boccara, B., “Discrete Choice Models with Latent Choice Sets,” International Journal of Research in Marketing, Vol. 12, pp. 9-24, 1995.
Manski, C., “The Structure of Random Utility Models,” Theory and Decision, Vol. 8, pp. 229-254, 1977.
Swait, J. and Ben-Akiva, M., “Incorporating Random Constraints in Discrete Models of Choice Set Generation,” Transportation Research Part B, Vol. 21, No. 2, pp. 91-102, 1987.

TAM User’s Manual — 45
4. Software IntroductionThis software was developed as a TransCAD-based tool to enable transportation professionals to quantify and evaluate the level of transit accessibility at specific geographic levels and specific population subgroups within a given region. The goal is to enable the efficient identification of transit system improvements that will help to achieve a consistent level of transit accessibility from the perspective of the customer. This section provides an introduction to the software, what it was designed to do, and its limitations.
4.1 What Is Included On The DVD
The DVD, included at the back of this book, contains the files outlined below. The DVD contains one main folder labeled ‘TAM’, and four sub-folders labeled ‘Software,’ ‘Applications,’ ‘Manual,’ and ‘Results.’ The ‘Applications’ folder contains seven sub-folders labeled for each of the application cities. The ‘Results’ folder is where the transit accessibility results will be saved. Do not alter the names or locations of these files.
4.1.1 Software Files The following files are found in the ‘Software’ folder:
TAMcode.rsc This is the program code that will be run by TransCAD.
4.1.2 Application FilesThe following folders are found in the ‘Applications’ folder:
‘Austin’ This folder contains the example files for Austin.
‘Corpus_Christi’ This folder contains the example files for Corpus Christi.
‘Dallas’ This folder contains the example files for Dallas.
‘El_Paso’ This folder contains the example files for El Paso.
‘Hidalgo’ This folder contains the example files for Hidalgo.
‘Houston’ This folder contains the example files for Houston.
‘San_Antonio’ This folder contains the example files for San Antonio.
4
4
4
4
4
4
4
4
46 — TAM User’s Manual
The following files (and their support files, which are not listed here) are found in each of these city folders:
Complete_Map.map This is the file that contains all of the city layers.
Streets This is the layer that contains street information.
Endpoints This is the layer that contains endpoint (or node) information.
Transit_Stops This is the layer that contains transit stop information.
Route_System This is the layer that contains route system information.
Zone_Populations This is the database that contains population/zone information.
Transit_Network This is the network that contains network information.
Mode_Table This is the table that contains mode information.
Mode_Xfer_Table This is the table that contains mode transfer information.
4.1.3 Manual FilesThe following files are found in the ‘Manual’ folder:
TAM_Manual.pdf This is an electronic copy of the manual you are using now.
4.2 General Information
4.2.1 Preferred System SpecificationsThe minimum computer specifications required to run the software are around a 2GHz Proces-sor and 2GB of RAM. Understandably, the faster the processor and the more RAM a computer has, the faster the program will run.
4.2.2 Estimated Run Times And FactorsSince the software can calculate transit accessibility between many different combinations of zones (see 4.2.4), the run times will vary greatly. For example, calculating a transit accessibility measure from one origin zone to one destination zone can take about 1 minute. Calculating transit accessibility for many zones to a small central business district (CBD) can take around 10 hours. Calculating transit accessibility from every zone to every other zone can take multiple days.
It is also important to recognize that the program calculates transit accessibility for zones based on randomly selected points in that zone (centroids). The number of centroids is set at 1 as a default, but in the user interface one has the option of increasing this number. The more centroids a zone has, the more iterations the program runs. This results in a more precise acces-sibility measure, but at the cost of increasing the run time.
4
4
4
4
4
4
4
4
4
4
TAM User’s Manual — 4�
4.2.3 Information On Using ArcGIS Files In TransCADThe layers required for this software can be developed in TransCAD or in ArcGIS, if the user is more familiar with this package. Files saved in ArcGIS as shapefiles (with a ‘.shp’ file extension) can be opened in TransCAD, and used to measure transit accessibility.
4.2.4 Software ApplicationsThe software is designed to answer the following questions:
What is the level of transit accessibility (TAM) for a given person residing in a specific zone, desiring to travel to a specific destination for a particular trip purpose?
What is the level of transit accessibility, aggregated over specific user groups and geogra-phies?
For each residential zone in the region, what is the level of transit dependence?
For those zones with high levels of transit dependence, what is the corresponding level of accessibility?
The software can calculate a transit accessibility measure between:
One origin zone to one destination zone
Multiple (or all) origin zones to one destination zone
One origin zone to multiple (or all) destination zones
Multiple (or all) origin zones to multiple (or all) destination zones
Every zone to every zone
4.2.5 Software LimitationsUsers should note the following software limitations:
The software was developed using the 1998 On-Board Survey data from the Dallas Region. As such, it reflects only the preferences and behaviors of bus users. If rail is an available option, the model will assign someone to rail or bus, but the two modes are treated as equivalent options.
The model is focused on a single trip between a given origin-destination pair, so it does not take into account trip-chaining (which is more of a tour-based or activity-based ap-proach) but does allow for transfers.
Due to data limitations in model development, the model reflects whether a transfer is involved, but does not include transfer time penalties.
The initial framework for model estimation includes walk access distance, transit time (in vehicle), the need to transfer, the effect of gender, income, and vehicle ownership, and trip purpose.
4
4
4
4
4
4
4
4
4
4
4
4
4
48 — TAM User’s Manual
4.3 What You Need To Run the Software
This section provides two checklists to make sure the user has all of the required files. If the user has experience with the program, the general checklist will be helpful for quick reminders. If the user does not have experience with the program, the expanded checklist and Section 4.4 Complete Descriptions of Data Requirements’ will be more helpful. It may be helpful for the user to copy or print a copy of these checklists to use when developing a complete data set.
4.3.1 General ChecklistI. Softwareo TransCAD Softwareo Transit Accessibility Resource File (RSC file) II. Layerso Zone Layerso Origin Zone(s) Selection Seto Destination Zone(s) Selection Seto Street Network Layero Endpoints/Nodes Layero Transit Stops/Stations Layero Route System Layer III. Other Elementso Table of Demographic Group Populations in Each Zone (dBASE file)o Transit Route Networko Mode Table (TransCAD Dataview)o Mode Transfer Table (TransCAD Dataview)

TAM User’s Manual — 4�
4.3.2 Expanded ChecklistI. Softwareo TransCAD Softwareo Transit Accessibility Resource File (RSC file) II. Layerso Zone Layers oVariable: “ID” Unique Computer Assigned Number per Zone oVariable: “AreaID” Official Block or Zone ID oVariable: “WorkArea” Square Miles of Employment Land-Use in Zone oVariable: “ShopArea” Square Miles of Retail Land-Use in Zone oVariable: “OtherArea” Square Miles of Recreational Land-Use in Zoneo Origin Zone(s) Selection Seto Destination Zone(s) Selection Seto Street Network Layer oVariable: “ID” Unique Computer Assigned Number per Street Link oVariable: “Length” Length of Street Linko Endpoints/Nodes Layer oVariable: “ID” Unique Computer Assigned Number per Endpoint oVariable: “Longitude” Longitude of Endpoint oVariable: “Latitude” Latitude of Endpointo Transit Stops/Stations Layer oVariable: “ID” Unique Computer Assigned Number per Stop oVariable: “Longitude” Longitude of Stop oVariable: “Latitude” Latitude of Stop oVariable: “Close_End” ID of the Closest Endpoint to the Stopo Route System Layer III. Other Elementso Table of Demographic Group Populations in Each Zone (dBASE file) oColumn Name: AreaID The Official Block or Zone ID oColumn Name: Cat1 Population that Fits Category 1 (see description) oColumn Name: Cat2 Population that Fits Category 2 (see description) oColumn Name: Cat3 Population that Fits Category 3 (see description) oColumn Name: Cat4 Population that Fits Category 4 (see description) oColumn Name: Cat5 Population that Fits Category 5 (see description) oColumn Name: Cat6 Population that Fits Category 6 (see description) oColumn Name: Cat7 Population that Fits Category 7 (see description) oColumn Name: Cat8 Population that Fits Category 8 (see description)o Transit Route Networko Mode Table (TransCAD Dataview)o Mode Transfer Table (TransCAD Dataview)

50 — TAM User’s Manual
4.4 Complete Descriptions of Data Requirements
This section details all of the required data files needed to run the Transit Accessibility Software. Please note that complete copies of these files for the seven application areas are available on the DVD. These may be used as examples/guides to set up files or to directly run the software and get sample results.
4.4.1 Layer Details�. Origin Zones Layers
Purpose: This layer gives TransCAD information about the different census blocks or zones (whichever the user prefers) for the area being analyzed.
Named: Whatever the user prefers.
Format: Polygon geographic file, with a ‘.dbd’ extension (or a TransCAD compatible ‘.shp’ extension).
Created By: Census Data.
Must Include: The table associated with this layer must contain a row for each census block or zone in the area being analyzed. Each row must contain the following informa-tion with these exact variable names:
ID: A Computer assigned ID
AREAID: The official block or zone ID (supplied by the census or planning organiza-tion)
WORKAREA: Square miles of Employment Land-Use in Zone
SHOPAREA: Square miles of Retail Land-Use in Zone
OTHERAREA: Square miles of Recreational Land-Use in Zone
2. Destination Zones Layer
Purpose: This layer gives TransCAD information about the different census blocks or zones (whichever the user prefers) for the area being analyzed. This can be the same file as the Origin Zone Layer.
Named: Whatever the user prefers.
Format: Polygon geographic file, with a ‘.dbd’ extension (or a TransCAD compatible ‘.shp’ extension).
Created By: Census Data.
Must Include: The table associated with this layer must contain a row for each census block or zone in the area being analyzed. Each row must contain the following informa-tion with these exact variable names.
ID: A Computer assigned ID
AREAID: The official block or zone ID (supplied by the census or planning organiza-tion)
WORKAREA: Square miles of Employment Land-Use in Zone
SHOPAREA: Square miles of Retail Land-Use in Zone
OTHERAREA: Square miles of Recreational Land-Use in Zone
4
4
4
4
4
6
6
6
6
6
4
4
4
4
4
6
6
6
6
6
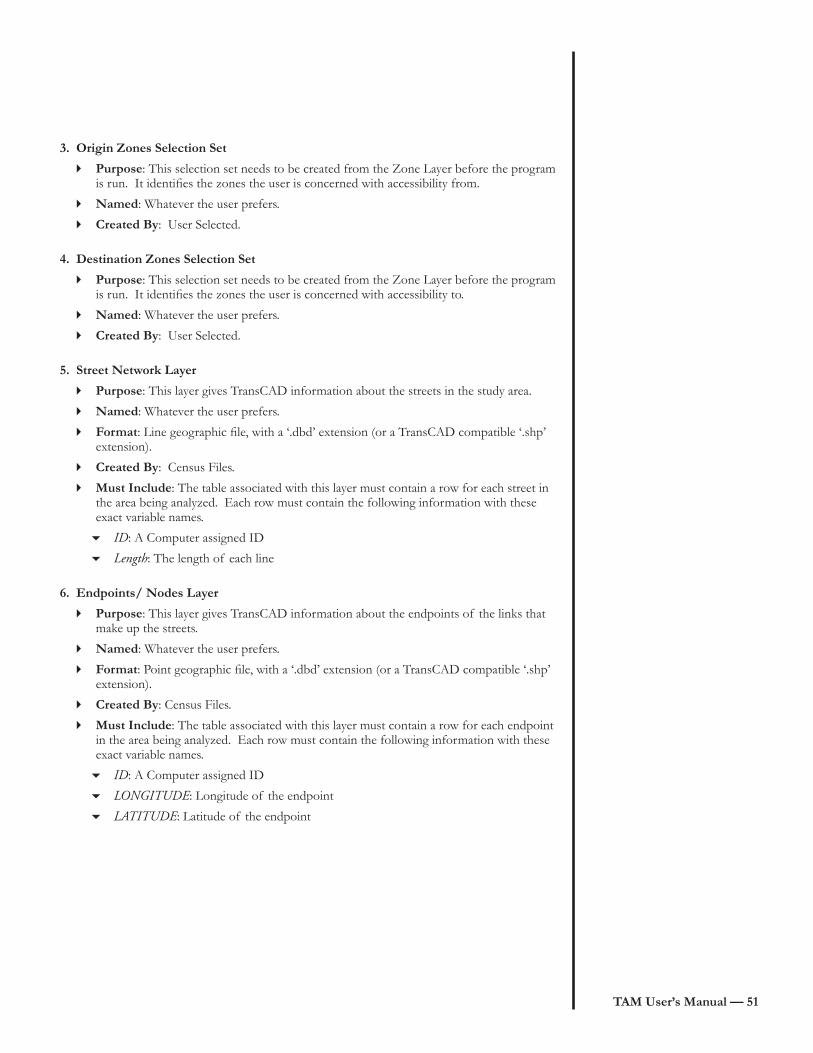
TAM User’s Manual — 5�
3. Origin Zones Selection Set
Purpose: This selection set needs to be created from the Zone Layer before the program is run. It identifies the zones the user is concerned with accessibility from.
Named: Whatever the user prefers.
Created By: User Selected.
4. Destination Zones Selection Set
Purpose: This selection set needs to be created from the Zone Layer before the program is run. It identifies the zones the user is concerned with accessibility to.
Named: Whatever the user prefers.
Created By: User Selected.
5. Street Network Layer
Purpose: This layer gives TransCAD information about the streets in the study area.
Named: Whatever the user prefers.
Format: Line geographic file, with a ‘.dbd’ extension (or a TransCAD compatible ‘.shp’ extension).
Created By: Census Files.
Must Include: The table associated with this layer must contain a row for each street in the area being analyzed. Each row must contain the following information with these exact variable names.
ID: A Computer assigned ID
Length: The length of each line
6. Endpoints/ Nodes Layer
Purpose: This layer gives TransCAD information about the endpoints of the links that make up the streets.
Named: Whatever the user prefers.
Format: Point geographic file, with a ‘.dbd’ extension (or a TransCAD compatible ‘.shp’ extension).
Created By: Census Files.
Must Include: The table associated with this layer must contain a row for each endpoint in the area being analyzed. Each row must contain the following information with these exact variable names.
ID: A Computer assigned ID
LONGITUDE: Longitude of the endpoint
LATITUDE: Latitude of the endpoint
4
4
4
4
4
4
4
4
4
4
4
6
6
4
4
4
4
4
6
6
6

52 — TAM User’s Manual
�. Transit Stops/ Stations Layer
Purpose: This layer gives TransCAD information about the route stops available in the transit network.
Named: Whatever the user prefers.
Format: Point geographic file, with a ‘.dbd’ extension (or a TransCAD compatible ‘.shp’ extension).
Created By: MPO or Transit Agencies. If not available, User Created.
Must Include: The table associated with this layer must contain a row for each stop in the area being analyzed. Each row must contain the following information with these exact variable names.
ID: A Computer assigned ID
LONGITUDE: Longitude of the centroid of each block or zone
LATITUDE: Latitude of the centroid of each block or zone
Close_End: The closest endpoint to each transit stop
8. Route System Layer
Purpose: This file combines the endpoints and streets to create a file that can be used in determining shortest path.
Named: Whatever the user prefers.
Format: Follow the required TransCAD steps to create this file.
Created By: MPO or Transit Agencies. If not available, User Created.
4.4.2 Other Element Details�. Table of Demographic Group Population In Each Zone
Purpose: This table describes the number of resident in each of the 8 different popula-tion groups present in each zone or block.
Named: Whatever the user prefers.
Format: Database file, with a ‘.dbf ’ extension.
Created By: Use Census Data to create this database table in any database software.
Must Include: There must be one row for each zone or block, and each row must con-tain the following information with these exact variable names…
AREAID: The official block or zone ID (supplied by the census or planning organiza-tion)
Cat1: Number of Male, Medium/High Income, HH Owns 2 or More Cars
Cat2: Number of Male, Medium/High Income, HH Owns 1 Car
Cat3: Number of Male, Low Income, HH Owns 2 or More Cars
Cat4: Number of Male, Low Income, HH Owns 1 Car
Cat5: Number of Female, Medium/High Income, HH Owns 2 or More Cars
Cat6: Number of Female, Medium/High Income, HH Owns 1 Car
Cat7: Number of Female, Low Income, HH Owns 2 or More Cars
Cat8: Number of Female, Low Income, HH Owns 1 Car
4
4
4
4
4
6
6
6
6
4
4
4
4
4
4
4
4
4
6
6
6
6
6
6
6
6
6

TAM User’s Manual — 53
2. Transit Network
Purpose: This file combines all the information regarding the transit system into some-thing that TransCAD can use to determine shortest paths.
Named: Whatever the user prefers.
Format: Follow the required TransCAD steps to create this file. It will be a ‘.tnw’ exten-sion.
Created By: Created by User in TransCAD, see TransCAD manual.
3. Mode Table
Purpose: This file contains specific cost and travel information about the different modes available in the transit system. This file is used in determining shortest path travel.
Named: Whatever the user prefers.
Format: Follow the required TransCAD steps to create this file. It will be a TransCAD Dataview file, with a ‘.dat’ extension.
Created By: Created by User in Excel. 4. Mode Transfer Table
Purpose: This file contains specific additional cost and travel information about transfers between modes available in the transit system. This file is used in determining shortest path travel.
Named: Whatever the user prefers.
Format: Follow the required TransCAD steps to create this file. It will be a TransCAD Dataview file, with a ‘.dat’ extension.
Created By: Created by User in Excel.
5. OPTIONAL: Zone Purpose Table
Important Note: The program automatically includes default values, based on the city size. When this screen appears, choose ‘OK’ to use the default values or choose ‘Edit’ to add actual data.
Purpose: This table describes the types of trips the different population groups take.
Created By: Created by User from survey data.
Must Include: This table includes the breakdown of trips from each zone, based on each population type category and their trip purposes.
The trip purposes are as follows:
Purpose 1: Stands for Work Trips
Purpose 2: Stands for Shopping Trips
Purpose 3: Stands for Other Trips
4
4
4
4
4
4
4
4
4
4
4
4
4
4
4
4
4
6
6
6
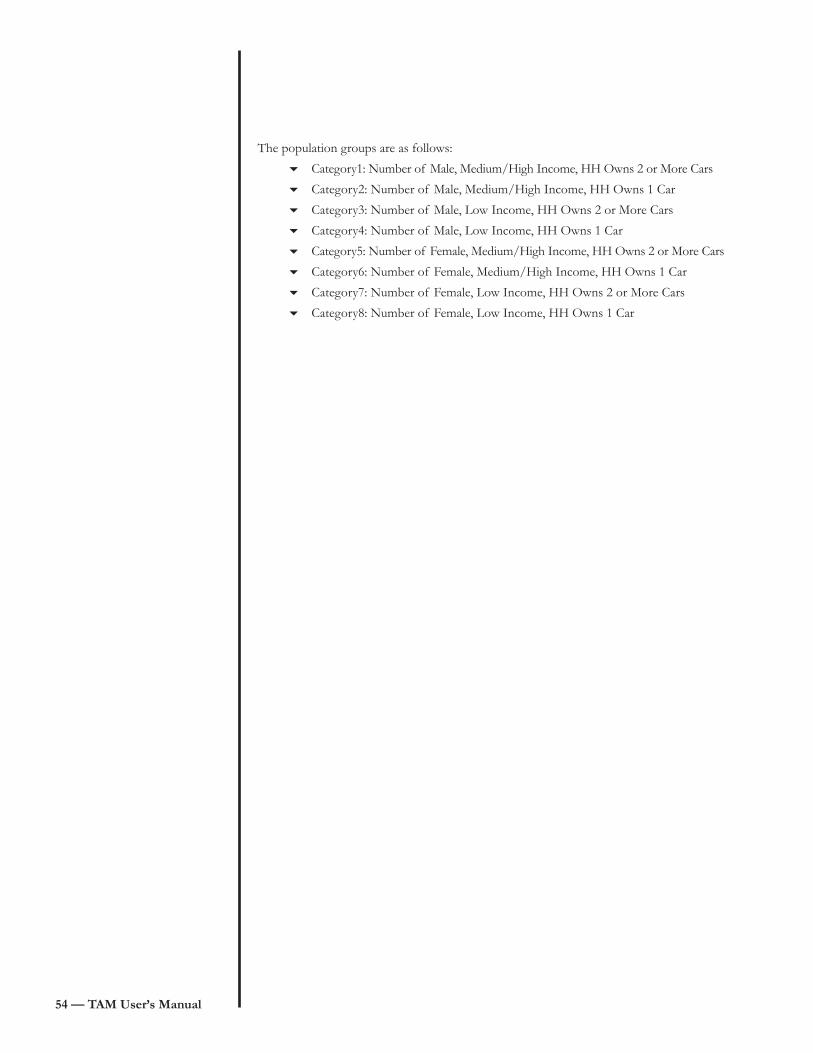
54 — TAM User’s Manual
The population groups are as follows:
Category1: Number of Male, Medium/High Income, HH Owns 2 or More Cars
Category2: Number of Male, Medium/High Income, HH Owns 1 Car
Category3: Number of Male, Low Income, HH Owns 2 or More Cars
Category4: Number of Male, Low Income, HH Owns 1 Car
Category5: Number of Female, Medium/High Income, HH Owns 2 or More Cars
Category6: Number of Female, Medium/High Income, HH Owns 1 Car
Category7: Number of Female, Low Income, HH Owns 2 or More Cars
Category8: Number of Female, Low Income, HH Owns 1 Car
6
6
6
6
6
6
6
6

TAM User’s Manual — 55
5. Software User’s ManualThe purpose of this section is to provide step-by-step instructions for (1) installing the software, (2) running the software components, and (3) understanding the results/output. Please note that sample data files are available on the DVD for seven Texas cities.
5.1 Installing the Software
5.1.1 Saving DVD Contents to the Computer
STEP �: Open DVD
Put DVD into computer, and open window to display contents.
Right-Click folder TAM.
Select Copy.
STEP 2: Copy DVD Contents
Open Local Disk (C:) in a window.
Right-Click any blank space in this window.
Select Paste.
The files are now saved.
5.1.2 Setting up the Software
NOTE: This must be done every time you want to run the software.
STEP �: Open all Required Layers/Tables
In TransCAD, create a map with all of the required tables and layers. Please refer to Section 4.3 and 4.4 for the list of specific layers required.
STEP 2: Installation
Click on Tools > Add-Ins.
Select GIS Developer’s Kit (GISDK). Click OK.
1.
2.
3.
1.
2.
3.
4.
1.
1.
2.
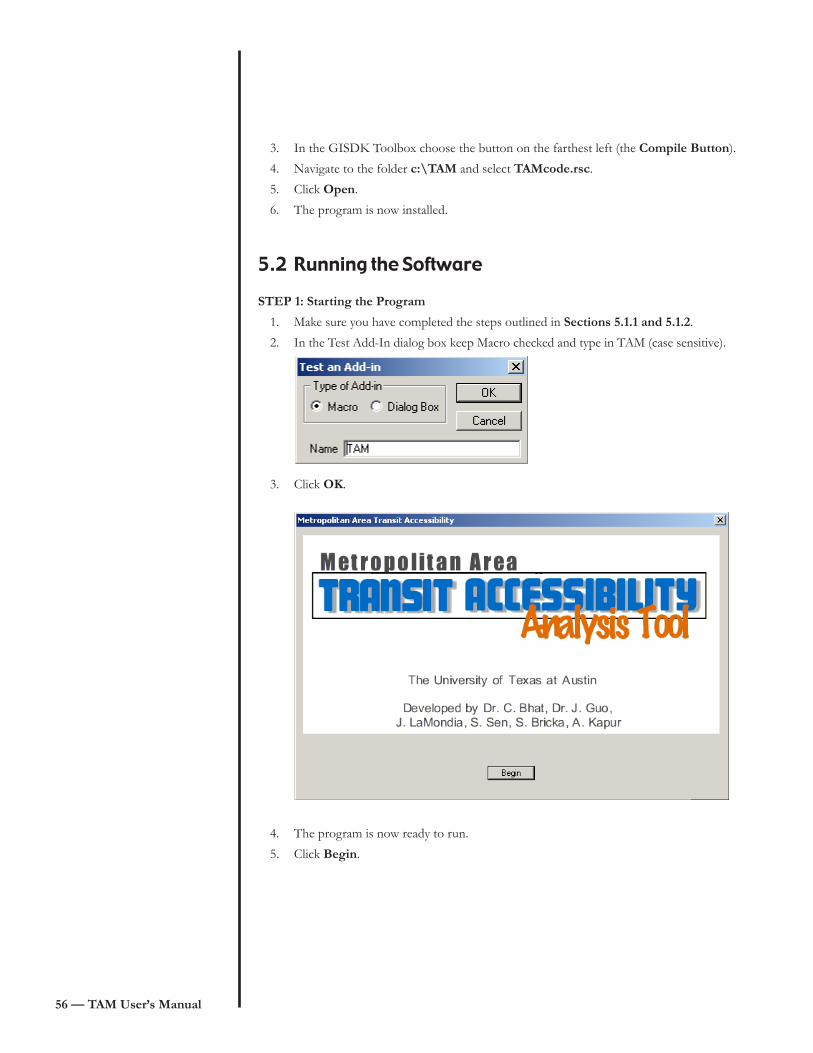
56 — TAM User’s Manual
In the GISDK Toolbox choose the button on the farthest left (the Compile Button).
Navigate to the folder c:\TAM and select TAMcode.rsc.
Click Open.
The program is now installed.
5.2 Running the Software
STEP �: Starting the Program
Make sure you have completed the steps outlined in Sections 5.�.� and 5.�.2.
In the Test Add-In dialog box keep Macro checked and type in TAM (case sensitive).
Click OK.
The program is now ready to run.
Click Begin.
3.
4.
5.
6.
1.
2.
3.
4.
5.
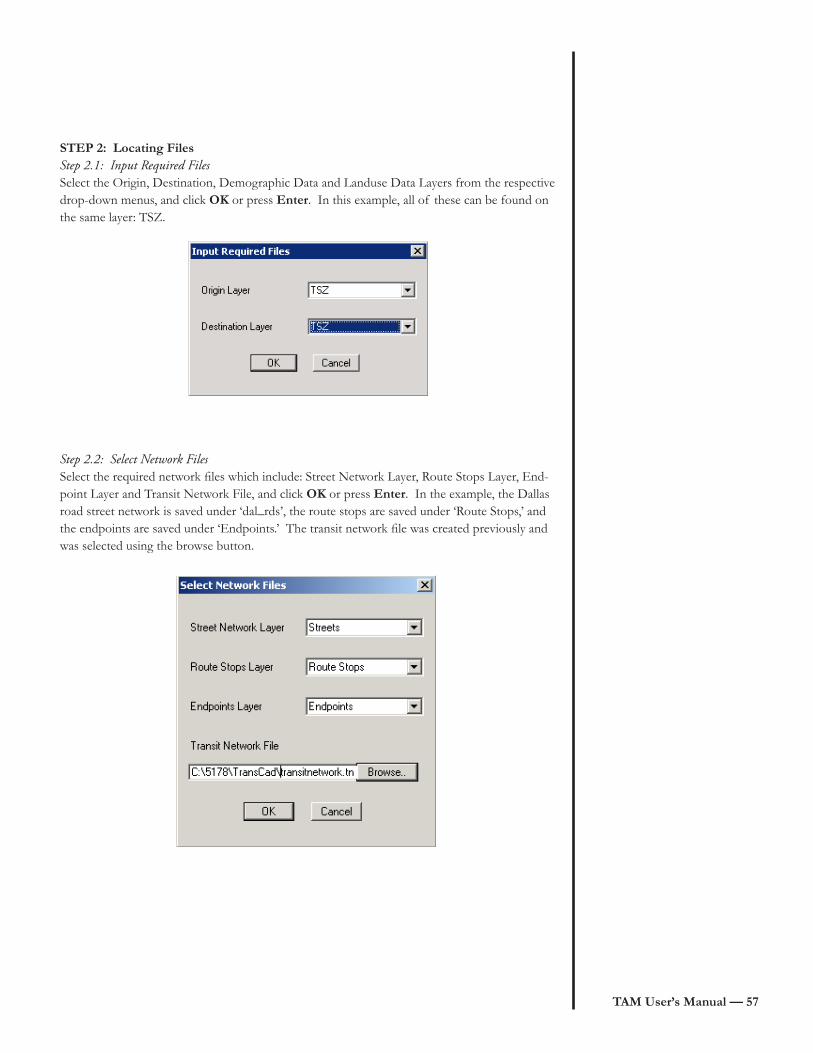
TAM User’s Manual — 5�
STEP 2: Locating FilesStep 2.1: Input Required FilesSelect the Origin, Destination, Demographic Data and Landuse Data Layers from the respective drop-down menus, and click OK or press Enter. In this example, all of these can be found on the same layer: TSZ.
Step 2.2: Select Network FilesSelect the required network files which include: Street Network Layer, Route Stops Layer, End-point Layer and Transit Network File, and click OK or press Enter. In the example, the Dallas road street network is saved under ‘dal_rds’, the route stops are saved under ‘Route Stops,’ and the endpoints are saved under ‘Endpoints.’ The transit network file was created previously and was selected using the browse button.
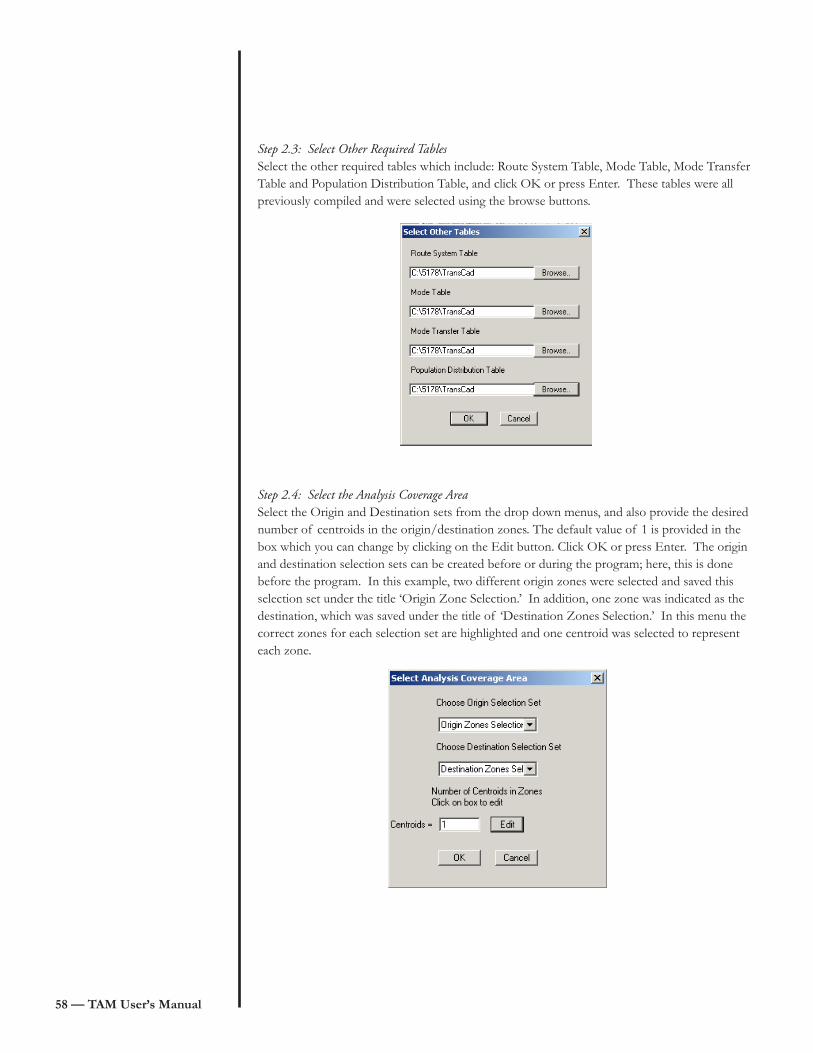
58 — TAM User’s Manual
Step 2.3: Select Other Required TablesSelect the other required tables which include: Route System Table, Mode Table, Mode Transfer Table and Population Distribution Table, and click OK or press Enter. These tables were all previously compiled and were selected using the browse buttons.
Step 2.4: Select the Analysis Coverage AreaSelect the Origin and Destination sets from the drop down menus, and also provide the desired number of centroids in the origin/destination zones. The default value of 1 is provided in the box which you can change by clicking on the Edit button. Click OK or press Enter. The origin and destination selection sets can be created before or during the program; here, this is done before the program. In this example, two different origin zones were selected and saved this selection set under the title ‘Origin Zone Selection.’ In addition, one zone was indicated as the destination, which was saved under the title of ‘Destination Zones Selection.’ In this menu the correct zones for each selection set are highlighted and one centroid was selected to represent each zone.
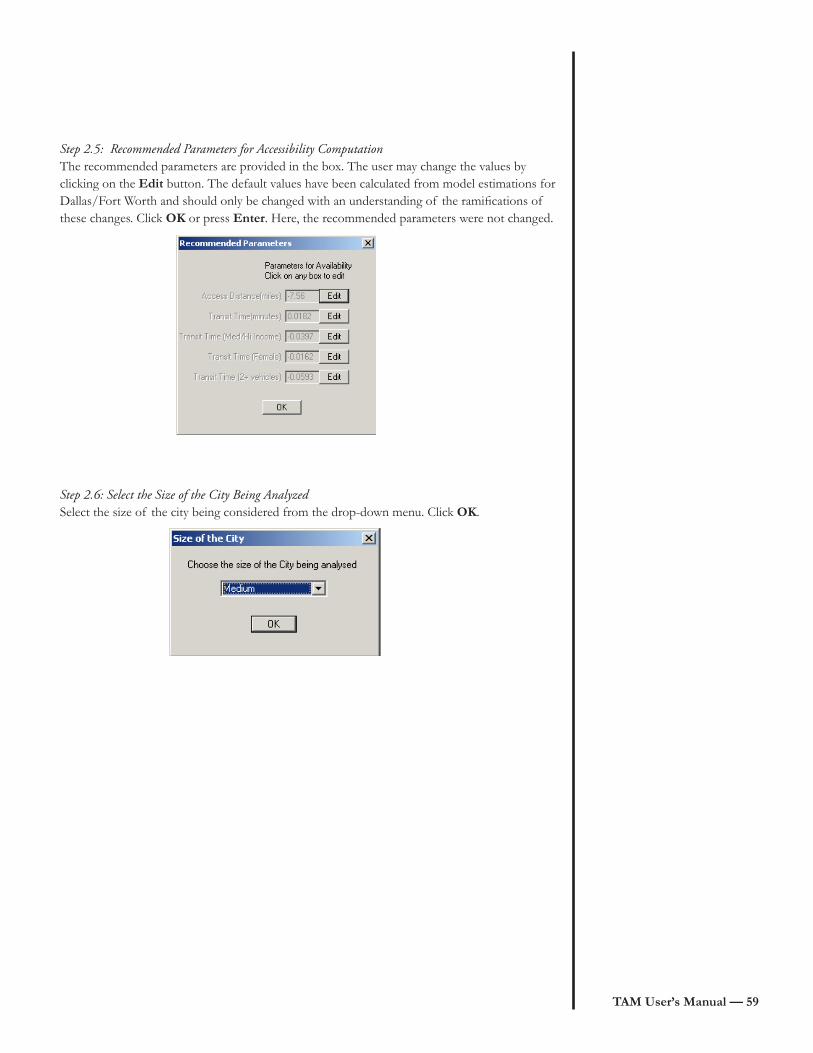
TAM User’s Manual — 5�
Step 2.5: Recommended Parameters for Accessibility Computation The recommended parameters are provided in the box. The user may change the values by clicking on the Edit button. The default values have been calculated from model estimations for Dallas/Fort Worth and should only be changed with an understanding of the ramifications of these changes. Click OK or press Enter. Here, the recommended parameters were not changed.
Step 2.6: Select the Size of the City Being AnalyzedSelect the size of the city being considered from the drop-down menu. Click OK.
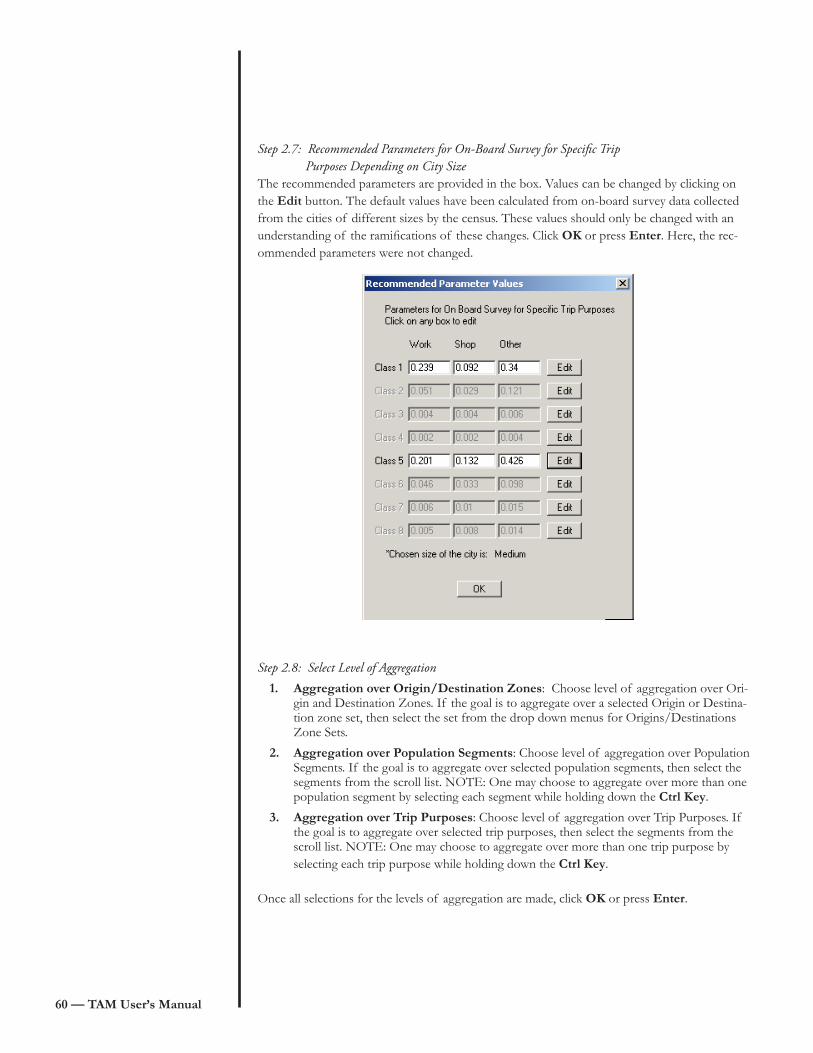
60 — TAM User’s Manual
Step 2.7: Recommended Parameters for On-Board Survey for Specific Trip Purposes Depending on City SizeThe recommended parameters are provided in the box. Values can be changed by clicking on the Edit button. The default values have been calculated from on-board survey data collected from the cities of different sizes by the census. These values should only be changed with an understanding of the ramifications of these changes. Click OK or press Enter. Here, the rec-ommended parameters were not changed.
Step 2.8: Select Level of AggregationAggregation over Origin/Destination Zones: Choose level of aggregation over Ori-gin and Destination Zones. If the goal is to aggregate over a selected Origin or Destina-tion zone set, then select the set from the drop down menus for Origins/Destinations Zone Sets.
Aggregation over Population Segments: Choose level of aggregation over Population Segments. If the goal is to aggregate over selected population segments, then select the segments from the scroll list. NOTE: One may choose to aggregate over more than one population segment by selecting each segment while holding down the Ctrl Key.
Aggregation over Trip Purposes: Choose level of aggregation over Trip Purposes. If the goal is to aggregate over selected trip purposes, then select the segments from the scroll list. NOTE: One may choose to aggregate over more than one trip purpose by selecting each trip purpose while holding down the Ctrl Key.
Once all selections for the levels of aggregation are made, click OK or press Enter.
�.
2.
3.
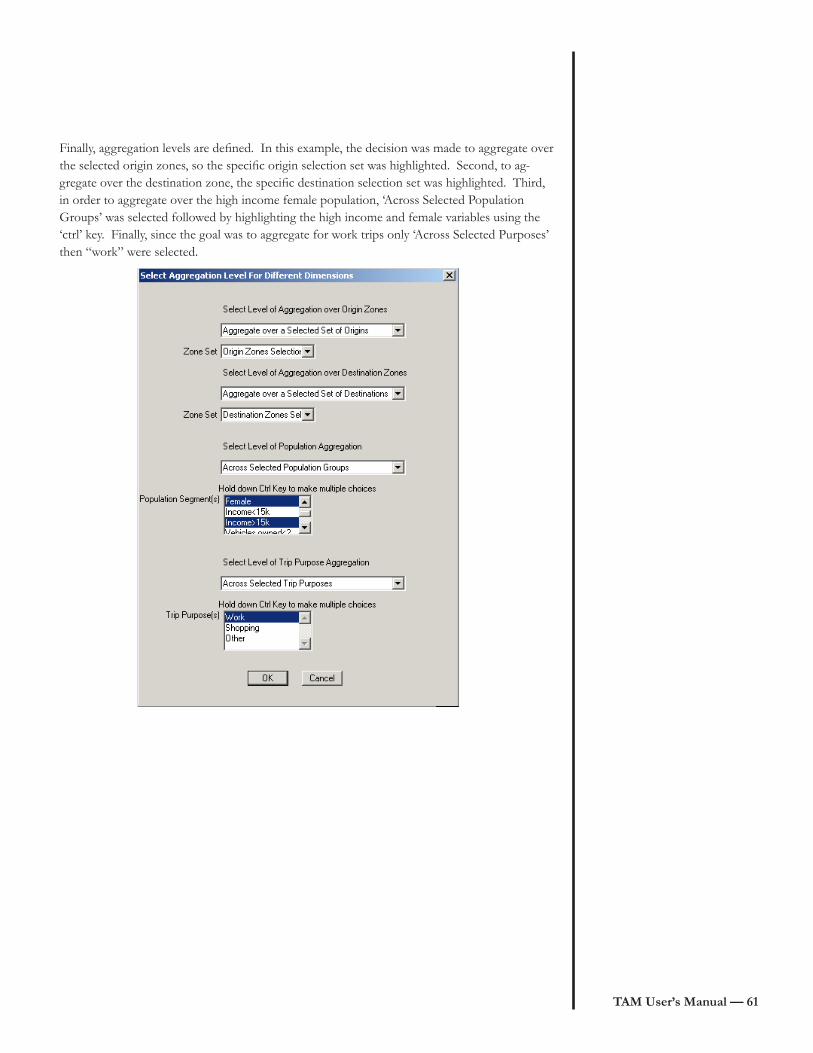
TAM User’s Manual — 6�
Finally, aggregation levels are defined. In this example, the decision was made to aggregate over the selected origin zones, so the specific origin selection set was highlighted. Second, to ag-gregate over the destination zone, the specific destination selection set was highlighted. Third, in order to aggregate over the high income female population, ‘Across Selected Population Groups’ was selected followed by highlighting the high income and female variables using the ‘ctrl’ key. Finally, since the goal was to aggregate for work trips only ‘Across Selected Purposes’ then “work” were selected.

62 — TAM User’s Manual
Some Common Aggregation Schemes:
If you are interested in comparing the transit accessibility of different origin zones, select:
No aggregation over origin zones
Aggregation over all destination zones
Aggregation over all population groups
Aggregation over all trip purposes
If you are interested in comparing the transit accessibility of different origin areas, select:
Aggregation over select origin zones
(Combine those zones you wish to group together in a selection set)
Aggregation over all destination zones
Aggregation over all population groups
Aggregation over all trip purposes
If you are interested in comparing the transit accessibility of two cities, select:
Aggregation over all origin zones
Aggregation over all destination zones
Aggregation over all population groups
Aggregation over all trip purposes
If you are interested in comparing the transit accessibility for different groups, select:
Aggregation over all origin zones
Aggregation over all destination zones
Aggregation over select population groups
Aggregation over all trip purposes
If you are interested in comparing the transit accessibility for different purposes, select:
Aggregation over all origin zones
Aggregation over all destination zones
Aggregation over all population groups
Aggregation over select trip purposes
4
4
4
4
4
4
4
4
4
4
4
4
4
4
4
4
4
4
4
4
4
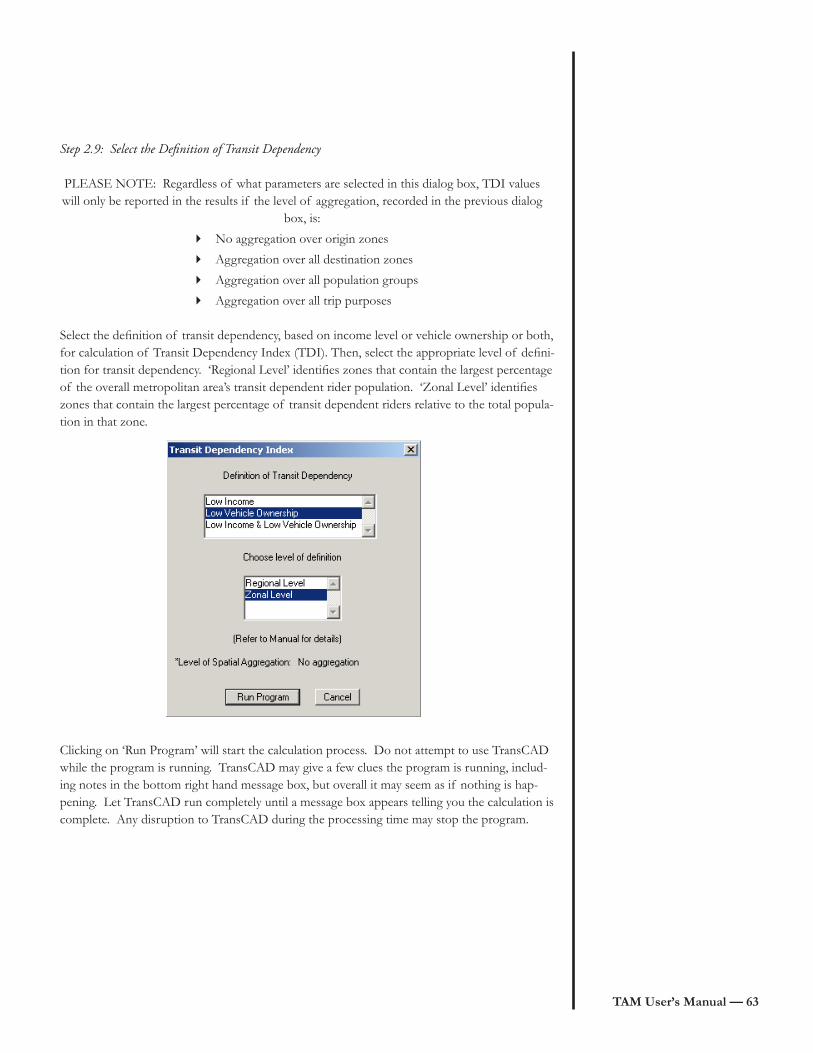
TAM User’s Manual — 63
Step 2.9: Select the Definition of Transit Dependency
PLEASE NOTE: Regardless of what parameters are selected in this dialog box, TDI values will only be reported in the results if the level of aggregation, recorded in the previous dialog
box, is:
No aggregation over origin zones
Aggregation over all destination zones
Aggregation over all population groups
Aggregation over all trip purposes
Select the definition of transit dependency, based on income level or vehicle ownership or both, for calculation of Transit Dependency Index (TDI). Then, select the appropriate level of defini-tion for transit dependency. ‘Regional Level’ identifies zones that contain the largest percentage of the overall metropolitan area’s transit dependent rider population. ‘Zonal Level’ identifies zones that contain the largest percentage of transit dependent riders relative to the total popula-tion in that zone.
Clicking on ‘Run Program’ will start the calculation process. Do not attempt to use TransCAD while the program is running. TransCAD may give a few clues the program is running, includ-ing notes in the bottom right hand message box, but overall it may seem as if nothing is hap-pening. Let TransCAD run completely until a message box appears telling you the calculation is complete. Any disruption to TransCAD during the processing time may stop the program.
4
4
4
4

64 — TAM User’s Manual
5.3 Understanding the Results
5.3.1 Reading the ResultsAll results are saved as text files in the C:\\TAM\Results folder.
IMPORTANT NOTE: Each iteration of the program overwrites the results from the previous iteration. If you would like to save the results from an analysis, make sure to move, copy, or rename those files.
Results will include 3 different files:
Transit_Accessibility_Summary.txt This text file outlines the other output files and how they relate. This file contains gen-eral information, and a reminder to move, copy, or rename the files for future use.
Transit_Aggregation_List.txt This text file lists all of the aggregation groups (based on the selected zone, population, and trip purpose) that an accessibility measure is being calculated for. The order of ag-gregation groups in this file matches the order of transit accessibility indices in the next file.
Transit_Accessibility_Measures.txt This text file lists the accessibility indices of each aggregation group (based on the se-lected zone, population, and trip purpose). The order of the indices in this file matches the order of the aggregation groups listed in the previous file.
5.3.2 Using the ResultsIf the results are calculated for each zone, the lists of results can be used to create a visual the-matic map. The following steps outline how to create these thematic maps.
Import the text file of results into Excel, Access, or another spreadsheet/database soft-ware.
In TransCAD, edit the Zone table to include a new field labeled ‘TAM.’
With only the origin selection set visible, copy in the table of results from Excel (or other spreadsheet/ database software) into ‘TAM’ fields.
Choose the Zone layer as the current layer.
Click Map > Color Theme.
In the pop-up window choose the TAM variable and a color/grouping scheme.
Click OK. The map will show the results.
4
4
4
1.
2.
3.
4.
5.
6.
7.

TAM User’s Manual — 65
6. ApplicationsChanging land uses and population distributions can greatly affect transit ridership. Therefore the ability to analyze alternate routes and possible future development of the transit system is very important to public agencies and transit operators. This section starts by describing how this software can assist the user in completing this work by evaluating accessibility on the cur-rent transit network or different configurations of the network, including service expansion/en-hancement and changes in design and/or placement of stops.
This section also describes the kind of data required to further develop this software. This soft-ware was developed based on the data available at that time, and will be enhanced by collecting more complete datasets in the future. The list in this section details the types of information that will be used in future versions.
6.1 Service Expansion/EnhancementThe first application topic is service expansion/enhancement. This type of analysis includes adding additional routes to areas without current service, additional routes to areas with current service, or realignment of current routes. To analyze the change, run the TAM software on the current network to evaluate the current level of accessibility. Next, in TransCAD, make the pos-sible changes to the network by adding additional routes or reconfiguring current routes (using the steps outlined below). Finally, rerun the TAM software to get the new levels of accessibility. The results of the before and after accessibility results can be compared, and used to support whether a network change might be an improvement or not.
To make changes to the network routes:Make sure the current layer is set to the Route System.
Click Route Systems > Editing Toolbox
The following toolbox will appear:
Click the arrow icon and select a route
To add a new route, click the ‘Add New Route’ Icon
To realign a route, click the ‘Realign Routes’ Icon
Edit the route endpoints/nodes of the network
Please refer to the TransCAD manual for more details.
4
4
4
4
4
4
4

66 — TAM User’s Manual
6.2 Stop Design/PlacementThe second application topic is service stop design/placement. This type of analysis includes adding stops to a transit route, removing stops from a transit route, and updating layouts and/or designs of stops. To analyze the change, run the TAM software on the current network to evaluate the current level of accessibility. Next, in TransCAD, make the possible changes to the stops by adding additional stops or reconfiguring current stops (using the steps outlined below). Finally, rerun the TAM software to get the new levels of accessibility. The results of the before and after accessibility results can be compared, and used to support whether a network change might be an improvement or not.
To make changes to the network stops:Make sure the current layer is set to the Route System.
Click Route Systems > Editing Toolbox
The following toolbox will appear:
Click the arrow icon and select a route.
To add a new stop, click the ‘Add A Stop’ Icon
To delete a stop, click the ‘Remove A Stop’ Icon
Edit the route stops of the network
Please refer to the TransCAD manual for more details.
6.3 Additional Data RequirementsThe current software is designed for fixed-route transit systems, and it focuses on the travel time, access distance, and users’ perceptions of these characteristics since these were the transit characteristics available when the model was developed. Obviously, transit systems and transit users are defined by more than just these characteristics; Transit systems are dynamic and are greatly affected by other time-dependent characteristics, including wait times, reliability, lag times, schedules, headways, delays, and time-of day factors. Similarly, transit systems commonly include multiple modes, different types of vehicles, and different scheduling systems (including demand-response).
New datasets and surveys will be used to expand the software to include these new travel char-acteristics. Users of the software are encouraged to collect these additional types of informa-tion as they collect and format the data required to run the current software. This way, users will have the proper data readily available to use when the enhanced software is released.
4
4
4
4
4
4
4

TAM User’s Manual — 6�
The research team is also looking for additional ways to enhance the software. If there is a function or characteristic that you would like to see included in the next version of the software, please contact the team. Contact information is included in the next section.
6.4 Contact InformationThe research team is available for:
Feedback on How to Improve the Software
Technical Support in Using the Software
Technical Support in Setting Up the Required Datasets and Layers
General Information
On-Site Workshops
If you would like to contact the team, please do so by:Email: [email protected]: (512) 471-4535Fax: (512) 475-8744
4
4
4
4
4