Embed Size (px)
Citation preview

APEC Project: TWG 01 2014A Produced by
International Air Transport Association
Head Office Canada: 800 Place Victoria, PO Box 113 Montreal H4Z 1M1, Quebec, Canada www.iata.org/consulting For Asia-Pacific Economic Cooperation Secretariat 35 Heng Mui Keng Terrace Singapore 119616 Tel: (65) 68919 600 Fax: (65) 68919 690 Email: [email protected] Website: www.apec.org © 2016 APEC Secretariat APEC#216-TO-01.19
APEC Project TWG 01 2014A – Develop Air Connectivity in the APEC Region 3
Table of contents Glossary ………………………………………………………………………………………………………………………………………………..5
List of Abbreviations ..................................................................................................................................... 5
1. Introduction to the project ......................................................................................................... 10
2. Approach followed and data used .............................................................................................. 11
2.1 Data fueling the model ............................................................................................................... 11
2.2 Gap analysis ................................................................................................................................ 12
2.3 Induction ..................................................................................................................................... 13
2.4 Connecting potential .................................................................................................................. 14
2.5 Demand growth .......................................................................................................................... 15
2.6 Other ........................................................................................................................................... 15
2.7 Final route forecast ..................................................................................................................... 16
3. Singapore .................................................................................................................................... 16
3.1 Economy and demographics ...................................................................................................... 16
3.1.1 Demographics ............................................................................................................................. 16
3.1.2 Economy ..................................................................................................................................... 17
3.1.3 Tourism ....................................................................................................................................... 17
3.2 Aviation demand ........................................................................................................................ 18
3.2.1 Recent demand growth .............................................................................................................. 18
3.2.2 Current air services to Singapore ............................................................................................... 18
3.2.3 Aviation and the economy .......................................................................................................... 19
3.2.4 Singapore Changi international airport (SIN) ............................................................................. 20
4. Medium-term new route opportunities ..................................................................................... 21
4.1 Service gaps ................................................................................................................................ 21
4.1.1 Economy pair analysis ................................................................................................................ 21
4.1.2 Economy pair analysis summary ................................................................................................ 22
4.1.3 City pair analysis by APEC economy ........................................................................................... 23
4.2 Higher-level feasibility considerations ....................................................................................... 24
4.3 Proposed route and analysis possible schedule considerations ................................................ 25
4.3.1 Route #1 SIN-JFK ......................................................................................................................... 26
APEC Project TWG 01 2014A – Develop Air Connectivity in the APEC Region 4
4.3.2 Route #2 SIN-SFO ........................................................................................................................ 26
4.3.3 Route #3 SIN-PUS ........................................................................................................................ 27
4.3.4 Route #4 SIN-LAX ........................................................................................................................ 27
4.3.5 Route #5 SIN-SHE ........................................................................................................................ 28
4.3.6 Route #6 SIN-CGO ....................................................................................................................... 28
4.3.7 Route #7 SIN-DLC ........................................................................................................................ 29
4.3.8 Route summary .......................................................................................................................... 30
4.4 Proposed scheduled operations ................................................................................................. 30
4.4.1 Potential airline operators .......................................................................................................... 30
4.4.2 Route # 1 New York (JFK) ............................................................................................................ 32
4.4.3 Route # 2 San Francisco (SFO) .................................................................................................... 32
4.4.4 Route # 3 Busan (PUS) ................................................................................................................ 33
4.4.5 Route # 4 Los Angeles (LAX) ....................................................................................................... 33
4.4.6 Route # 5 Shenyang (SHE) .......................................................................................................... 33
4.4.7 Route # 6 Zhengzhou (CGO) ....................................................................................................... 34
4.4.8 Route # 7 Dalian (DLC) ................................................................................................................ 34
5. Conclusions and opportunities ................................................................................................... 35
5.1 Connectivity improvement ......................................................................................................... 35
5.2 Route frequency increase ........................................................................................................... 35
5.3 Long-term new route opportunities ........................................................................................... 37
5.4 Development of aircraft technology .......................................................................................... 37
6. Recommendations to improve air connectivity ......................................................................... 38
6.1 Generic recommendations ......................................................................................................... 38
6.2 Specific recommendations ......................................................................................................... 38
6.3 How the APEC economy’s regulator can help ............................................................................ 39
7. Appendix ..................................................................................................................................... 40
7.1 Overview of IATA and IATA Consulting ....................................................................................... 40
7.1.1 IATA ............................................................................................................................................. 40
7.1.2 IATA Consulting ........................................................................................................................... 40
Bibliography ................................................................................................................................................ 43
APEC Project TWG 01 2014A – Develop Air Connectivity in the APEC Region 5
Glossary
The following section presents a list of commonly used expressions and abbreviations found in the report.
Connecting Potential – Common rates of passengers connecting beyond/behind when traveling through a hub to/from a particular region.
Induction/Stimulation – Initial spike in passenger demand when new nonstop service is offered due to better accessibility, shorter travel time, lower cost, etc.
List of Abbreviations
PDEW – Passenger daily each way (passenger demand in each direction between a select origin and destination).
SDEW – Seats daily each way (number of seats offered in each direction on a nonstop or one-stop flight segment).
OD – Origin and destination.
Airport Codes:
AAQ – Anapa, RUS
ACA – Acapulco, MEX
ADL – Adelaide, AUS
AER – Sochi, RUS
AGU – Aguascalientes,
MEX
AKJ – Asahikawa, JPN
AKL – Auckland, NZ
ANF – Antofagasta, CHL
AOR – Alor Setar, MAS
AQP – Arequipa, CHL
ARH – Arkhangelsk, RUS
ASF – Astrakhan, RUS
ATL – Atlanta, US
AUS – Austin, US
AYP – Ayacucho, PE
BCD – Negros Occidental,
PH
BDJ – Banjarmasin, INA
BHE – Blenheim, NZ
BJX – Silao, MEX
BKI – Kota Kinabalu, MAS
BKK – Bangkok, THA
BLI – Bellingham, US
BMV – Buon Ma Thuot,
VN
BNA – Nashville, US
BNE – Brisbane, AUS
BOS – Boston, US
BPN – Balikpapan, INA
BUR – Burbank, US
BWN – Bandar Seri
Begawan, BD
BXU – Butuan, PH
CAN – Guangzhou, PRC
CBO – Cotabato, PH
CCP – Concepción, CHL
CEB – Cebu, PH
CEI – Chiang Rai, THA
CEK – Chelyabinsk, RUS
CEN – Ciudad Obregón,
MEX
APEC Project TWG 01 2014A – Develop Air Connectivity in the APEC Region 6
CGK – Jakarta, INA
CGO – Zhengzhou, PRC
CGQ – Changchun, PRC
CGY – Cagayan de Oro
and Iligan, PH
CHC – Christchurch, NZ
CJA – Cajamarca, PE
CJC – Calama, CHL
CJJ – Cheongwon-gu,
ROK
CJU – Jeju, ROK
CKG – Chongqing, PRC
CLT – Charlotte, US
CME – Ciudad del
Carmen, MEX
CNS – Cairns, AUS
CNX – Chiang Mai, THA
CSX – Changsha, PRC
CTS – Hokkaido, JPN
CTU – Chengdu, PRC
CUN – Cancun, MEX
CUZ – Cusco, PE
CVG – Cincinnati, US
CXR – Nha Trang, VN
DAD – Da Nang, VN
DAL – Dallas, US
DCA – Washington, US
DEN – Denver, US
DFW – Dallas, US
DGO – Durango, MEX
DGT – Dumaguete, PH
DJB – Jambi City, INA
DLC – Dalian, PRC
DLI – Da Lat, VN
DME – Domodedovo,
RUS
DMK – Bangkok, THA
DPS – Bali, INA
DRW – Darwin, AUS
DTW – Detroit, US
DUD – Dunedin, NZ
DVO – Davao City, PH
EAT – Douglas County,
US
EWR – Newark, US
EZE – Buenos Aires, ARG
FAT – Fresno, US
FLL – Fort Lauderdale, US
FOC – Fuzhou, PRC
FSZ – Shizuoka, JPN
FUK – Fukuoka, JPN
GDL – Guadalajara, MEX
GEG – Spokane, US
GMP – Seoul, ROK
GUM – Tamuning and
Barrigada, GUM
GYS – Guangyuan, PRC
HAK – Haikou, PRC
HAN – Ha Noi, VN
HGH – Hangzhou, PRC
HKG – Hong Kong, China,
HKC
HKT – Phuket, THA
HND – Tokyo, JPN
HNL – Honolulu, US
HRB – Harbin, PRC
HUI – Hue, VN
HUZ – Huizhou, PRC
IAD – Washington, US
IAH – Houston, US
ICN – Seoul, ROK
ILO – Ilo, PE
IQQ – Iquique, CHL
IQT – Iquitos, PE
ISG – Ishigaki, JPN
ITM – Osaka, JPN
IWK – Iwakuni, JPN
JFK – New York, US
JHB – Johor, MAS
JJN – Quanzhou, PRC
JNZ – Jinzhou, PRC
JOG – Yogyakarta, INA
JUL – Juliaca, PE
KBR – Kota Bharu, MAS
KBV – Krabi, THA
KCH – Kuching, MAS
KGD – Kaliningrad, RUS
KHH – Kaohsiung, CT
KHN – Nanchang, PRC
KIX – Osaka, JPN
APEC Project TWG 01 2014A – Develop Air Connectivity in the APEC Region 7
KKE – Kerikeri, NZ
KLO – Kalibo, PH
KMG – Kunming, PRC
KNH – Kinmen, PRC
KNO – Kuala Namu, INA
KOJ – Kirishima, JPN
KRR – Krasnodar, RUS
KUF – Samara, RUS
KUL – Kuala Lumpur,
MAS
KWL – Guilin, PRC
KZN – Tatarstan, RUS
LAS – Las Vegas, US
LAX – Los Angeles, US
LED – Saint Petersburg,
RUS
SVX – Yekaterinburg, RUS
LGA – NY–La Guardia, US
LGK – Padang Matsirat,
Langkawi, MAS
LHW – Lanzhou, PRC
LIM – Lima, PE
LOP – Lombok, INA
LPF – Liupanshui, PRC
LPT – Lampang, THA
MBT – Masbate City, PH
MCC – Sacramento, US
MCO – Orlando, US
MDW – Chicago, US
MDZ – Mendoza, ARG
MEL – Melbourne, AUS
MEX – Mexico City, MEX
MFM – Macau, MAC
MIA – Miami, US
MLM – Alvaro Obregon,
Michoacan, MEX
MNL – Manilla, PH
MRY – Monterey, US
MSP – Minneapolis–Saint
Paul, US
MTT – Cosoleacaque,
MEX
MTY – Apodaca, MEX
MZG – Magong City, CT
NBC – Nizhnekamsk, RUS
NGB – Ningbo, PRC
NGO – Nagoya, JPN
NKG – Nanjing, PRC
NKM – Nagoya, JPN
NNG – Nanning, PRC
NPE – Napier, NZ
NPL – New Plymouth, NZ
NRT – Tokyo, JPN
NSN – Nelson, NZ
NTG – Nantong, PRC
OAK – Oakland, US
OAX – Oaxaca, MEX
OKA – Naha, JPN
OOL – Gold Coast, AUS
ORD – Chicago, US
OVB – Novosibirsk, RUS
OZC – Ozamiz, PH
PDG – Sumatra, INA
PEK – Beijing, PRC
PEN – Penang, MAS
PER – Perth, AUS
PHL – Philadelphia, US
PHX – Phoenix, US
PIU – Piura, PE
PLM – Palembang, INA
PLW – Palu, INA
PMC – Puerto Montt,
CHL
PMR – Palmerston North
City, NZ
PNK – Pontianak, INA
POM – Port Moresby,
PNG
PPQ – Paraparaumu, NZ
PQC – Phu Quoc, VN
PSP – Palm Springs, US
PUS – Busan, ROK
PVG – Shanghai, PRC
PVR – Puerto Vallarta,
MEX
PXU – Pleiku, VN
PYX – Pattaya, THA
RDU – Raleigh, Durham,
US
REP – Siem Reap, KHM

APEC Project TWG 01 2014A – Develop Air Connectivity in the APEC Region 8
REX – Reynosa, US
RGN – Mingaladon, MMR
RNO – Reno, US
ROC – Rochester, US
ROT – Rotokawa, NZ
ROV – Rostov-on-Don,
RUS
RSU – Yeosu, ROK
RTW – Saratov City, RUS
RXS – Roxas City, PH
SAN – San Diego, US
SCL– Santiago, CHL
SEA – Seattle, US
SFO – San Francisco, US
SGN – Ho Chi Minh, VN
SHA – Shanghai, PRC
SHE – Shenyang, PRC
SIN – Singapore, SGP
SIP – Simferopol, UKR
SJC – San Jose, US
SJD – San Jose del Cabo,
MEX
SLC – Salt Lake City, US
SLP – San Luis Potosi,
MEX
SMF – Sacramento, US
SNA – Santa Ana, US
SOC – Solo/Surakarta,
INA
SPN – Saipan, US
SRG – Semarang, INA
STL – St. Louis, US
STW – Stavropol Krai,
RUS
SUB – Surabaya, INA
SVO – Moscow, RUS
SVX – Koltsovo, RUS
SWA – Jieyang Chaoshan,
PRC
SYD – Sydney, AUS
SYO – Sakata, JPN
SYX – Sanya, PRC
SZX – Shenzhen, PRC
TAC – Tacloban, PH
TAM – Tampico, MEX
TAO – Qingdao, PRC
TAV – Tau, ASM
TBP – Tumbes, PE
TDX – Trat, THA
TGG – Kuala Terengganu,
MSA
TGZ – Chiapa de Corzo,
MEX
TIJ – Tijuana, MEX
TKG – Bandar Lampung,
INA
TLC – Toluca, MEX
TNA – Jinan, PRC
TPE – Taipei, CT
TPP – Tarapoto, PE
TRC – Torreon, MEX
TRU – Trujillo, PE
TSA – Songshan, CT
TSN – Tianjin, PRC
TTJ – Tottori, JPN
TXG – Taichung, CT
TYN – Taiyuan, PRC
UFA – Ufa, RUS
UIH – Qui Nhon, VN
UKB – Kobe, JPN
UPG – Makassar, INA
URC – Urumqi, PRC
USM – Koh Samui, THA
VCL – Chu Lai, VN
VDH – Dong Hoi, VN
VER – Veracruz, MEX
VII – Vinh, VN
VKO – Moscow, RUS
VOZ – Voronezh, RUS
VSA – Villahermosa, MEX
VVO – Vladivostok, RUS
WAG – Whanganui, NZ
WEH – Weihai, PRC
WLG – Wellington, NZ
WNZ – Wenzhou, PRC
WRE – Whangarei city,
NZ
WUH – Wuhan, PRC
WUX – Wuxi, PRC
XIY – Xi'an, PRC

APEC Project TWG 01 2014A – Develop Air Connectivity in the APEC Region 9
XMN – Xiamen, PRC
YEG – Edmonton, CDA
YGJ – Yonago, PRC
YHZ – Halifax, CDA
YKA – Kamloops, CDA
YLW – Kelowna, CDA
YNJ – Yanji, PRC
YOW – Ottawa, CDA
YPR – Prince Rupert, CDA
YQM – Moncton, CDA
YQR – Regina, CDA
YSJ – Saint John, CDA
YTS – Timmins, CDA
YUL – Montreal, CDA
YVR – Vancouver, CDA
YWG – Winnipeg, CDA
YXC – Cranbrook, CDA
YXS – Prince George, CDA
YXT – Terrace-Kitimat,
CDA
YYB – North Bay, CDA
YYC – Calgary, CDA
YYJ – Victoria, CDA
YYZ – Toronto, CDA
YZP – Sandspit, CDA
YZR – Sarnia, CDA
ZAL – Valdivia, CHL
ZCL – Calera de Victor
Rosales, MEX
ZQN – Queenstown, NZ
ZUH – Zhuhai, PRC
APEC Project TWG 01 2014A – Develop Air Connectivity in the APEC Region 10
1. Introduction to the project The APEC Secretariat and Economies have observed that the flow of goods, services, capital and people in the APEC Region is constrained by air connectivity limitations and gaps that exist between the APEC economies, particularly between the Americas and Asia Pacific. Improving connectivity is a long-term target of the APEC economies. The APEC Tourism Working Group (TWG) and Transport Working Group (TPTWG) are particularly interested in pursuing this long-term target.
This Project (the “Project”) was proposed in 2014 by Thailand and co-sponsored by Australia; Indonesia; Malaysia; Peru; the Philippines; and Chinese Taipei and aims to develop air connectivity in the APEC Region and in turn stimulate a more efficient flow of goods, services, capital and people. The Project has the following objectives:
• To develop market demand-based recommendations for potential new routes, improved flight schedule connection times, and hubs between APEC economies based on analysis of air passenger flow, schedules and new aircraft range capability, including analysis of the number of seats, flights and air traffic.
• To help airlines and regulators develop more accurate demand predictions so they can in turn help APEC economies by providing better air connectivity services, capacity and schedules.
The Project was approved in December 2014, with IATA Consulting selected as the consultant in May 2015. IATA was mandated to complete the following tasks:
1. Develop market demand-based recommendations for potential new routes.
2. Provide recommendations to improve connections between flights at the main hubs linking the APEC economies.
3. Determine which APEC market-pairs could benefit from the introduction of new aircraft with extended range.

APEC Project TWG 01 2014A – Develop Air Connectivity in the APEC Region 11
2. Approach followed and data used
This section explains the methodology applied by IATA and presents the data used to feed the various underlying analysis. To conduct the analysis, IATA took systematic steps identified in Figure 1.
Figure 1: Process used to complete analytical work
The first step involved a demand-supply gap analysis aimed at identifying the unserved routes, presenting potential demand for future development. The size that this potential demand could actually represent if turned into direct service in the future was subsequently forecast, using realistic assumptions related to induction, connecting potential and demand growth.
2.1 Data fueling the model
Principal data for the model originates from Airport IS. IATA’s Airport IS system uses IATA billing and settlement plan data to provide detailed demand and supply information on total air traffic. This data has been available for over a 10-year historical period (since 2005).
Approximately 18,500 international APEC routes were analyzed in the execution of this study. Airport IS data was particularly relevant in the gap analysis and assumption development.
Academic articles and published ratios were also used to justify some of the assumptions, including induction and origin destination traffic captured through direct service.
For some of the other variables used in the final traffic determination, economic forecasts were extracted from IHS Global Insight, one of the world’s largest commercially available economic databases.
APEC Project TWG 01 2014A – Develop Air Connectivity in the APEC Region 12
Tourism data was extracted from the World Travel and Tourism Council.
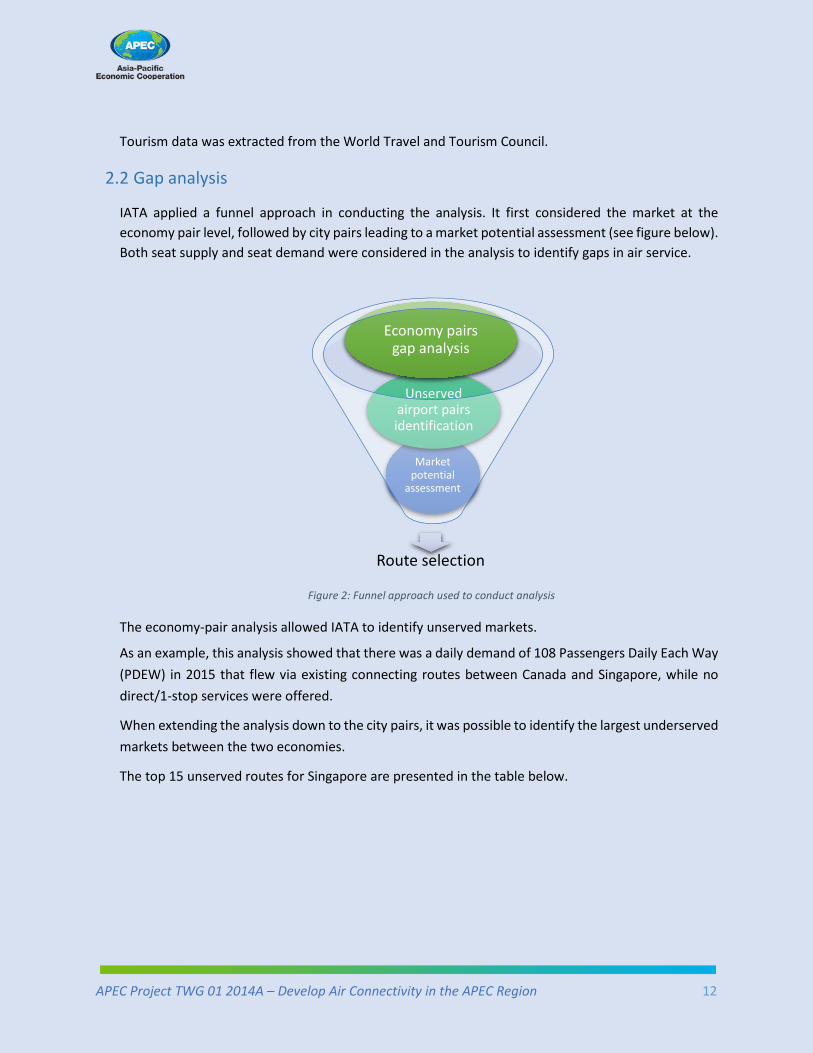
2.2 Gap analysis
IATA applied a funnel approach in conducting the analysis. It first considered the market at the economy pair level, followed by city pairs leading to a market potential assessment (see figure below). Both seat supply and seat demand were considered in the analysis to identify gaps in air service.
Figure 2: Funnel approach used to conduct analysis
The economy-pair analysis allowed IATA to identify unserved markets.
As an example, this analysis showed that there was a daily demand of 108 Passengers Daily Each Way (PDEW) in 2015 that flew via existing connecting routes between Canada and Singapore, while no direct/1-stop services were offered.
When extending the analysis down to the city pairs, it was possible to identify the largest underserved markets between the two economies.
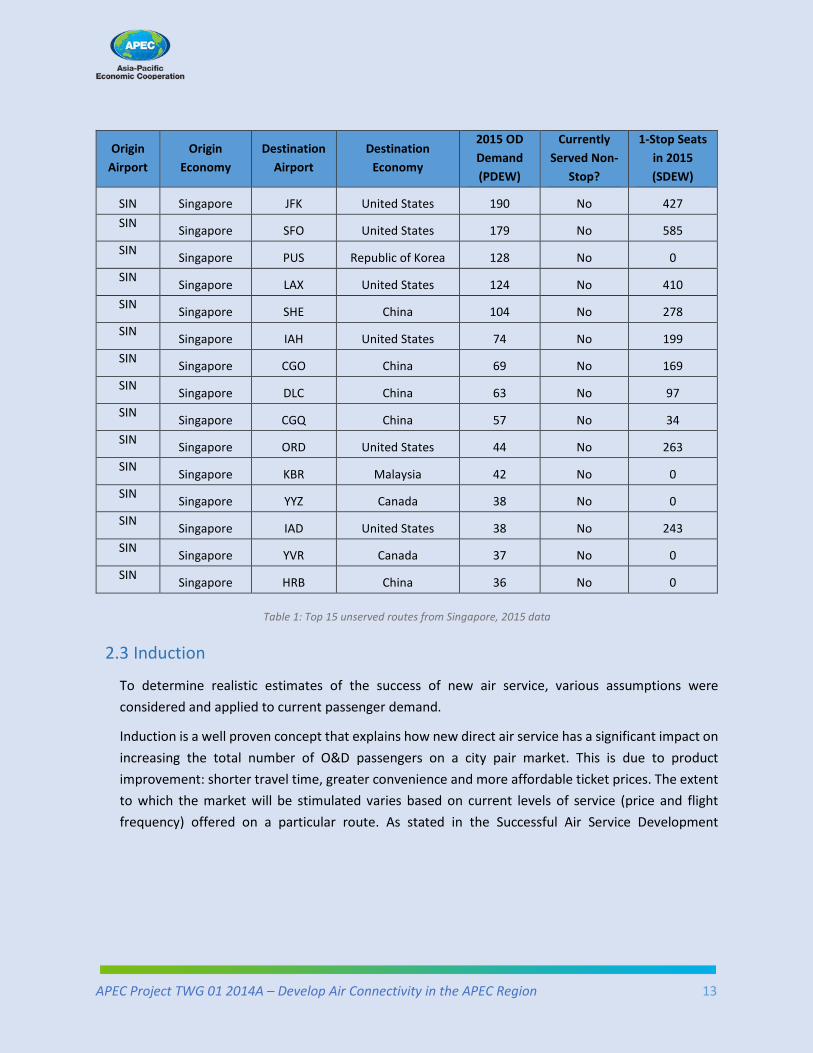
The top 15 unserved routes for Singapore are presented in the table below.
Route selection
Market potential
assessment
Unserved airport pairs identification
Economy pairs gap analysis
APEC Project TWG 01 2014A – Develop Air Connectivity in the APEC Region 13
Origin Airport
Origin Economy
Destination Airport
Destination Economy
2015 OD Demand (PDEW)
Currently Served Non-
Stop?
1-Stop Seats in 2015 (SDEW)
SIN Singapore JFK United States 190 No 427 SIN Singapore SFO United States 179 No 585 SIN Singapore PUS Republic of Korea 128 No 0 SIN Singapore LAX United States 124 No 410 SIN Singapore SHE China 104 No 278 SIN Singapore IAH United States 74 No 199 SIN Singapore CGO China 69 No 169 SIN Singapore DLC China 63 No 97 SIN Singapore CGQ China 57 No 34 SIN Singapore ORD United States 44 No 263 SIN Singapore KBR Malaysia 42 No 0 SIN Singapore YYZ Canada 38 No 0 SIN Singapore IAD United States 38 No 243 SIN Singapore YVR Canada 37 No 0 SIN Singapore HRB China 36 No 0
Table 1: Top 15 unserved routes from Singapore, 2015 data
2.3 Induction
To determine realistic estimates of the success of new air service, various assumptions were considered and applied to current passenger demand.
Induction is a well proven concept that explains how new direct air service has a significant impact on increasing the total number of O&D passengers on a city pair market. This is due to product improvement: shorter travel time, greater convenience and more affordable ticket prices. The extent to which the market will be stimulated varies based on current levels of service (price and flight frequency) offered on a particular route. As stated in the Successful Air Service Development
APEC Project TWG 01 2014A – Develop Air Connectivity in the APEC Region 14
presentation (ICF International, 2014) a market’s first non-stop flight can stimulate demand by 100% to 300%.
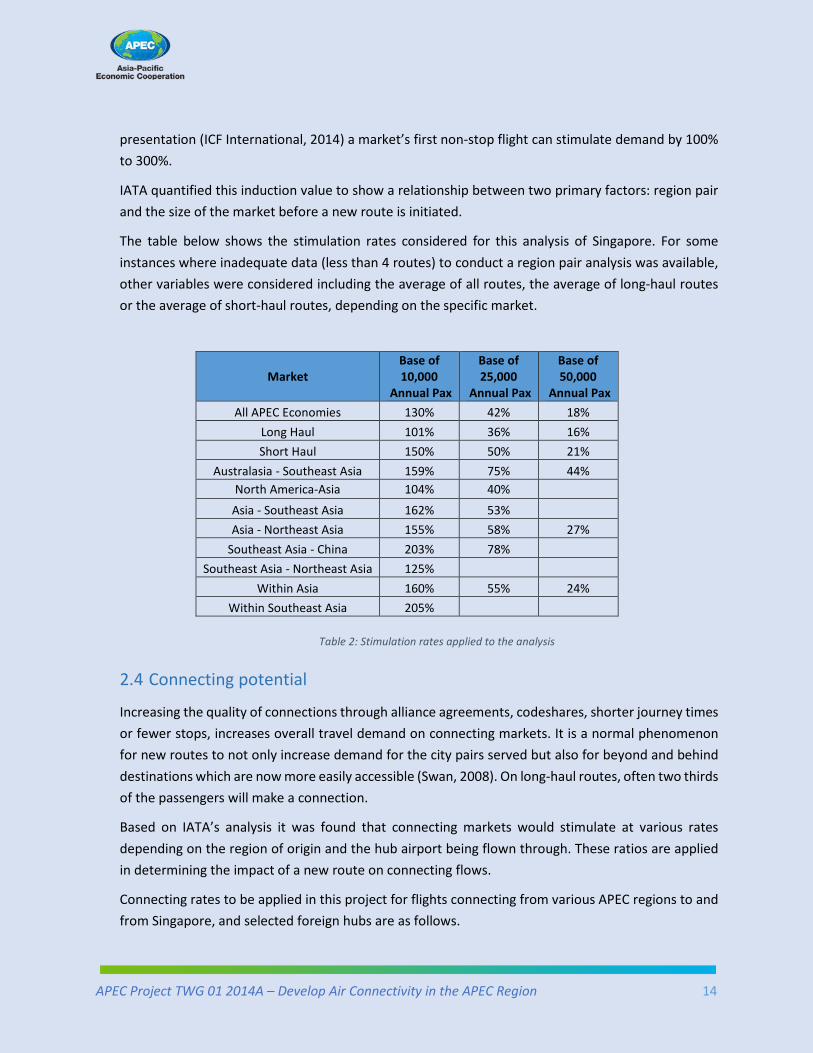
IATA quantified this induction value to show a relationship between two primary factors: region pair and the size of the market before a new route is initiated.
The table below shows the stimulation rates considered for this analysis of Singapore. For some instances where inadequate data (less than 4 routes) to conduct a region pair analysis was available, other variables were considered including the average of all routes, the average of long-haul routes or the average of short-haul routes, depending on the specific market.
Market Base of 10,000
Annual Pax
Base of 25,000
Annual Pax
Base of 50,000
Annual Pax All APEC Economies 130% 42% 18%
Long Haul 101% 36% 16% Short Haul 150% 50% 21%
Australasia - Southeast Asia 159% 75% 44% North America-Asia 104% 40%
Asia - Southeast Asia 162% 53% Asia - Northeast Asia 155% 58% 27%
Southeast Asia - China 203% 78% Southeast Asia - Northeast Asia 125%
Within Asia 160% 55% 24% Within Southeast Asia 205%
Table 2: Stimulation rates applied to the analysis
2.4 Connecting potential
Increasing the quality of connections through alliance agreements, codeshares, shorter journey times or fewer stops, increases overall travel demand on connecting markets. It is a normal phenomenon for new routes to not only increase demand for the city pairs served but also for beyond and behind destinations which are now more easily accessible (Swan, 2008). On long-haul routes, often two thirds of the passengers will make a connection.
Based on IATA’s analysis it was found that connecting markets would stimulate at various rates depending on the region of origin and the hub airport being flown through. These ratios are applied in determining the impact of a new route on connecting flows.
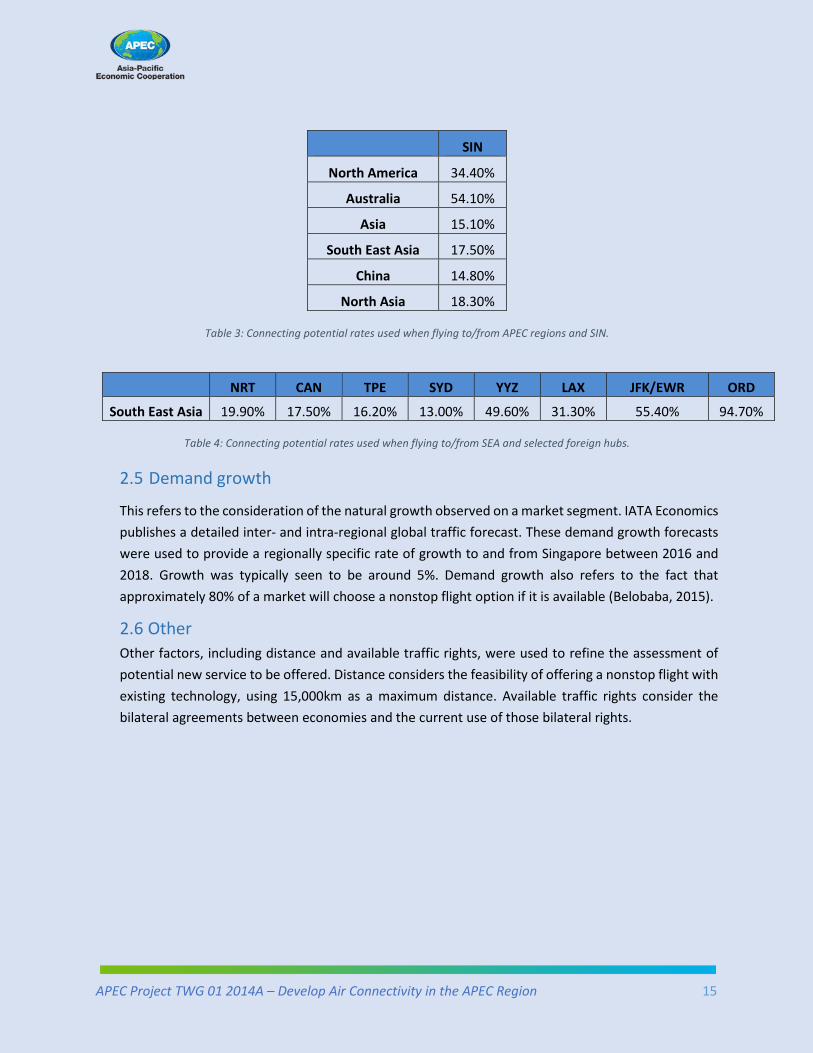
Connecting rates to be applied in this project for flights connecting from various APEC regions to and from Singapore, and selected foreign hubs are as follows.
APEC Project TWG 01 2014A – Develop Air Connectivity in the APEC Region 15
SIN
North America 34.40%
Australia 54.10%
Asia 15.10%
South East Asia 17.50%
China 14.80%
North Asia 18.30%
Table 3: Connecting potential rates used when flying to/from APEC regions and SIN.
NRT CAN TPE SYD YYZ LAX JFK/EWR ORD
South East Asia 19.90% 17.50% 16.20% 13.00% 49.60% 31.30% 55.40% 94.70%
Table 4: Connecting potential rates used when flying to/from SEA and selected foreign hubs.
2.5 Demand growth
This refers to the consideration of the natural growth observed on a market segment. IATA Economics publishes a detailed inter- and intra-regional global traffic forecast. These demand growth forecasts were used to provide a regionally specific rate of growth to and from Singapore between 2016 and 2018. Growth was typically seen to be around 5%. Demand growth also refers to the fact that approximately 80% of a market will choose a nonstop flight option if it is available (Belobaba, 2015).
2.6 Other Other factors, including distance and available traffic rights, were used to refine the assessment of potential new service to be offered. Distance considers the feasibility of offering a nonstop flight with existing technology, using 15,000km as a maximum distance. Available traffic rights consider the bilateral agreements between economies and the current use of those bilateral rights.
APEC Project TWG 01 2014A – Develop Air Connectivity in the APEC Region 16
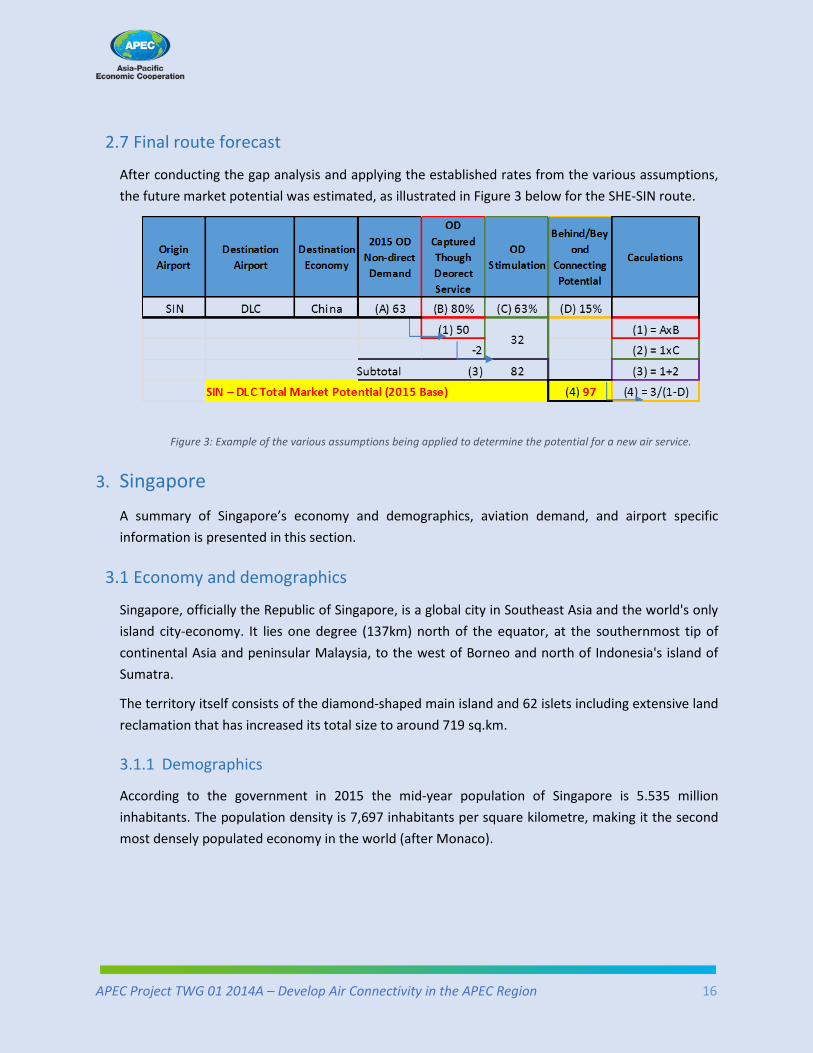
2.7 Final route forecast
After conducting the gap analysis and applying the established rates from the various assumptions, the future market potential was estimated, as illustrated in Figure 3 below for the SHE-SIN route.
Figure 3: Example of the various assumptions being applied to determine the potential for a new air service.
3. Singapore A summary of Singapore’s economy and demographics, aviation demand, and airport specific information is presented in this section.
3.1 Economy and demographics
Singapore, officially the Republic of Singapore, is a global city in Southeast Asia and the world's only island city-economy. It lies one degree (137km) north of the equator, at the southernmost tip of continental Asia and peninsular Malaysia, to the west of Borneo and north of Indonesia's island of Sumatra.
The territory itself consists of the diamond-shaped main island and 62 islets including extensive land reclamation that has increased its total size to around 719 sq.km.
3.1.1 Demographics
According to the government in 2015 the mid-year population of Singapore is 5.535 million inhabitants. The population density is 7,697 inhabitants per square kilometre, making it the second most densely populated economy in the world (after Monaco).

APEC Project TWG 01 2014A – Develop Air Connectivity in the APEC Region 17
3.1.2 Economy
Singapore has a highly open and developed trade-oriented market economy. In 2015 Gross Domestic Product, GDP was USD471 billion and has the third highest per-capita GDP in the world (USD85,253) measured in terms of Purchasing Power Parity (PPP) (International Monetary Fund, 2016).
Roughly a quarter of Singapore’s total industrial output involves manufacturing and this includes chemicals, electronics, engineering, and biomedical activity. The economy has the second largest port in the world (after Shanghai) both for containers and total cargo throughput ( World Shipping Council, 2014).
Major trading partners include China; Hong Kong, China; Indonesia; Malaysia; Chinese Taipei; the US; and EU. (WTO, 2015)
3.1.3 Tourism
In 2015, 15.24 million foreigners visited Singapore, representing an increase of 1.0% compared with the same period of 2014. (Singapore Tourist Board, 2016). The largest destination markets include: Indonesia 23%; China 18%; Malaysia 10%; Australia 9%; India 9%; Japan 7%; and the Philippines 6%.
The direct contribution of Travel & Tourism to GDP was SGD19.2 billion (4.8% of total GDP) in 2015, and is forecasted to rise by 2.8% in 2016, and to rise by 3.5% p.a., from 2016-2026, to SGD27.9 billion (5.2% of total GDP) in 2026. This primarily reflects the economic activity generated by industries such as hotels, travel agents, airlines, and other passenger transportation services (excluding commuter services). But it also includes, for example, the activities of the restaurant and leisure industries directly supported. The total contribution of Travel & Tourism to GDP was SGD39.5 billion (10.0% of GDP) in 2015, and is forecast to rise by 3.7% in 2016, and to rise by 3.4% pa to SGD57.2 billion (10.6% of GDP) in 2026. (World Travel and Tourism Council, 2016).
APEC Project TWG 01 2014A – Develop Air Connectivity in the APEC Region 18
3.2 Aviation demand
Due to its population’s historically high propensity to fly, air travel has become an important part of the Singaporean economy.
3.2.1 Recent demand growth
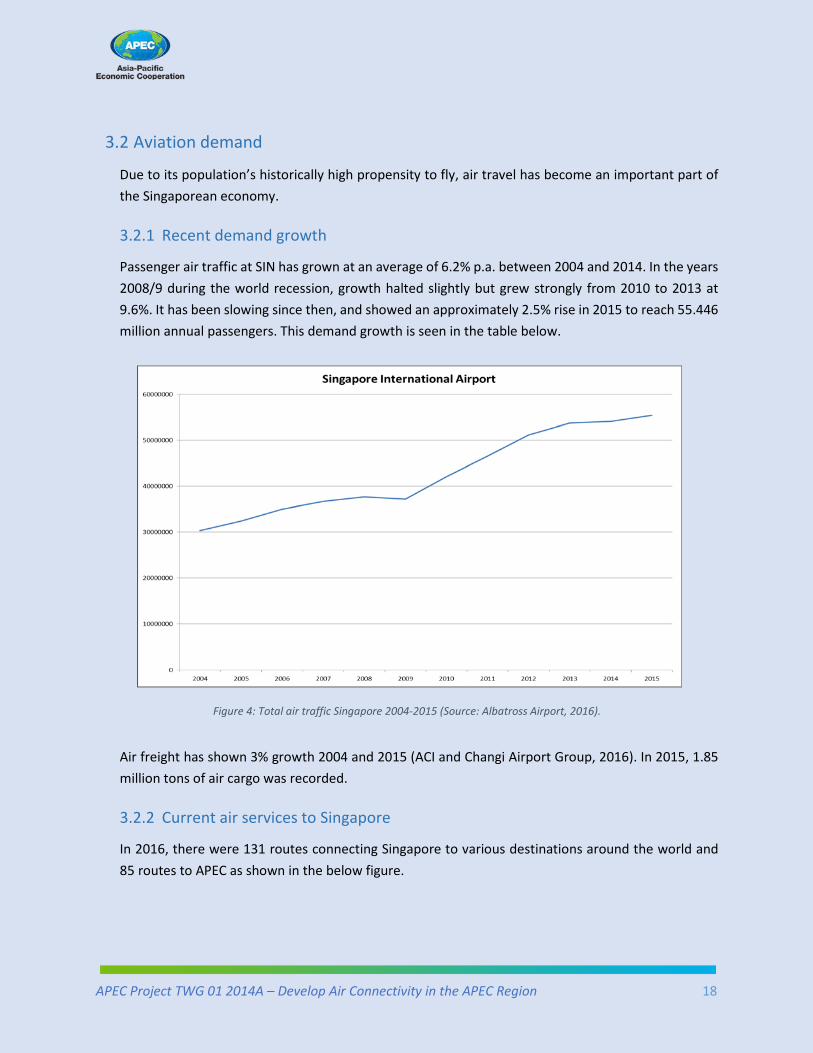
Passenger air traffic at SIN has grown at an average of 6.2% p.a. between 2004 and 2014. In the years 2008/9 during the world recession, growth halted slightly but grew strongly from 2010 to 2013 at 9.6%. It has been slowing since then, and showed an approximately 2.5% rise in 2015 to reach 55.446 million annual passengers. This demand growth is seen in the table below.
Figure 4: Total air traffic Singapore 2004-2015 (Source: Albatross Airport, 2016).
Air freight has shown 3% growth 2004 and 2015 (ACI and Changi Airport Group, 2016). In 2015, 1.85 million tons of air cargo was recorded.
3.2.2 Current air services to Singapore
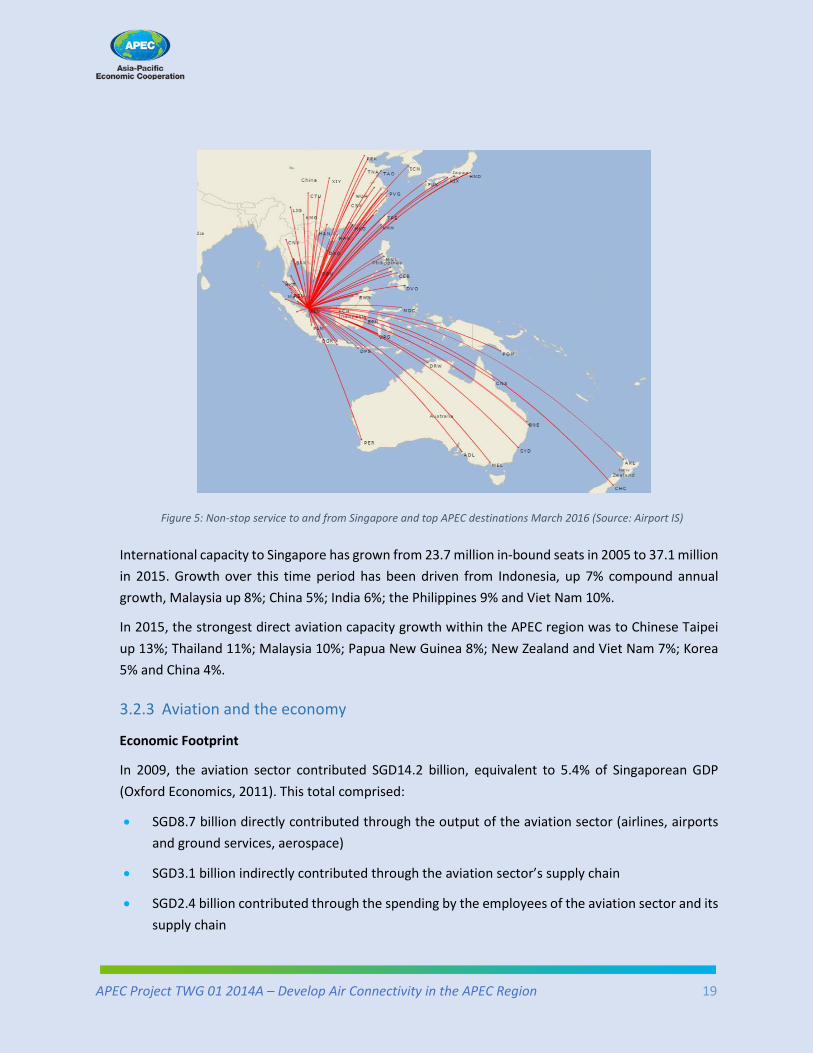
In 2016, there were 131 routes connecting Singapore to various destinations around the world and 85 routes to APEC as shown in the below figure.
APEC Project TWG 01 2014A – Develop Air Connectivity in the APEC Region 19
Figure 5: Non-stop service to and from Singapore and top APEC destinations March 2016 (Source: Airport IS)
International capacity to Singapore has grown from 23.7 million in-bound seats in 2005 to 37.1 million in 2015. Growth over this time period has been driven from Indonesia, up 7% compound annual growth, Malaysia up 8%; China 5%; India 6%; the Philippines 9% and Viet Nam 10%.
In 2015, the strongest direct aviation capacity growth within the APEC region was to Chinese Taipei up 13%; Thailand 11%; Malaysia 10%; Papua New Guinea 8%; New Zealand and Viet Nam 7%; Korea 5% and China 4%.
3.2.3 Aviation and the economy
Economic Footprint
In 2009, the aviation sector contributed SGD14.2 billion, equivalent to 5.4% of Singaporean GDP (Oxford Economics, 2011). This total comprised:
• SGD8.7 billion directly contributed through the output of the aviation sector (airlines, airports and ground services, aerospace)
• SGD3.1 billion indirectly contributed through the aviation sector’s supply chain
• SGD2.4 billion contributed through the spending by the employees of the aviation sector and its supply chain
APEC Project TWG 01 2014A – Develop Air Connectivity in the APEC Region 20
• In addition, there are SGD9.3 billion in ‘catalytic’ benefits through tourism which raise the overall contribution to SGD23.5 billion or 8.9% of GDP of the Singapore economy
From an employment perspective the sector supports 119,000 jobs directly and indirectly, and a further 78,000 people through the catalytic effects.
Consumer Benefits
In 2009, visiting family and friends, and on business passengers, paid the airlines SGD36.0 billion (inclusive of tax), with Singaporean residents paying around SGD9.7 billion. This expenditure probably significantly understates the value passengers actually attached to the flights they use. Calculations suggest the value of the benefit to travellers from flying, in excess of their expenditure, is worth SGD24.9 billion a year (SGD6.7 billion for Singaporean residents).
Shippers paid the airlines SGD8.9 billion annually to carry 1.6 million tonnes of freight to and from Singapore. The benefit to shippers, in excess of this expenditure, is estimated as SGD3.7 billion. Based on the share of exports in total merchandise trade, Singaporean shippers received just over half of this benefit (SGD2.0 billion). (Oxford Economics, 2011).
Long-term impact
Economically, aviation has a long-term impact in Singapore. Air travel enables long-term economic growth by (Oxford Economics, 2011):
• Opening up foreign markets to Singapore’s exports
• Lowering transport costs
• Increasing the flexibility of labour supply
• Speeding the adoption of business practices such as just-in-time-inventory management
• Raising productivity and hence the economy’s long-run supply capacity
It is estimated that a 10% improvement in connectivity relative to GDP would see a SGD169 million per annum increase in long-run GDP for the Singaporean economy.
3.2.4 Singapore Changi international airport (SIN)
SIN is a major airport facility with a well-developed operational area. The airport has continued to increase capacity as required including roadways, car parking, baggage handling facilities and terminal space. It has three terminals with the construction of a fourth soon to be completed.
APEC Project TWG 01 2014A – Develop Air Connectivity in the APEC Region 21
4. Medium-term new route opportunities This section of the report is dedicated to explaining the potential future air service developments to and from China within the APEC region over the next three years. Service gaps, route traffic forecasts, and high-level feasibility analysis conducted are hereby presented.
4.1 Service gaps
As part of the process, air services to Singapore were considered on both an economy-pair and city-pair basis.
4.1.1 Economy pair analysis
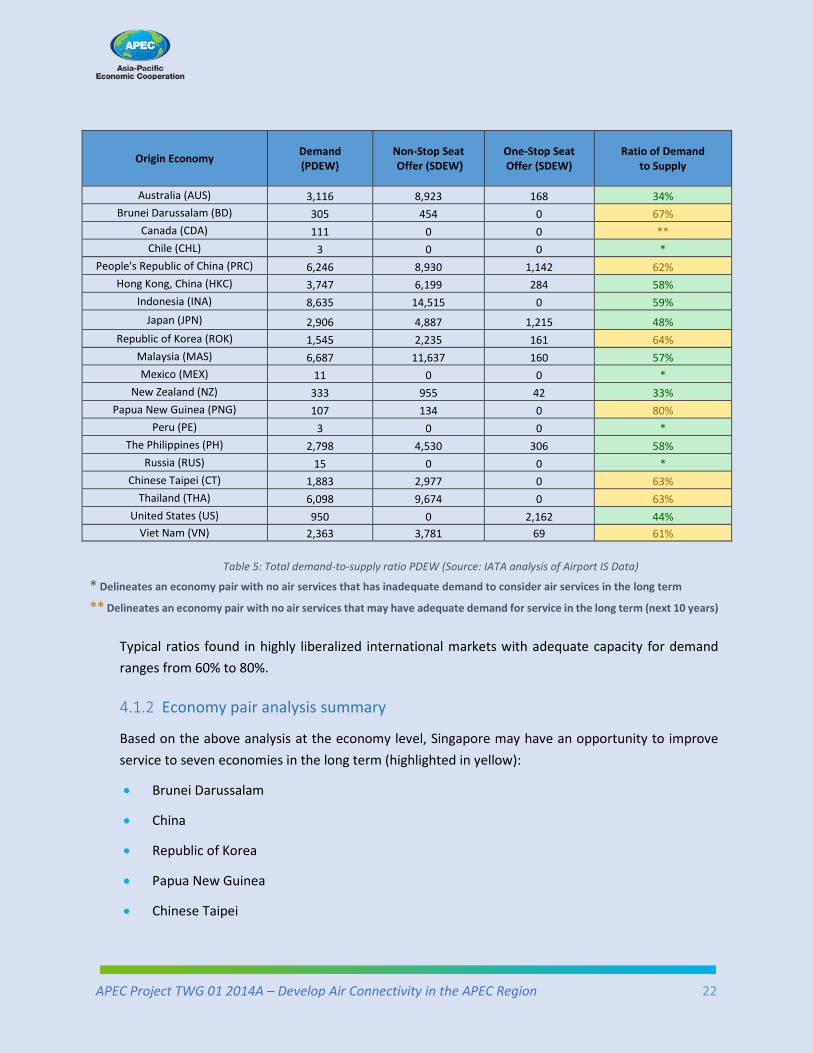
The following table outlines the supply and demand for air travel between SGP and other APEC economies. The data essentially shows the economy pairs where
• non-stop service is sufficiently supplied (in green),
• air service is adequate but may need to be improved in the long term (in yellow), and
• air service is at a shortfall and should be improved in the medium term (in red).
APEC Project TWG 01 2014A – Develop Air Connectivity in the APEC Region 22
Origin Economy Demand (PDEW)
Non-Stop Seat Offer (SDEW)
One-Stop Seat Offer (SDEW)
Ratio of Demand to Supply
Australia (AUS) 3,116 8,923 168 34% Brunei Darussalam (BD) 305 454 0 67%
Canada (CDA) 111 0 0 ** Chile (CHL) 3 0 0 *
People's Republic of China (PRC) 6,246 8,930 1,142 62% Hong Kong, China (HKC) 3,747 6,199 284 58%
Indonesia (INA) 8,635 14,515 0 59% Japan (JPN) 2,906 4,887 1,215 48%
Republic of Korea (ROK) 1,545 2,235 161 64% Malaysia (MAS) 6,687 11,637 160 57% Mexico (MEX) 11 0 0 *
New Zealand (NZ) 333 955 42 33% Papua New Guinea (PNG) 107 134 0 80%
Peru (PE) 3 0 0 * The Philippines (PH) 2,798 4,530 306 58%
Russia (RUS) 15 0 0 * Chinese Taipei (CT) 1,883 2,977 0 63%
Thailand (THA) 6,098 9,674 0 63% United States (US) 950 0 2,162 44%
Viet Nam (VN) 2,363 3,781 69 61%
Table 5: Total demand-to-supply ratio PDEW (Source: IATA analysis of Airport IS Data)
* Delineates an economy pair with no air services that has inadequate demand to consider air services in the long term
** Delineates an economy pair with no air services that may have adequate demand for service in the long term (next 10 years)
Typical ratios found in highly liberalized international markets with adequate capacity for demand ranges from 60% to 80%.
4.1.2 Economy pair analysis summary
Based on the above analysis at the economy level, Singapore may have an opportunity to improve service to seven economies in the long term (highlighted in yellow):
• Brunei Darussalam
• China
• Republic of Korea
• Papua New Guinea
• Chinese Taipei

APEC Project TWG 01 2014A – Develop Air Connectivity in the APEC Region 23
• Thailand
• Viet Nam
The following section will look into greater details at these shortfalls in supply at a city-pair level.
4.1.3 City pair analysis by APEC economy
In order to develop a set of city pairs with potential demand, a threshold greater than 25 PDEW (9,125 annual passengers one-way) was considered as the minimum threshold level for any service. There are 23 city pairs to and from SIN that met this criterion. They are shown in table 6 below.
Table 6: APEC routes to China over 25 PDEW with no non-stop service (Source: IATA Analysis of Airport IS data).
Origin Airport Origin Economy Destination Airport Destination
Economy 2015 OD Demand
SIN Singapore JFK United States 190 SIN Singapore SFO United States 179 SIN Singapore PUS Republic of Korea 128 SIN Singapore LAX United States 124 SIN Singapore SHE China 104 SIN Singapore IAH United States 74 SIN Singapore CGO China 69 SIN Singapore DLC China 63 SIN Singapore CGQ China 57 SIN Singapore ORD United States 44 SIN Singapore KBR Malaysia 42 SIN Singapore YYZ Canada 38 SIN Singapore IAD United States 38 SIN Singapore YVR Canada 37 SIN Singapore HRB China 36 SIN Singapore SEA United States 33 SIN Singapore SBW Malaysia 32 SIN Singapore ITM Japan 31
APEC Project TWG 01 2014A – Develop Air Connectivity in the APEC Region 24
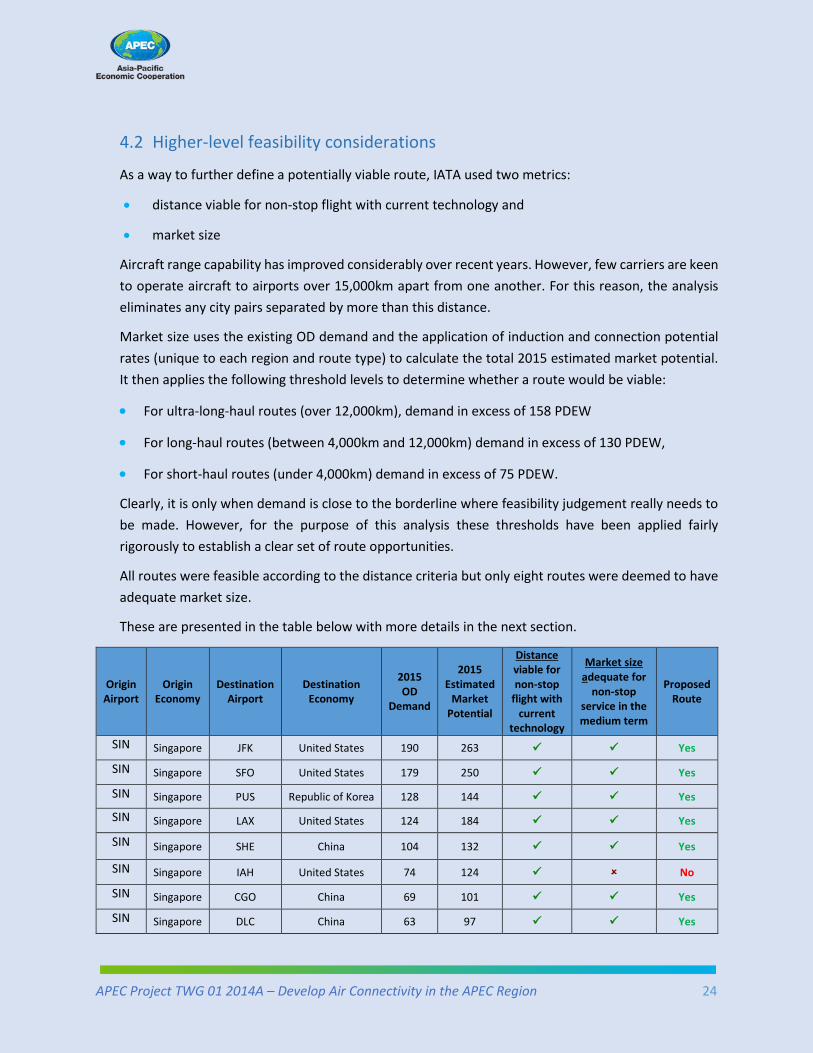
4.2 Higher-level feasibility considerations
As a way to further define a potentially viable route, IATA used two metrics:
• distance viable for non-stop flight with current technology and
• market size
Aircraft range capability has improved considerably over recent years. However, few carriers are keen to operate aircraft to airports over 15,000km apart from one another. For this reason, the analysis eliminates any city pairs separated by more than this distance.
Market size uses the existing OD demand and the application of induction and connection potential rates (unique to each region and route type) to calculate the total 2015 estimated market potential. It then applies the following threshold levels to determine whether a route would be viable:
• For ultra-long-haul routes (over 12,000km), demand in excess of 158 PDEW
• For long-haul routes (between 4,000km and 12,000km) demand in excess of 130 PDEW,
• For short-haul routes (under 4,000km) demand in excess of 75 PDEW.
Clearly, it is only when demand is close to the borderline where feasibility judgement really needs to be made. However, for the purpose of this analysis these thresholds have been applied fairly rigorously to establish a clear set of route opportunities.
All routes were feasible according to the distance criteria but only eight routes were deemed to have adequate market size.
These are presented in the table below with more details in the next section.
Origin Airport
Origin Economy
Destination Airport
Destination Economy
2015 OD
Demand
2015 Estimated
Market Potential
Distance viable for non-stop
flight with current
technology
Market size adequate for
non-stop service in the medium term
Proposed Route
SIN Singapore JFK United States 190 263 Yes
SIN Singapore SFO United States 179 250 Yes
SIN Singapore PUS Republic of Korea 128 144 Yes
SIN Singapore LAX United States 124 184 Yes
SIN Singapore SHE China 104 132 Yes
SIN Singapore IAH United States 74 124 No
SIN Singapore CGO China 69 101 Yes
SIN Singapore DLC China 63 97 Yes

APEC Project TWG 01 2014A – Develop Air Connectivity in the APEC Region 25
Origin Airport
Origin Economy
Destination Airport
Destination Economy
2015 OD
Demand
2015 Estimated
Market Potential
Distance viable for non-stop
flight with current
technology
Market size adequate for
non-stop service in the medium term
Proposed Route
SIN Singapore CGQ China 57 91 No
SIN Singapore ORD United States 44 145 No
SIN Singapore KBR Malaysia 42 82 No
SIN Singapore YYZ Canada 38 106 No
SIN Singapore IAD United States 38 81 No
SIN Singapore YVR Canada 37 131 No
SIN Singapore HRB China 36 67 No
SIN Singapore SEA United States 33 124 No
SIN Singapore SBW Malaysia 32 61 No
SIN Singapore ITM Japan 31 61 No
Table 7: Summary of high-level route feasibility considerations
4.3 Proposed route and analysis possible schedule considerations
IATA identified seven routes to Singapore via the above selection that could be established in the medium term. This section decomposes the route potential and presents a three-year demand forecast for each route.
It also considers route opportunities through three main operational/feasibility criteria:
• air service agreements
• airline network strategies and fleets
• route economics
Additionally, proposed operational aspects of the route are presented, including an indicative start date based on market maturity, a proposed airline to serve the route, type of aircraft to be used, flight frequency, and estimated load factors.

APEC Project TWG 01 2014A – Develop Air Connectivity in the APEC Region 26
4.3.1 Route #1 SIN-JFK
SIN-JFK 2015 total route potential definition:
Based on 2015 demand figures, IATA estimates that the SIN-JFK route presents a potential of 263 PDEW for a direct service between the two cities. This potential is forecasted to grow to 304 by 2018 as shown in the following table:
Economy Pair City Pair 2015 Base 2016 2017 2018 Singapore-United States SIN-JFK 263 276 290 304
This has been derived by taking the 2015 estimated demand and applying the growth rates inter and intra-regional global traffic forecast as published by IATA.
4.3.2 Route #2 SIN-SFO
SIN-SFO 2015 total route potential definition:
Based on 2015 demand figures, IATA estimates that the SIN-SFO route presents a potential of 250 PDEW for a direct service between the two cities. This potential is forecast grow to 289 by 2018 as shown in the following table:
1 2 4
Origin AirportDestination
AirportDestination
Economy2015 OD Non-direct Demand
OD Captured Though Deorect
ServiceOD Stimulation
Behind/Beyond Connecting Potential
Caculations
SIN JFK United States (A) 190 (B) 80% (C) 14% (D) 34%
(1) 152 (1) = AxB
(2) (2) = 1xC
Subtotal (3) 173 (3) = 1+2
(4) 263 (4) = 3/(1-D)
21
SIN - JFK Total Market Potential (2015 Base)

APEC Project TWG 01 2014A – Develop Air Connectivity in the APEC Region 27
Economy Pair City Pair 2015 Base 2016 2017 2018
Singapore-United States SIN-SFO 250 263 276 289
4.3.3 Route #3 SIN-PUS
SIN-PUS 2015 total route potential definition:
Based on 2015 demand figures, IATA estimates that the SIN-PUS route presents a market potential of 144 PDEW for a direct service between the two cities. This potential is forecasted to grow to 169 by 2018 as shown in the following table:
Economy Pair City Pair 2015 Base 2016 2017 2018
Singapore-Republic of Korea SIN-PUS 144 152 160 169
4.3.4 Route #4 SIN-LAX
SIN-LAX 2015 total Route potential definition:
Based on 2015 demand figures, IATA estimates that the SIN-LAX route presents a market potential of 184 PDEW for a direct service between the two cities. This potential is forecasted to grow to 212 PDEW by 2018 as shown in the following table:
1 2 4
Origin AirportDestination
AirportDestination
Economy2015 OD Non-direct Demand
OD Captured Though Deorect
ServiceOD Stimulation
Behind/Beyond Connecting Potential
Caculations
SIN PUS Republic of Korea (A) 128 (B) 80% (C) 15% (D) 18%
(1) 103 (1) = AxB
(2) (2) = 1xC
Subtotal (3) 118 (3) = 1+2
(4) 144 (4) = 3/(1-D)
15
SIN - PUS Total Market Potential (2015 Base)
1 2 4
Origin AirportDestination
AirportDestination
Economy2015 OD Non-direct Demand
OD Captured Though Deorect
ServiceOD Stimulation
Behind/Beyond Connecting Potential
Caculations
SIN LAX United States (A) 124 (B) 80% (C) 21% (D) 34%
(1) 99 (1) = AxB
(2) (2) = 1xC
Subtotal (3) 120 (3) = 1+2
(4) 184 (4) = 3/(1-D)
21
SIN - LAX Total Market Potential (2015 Base)
APEC Project TWG 01 2014A – Develop Air Connectivity in the APEC Region 28
Economy Pair City Pair 2015 Base 2016 2017 2018
Singapore-United States SIN-LAX 184 193 203 212
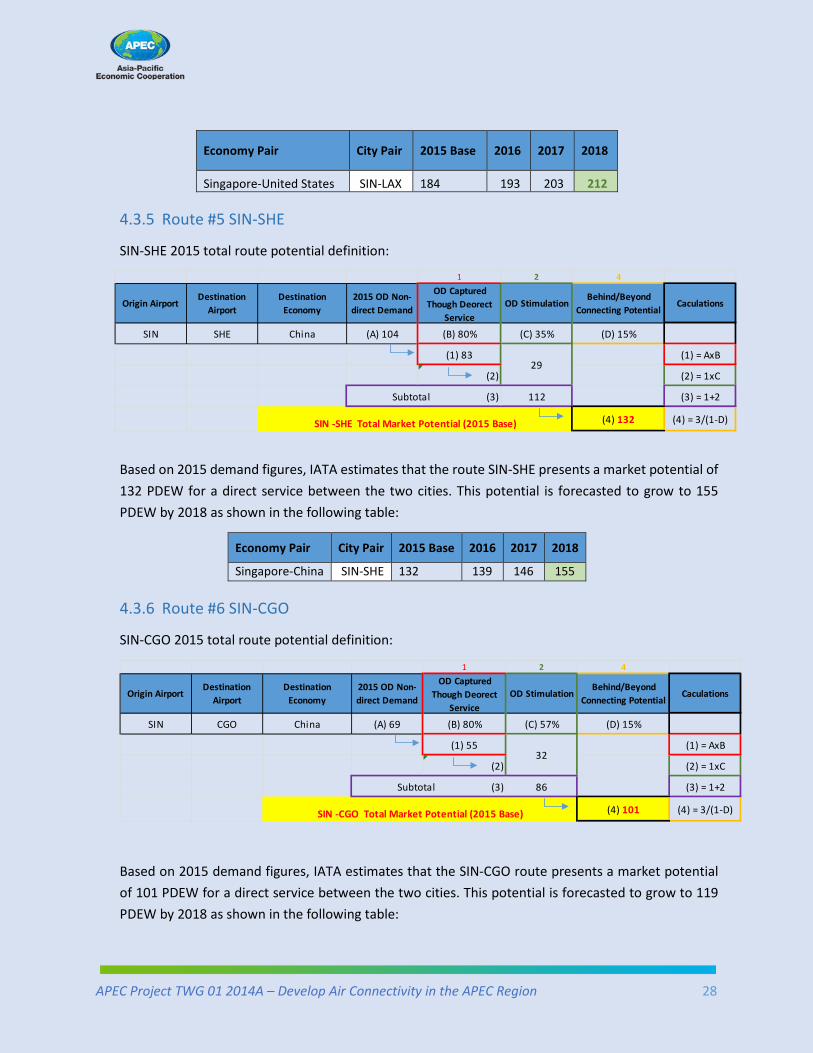
4.3.5 Route #5 SIN-SHE
SIN-SHE 2015 total route potential definition:
Based on 2015 demand figures, IATA estimates that the route SIN-SHE presents a market potential of 132 PDEW for a direct service between the two cities. This potential is forecasted to grow to 155 PDEW by 2018 as shown in the following table:
Economy Pair City Pair 2015 Base 2016 2017 2018
Singapore-China SIN-SHE 132 139 146 155
4.3.6 Route #6 SIN-CGO
SIN-CGO 2015 total route potential definition:
Based on 2015 demand figures, IATA estimates that the SIN-CGO route presents a market potential of 101 PDEW for a direct service between the two cities. This potential is forecasted to grow to 119 PDEW by 2018 as shown in the following table:
1 2 4
Origin AirportDestination
AirportDestination
Economy2015 OD Non-direct Demand
OD Captured Though Deorect
ServiceOD Stimulation
Behind/Beyond Connecting Potential
Caculations
SIN CGO China (A) 69 (B) 80% (C) 57% (D) 15%
(1) 55 (1) = AxB
(2) (2) = 1xC
Subtotal (3) 86 (3) = 1+2
(4) 101 (4) = 3/(1-D)
32
SIN -CGO Total Market Potential (2015 Base)
1 2 4
Origin AirportDestination
AirportDestination
Economy2015 OD Non-direct Demand
OD Captured Though Deorect
ServiceOD Stimulation
Behind/Beyond Connecting Potential
Caculations
SIN SHE China (A) 104 (B) 80% (C) 35% (D) 15%
(1) 83 (1) = AxB
(2) (2) = 1xC
Subtotal (3) 112 (3) = 1+2
(4) 132 (4) = 3/(1-D)
29
SIN -SHE Total Market Potential (2015 Base)

APEC Project TWG 01 2014A – Develop Air Connectivity in the APEC Region 29
Economy Pair City Pair 2015 Base 2016 2017 2018
Singapore-China SIN-CGO 101 107 113 119
4.3.7 Route #7 SIN-DLC
SIN-DLC 2015 total route potential definition:
Based on 2015 demand figures, IATA estimates that the SIN-DLC route presents a market potential of 97 PDEW for a direct service between the two cities. This potential is forecasted to grow to 113 PDEW by 2018 as shown in the following table:
1 2 4
Origin AirportDestination
AirportDestination
Economy2015 OD Non-direct Demand
OD Captured Though Deorect
ServiceOD Stimulation
Behind/Beyond Connecting Potential
Caculations
SIN DLC China (A) 63 (B) 80% (C) 63% (D) 15%
(1) 50 (1) = AxB
(2) (2) = 1xC
Subtotal (3) 82 (3) = 1+2
(4) 97 (4) = 3/(1-D)
32
SIN -DLC Total Market Potential (2015 Base)
Economy Pair City Pair 2015 Base 2016 2017 2018 Singapore-China- SIN-DLC 97 102 107 113
APEC Project TWG 01 2014A – Develop Air Connectivity in the APEC Region 30
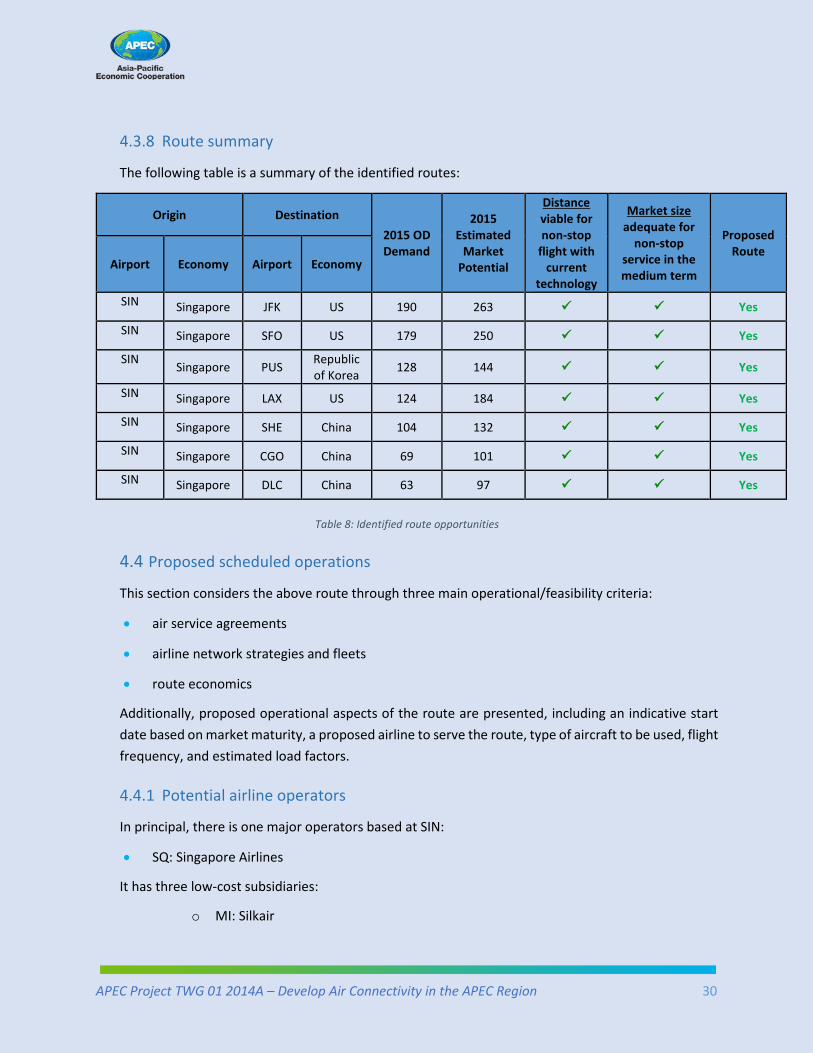
4.3.8 Route summary
The following table is a summary of the identified routes:
Origin Destination 2015 OD Demand
2015 Estimated
Market Potential
Distance viable for non-stop
flight with current
technology
Market size adequate for
non-stop service in the medium term
Proposed Route
Airport Economy Airport Economy
SIN Singapore JFK US 190 263 Yes
SIN Singapore SFO US 179 250 Yes
SIN Singapore PUS Republic of Korea 128 144 Yes
SIN Singapore LAX US 124 184 Yes
SIN Singapore SHE China 104 132 Yes
SIN Singapore CGO China 69 101 Yes
SIN Singapore DLC China 63 97 Yes
Table 8: Identified route opportunities
4.4 Proposed scheduled operations
This section considers the above route through three main operational/feasibility criteria:
• air service agreements
• airline network strategies and fleets
• route economics
Additionally, proposed operational aspects of the route are presented, including an indicative start date based on market maturity, a proposed airline to serve the route, type of aircraft to be used, flight frequency, and estimated load factors.
4.4.1 Potential airline operators
In principal, there is one major operators based at SIN:
• SQ: Singapore Airlines
It has three low-cost subsidiaries:
o MI: Silkair
APEC Project TWG 01 2014A – Develop Air Connectivity in the APEC Region 31
o TR: Tiger Airways o TZ: Scoot Private Limited
One other carrier is based at the airport:
• 3K: Jetstar Asia Airways – Low cost operator.
Only Singapore Airlines and Scoot have long-haul aircraft capable of trans-Pacific operations and Scoot itself is a regional low-cost operator. Indeed, only Singapore Airlines has the scale and experience to operate such routes.
SQ: Singapore Airlines
Singapore Airlines is the flag carrier of Singapore based at SIN. It is majority-owned by the Singapore government investment and holding company Temasek Holdings. It operates to 31 nations around the world and 52 individual airport destinations. It has 102 aircraft operational (including 55 B777 and 19 A380 aircraft) and 14 others on order including 12 A350 new technology aircraft. It is a major partner in the Star Alliance.
3K Jetstar Asia Airways
Jetstar Asia is a low-cost airline, one of the Asian offshoots of parent Jetstar Airways, the low-cost subsidiary airline of Australia's Qantas airline. It operates services to regional destinations in Southeast Asia to economies such as Myanmar; Cambodia; Malaysia; Philippines; Thailand and Viet Nam. It also flies regional routes in East Asia to destinations such as Japan; Chinese Taipei and Hong Kong, China. It is the main feeder airline for its parent company Jetstar Airways for budget passengers flying to Australia. Its sister airlines include Jetstar in New Zealand, Jetstar Pacific, and Jetstar Japan.
Other Airlines
The destinations indicated by the analysis would prompt responses potentially from the following large and significant international carriers:
• AA: American Airlines US
• UA: United Airlines US
• DL: Delta Airlines US
• KE: Korean Korea
• OZ: Asiana/BX: Air Busan Korea
• 7C: Jeju Korea
• CA: Air China China
• MU: China Eastern Airlines China
APEC Project TWG 01 2014A – Develop Air Connectivity in the APEC Region 32
• CZ: China Southern Airlines China
• HU: Hainan Airlines China
• ZH: Shenzhen Airlines China
These are carriers with the fleets, capacity and presence to consider the potential of operating routes at SIN.
4.4.2 Route # 1 New York (JFK)
JFK is the largest airport serving New York City. It is the busiest international air passenger gateway into the United States and is operated by The Port Authority of New York. It has six passenger terminals and two sets of twin-parallel runways. Over seventy airlines operate out of the airport and functions as a hub for American Airlines and Delta Air Lines and Alaskan. It is the primary operating base for JetBlue Airways. Trans-Pacific carriers include Japan Airlines, China Eastern, Air China, Korean Airlines and Cathay Pacific.
The route SIN-JFK has a range of 15,348km and would become the world’s longest route. It would have an estimated 18:40 hours block time.
In 2004, the route which involved SIN-EWR was operated by Singapore Airlines using an A340-500 aircraft. However, in 2013 it ceased operations. Indeed, the carrier still operates SIN-JFK but stops via Frankfurt.
Most recently Singapore Airlines announced that the route will be returned in 2018, confirming its viability using a new technology as it intends to operate a new A350-900 Ultra Long Range aircraft (305 seats).
4.4.3 Route # 2 San Francisco (SFO)
SFO is the largest airport in the San Francisco Bay Area including all of Northern California and the second busiest in California, (after LAX). It is owned operated by the City and County of San Francisco with two sets of twin-parallel runways and four terminals.
It is the fifth largest hub for United Airlines operating as their primary transpacific gateway. It also serves as Virgin America's principal base of operations. Trans-Pacific carriers include EVA Air and Cathay Pacific.
The route SFO-SIN has a range of 13,593km with an estimated 16:35 hours block time. SFO is an important hub for United Airlines.
United Airlines had commenced the daily SIN-SFO route in June 2016 using a B787-9 aircraft.
APEC Project TWG 01 2014A – Develop Air Connectivity in the APEC Region 33
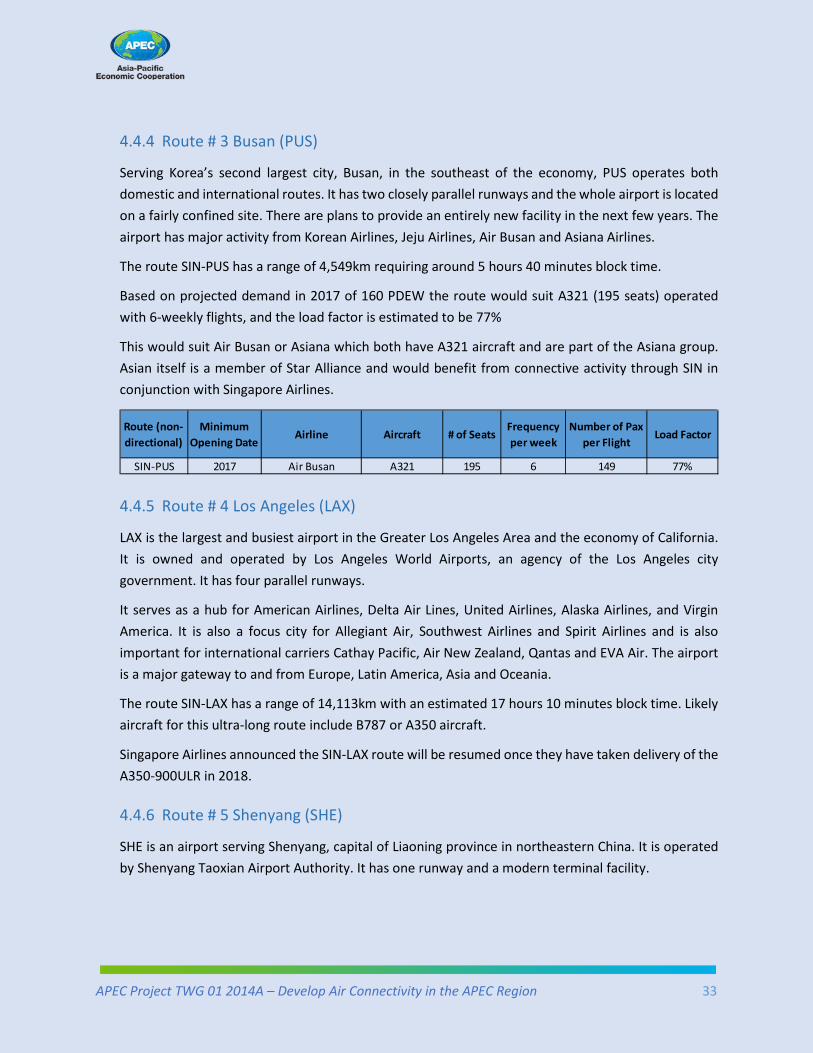
4.4.4 Route # 3 Busan (PUS)
Serving Korea’s second largest city, Busan, in the southeast of the economy, PUS operates both domestic and international routes. It has two closely parallel runways and the whole airport is located on a fairly confined site. There are plans to provide an entirely new facility in the next few years. The airport has major activity from Korean Airlines, Jeju Airlines, Air Busan and Asiana Airlines.
The route SIN-PUS has a range of 4,549km requiring around 5 hours 40 minutes block time.
Based on projected demand in 2017 of 160 PDEW the route would suit A321 (195 seats) operated with 6-weekly flights, and the load factor is estimated to be 77%
This would suit Air Busan or Asiana which both have A321 aircraft and are part of the Asiana group. Asian itself is a member of Star Alliance and would benefit from connective activity through SIN in conjunction with Singapore Airlines.
4.4.5 Route # 4 Los Angeles (LAX)
LAX is the largest and busiest airport in the Greater Los Angeles Area and the economy of California. It is owned and operated by Los Angeles World Airports, an agency of the Los Angeles city government. It has four parallel runways.
It serves as a hub for American Airlines, Delta Air Lines, United Airlines, Alaska Airlines, and Virgin America. It is also a focus city for Allegiant Air, Southwest Airlines and Spirit Airlines and is also important for international carriers Cathay Pacific, Air New Zealand, Qantas and EVA Air. The airport is a major gateway to and from Europe, Latin America, Asia and Oceania.
The route SIN-LAX has a range of 14,113km with an estimated 17 hours 10 minutes block time. Likely aircraft for this ultra-long route include B787 or A350 aircraft.
Singapore Airlines announced the SIN-LAX route will be resumed once they have taken delivery of the A350-900ULR in 2018.
4.4.6 Route # 5 Shenyang (SHE)
SHE is an airport serving Shenyang, capital of Liaoning province in northeastern China. It is operated by Shenyang Taoxian Airport Authority. It has one runway and a modern terminal facility.
Route (non-directional)
Minimum Opening Date
Airline Aircraft # of SeatsFrequency per week
Number of Pax per Flight
Load Factor
SIN-PUS 2017 Air Busan A321 195 6 149 77%
APEC Project TWG 01 2014A – Develop Air Connectivity in the APEC Region 34
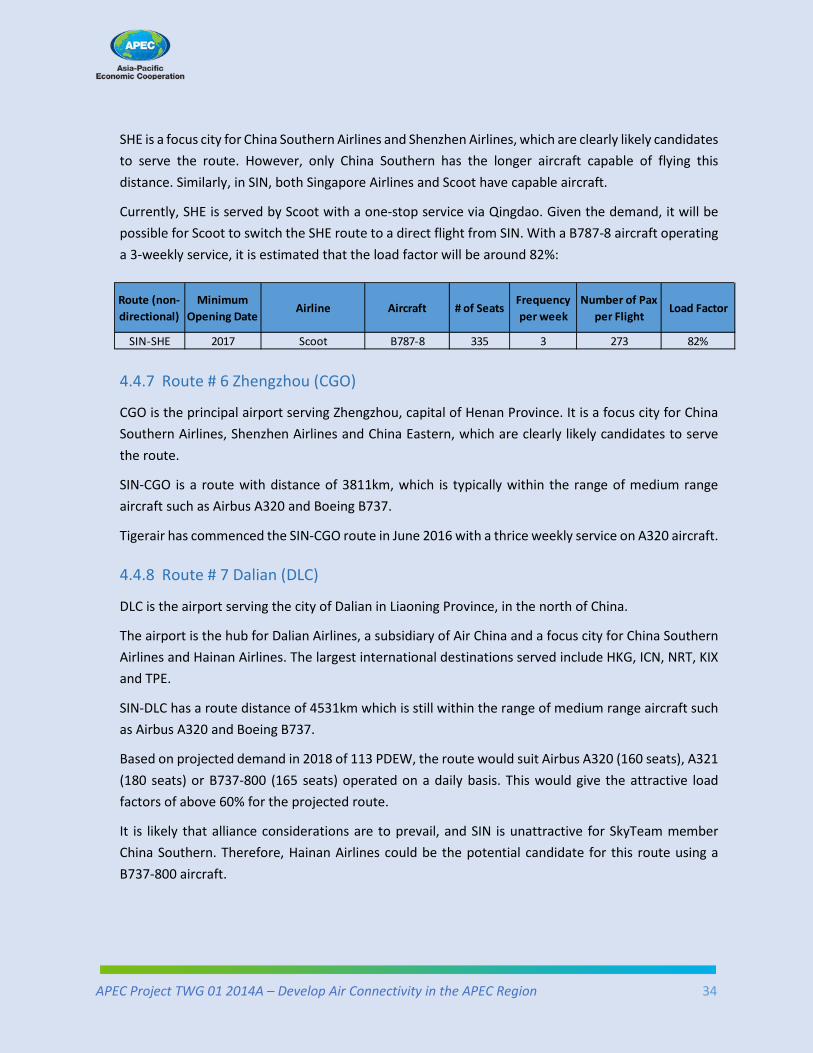
SHE is a focus city for China Southern Airlines and Shenzhen Airlines, which are clearly likely candidates to serve the route. However, only China Southern has the longer aircraft capable of flying this distance. Similarly, in SIN, both Singapore Airlines and Scoot have capable aircraft.
Currently, SHE is served by Scoot with a one-stop service via Qingdao. Given the demand, it will be possible for Scoot to switch the SHE route to a direct flight from SIN. With a B787-8 aircraft operating a 3-weekly service, it is estimated that the load factor will be around 82%:
4.4.7 Route # 6 Zhengzhou (CGO)
CGO is the principal airport serving Zhengzhou, capital of Henan Province. It is a focus city for China Southern Airlines, Shenzhen Airlines and China Eastern, which are clearly likely candidates to serve the route.
SIN-CGO is a route with distance of 3811km, which is typically within the range of medium range aircraft such as Airbus A320 and Boeing B737.
Tigerair has commenced the SIN-CGO route in June 2016 with a thrice weekly service on A320 aircraft.
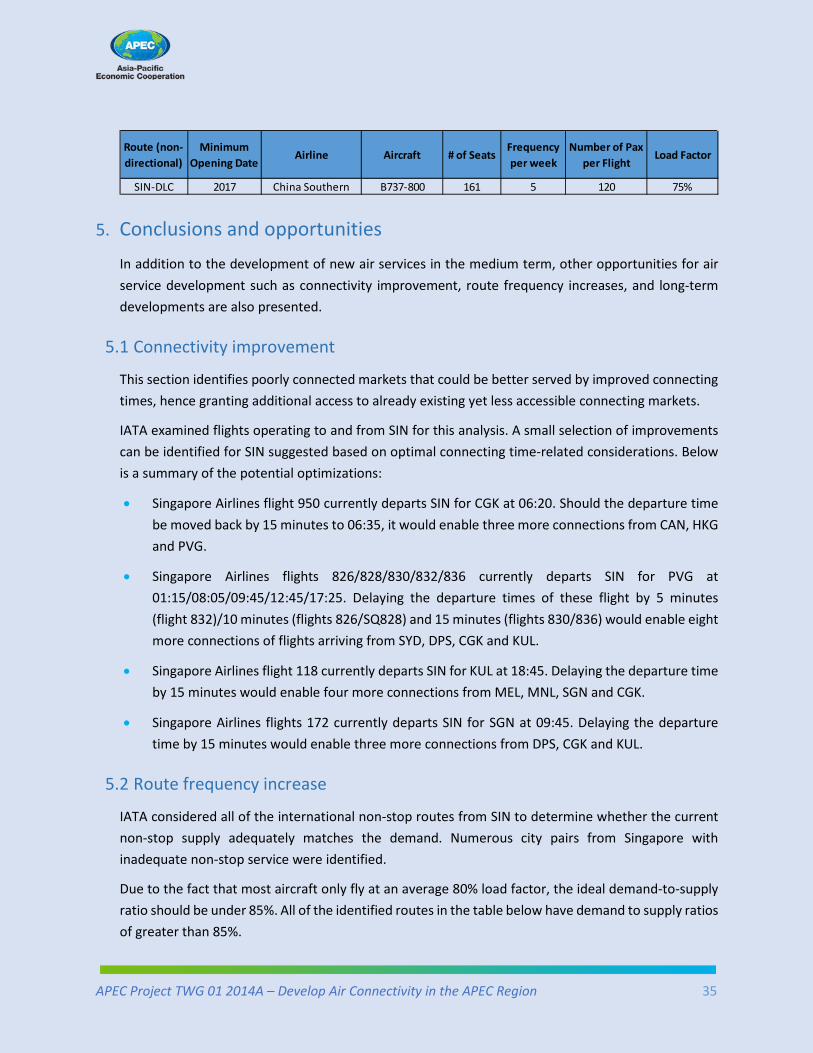
4.4.8 Route # 7 Dalian (DLC)
DLC is the airport serving the city of Dalian in Liaoning Province, in the north of China.
The airport is the hub for Dalian Airlines, a subsidiary of Air China and a focus city for China Southern Airlines and Hainan Airlines. The largest international destinations served include HKG, ICN, NRT, KIX and TPE.
SIN-DLC has a route distance of 4531km which is still within the range of medium range aircraft such as Airbus A320 and Boeing B737.
Based on projected demand in 2018 of 113 PDEW, the route would suit Airbus A320 (160 seats), A321 (180 seats) or B737-800 (165 seats) operated on a daily basis. This would give the attractive load factors of above 60% for the projected route.
It is likely that alliance considerations are to prevail, and SIN is unattractive for SkyTeam member China Southern. Therefore, Hainan Airlines could be the potential candidate for this route using a B737-800 aircraft.
Route (non-directional)
Minimum Opening Date
Airline Aircraft # of SeatsFrequency per week
Number of Pax per Flight
Load Factor
SIN-SHE 2017 Scoot B787-8 335 3 273 82%
APEC Project TWG 01 2014A – Develop Air Connectivity in the APEC Region 35
5. Conclusions and opportunities In addition to the development of new air services in the medium term, other opportunities for air service development such as connectivity improvement, route frequency increases, and long-term developments are also presented.
5.1 Connectivity improvement
This section identifies poorly connected markets that could be better served by improved connecting times, hence granting additional access to already existing yet less accessible connecting markets.
IATA examined flights operating to and from SIN for this analysis. A small selection of improvements can be identified for SIN suggested based on optimal connecting time-related considerations. Below is a summary of the potential optimizations:
• Singapore Airlines flight 950 currently departs SIN for CGK at 06:20. Should the departure time be moved back by 15 minutes to 06:35, it would enable three more connections from CAN, HKG and PVG.
• Singapore Airlines flights 826/828/830/832/836 currently departs SIN for PVG at 01:15/08:05/09:45/12:45/17:25. Delaying the departure times of these flight by 5 minutes (flight 832)/10 minutes (flights 826/SQ828) and 15 minutes (flights 830/836) would enable eight more connections of flights arriving from SYD, DPS, CGK and KUL.
• Singapore Airlines flight 118 currently departs SIN for KUL at 18:45. Delaying the departure time by 15 minutes would enable four more connections from MEL, MNL, SGN and CGK.
• Singapore Airlines flights 172 currently departs SIN for SGN at 09:45. Delaying the departure time by 15 minutes would enable three more connections from DPS, CGK and KUL.
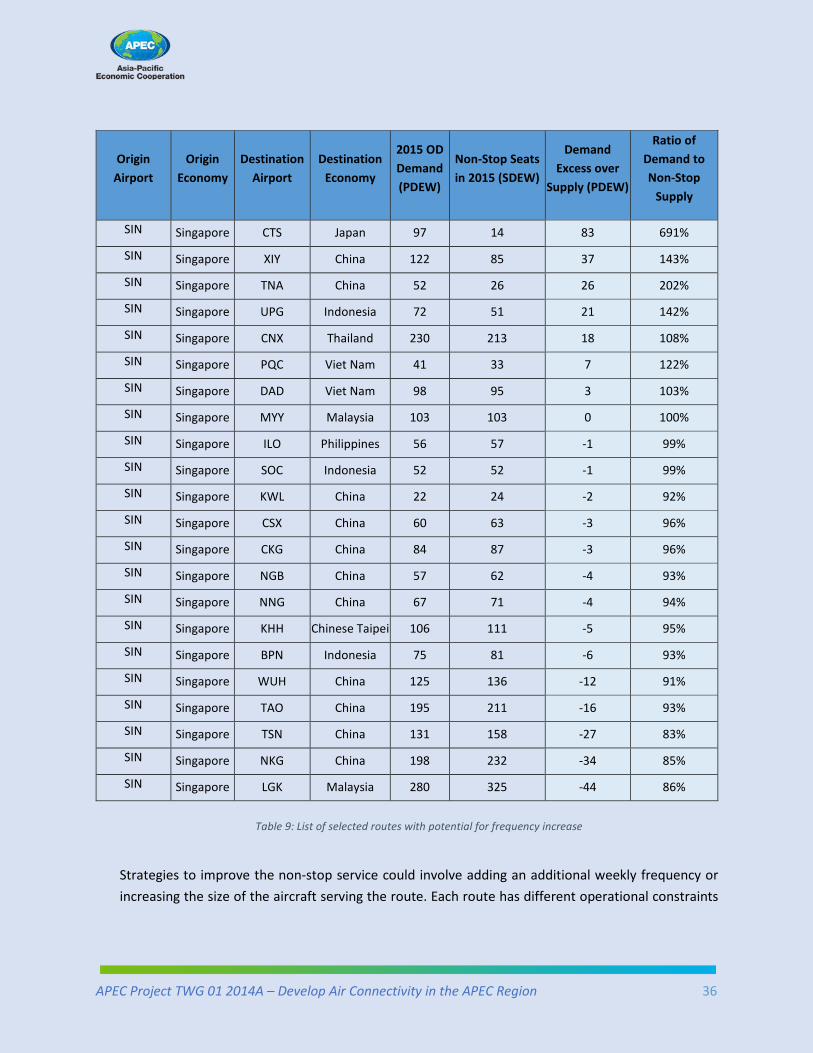
5.2 Route frequency increase
IATA considered all of the international non-stop routes from SIN to determine whether the current non-stop supply adequately matches the demand. Numerous city pairs from Singapore with inadequate non-stop service were identified.
Due to the fact that most aircraft only fly at an average 80% load factor, the ideal demand-to-supply ratio should be under 85%. All of the identified routes in the table below have demand to supply ratios of greater than 85%.
Route (non-directional)
Minimum Opening Date
Airline Aircraft # of SeatsFrequency per week
Number of Pax per Flight
Load Factor
SIN-DLC 2017 China Southern B737-800 161 5 120 75%
APEC Project TWG 01 2014A – Develop Air Connectivity in the APEC Region 36
Origin Airport
Origin Economy
Destination Airport
Destination Economy
2015 OD Demand (PDEW)
Non-Stop Seats in 2015 (SDEW)
Demand Excess over
Supply (PDEW)
Ratio of Demand to Non-Stop
Supply
SIN Singapore CTS Japan 97 14 83 691%
SIN Singapore XIY China 122 85 37 143%
SIN Singapore TNA China 52 26 26 202%
SIN Singapore UPG Indonesia 72 51 21 142%
SIN Singapore CNX Thailand 230 213 18 108%
SIN Singapore PQC Viet Nam 41 33 7 122%
SIN Singapore DAD Viet Nam 98 95 3 103%
SIN Singapore MYY Malaysia 103 103 0 100%
SIN Singapore ILO Philippines 56 57 -1 99%
SIN Singapore SOC Indonesia 52 52 -1 99%
SIN Singapore KWL China 22 24 -2 92%
SIN Singapore CSX China 60 63 -3 96%
SIN Singapore CKG China 84 87 -3 96%
SIN Singapore NGB China 57 62 -4 93%
SIN Singapore NNG China 67 71 -4 94%
SIN Singapore KHH Chinese Taipei 106 111 -5 95%
SIN Singapore BPN Indonesia 75 81 -6 93%
SIN Singapore WUH China 125 136 -12 91%
SIN Singapore TAO China 195 211 -16 93%
SIN Singapore TSN China 131 158 -27 83%
SIN Singapore NKG China 198 232 -34 85%
SIN Singapore LGK Malaysia 280 325 -44 86%
Table 9: List of selected routes with potential for frequency increase
Strategies to improve the non-stop service could involve adding an additional weekly frequency or increasing the size of the aircraft serving the route. Each route has different operational constraints
APEC Project TWG 01 2014A – Develop Air Connectivity in the APEC Region 37
depending on the distance and type of market being served (short-haul vs. long-haul or business vs. leisure market).
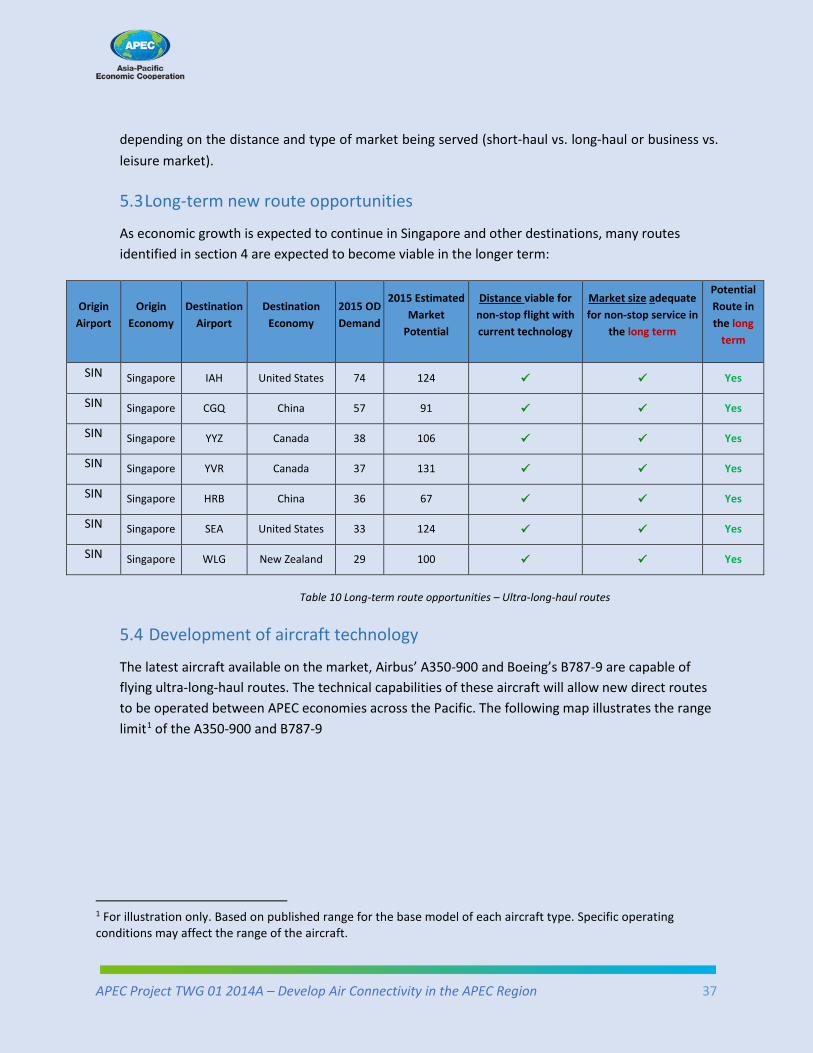
5.3 Long-term new route opportunities
As economic growth is expected to continue in Singapore and other destinations, many routes identified in section 4 are expected to become viable in the longer term:
Table 10 Long-term route opportunities – Ultra-long-haul routes
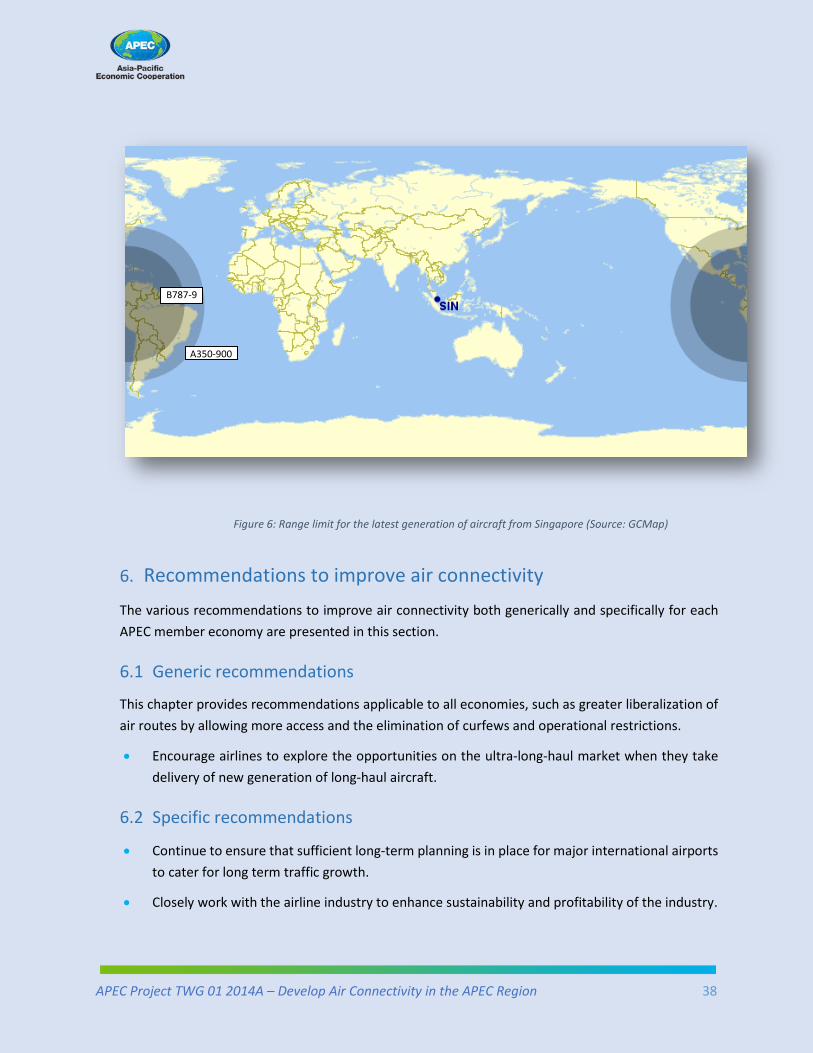
5.4 Development of aircraft technology
The latest aircraft available on the market, Airbus’ A350-900 and Boeing’s B787-9 are capable of flying ultra-long-haul routes. The technical capabilities of these aircraft will allow new direct routes to be operated between APEC economies across the Pacific. The following map illustrates the range limit1 of the A350-900 and B787-9
1 For illustration only. Based on published range for the base model of each aircraft type. Specific operating conditions may affect the range of the aircraft.
Origin Airport
Origin Economy
Destination Airport
Destination Economy
2015 OD Demand
2015 Estimated Market
Potential
Distance viable for non-stop flight with current technology
Market size adequate for non-stop service in
the long term
Potential Route in the long
term
SIN Singapore IAH United States 74 124 Yes
SIN Singapore CGQ China 57 91 Yes
SIN Singapore YYZ Canada 38 106 Yes
SIN Singapore YVR Canada 37 131 Yes
SIN Singapore HRB China 36 67 Yes
SIN Singapore SEA United States 33 124 Yes
SIN Singapore WLG New Zealand 29 100 Yes
APEC Project TWG 01 2014A – Develop Air Connectivity in the APEC Region 38
Figure 6: Range limit for the latest generation of aircraft from Singapore (Source: GCMap)
6. Recommendations to improve air connectivity
The various recommendations to improve air connectivity both generically and specifically for each APEC member economy are presented in this section.
6.1 Generic recommendations
This chapter provides recommendations applicable to all economies, such as greater liberalization of air routes by allowing more access and the elimination of curfews and operational restrictions.
• Encourage airlines to explore the opportunities on the ultra-long-haul market when they take delivery of new generation of long-haul aircraft.
6.2 Specific recommendations
• Continue to ensure that sufficient long-term planning is in place for major international airports to cater for long term traffic growth.
• Closely work with the airline industry to enhance sustainability and profitability of the industry.
A350-900
B787-9
APEC Project TWG 01 2014A – Develop Air Connectivity in the APEC Region 39
6.3 How the APEC economy’s regulator can help
• Work closely with different stakeholders for example Singapore Tourism Board, Singapore International Chamber of Commerce, etc. to gain a deeper understanding of the development of the aviation demand.
• Ensure that the major international airports have the adequate investment and improvement program to cater for future traffic demand.
• Explore the possibility of relaxing visa requirements for tourists.
APEC Project TWG 01 2014A – Develop Air Connectivity in the APEC Region 40
7. Appendix
7.1 Overview of IATA and IATA Consulting
7.1.1 IATA
IATA – The International Air Transport Association was founded in 1945 as the prime vehicle for inter-airline cooperation in promoting safe, reliable, secure and economical air service for the benefit of the world’s consumers. IATA is fully committed to supporting the commercial aviation industry’s stakeholders and governments in their efforts to achieve profitability and long-term viability.
IATA’s mission:
- To represent, lead and serve the airline industry.
IATA’s vision:
- To be the force for value creation and innovation, driving a safe, secure and profitable air transport industry that sustainably connects and enriches our world.
IATA in numbers:
- 250+ member airlines
- 83% of total air traffic
- $387B processed by IATA financial systems
- 1,400+ employees
- 54 offices in 53 countries
7.1.2 IATA Consulting
IATA Consulting overview
IATA Consulting has comprehensive experience in the full array of business challenges facing the aviation sector. Serving the airline industry for 70 years, IATA has developed unrivalled practical experience, which we bring forth to provide the best solutions to our clients.
With our depth and breadth of aviation industry experience, we assist clients to maximize the value of their operating model, realize growth ambitions and gain insights that translate into sustainable competitive advantages.

APEC Project TWG 01 2014A – Develop Air Connectivity in the APEC Region 41
IATA Consulting has expertise in the following areas:
Our Clients
IATA Consulting has successfully demonstrated its capabilities by providing airlines, airports, tourism offices and other organizations with accurate, unbiased and reliable high quality information and analysis to help them define and understand their markets, while ensuring their long-term facility development and financial success.
IATA is trusted by multiple clients all over the world including airlines, airports, governments and aviation institutions.

APEC Project TWG 01 2014A – Develop Air Connectivity in the APEC Region 42
Why IATA Consulting was chosen for this project
IATA has, over time, recruited and retained some of the most highly experienced and capable aviation consulting resources within the aviation industry. Due to its position at the heart of the industry, IATA has access to exceptionally skilled and informed subject matter experts and specialists. IATA Consulting’s objective is to make a positive difference in its clients’ performance, while delivering quality services to all industry stakeholders.
IATA Consulting provides its customers with vast knowledge and expertise in all sectors of the industry worldwide. Our approach has been finely tuned to leverage IATA’s global presence and industry thought leadership position in the development of tailored solutions that fit with local cultural considerations and embody international best practices. Our consultants rely on international state-of-the-art standards, unmatched access to data, and products and expert resources to provide cost-efficient and highly informed solutions.
IATA is backed by a robust set of decision support tools, Airport IS and Pax IS have been essential to undertake this study.
Airport IS and Pax IS are the most comprehensive aviation databases available in the marketplace, capturing 100% of traffic around the world and bringing together total market supply and demand under a single platform. The data provided is accurate and reliable, as it is captured through IATA’s Billing and Settlement Plan (BSP).
APEC Project TWG 01 2014A – Develop Air Connectivity in the APEC Region 43
Bibliography
• World Shipping Council. (2014). Retrieved from http://www.worldshipping.org/about-the-industry/global-trade/ports
• ACI and Changi Airport Group. (2016).
• Airport Intelligence Services. (2016). Airport IS reports. Retrieved from https://airport-is.com/ais/siteMenu.jsp
• Albatross Airport. (2016). Retrieved from World Airports Traffic Report: https://www.airport-information.com/data/
• Belobaba, P. (2015). The Global Airline Industry. Wiley Publishing.
• Duval, D. (2008). Regulation, competition and the politics of air access across the Pacific. Journal of Air Transport Management.
• IATA. (n.d.). Global Traffic Forecast.
• ICF International. (2014). Successful Air Service Development.
• International Monetary Fund. (2016). List of per capita nominal GDP for countries and dependencies. Retrieved from http://www.imf.org/external/index.htm
• OECD Urban Policy Review. (2015). Urban Policy Review.
• Oxford Economics. (2011). Economic Benefits from Air Transport in Singpaore. Retrieved from https://www.iata.org/policy/Documents/Benefits-of-Aviation-Singapore-2011.pdf
• Singapore Tourist Board. (2016). Retrieved from https://www.stb.gov.sg/statistics-and-market-insights/Pages/statistics-Annual-Tourism-Statistics.aspx
• Swan, W. (2008). Forecasting Air Travel with Open Skies. Retrieved from Seabury Airline Planning Group: www.sauder.ubc.ca/.../Forecasting%20Asia%20Open%20Skies.ashx
• UN. (2015). Retrieved from http://data.un.org/Data.aspx?q=population&d=PopDiv&f=variableID%3a12
• World Bank. (2015). Retrieved from http://data.worldbank.org/data-catalog/population-projection-tables
• World Travel and Tourism Council. (2016). Retrieved from http://www.wttc.org/-/media/files/reports/economic%20impact%20research/countries%202016/singapore2016.pdf

APEC Project TWG 01 2014A – Develop Air Connectivity in the APEC Region 44
• WTO. (2015). Retrieved from http://stat.wto.org/CountryProfile/WSDBCountryPFView.aspx?Language=E&Country=CN
Produced by
International Air Transport Association
www.iata.org/consulting
For Asia-Pacific Economic Cooperation Secretariat 35 Heng Mui Keng Terrace Singapore 119616 Tel: (65) 68919 600 Fax: (65) 68919 690 Email: [email protected] Website: www.apec.org © 2016 APEC Secretariat APEC#216-TO-01.19
Head Office Canada: 800 Place Victoria, PO Box 113 Montreal H4Z 1M1, Quebec, Canada