Embed Size (px)
Citation preview


Metrics that Matter
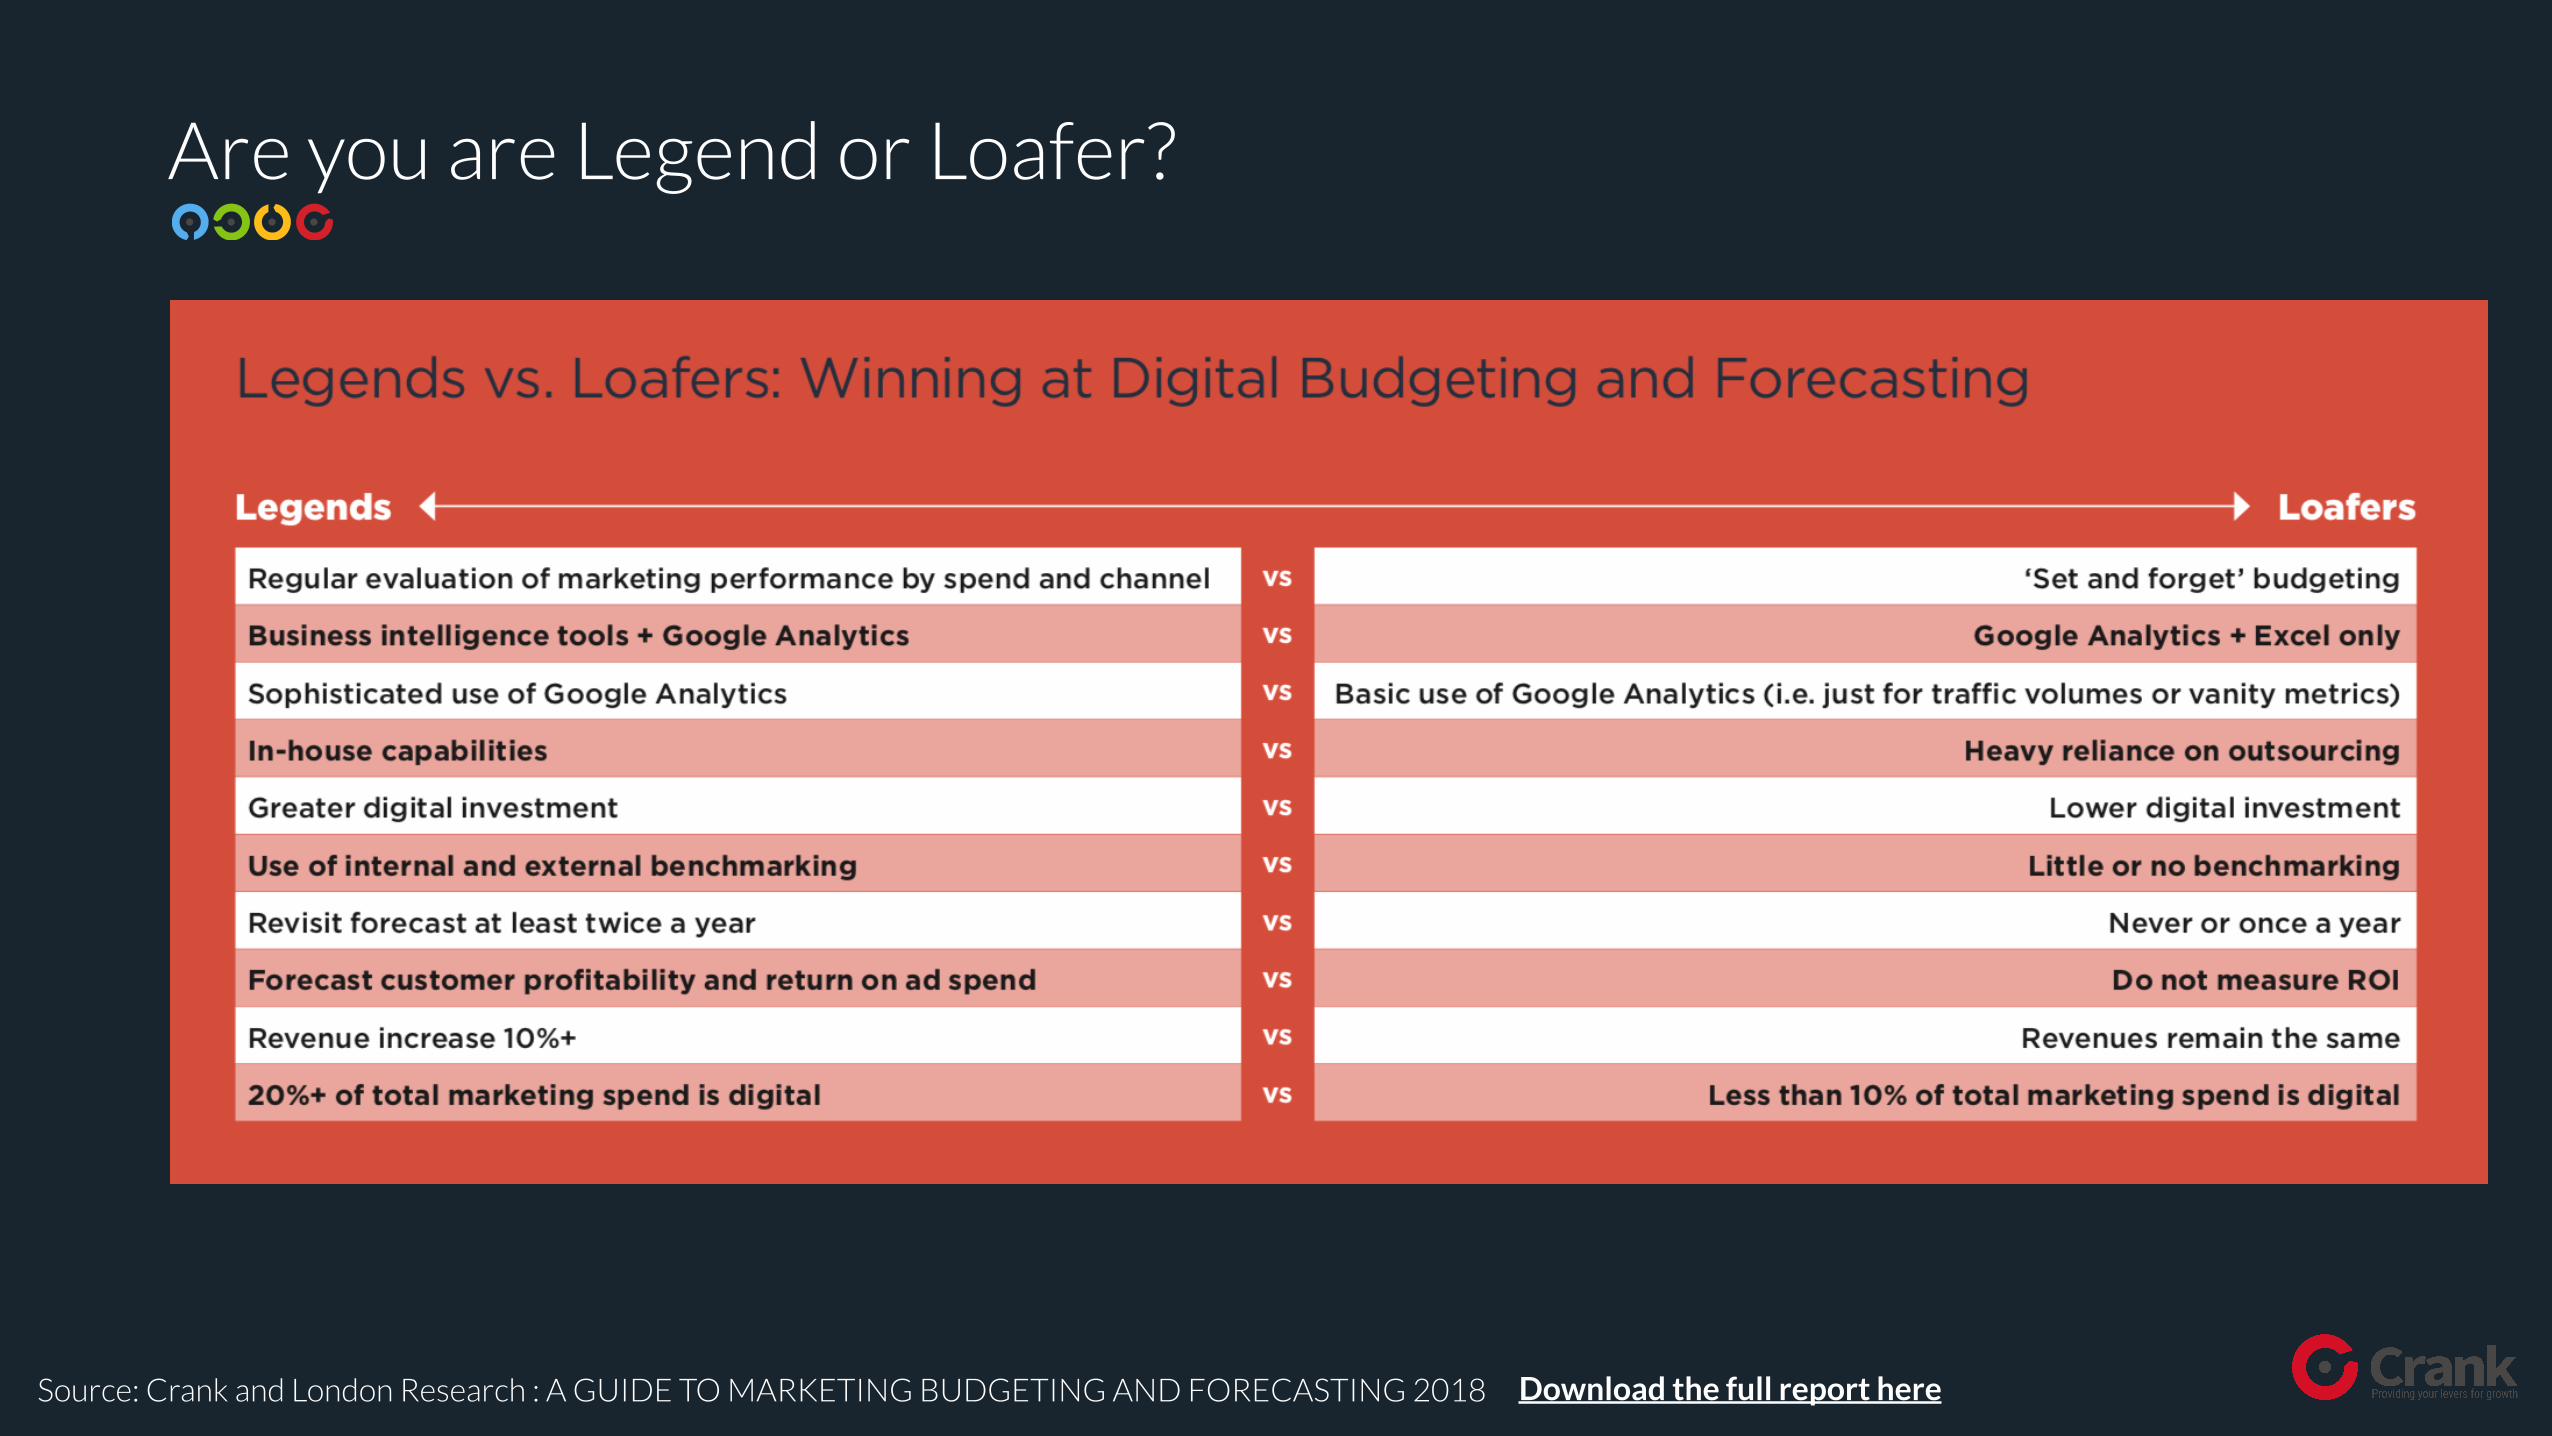
Are you are Legend or Loafer?
Source: Crank and London Research : A GUIDE TO MARKETING BUDGETING AND FORECASTING 2018 Download the full report here
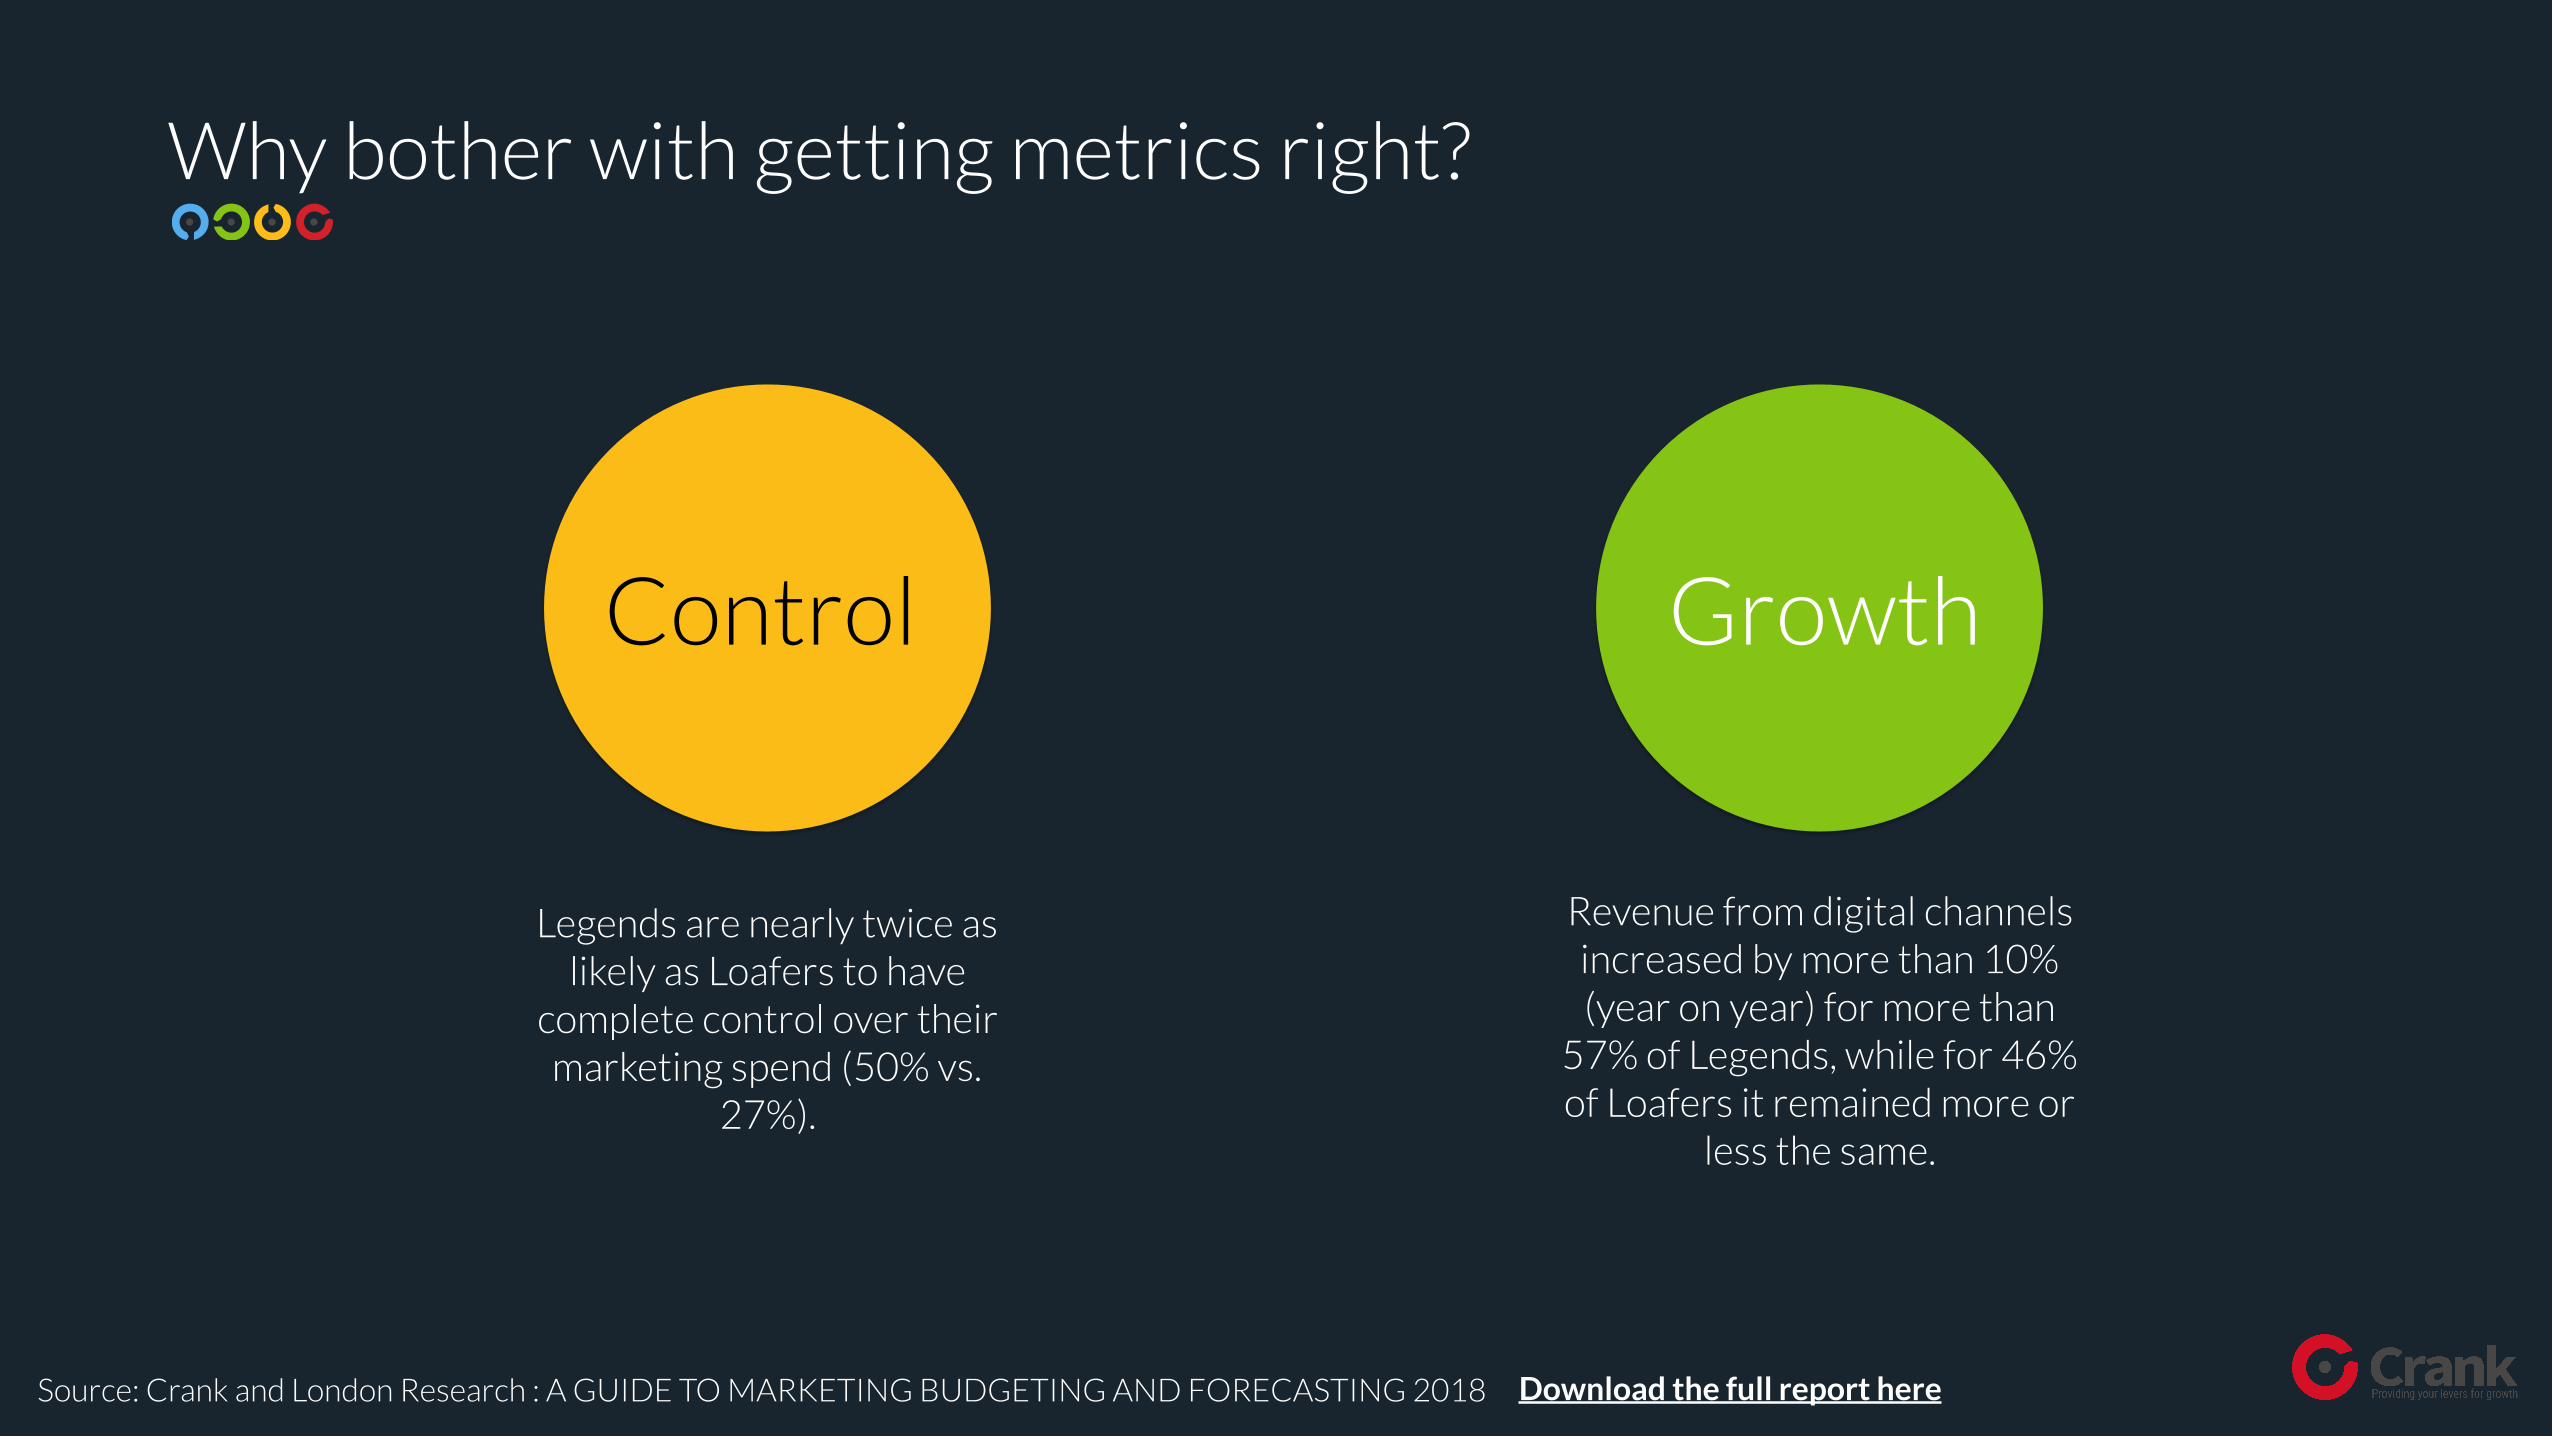
Why bother with getting metrics right?
Legends are nearly twice as likely as Loafers to have
complete control over their marketing spend (50% vs.
27%).
Revenue from digital channels increased by more than 10% (year on year) for more than
57% of Legends, while for 46% of Loafers it remained more or
less the same.
Control Growth
Source: Crank and London Research : A GUIDE TO MARKETING BUDGETING AND FORECASTING 2018 Download the full report here
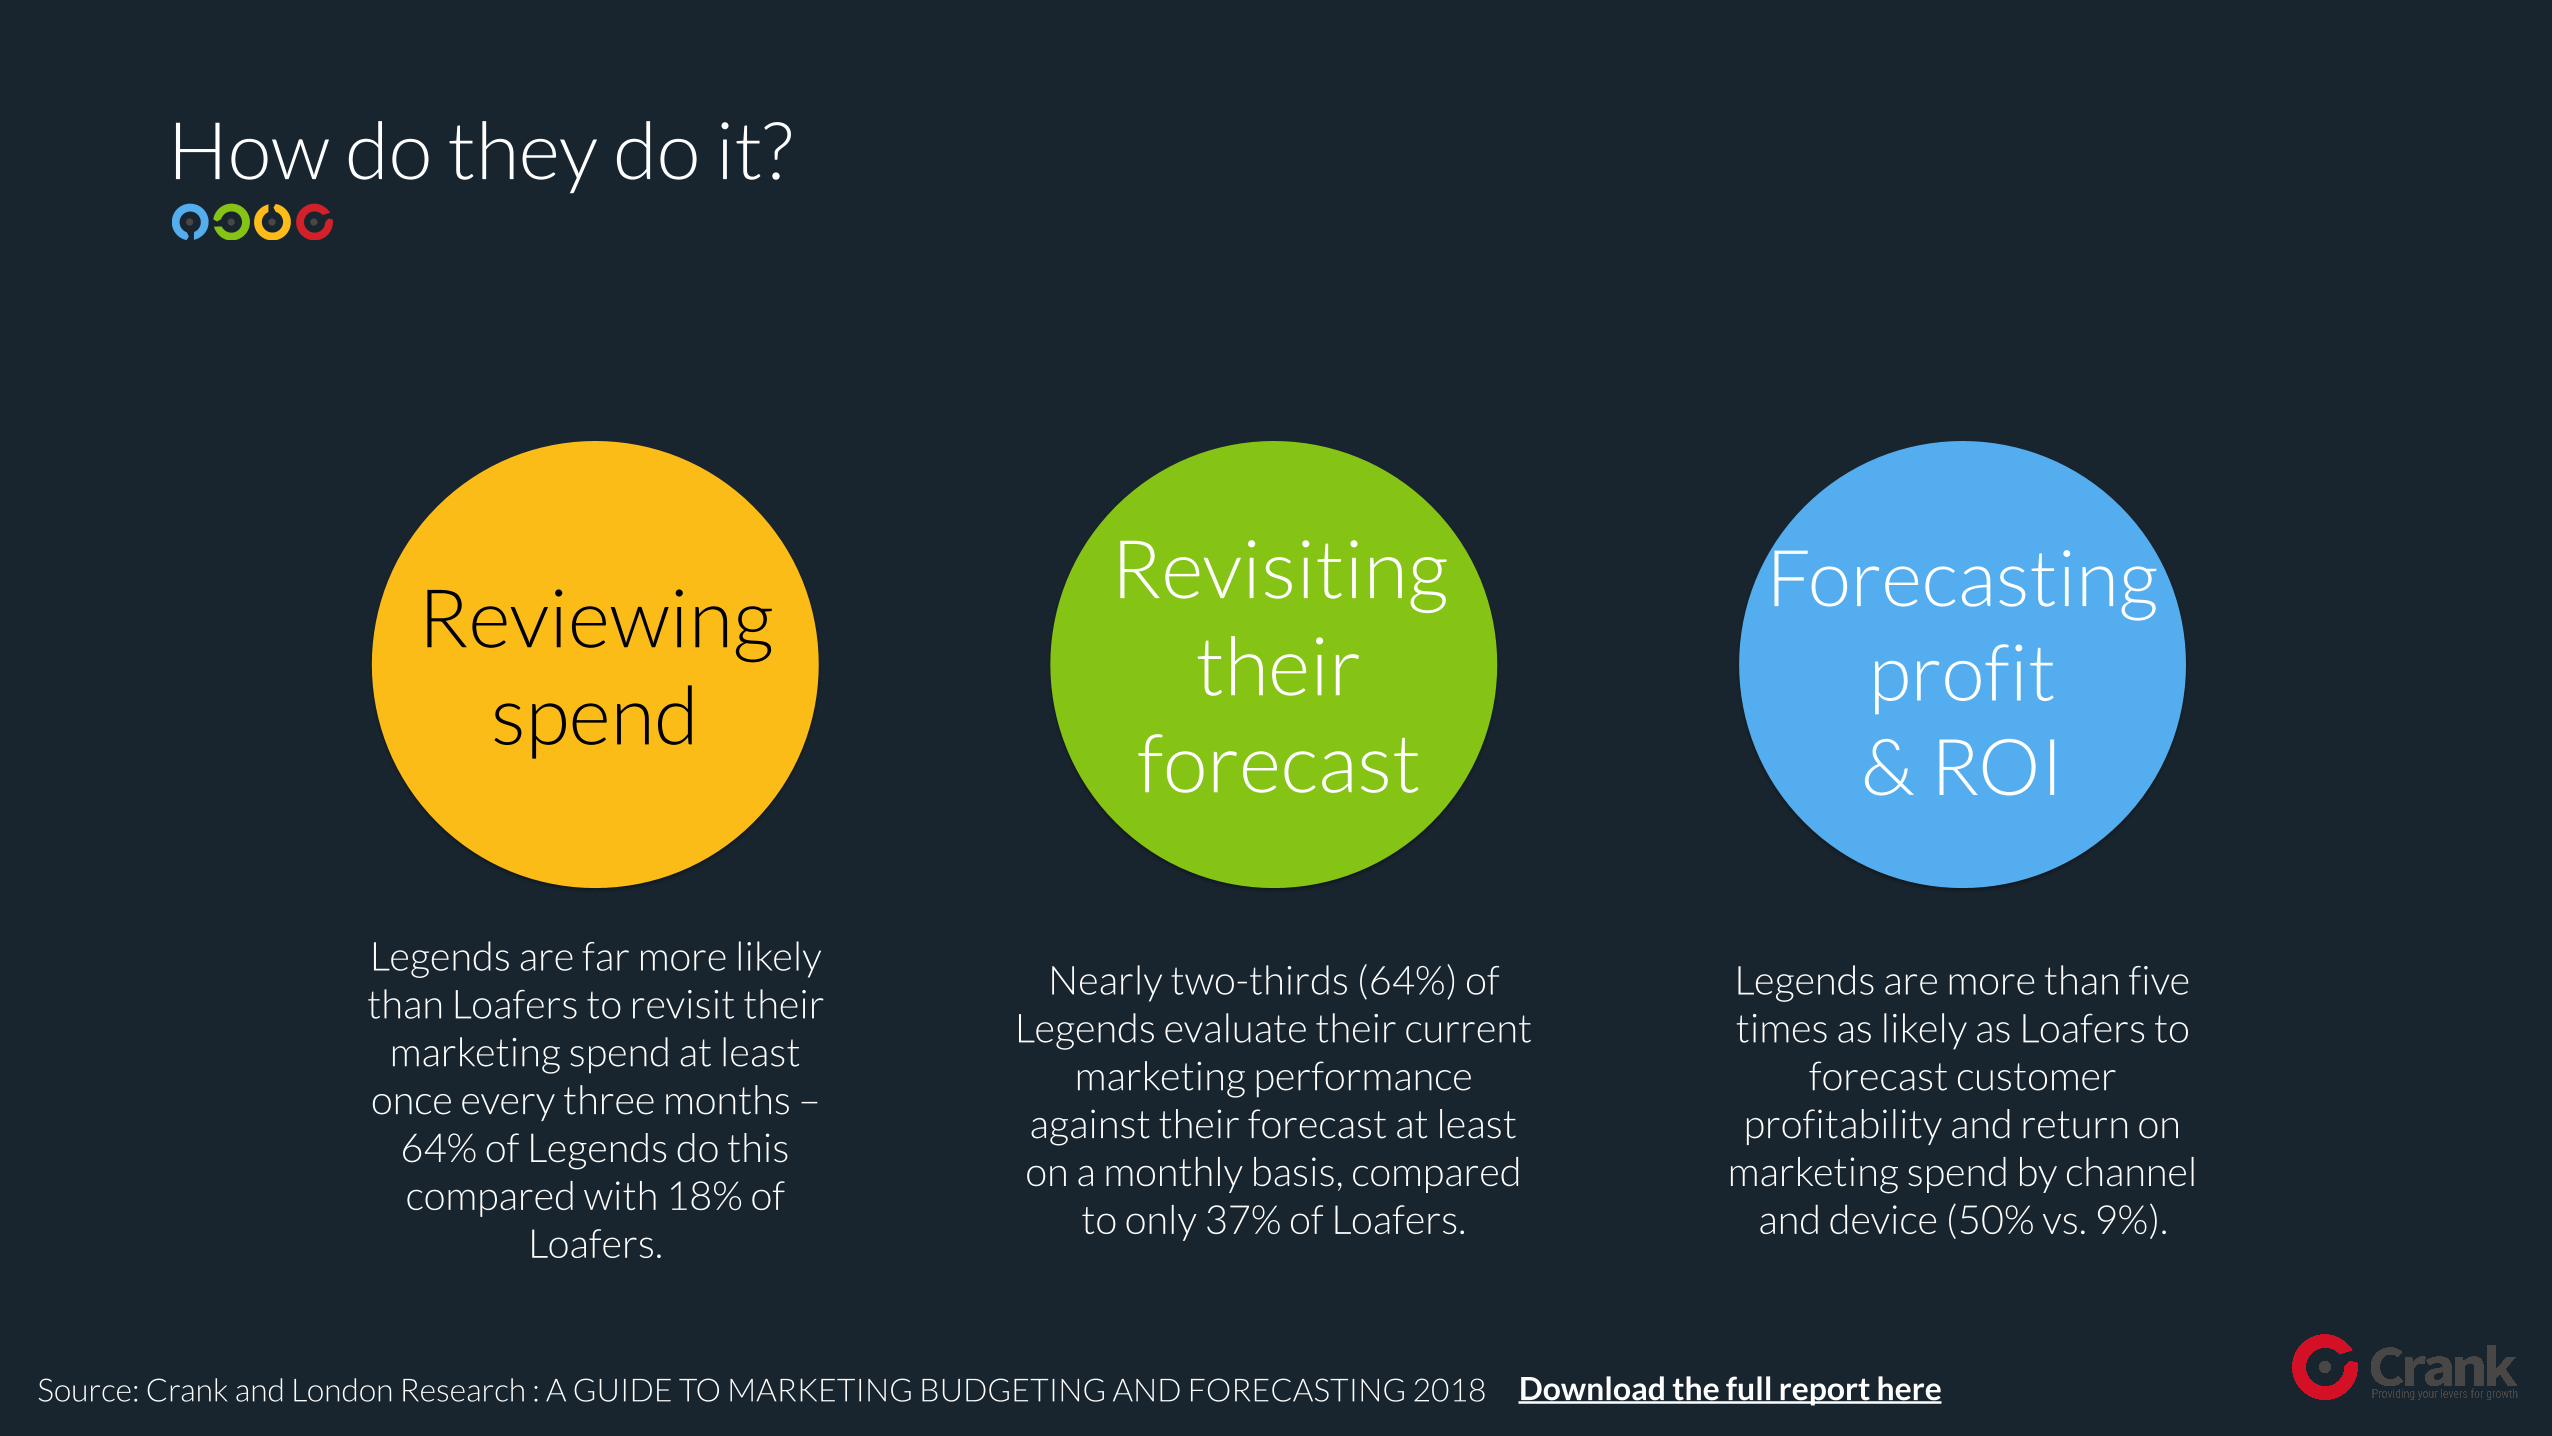
How do they do it?
Legends are far more likely than Loafers to revisit their
marketing spend at least once every three months –
64% of Legends do this compared with 18% of
Loafers.
Nearly two-thirds (64%) of Legends evaluate their current
marketing performance against their forecast at least on a monthly basis, compared
to only 37% of Loafers.
Legends are more than five times as likely as Loafers to
forecast customer profitability and return on
marketing spend by channel and device (50% vs. 9%).
Reviewing spend
Revisiting their
forecast
Source: Crank and London Research : A GUIDE TO MARKETING BUDGETING AND FORECASTING 2018
Forecasting profit & ROI
Download the full report here

Benchmarking Best Practice
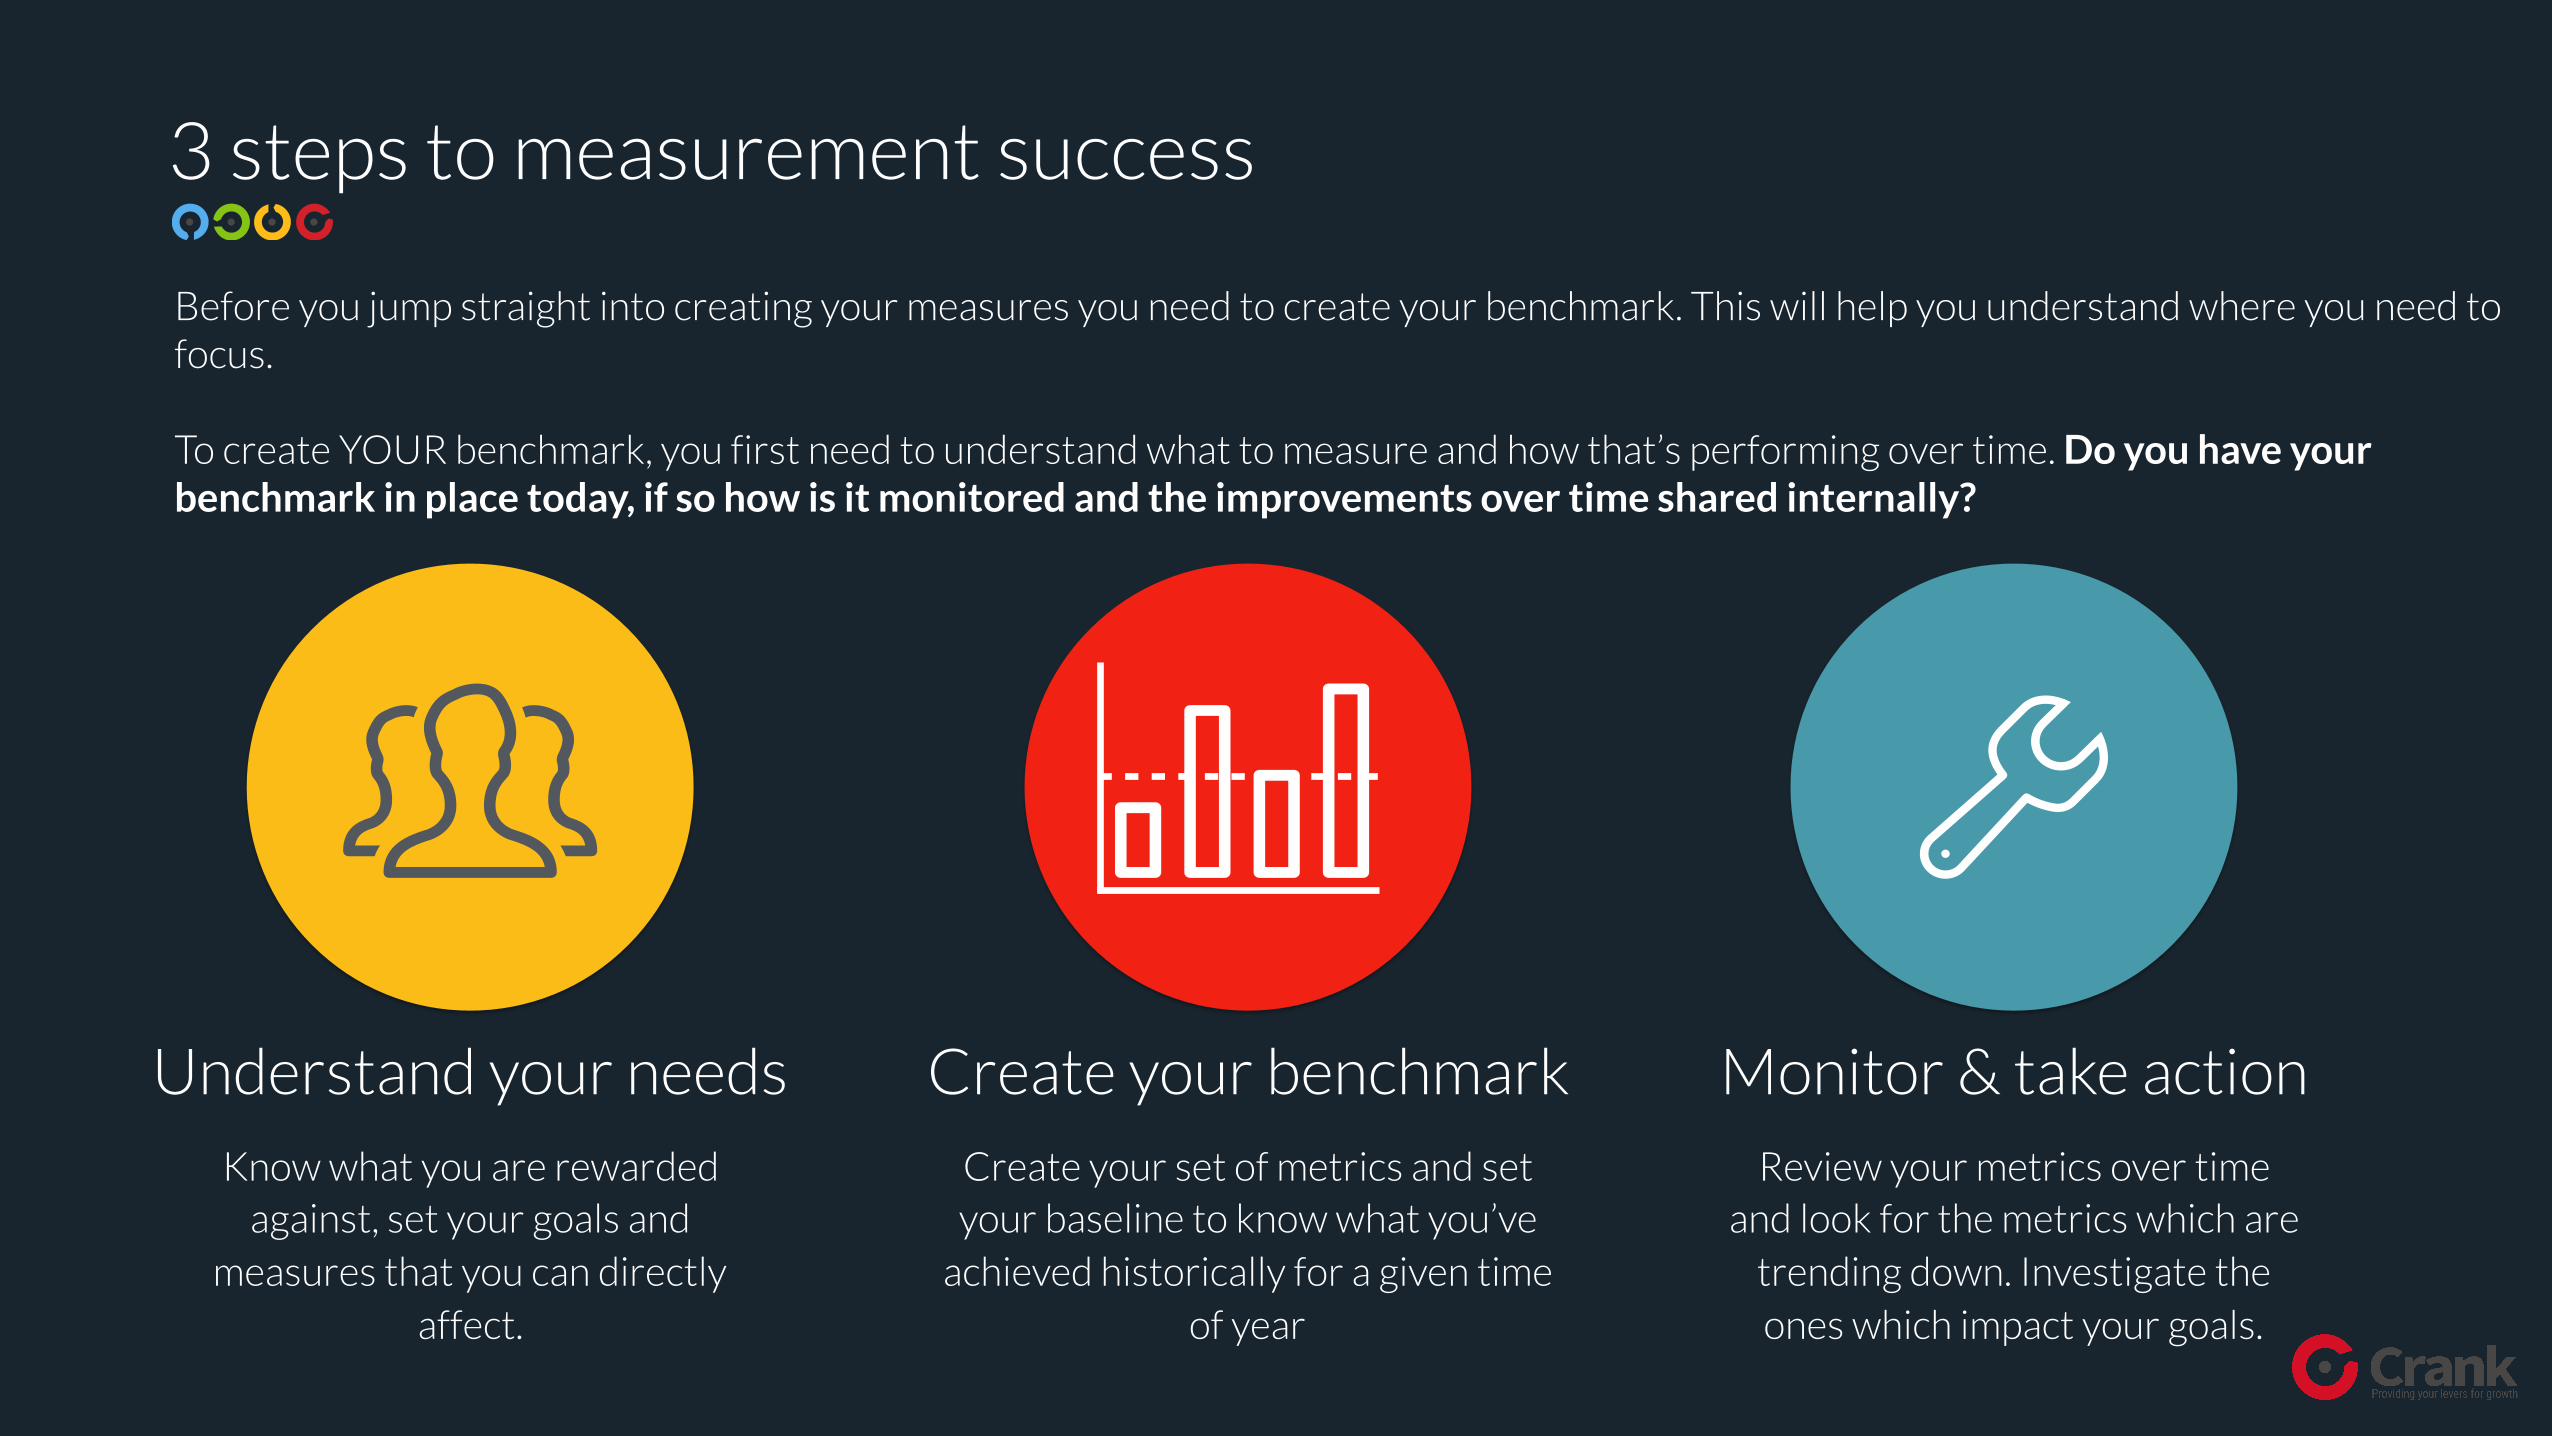
3 steps to measurement success
Understand your needs
Know what you are rewarded against, set your goals and
measures that you can directly affect.
Create your benchmark
Create your set of metrics and set your baseline to know what you’ve
achieved historically for a given time of year
Monitor & take action
Review your metrics over time and look for the metrics which are
trending down. Investigate the ones which impact your goals.
Before you jump straight into creating your measures you need to create your benchmark. This will help you understand where you need to focus.
To create YOUR benchmark, you first need to understand what to measure and how that’s performing over time. Do you have your benchmark in place today, if so how is it monitored and the improvements over time shared internally?
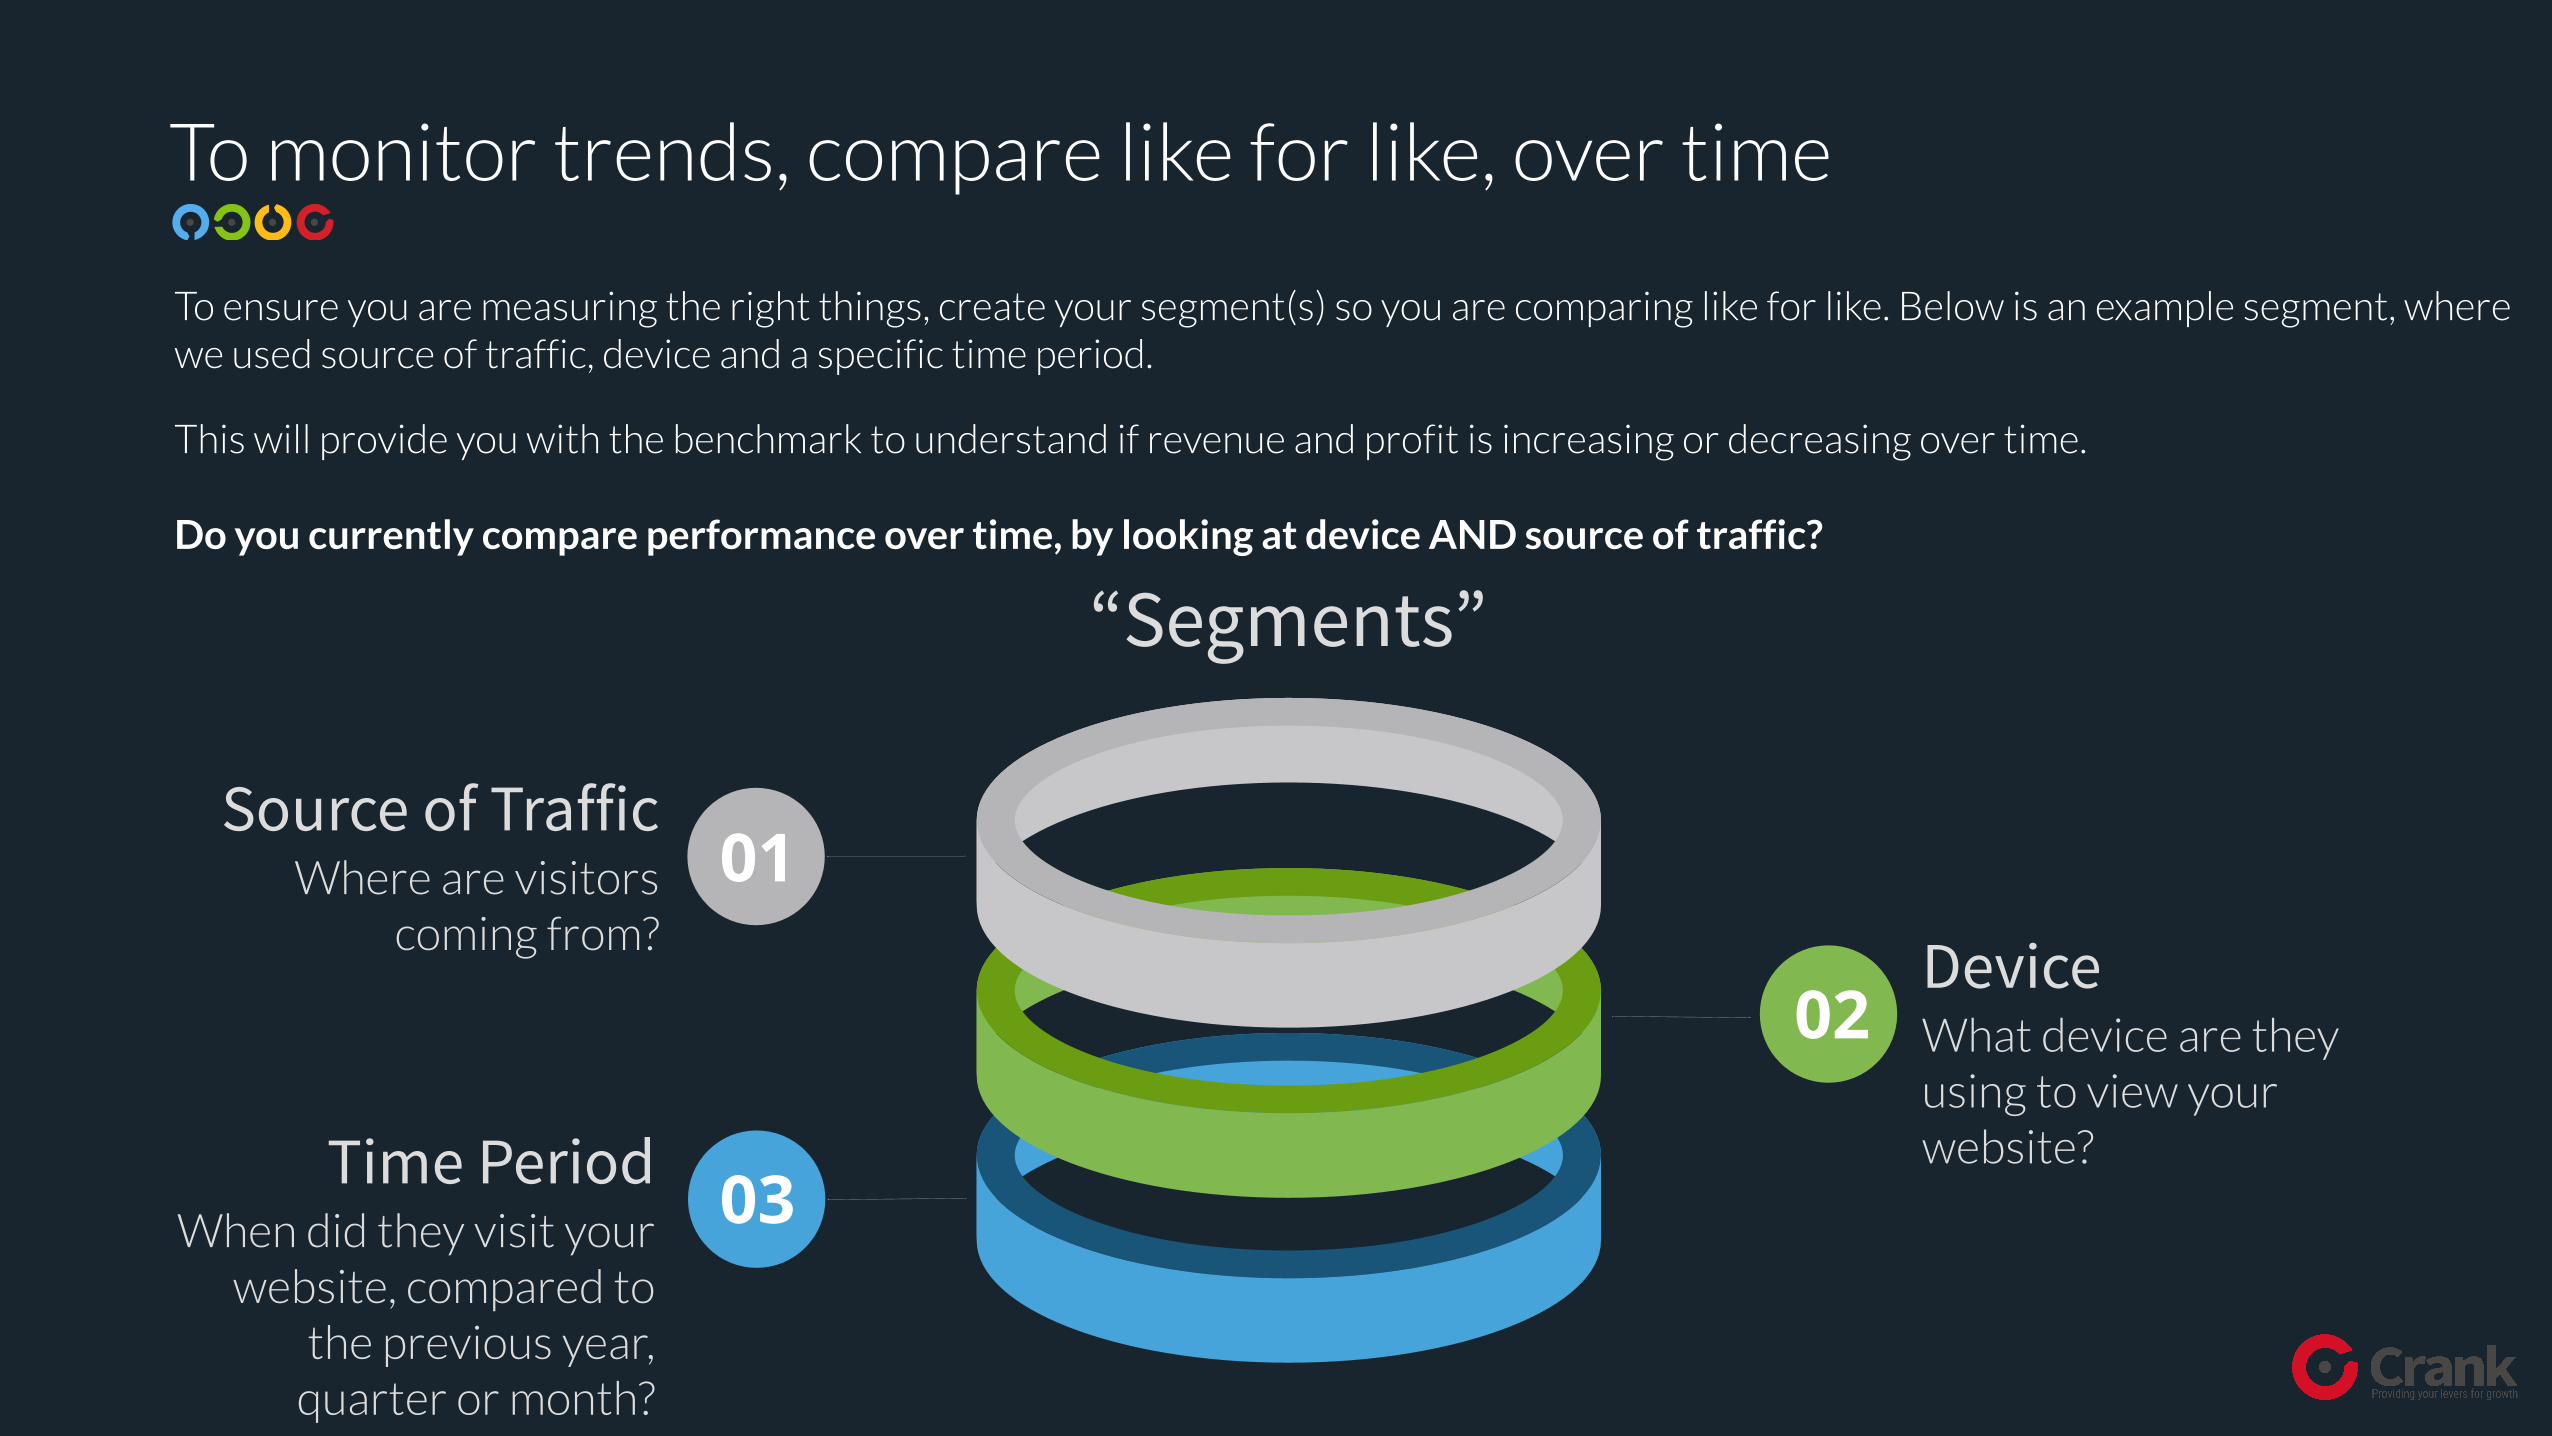
To monitor trends, compare like for like, over time
Device What device are they using to view your website?
03
02
Source of Traffic Where are visitors
coming from?
01
“Segments”
Time Period When did they visit your
website, compared to the previous year,
quarter or month?
To ensure you are measuring the right things, create your segment(s) so you are comparing like for like. Below is an example segment, where we used source of traffic, device and a specific time period.
This will provide you with the benchmark to understand if revenue and profit is increasing or decreasing over time.
Do you currently compare performance over time, by looking at device AND source of traffic?
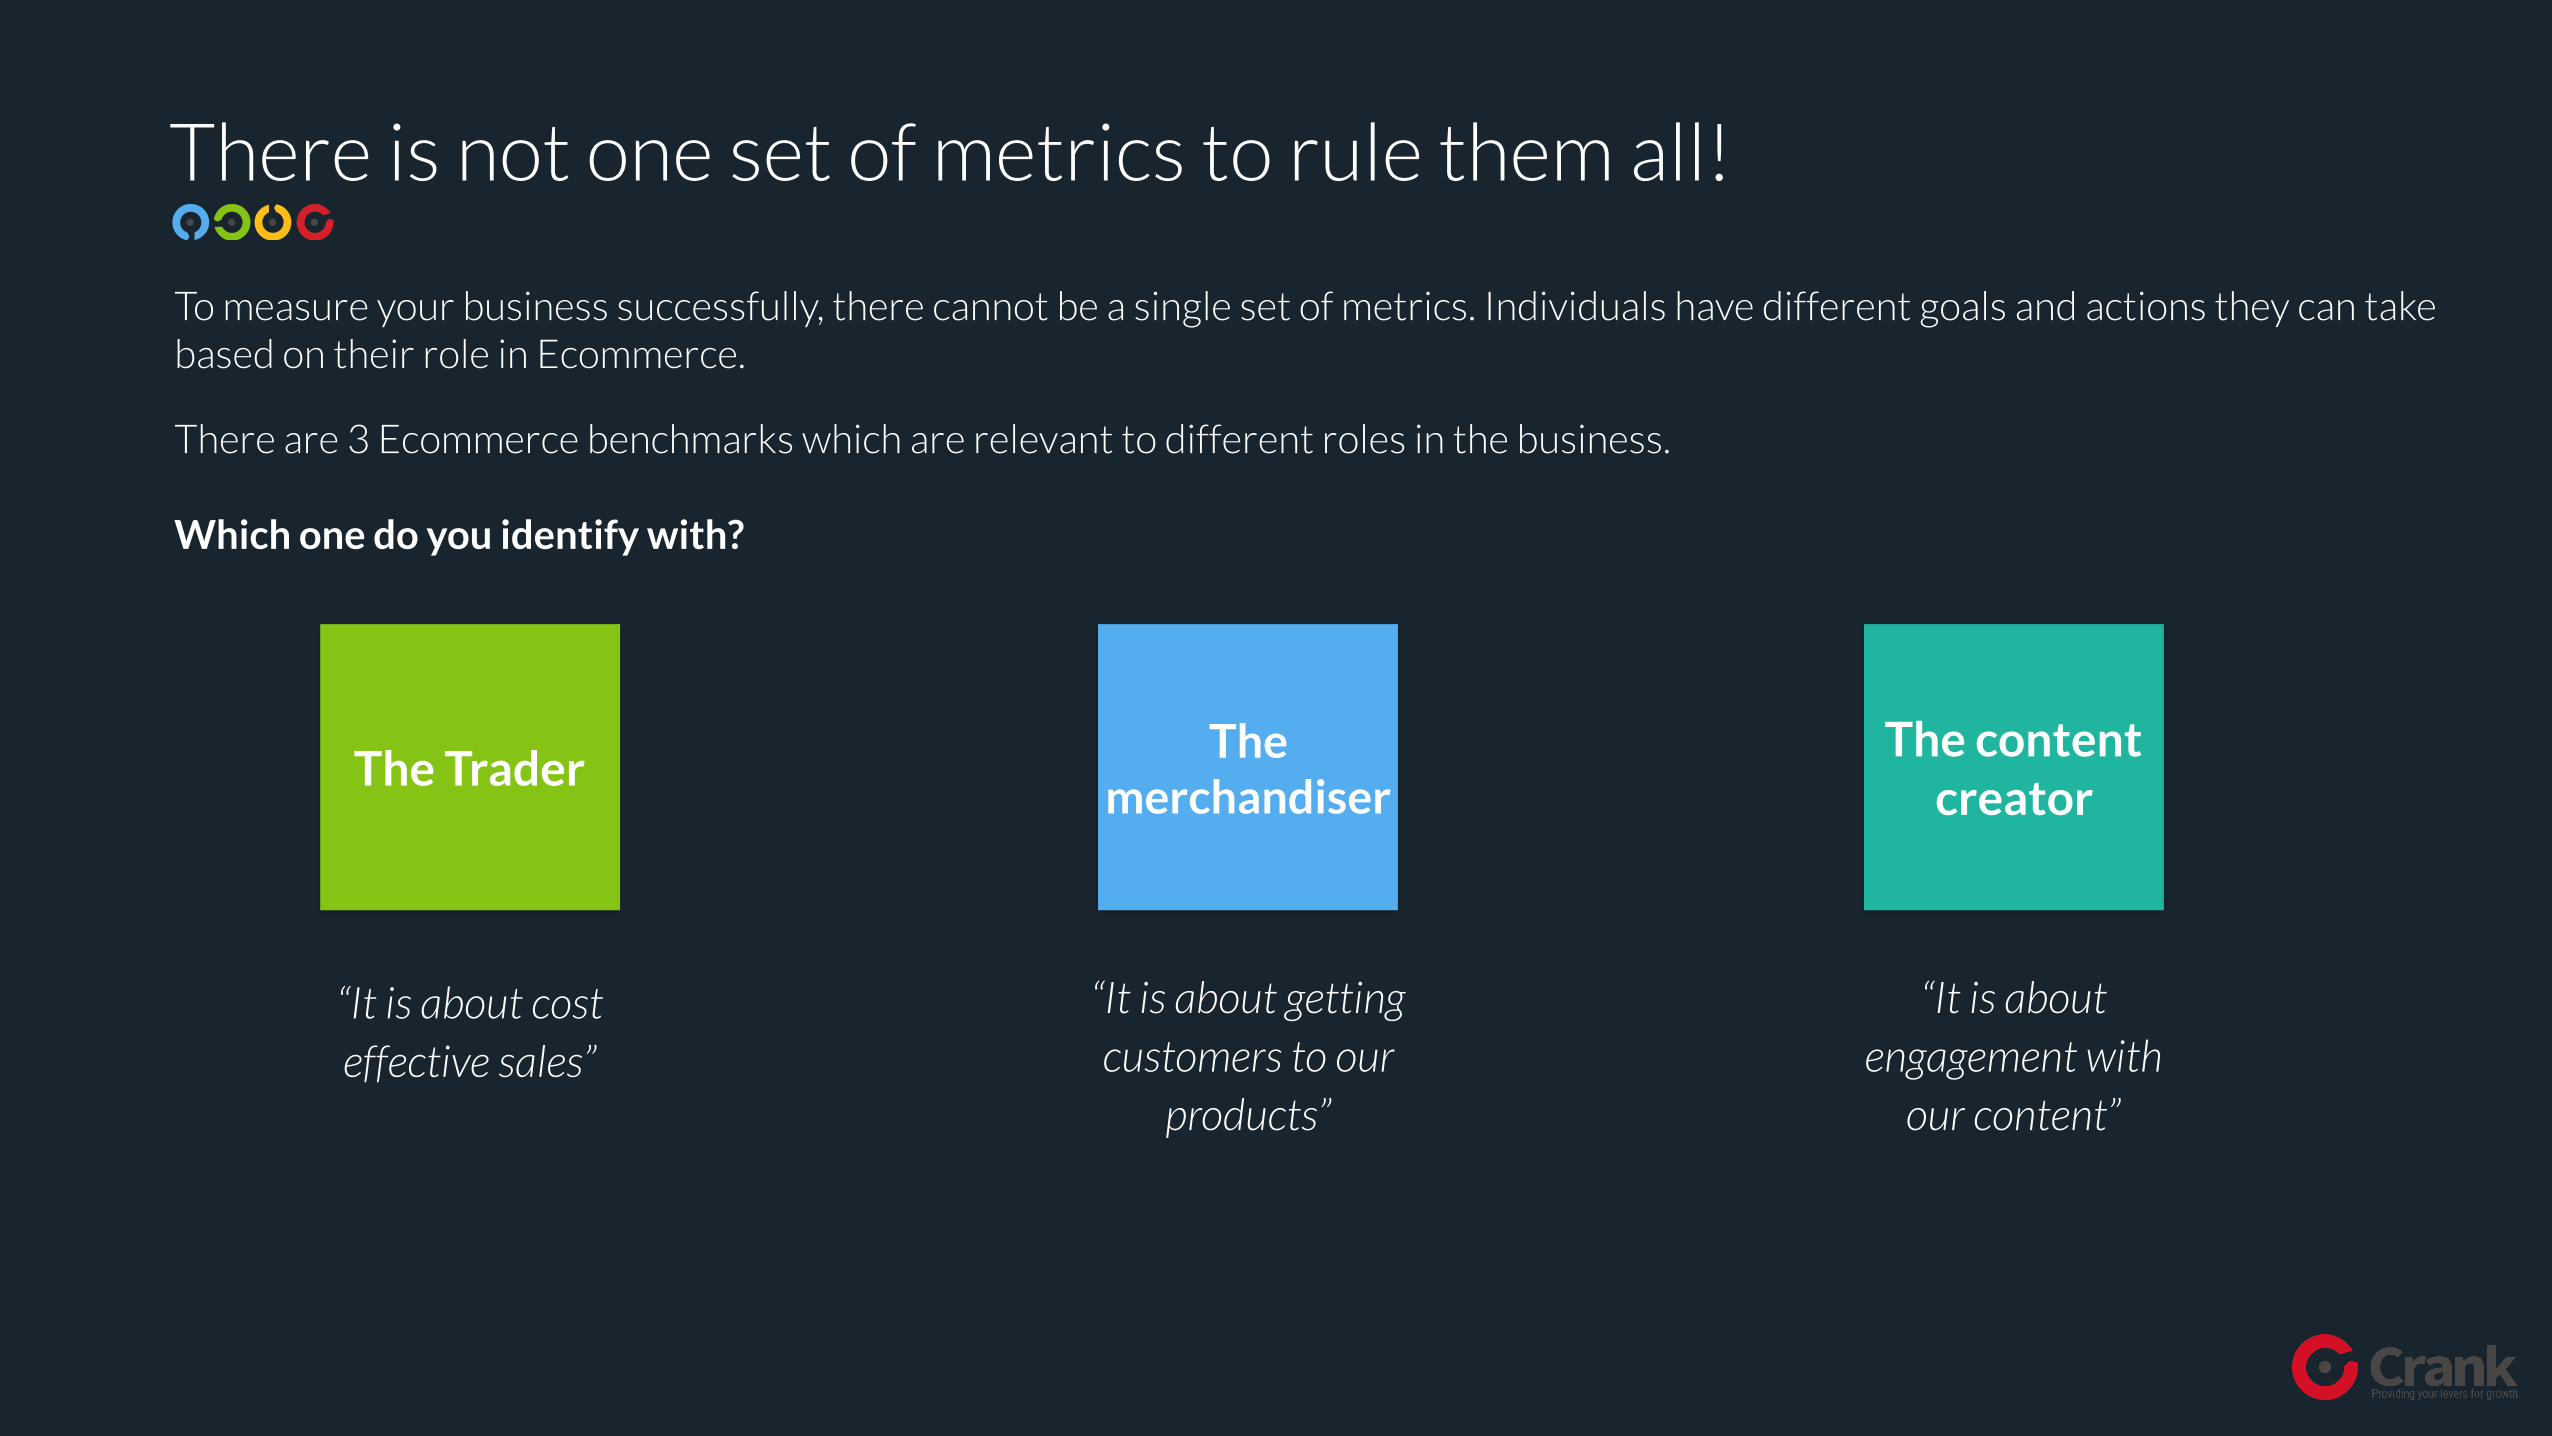
There is not one set of metrics to rule them all!
To measure your business successfully, there cannot be a single set of metrics. Individuals have different goals and actions they can take based on their role in Ecommerce.
There are 3 Ecommerce benchmarks which are relevant to different roles in the business.
Which one do you identify with?
“It is about cost effective sales”
“It is about getting customers to our
products”
“It is about engagement with
our content”
The TraderThe content
creatorThe
merchandiser
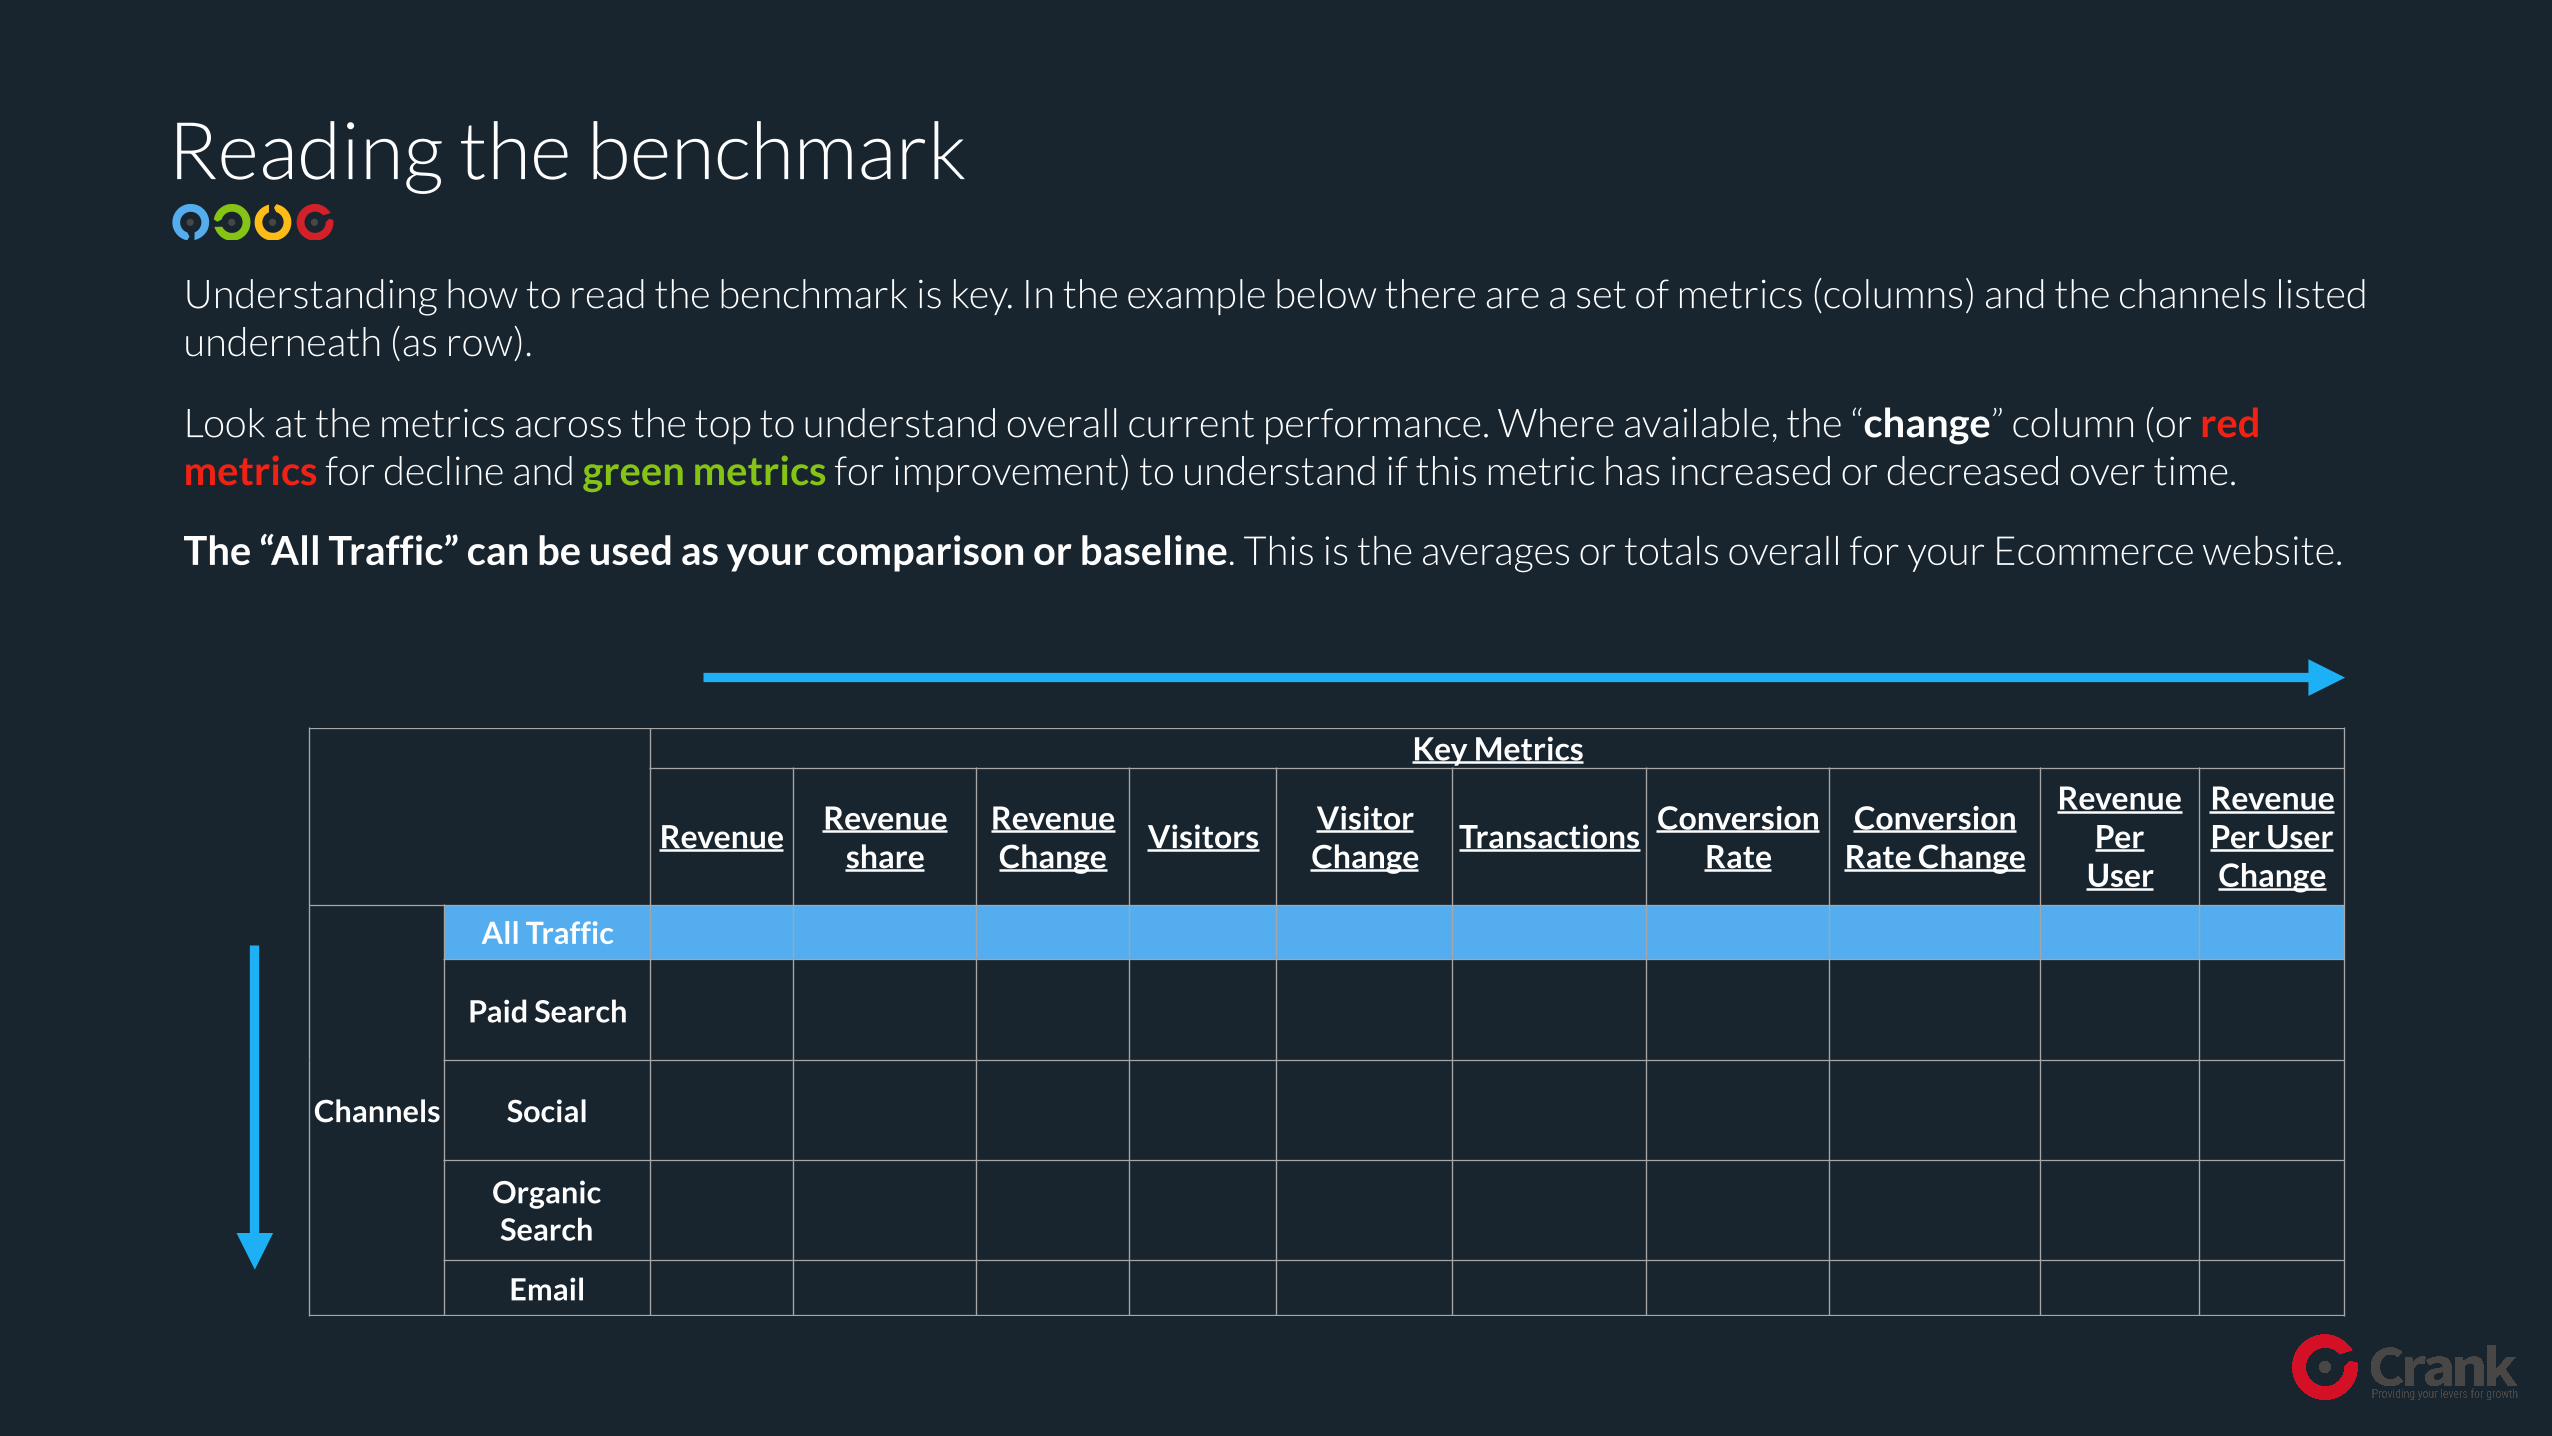
Reading the benchmark
Key Metrics
RevenueRevenue
shareRevenue Change
VisitorsVisitor Change
TransactionsConversion
RateConversion
Rate Change
Revenue Per
User
Revenue Per User Change
Channels
All Traffic
Paid Search
Social
Organic Search
Understanding how to read the benchmark is key. In the example below there are a set of metrics (columns) and the channels listed underneath (as row).
Look at the metrics across the top to understand overall current performance. Where available, the “change” column (or red metrics for decline and green metrics for improvement) to understand if this metric has increased or decreased over time.
The “All Traffic” can be used as your comparison or baseline. This is the averages or totals overall for your Ecommerce website.

The Trader Your Media and Channel Benchmark
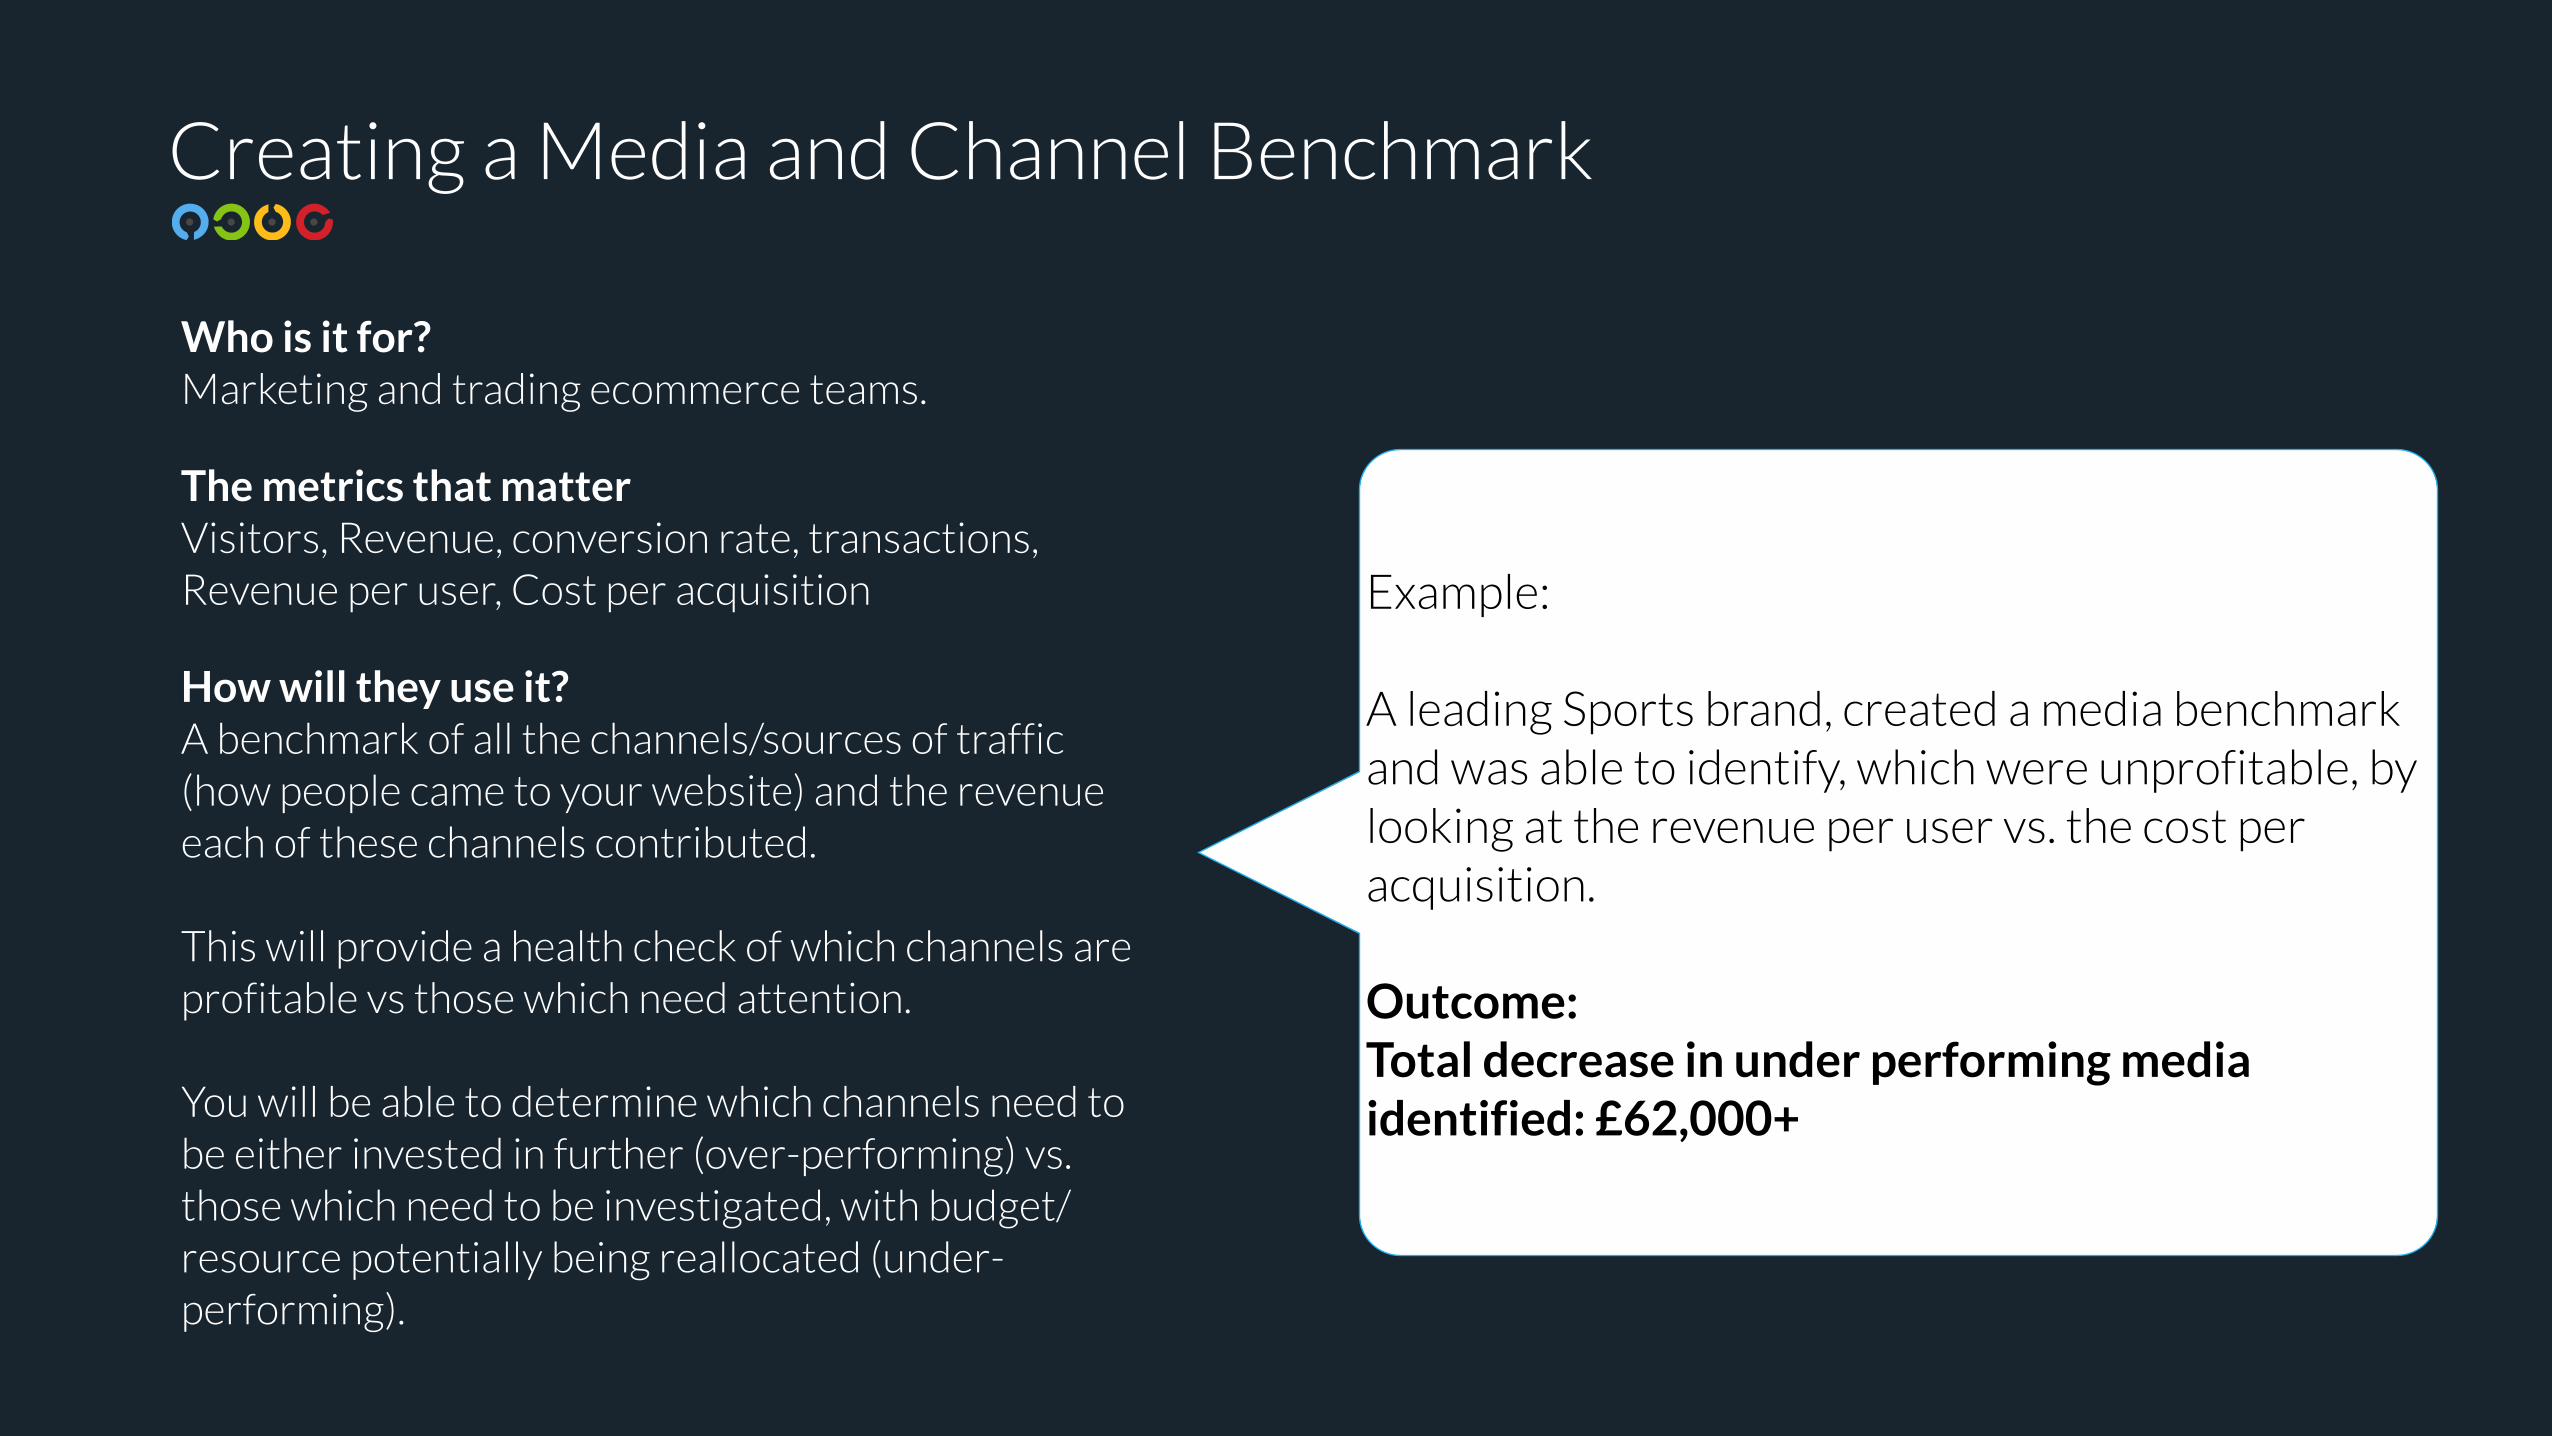
Creating a Media and Channel Benchmark
Who is it for? Marketing and trading ecommerce teams.
The metrics that matter Visitors, Revenue, conversion rate, transactions, Revenue per user, Cost per acquisition
How will they use it? A benchmark of all the channels/sources of traffic (how people came to your website) and the revenue each of these channels contributed.
This will provide a health check of which channels are profitable vs those which need attention.
You will be able to determine which channels need to be either invested in further (over-performing) vs. those which need to be investigated, with budget/resource potentially being reallocated (under-performing).
Example:
A leading Sports brand, created a media benchmark and was able to identify, which were unprofitable, by looking at the revenue per user vs. the cost per acquisition.
Outcome: Total decrease in under performing media identified: £62,000+
Ecommerce Media and Channel Benchmark
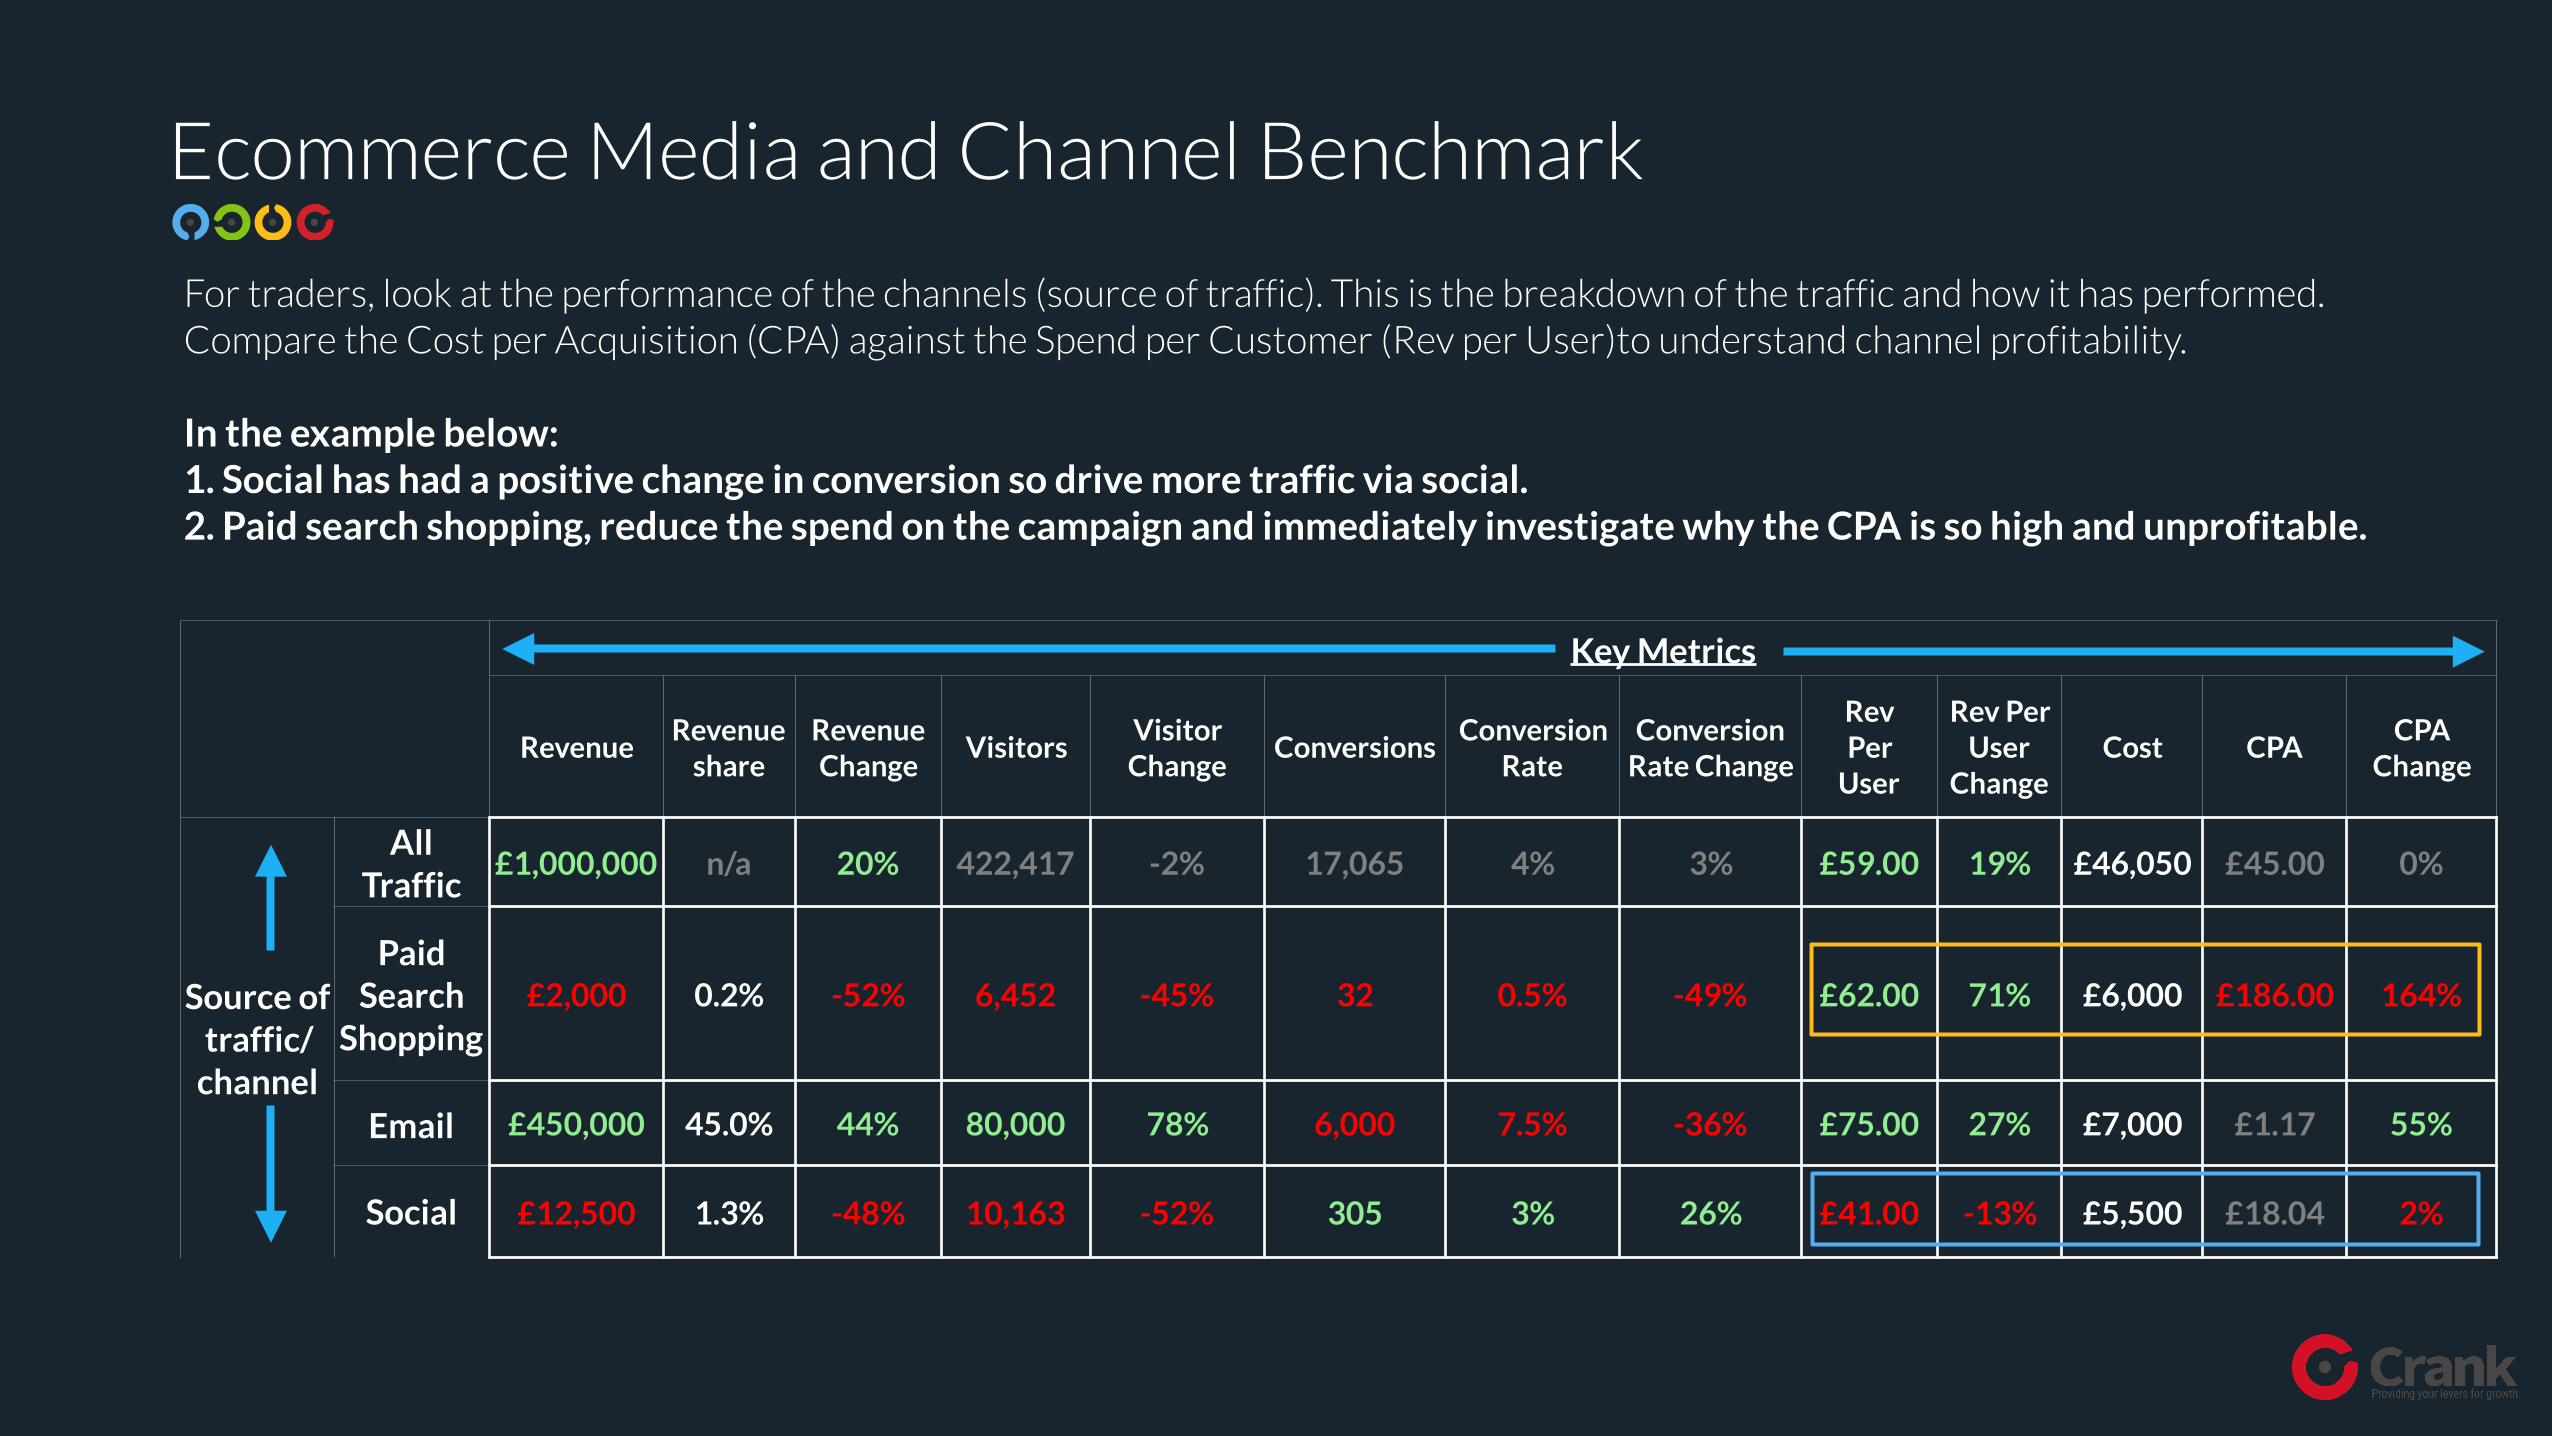
For traders, look at the performance of the channels (source of traffic). This is the breakdown of the traffic and how it has performed. Compare the Cost per Acquisition (CPA) against the Spend per Customer (Rev per User)to understand channel profitability.
In the example below: 1. Social has had a positive change in conversion so drive more traffic via social. 2. Paid search shopping, reduce the spend on the campaign and immediately investigate why the CPA is so high and unprofitable.
Key Metrics
RevenueRevenue
shareRevenue Change
VisitorsVisitor Change
ConversionsConversion
RateConversion
Rate Change
Rev Per
User
Rev Per User
ChangeCost CPA
CPA Change
Source of traffic/
channel
All Traffic
£1,000,000 n/a 20% 422,417 -2% 17,065 4% 3% £59.00 19% £46,050 £45.00 0%
Paid Search
Shopping£2,000 0.2% -52% 6,452 -45% 32 0.5% -49% £62.00 71% £6,000 £186.00 164%
Email £450,000 45.0% 44% 80,000 78% 6,000 7.5% -36% £75.00 27% £7,000 £1.17 55%
Social £12,500 1.3% -48% 10,163 -52% 305 3% 26% £41.00 -13% £5,500 £18.04 2%
Ecommerce Channel Behaviour Benchmark
Key Metrics
Bounce RatePages Per
SessionAvg. Session
Duration
Enter Funnel
Rate
Funnel Completion
Rate
Conversion Rate
RPU CPA
Source of traffic
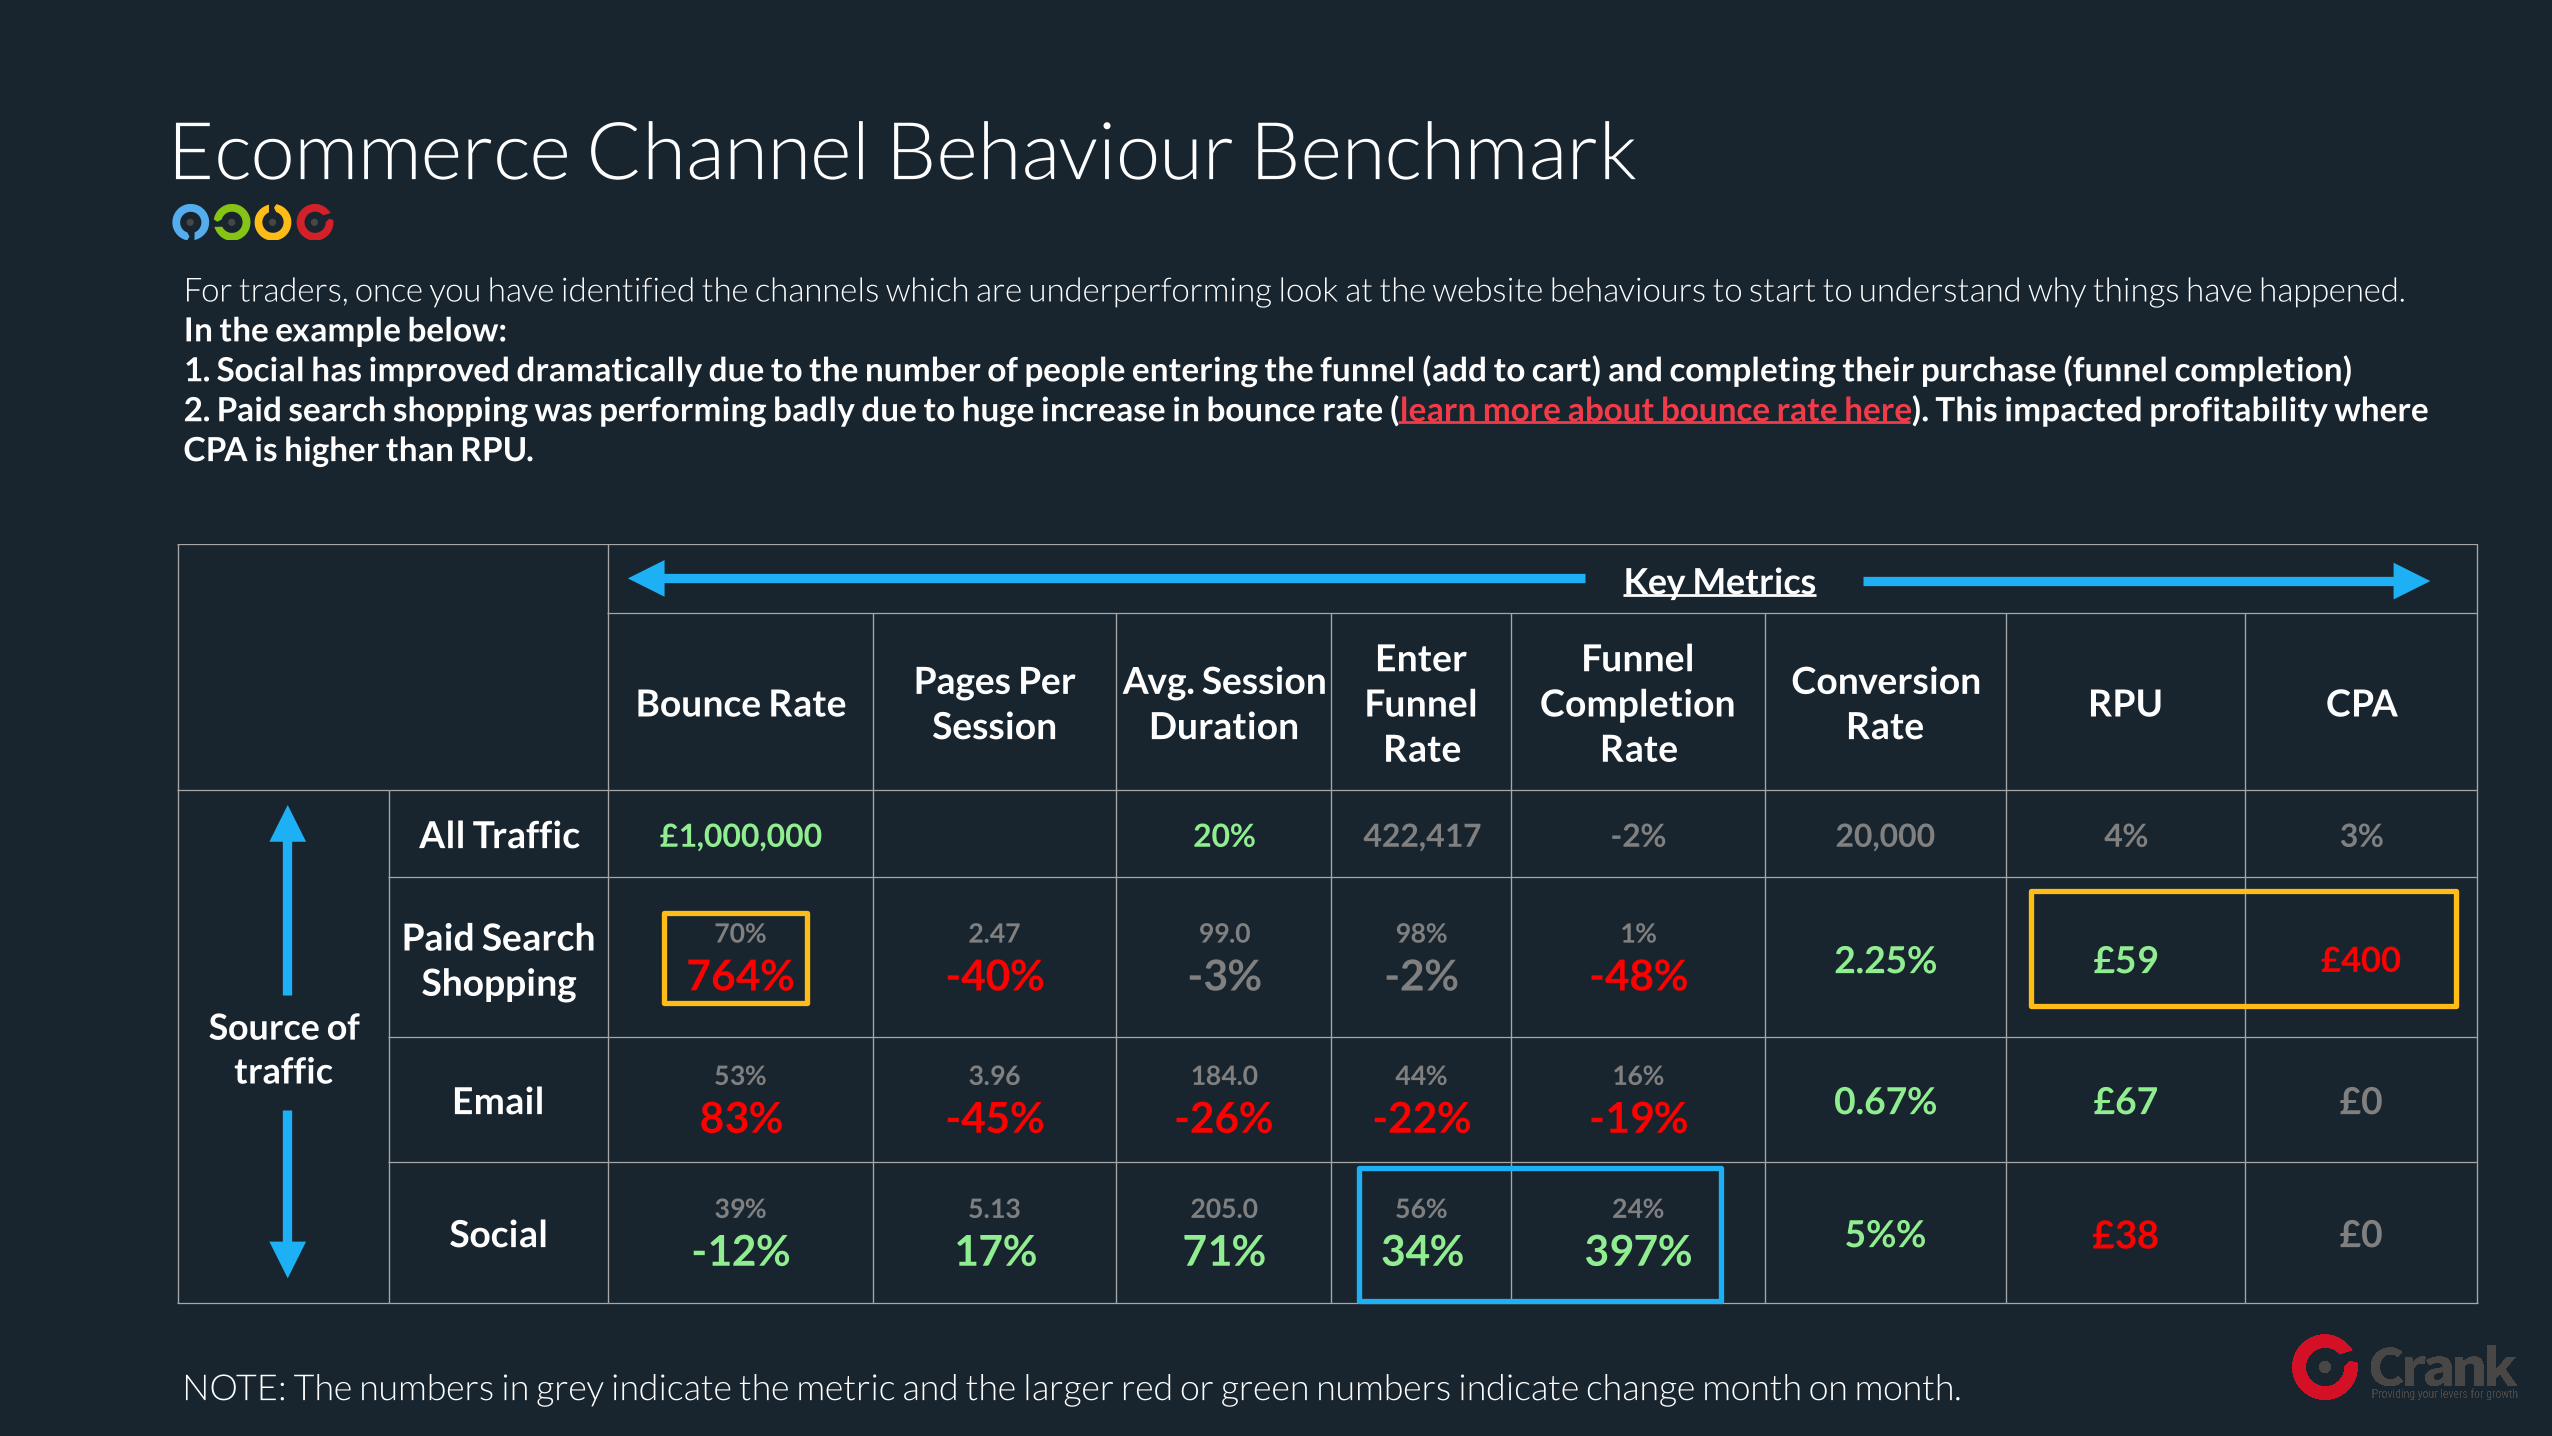
All Traffic £1,000,000 20% 422,417 -2% 20,000 4% 3%
Paid Search Shopping
70% 764%
2.47 -40%
99.0 -3%
98% -2%
1% -48% 2.25% £59 £400
Email53%
83%3.96
-45%184.0
-26%44%
-22%16%
-19% 0.67% £67 £0
Social39%
-12%5.13
17%205.0 71%
56% 34%
24% 397% 5%% £38 £0
For traders, once you have identified the channels which are underperforming look at the website behaviours to start to understand why things have happened. In the example below: 1. Social has improved dramatically due to the number of people entering the funnel (add to cart) and completing their purchase (funnel completion) 2. Paid search shopping was performing badly due to huge increase in bounce rate (learn more about bounce rate here). This impacted profitability where CPA is higher than RPU.
NOTE: The numbers in grey indicate the metric and the larger red or green numbers indicate change month on month.
The Merchandiser Your Product and Category Benchmark
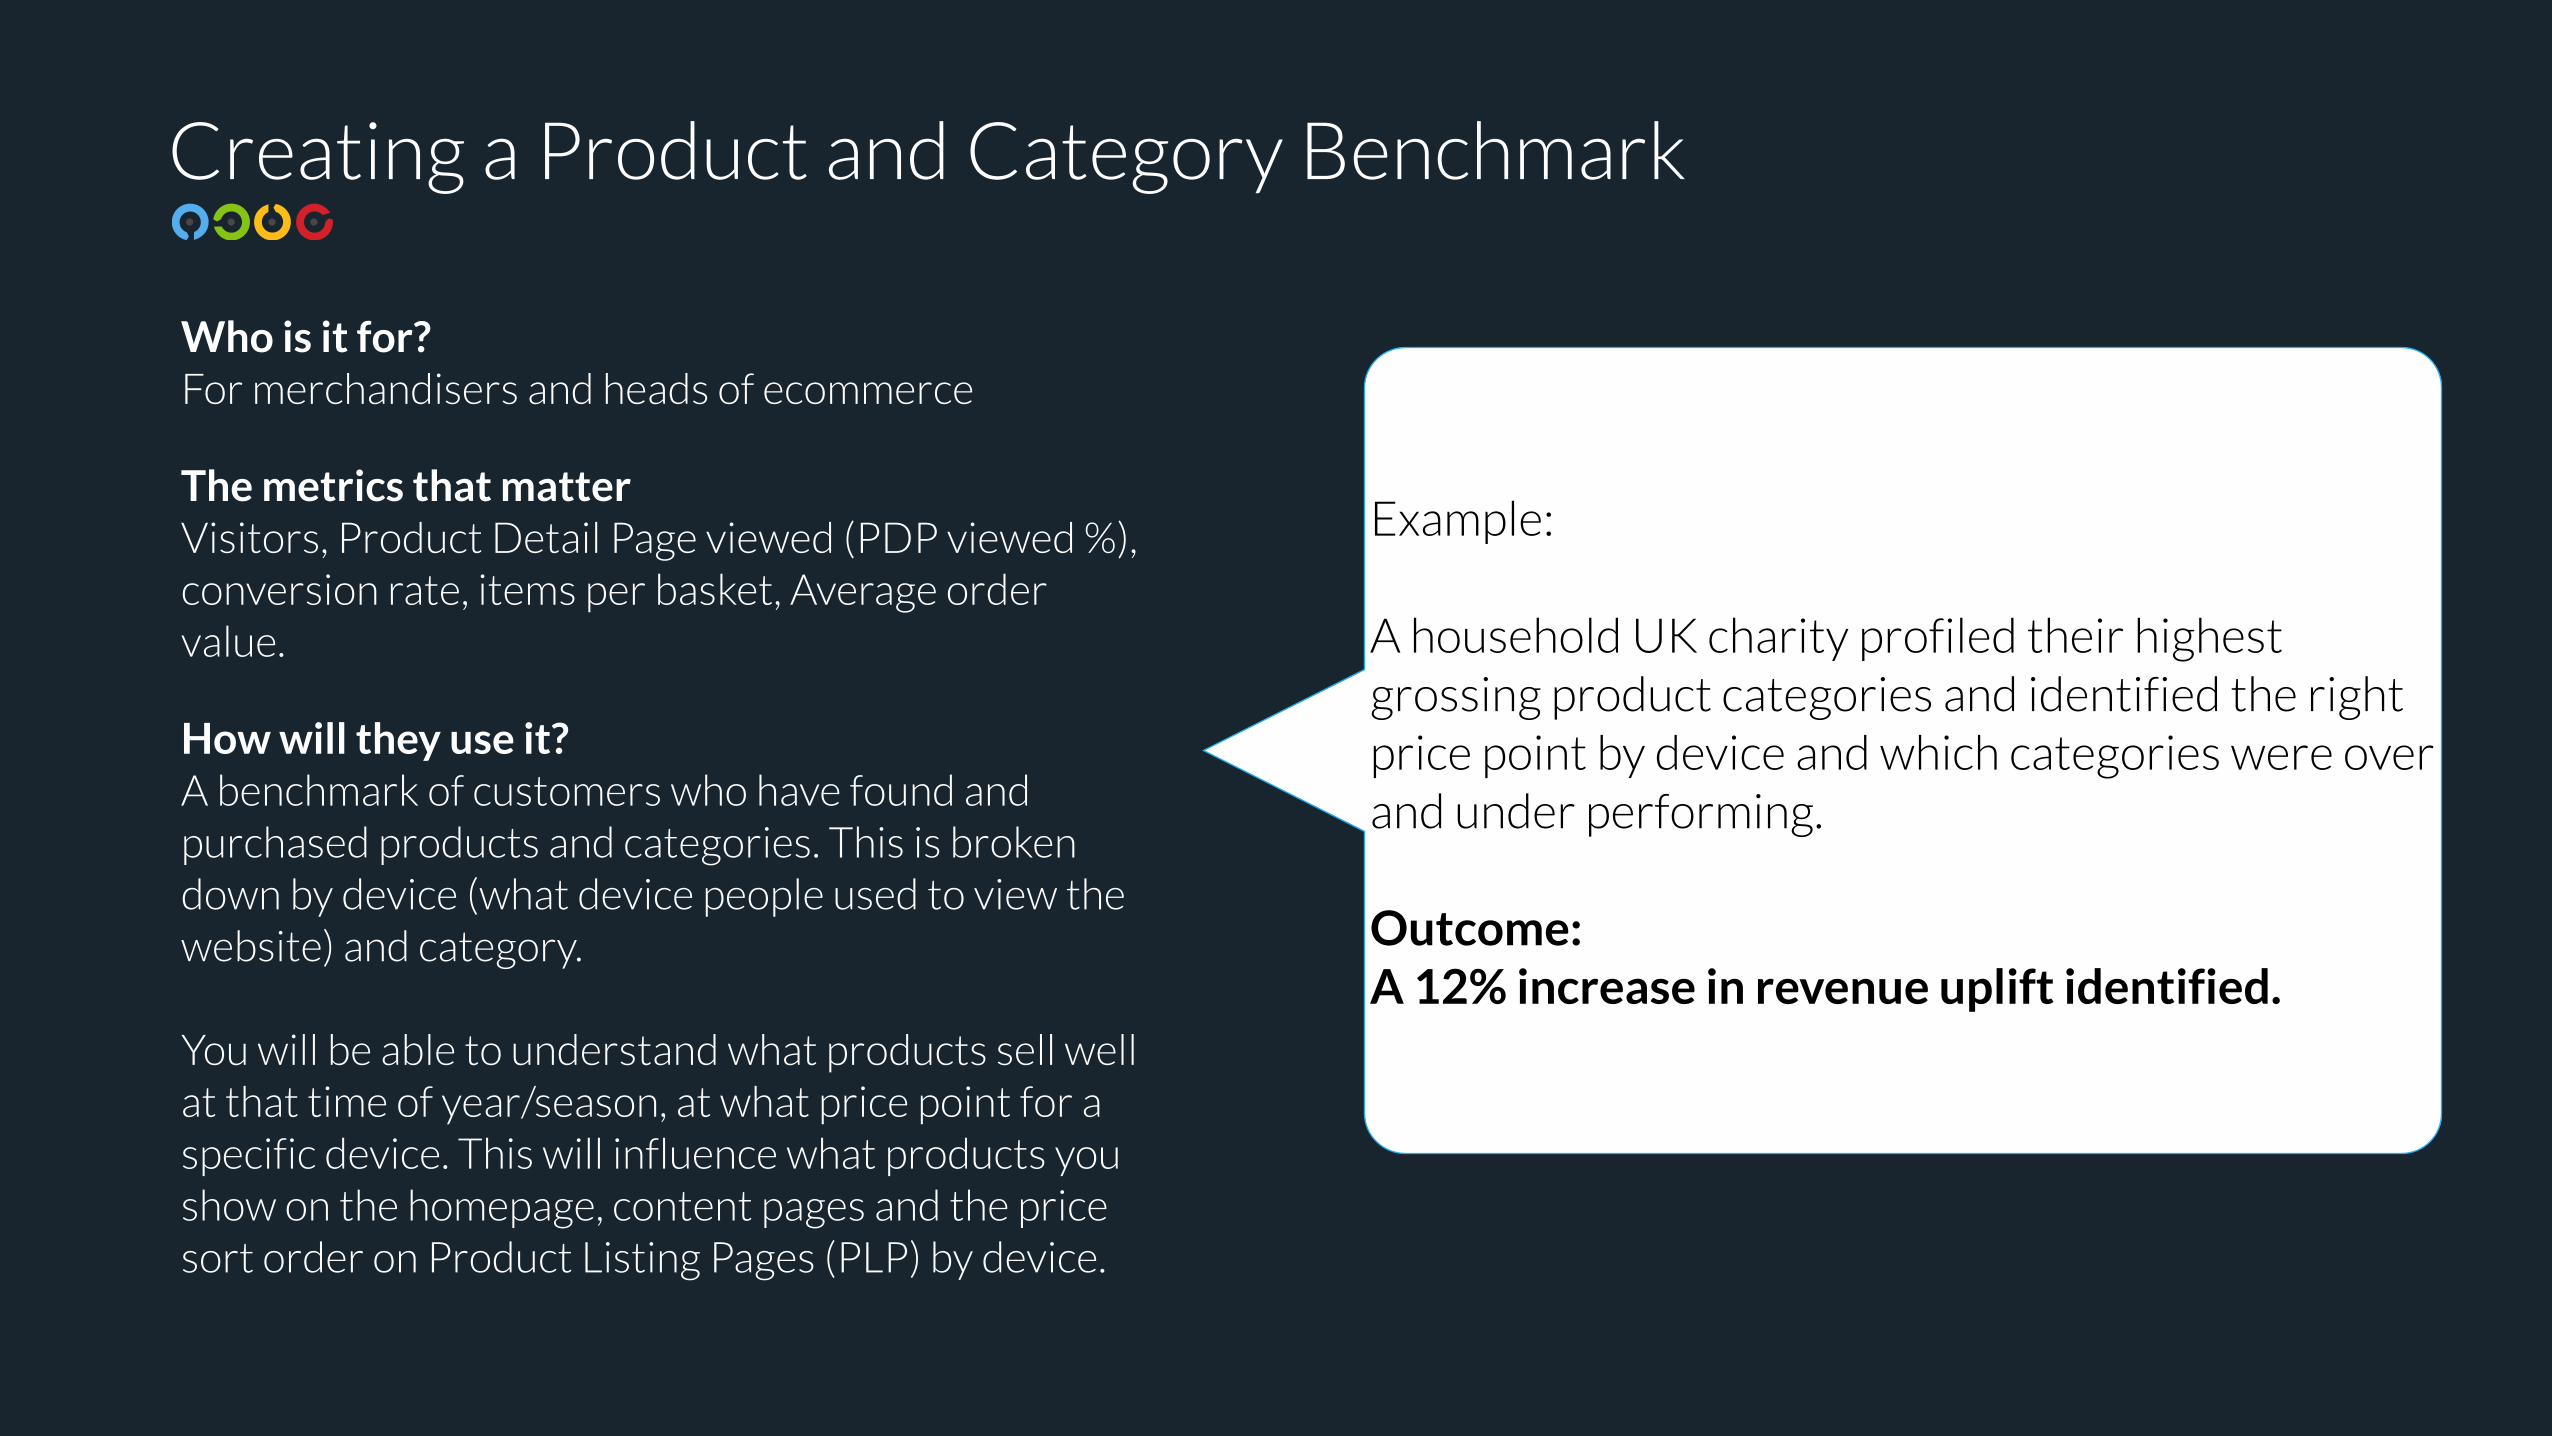
Creating a Product and Category Benchmark
Who is it for? For merchandisers and heads of ecommerce
The metrics that matter Visitors, Product Detail Page viewed (PDP viewed %), conversion rate, items per basket, Average order value.
How will they use it? A benchmark of customers who have found and purchased products and categories. This is broken down by device (what device people used to view the website) and category.
You will be able to understand what products sell well at that time of year/season, at what price point for a specific device. This will influence what products you show on the homepage, content pages and the price sort order on Product Listing Pages (PLP) by device.
Example:
A household UK charity profiled their highest grossing product categories and identified the right price point by device and which categories were over and under performing.
Outcome: A 12% increase in revenue uplift identified.
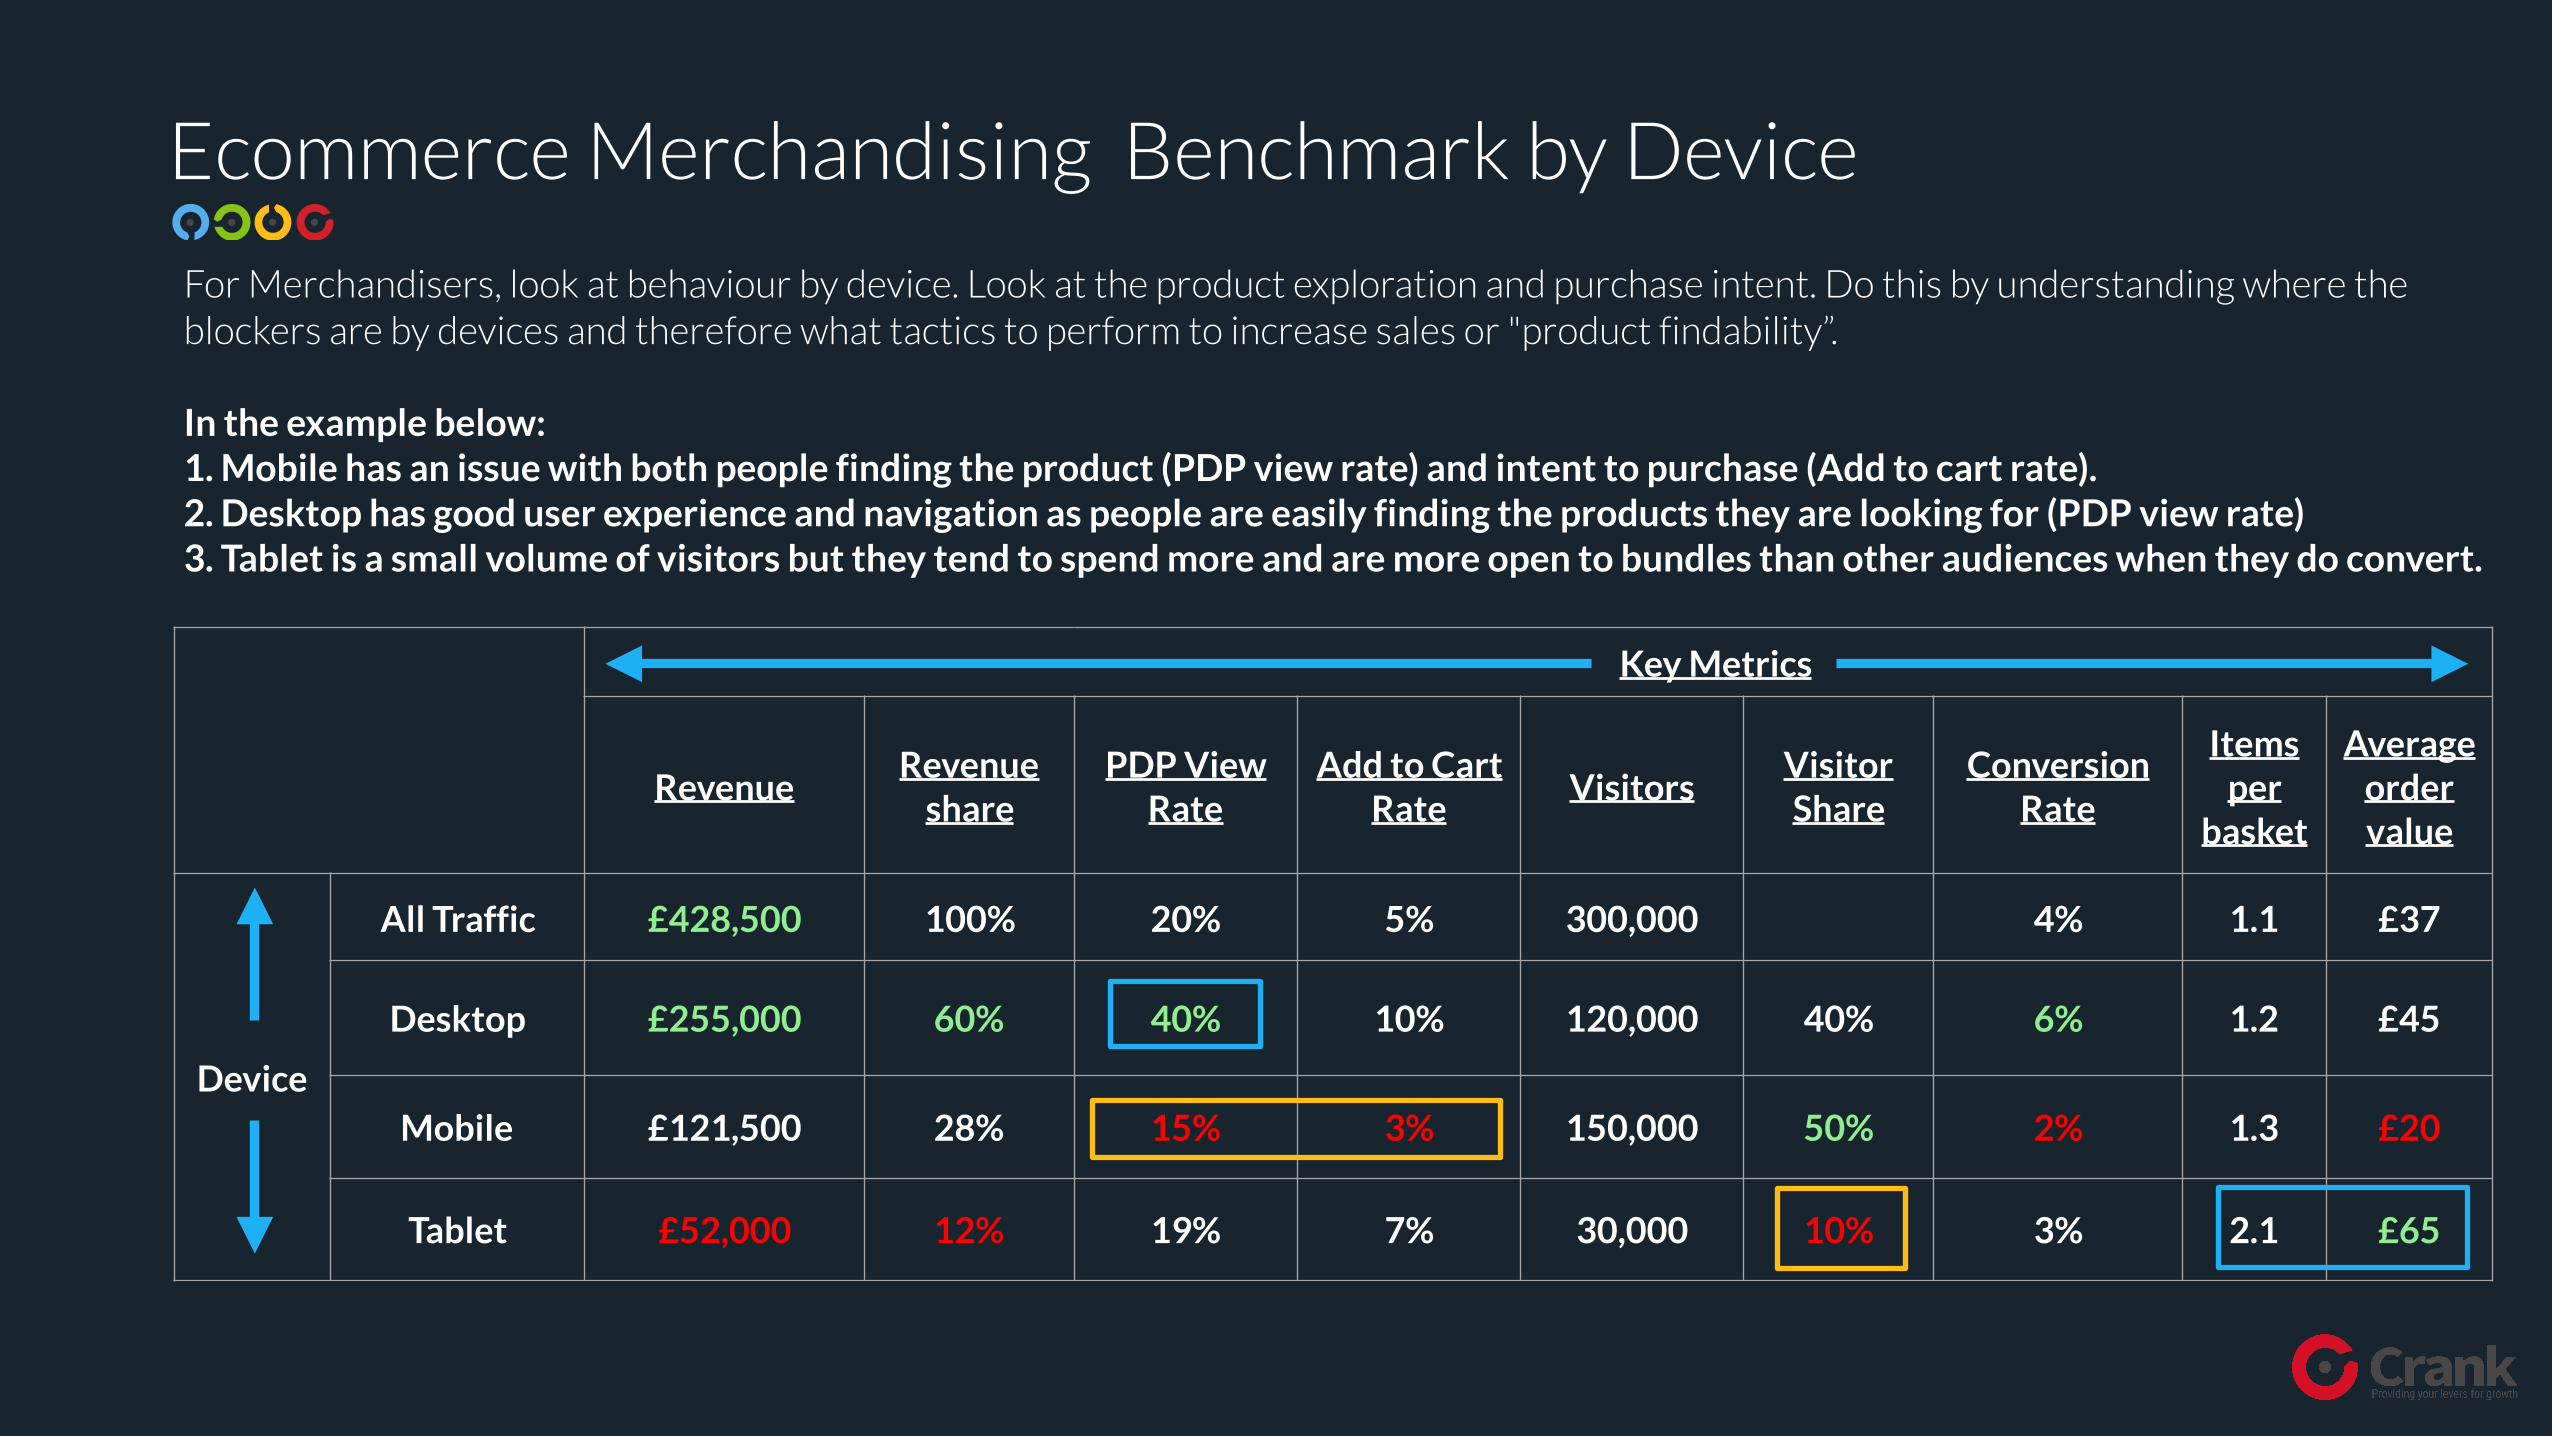
Ecommerce Merchandising Benchmark by Device
Key Metrics
RevenueRevenue
sharePDP View
RateAdd to Cart
RateVisitors
Visitor Share
Conversion Rate
Items per
basket
Average order value
Device
All Traffic £428,500 100% 20% 5% 300,000 4% 1.1 £37
Desktop £255,000 60% 40% 10% 120,000 40% 6% 1.2 £45
Mobile £121,500 28% 15% 3% 150,000 50% 2% 1.3 £20
Tablet £52,000 12% 19% 7% 30,000 10% 3% 2.1 £65
For Merchandisers, look at behaviour by device. Look at the product exploration and purchase intent. Do this by understanding where the blockers are by devices and therefore what tactics to perform to increase sales or "product findability”.
In the example below: 1. Mobile has an issue with both people finding the product (PDP view rate) and intent to purchase (Add to cart rate). 2. Desktop has good user experience and navigation as people are easily finding the products they are looking for (PDP view rate) 3. Tablet is a small volume of visitors but they tend to spend more and are more open to bundles than other audiences when they do convert.
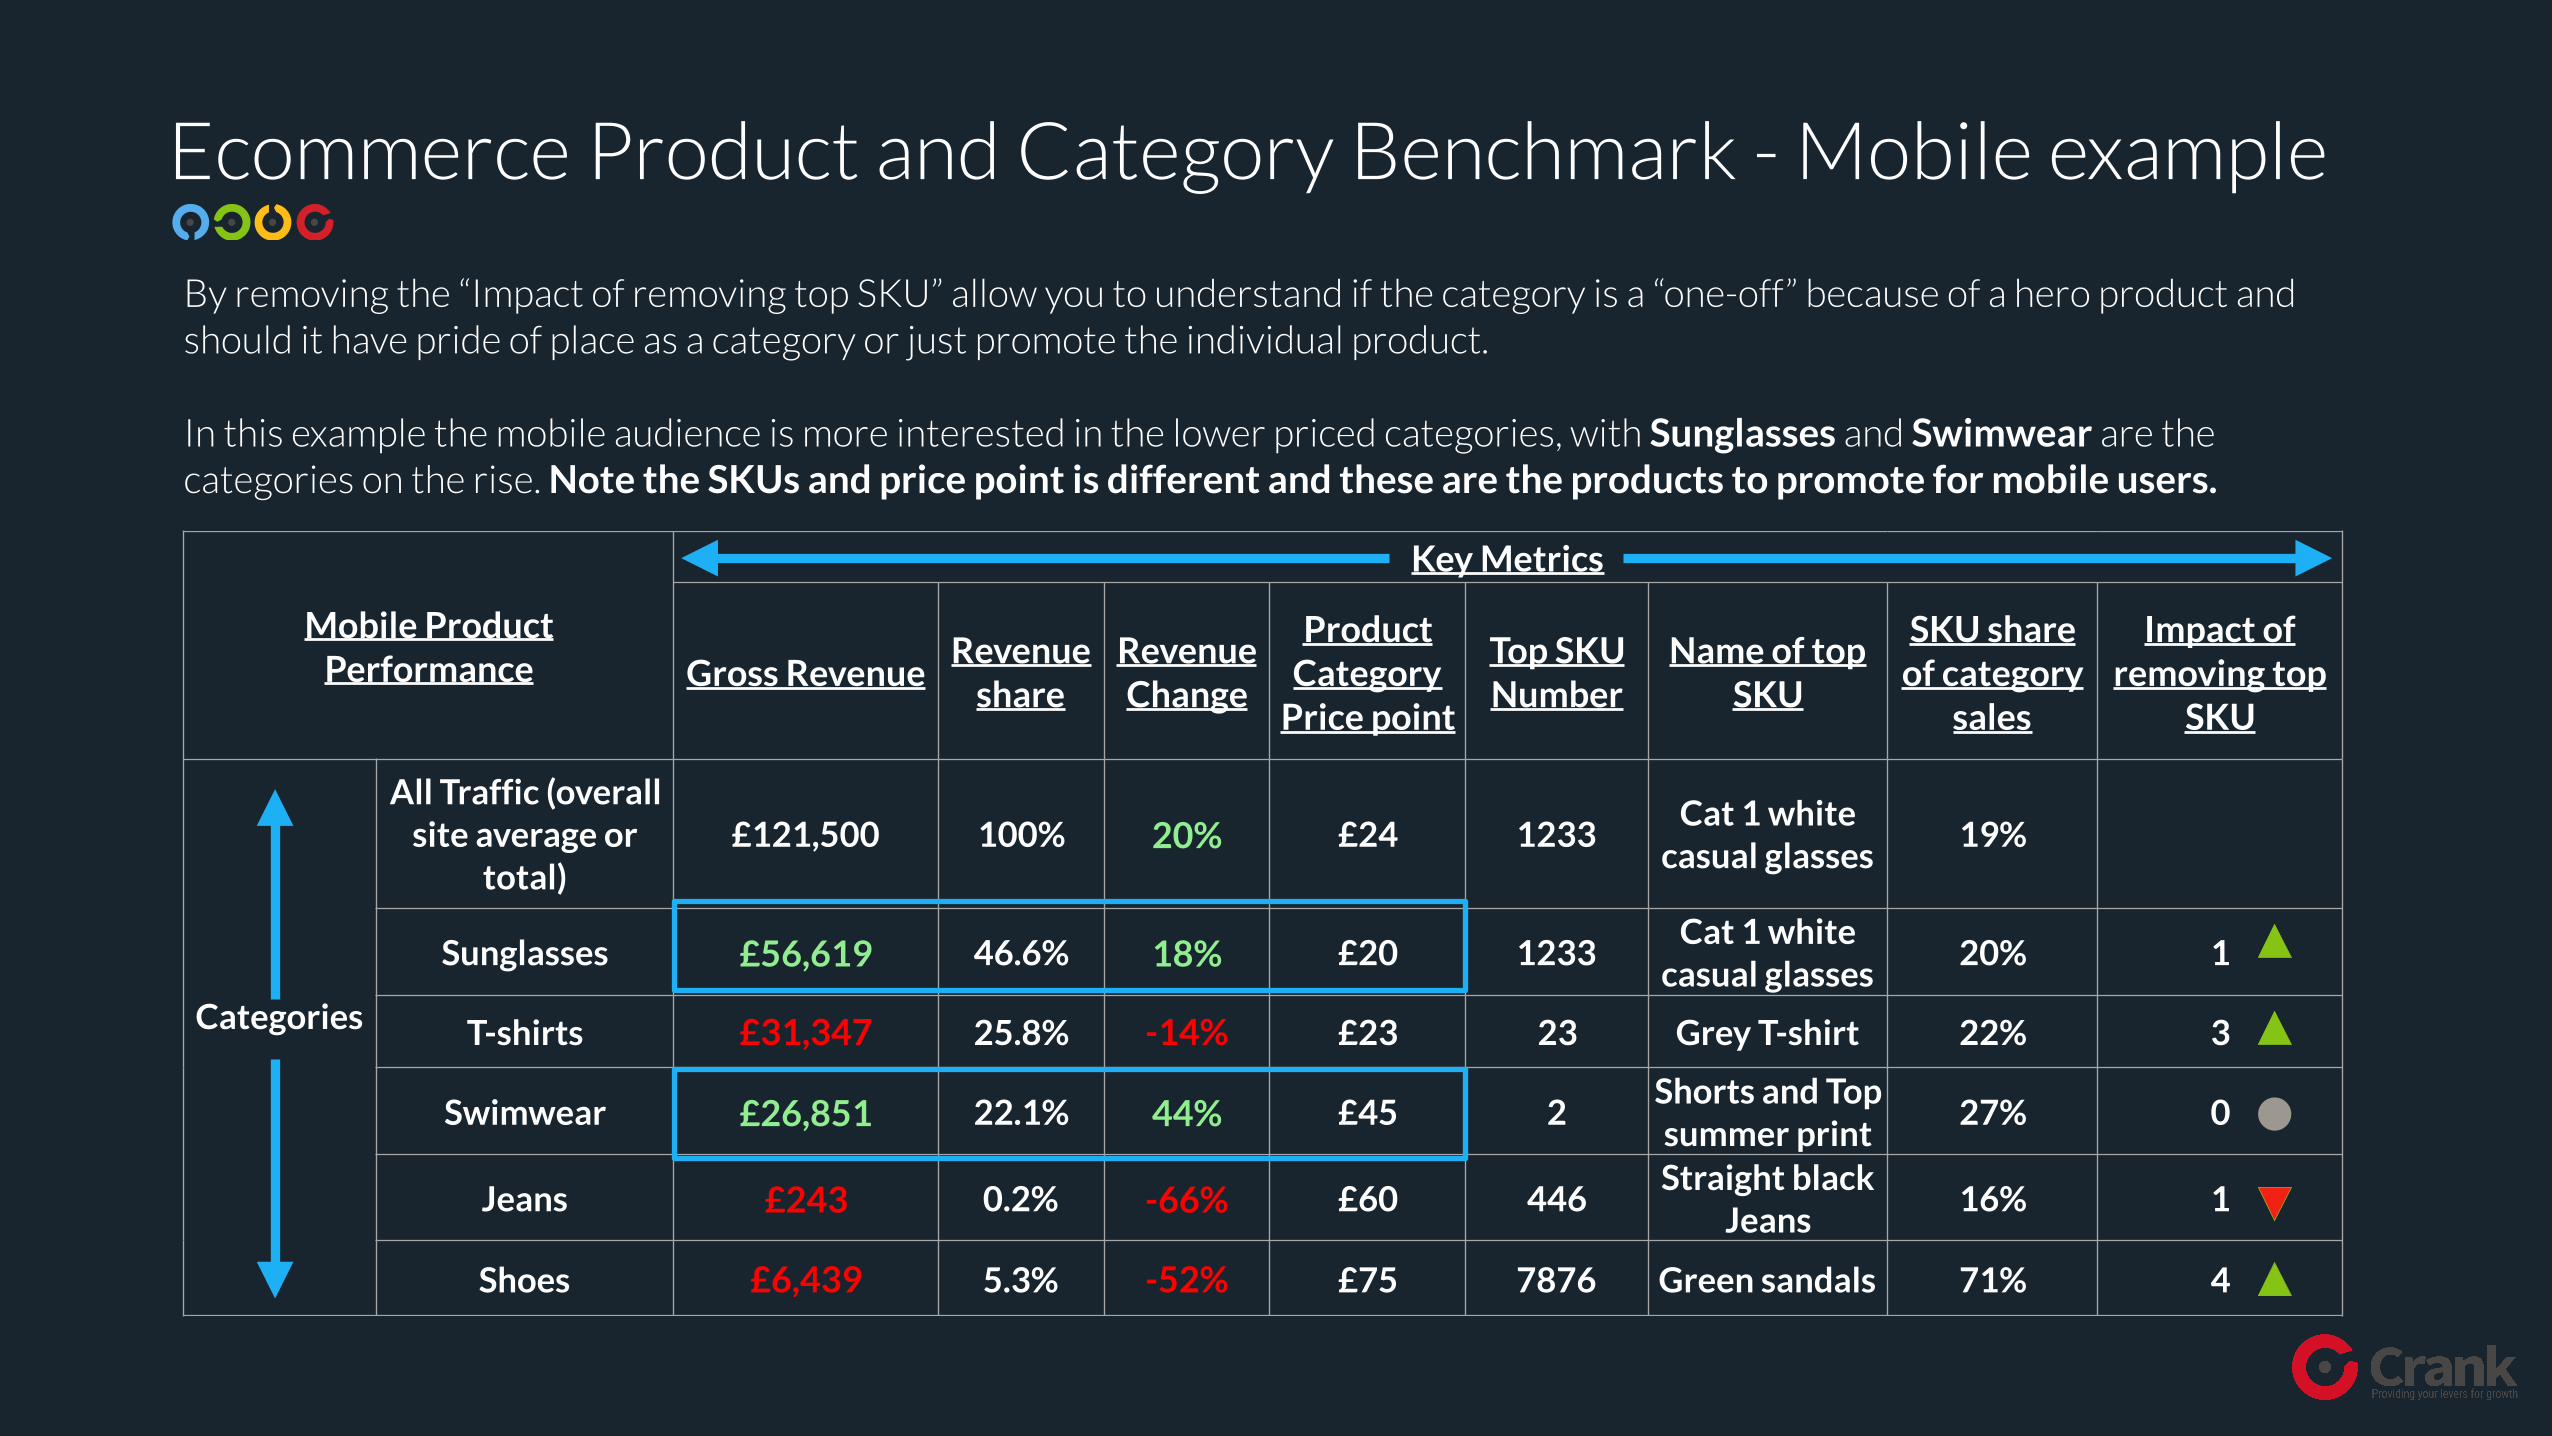
Ecommerce Product and Category Benchmark - Mobile example
Mobile Product Performance
Key Metrics
Gross RevenueRevenue
shareRevenue Change
Product Category
Price point
Top SKU Number
Name of top SKU
SKU share of category
sales
Impact of removing top
SKU
Categories
All Traffic (overall site average or
total)£121,500 100% 20% £24 1233
Cat 1 white casual glasses
19%
Sunglasses £56,619 46.6% 18% £20 1233Cat 1 white
casual glasses20% 1
T-shirts £31,347 25.8% -14% £23 23 Grey T-shirt 22% 3
Swimwear £26,851 22.1% 44% £45 2Shorts and Top summer print
27% 0
Jeans £243 0.2% -66% £60 446Straight black
Jeans16% 1
Shoes £6,439 5.3% -52% £75 7876 Green sandals 71% 4
By removing the “Impact of removing top SKU” allow you to understand if the category is a “one-off” because of a hero product and should it have pride of place as a category or just promote the individual product.
In this example the mobile audience is more interested in the lower priced categories, with Sunglasses and Swimwear are the categories on the rise. Note the SKUs and price point is different and these are the products to promote for mobile users.
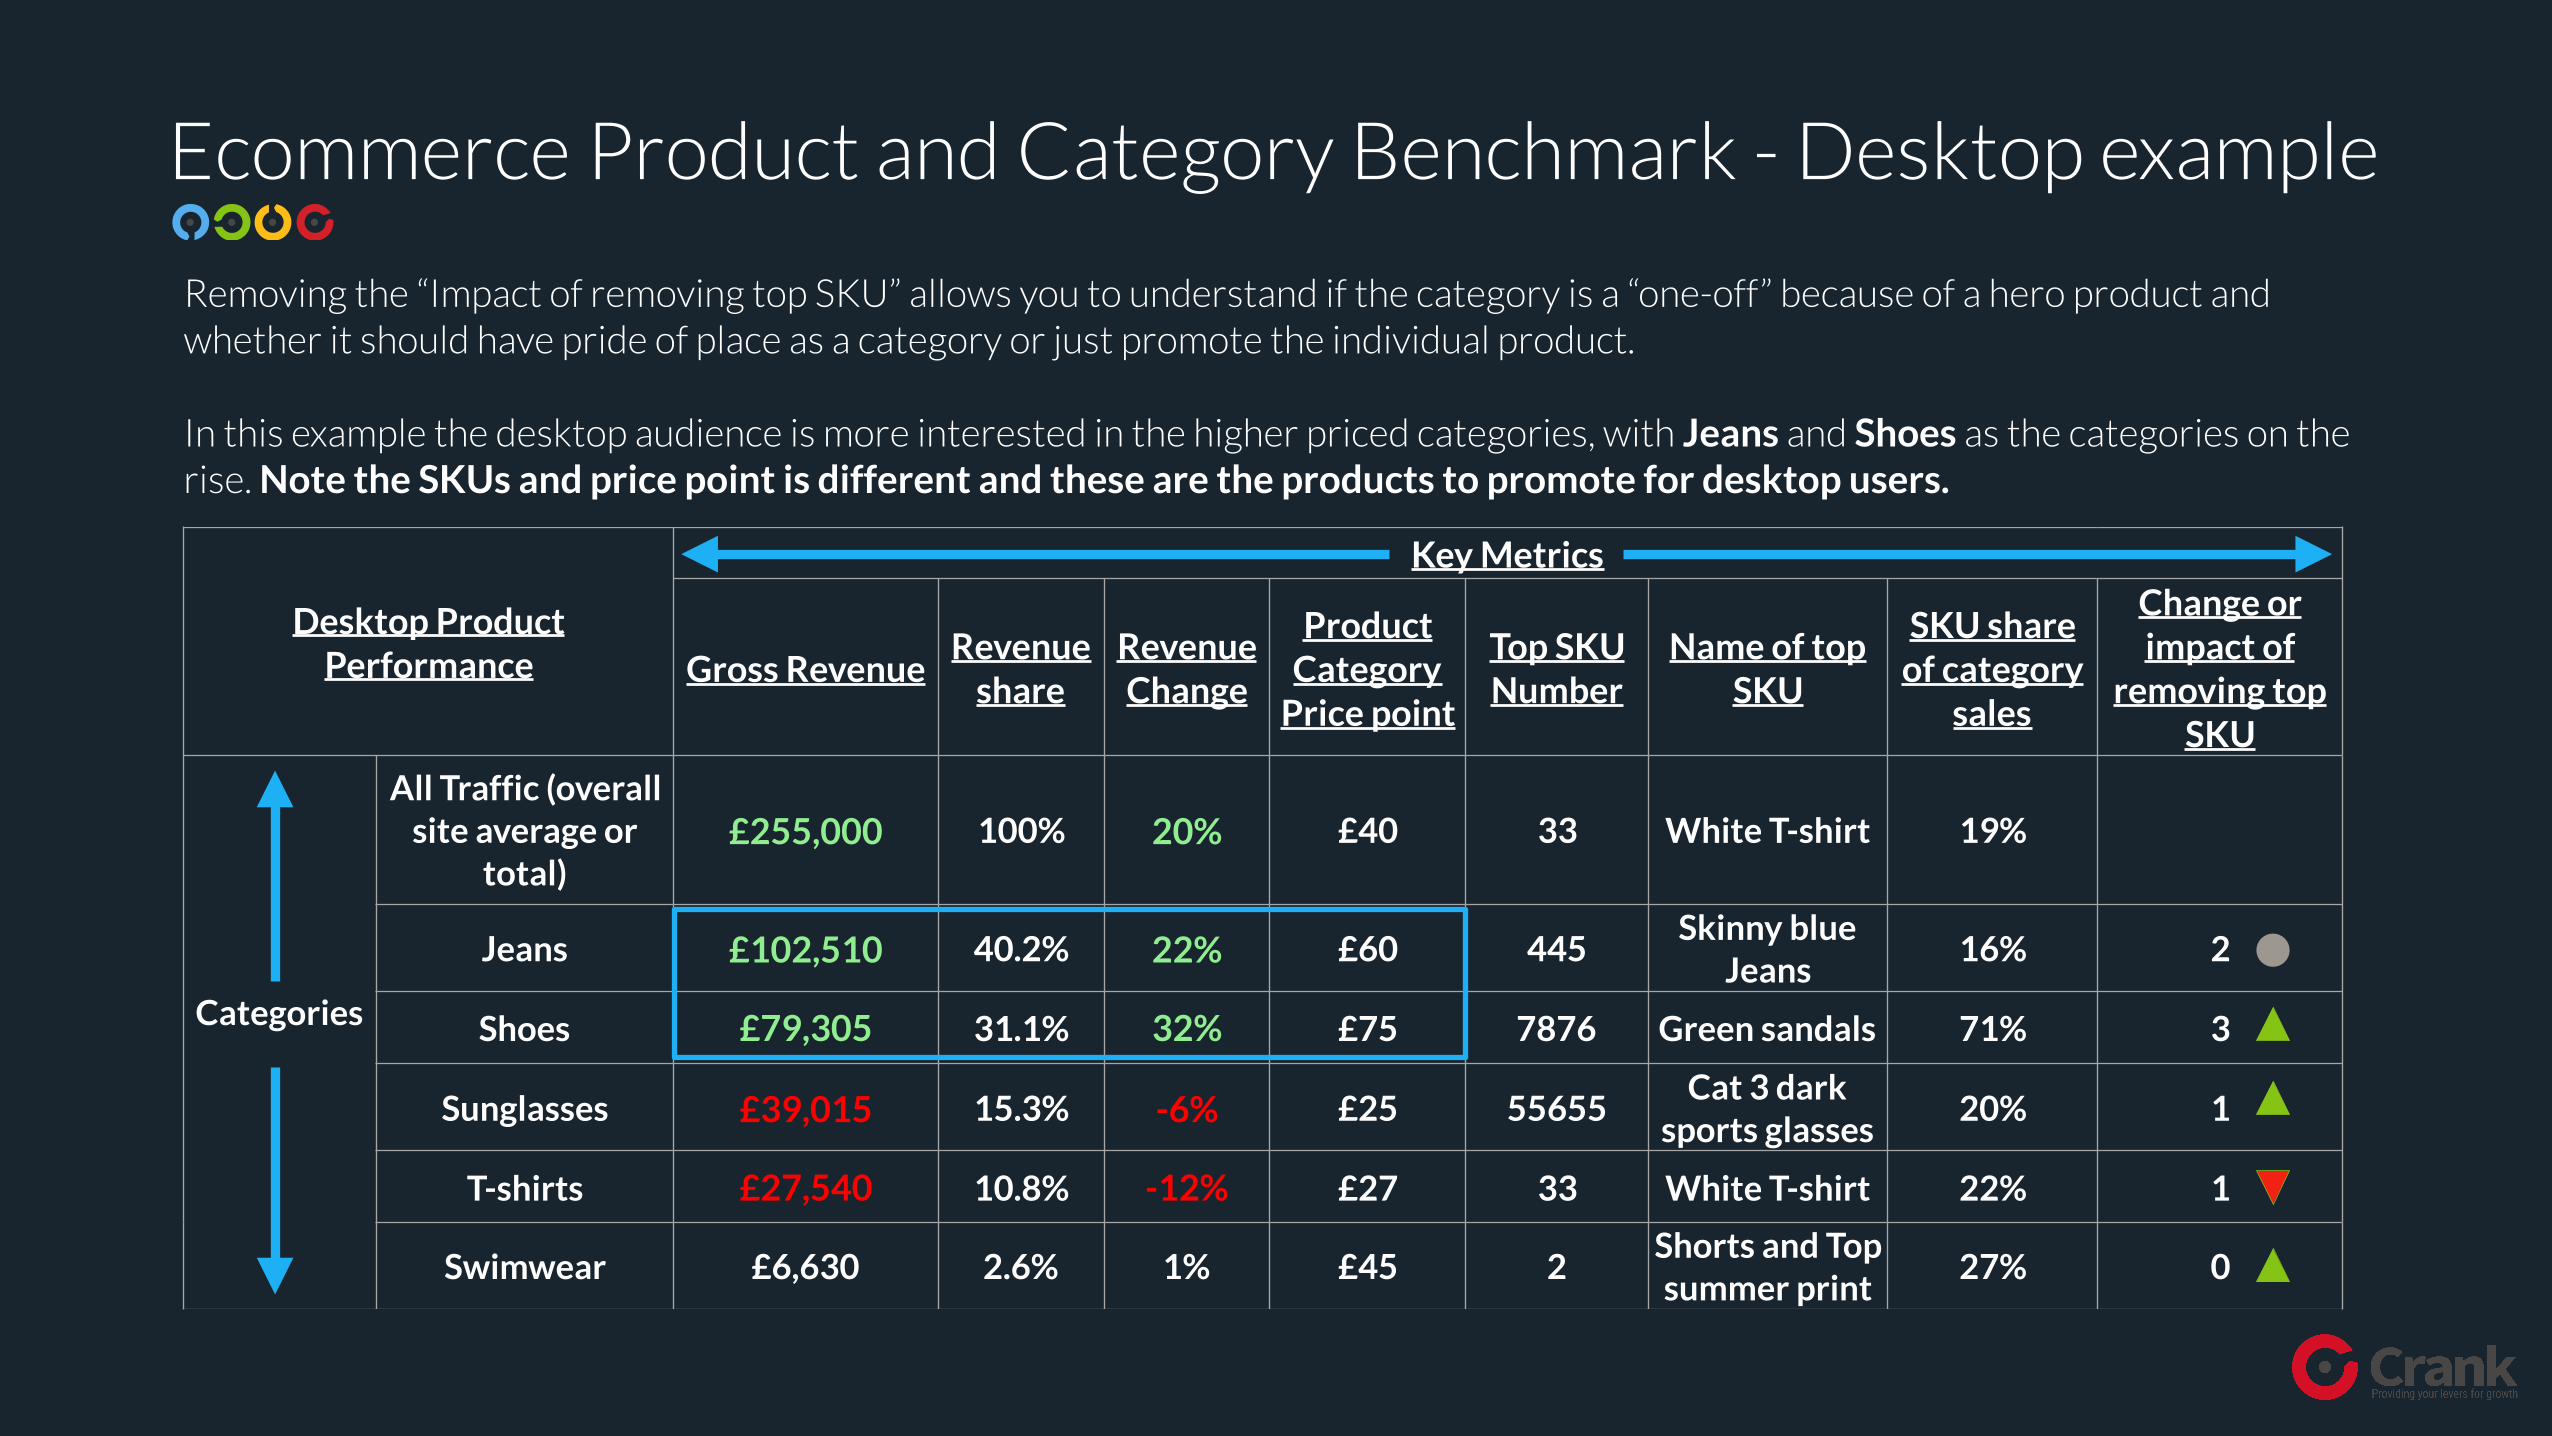
Ecommerce Product and Category Benchmark - Desktop example
Desktop Product Performance
Key Metrics
Gross RevenueRevenue
shareRevenue Change
Product Category
Price point
Top SKU Number
Name of top SKU
SKU share of category
sales
Change or impact of
removing top SKU
Categories
All Traffic (overall site average or
total)£255,000 100% 20% £40 33 White T-shirt 19%
Jeans £102,510 40.2% 22% £60 445Skinny blue
Jeans16% 2
Shoes £79,305 31.1% 32% £75 7876 Green sandals 71% 3
Sunglasses £39,015 15.3% -6% £25 55655Cat 3 dark
sports glasses20% 1
T-shirts £27,540 10.8% -12% £27 33 White T-shirt 22% 1
Swimwear £6,630 2.6% 1% £45 2Shorts and Top summer print
27% 0
Removing the “Impact of removing top SKU” allows you to understand if the category is a “one-off” because of a hero product and whether it should have pride of place as a category or just promote the individual product.
In this example the desktop audience is more interested in the higher priced categories, with Jeans and Shoes as the categories on the rise. Note the SKUs and price point is different and these are the products to promote for desktop users.

Example - Your Content Benchmark
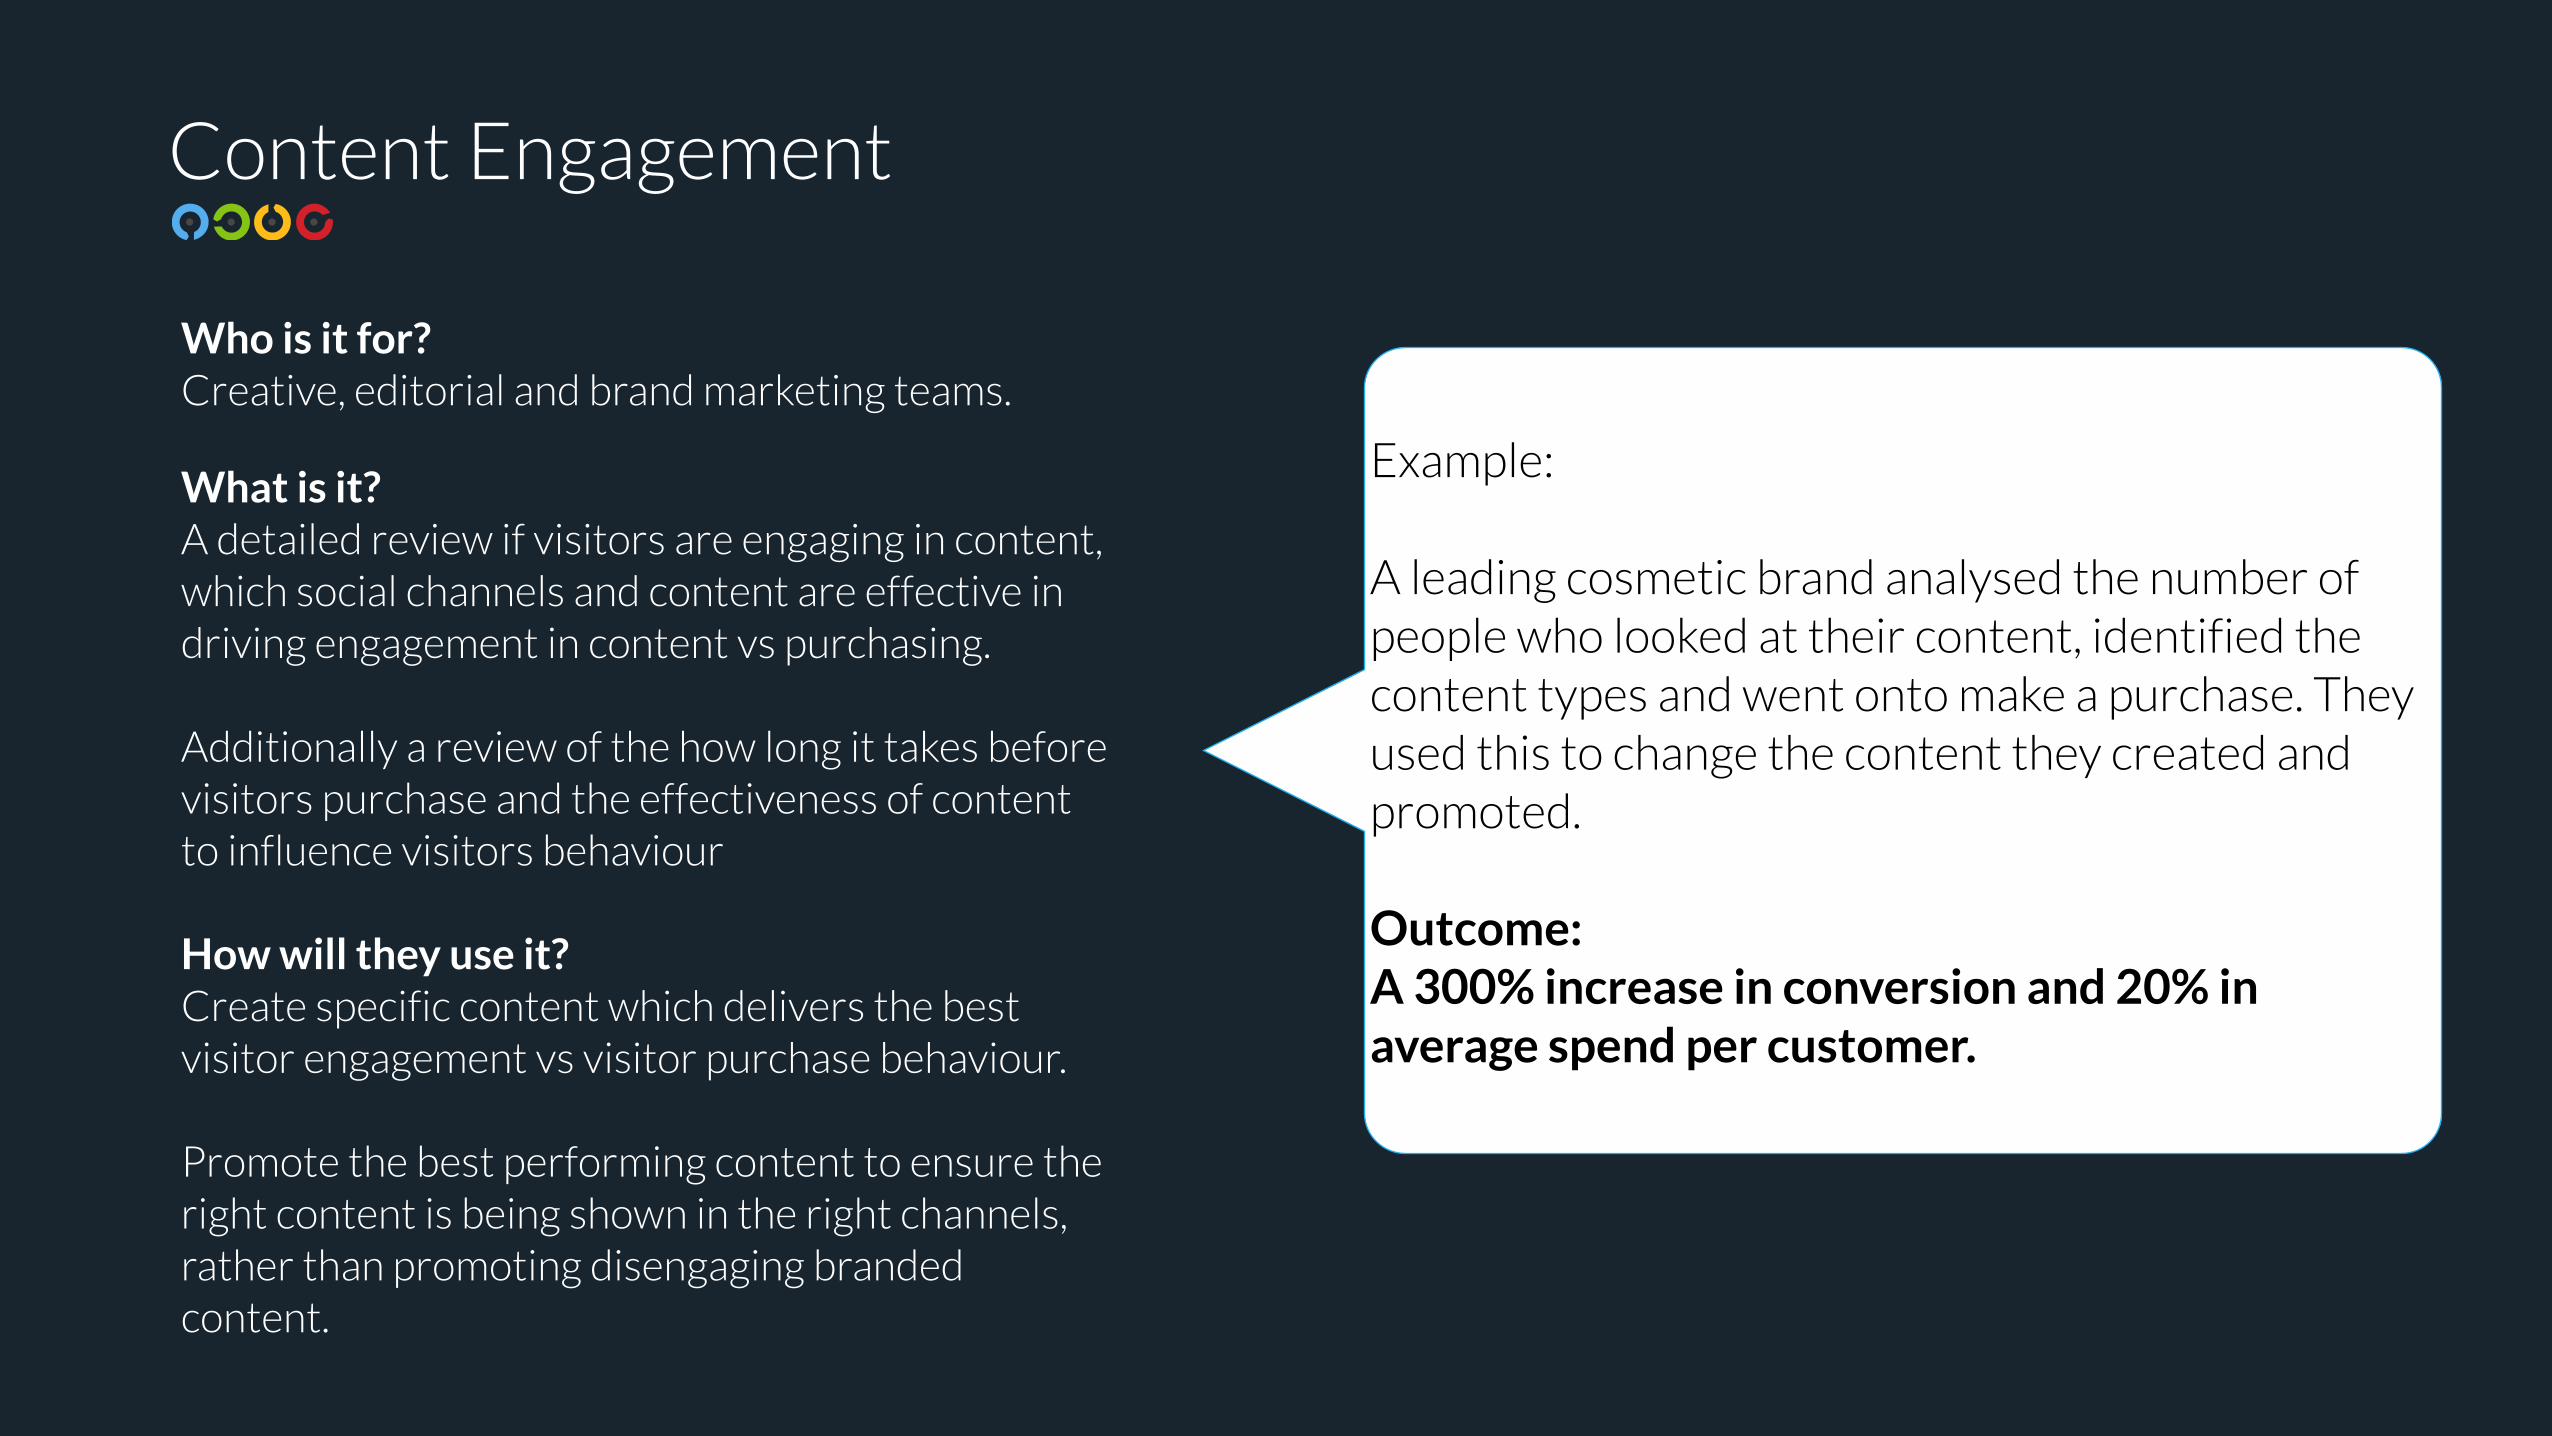
Who is it for? Creative, editorial and brand marketing teams.
What is it? A detailed review if visitors are engaging in content, which social channels and content are effective in driving engagement in content vs purchasing.
Additionally a review of the how long it takes before visitors purchase and the effectiveness of content to influence visitors behaviour
How will they use it? Create specific content which delivers the best visitor engagement vs visitor purchase behaviour.
Promote the best performing content to ensure the right content is being shown in the right channels, rather than promoting disengaging branded content.
Content Engagement
Example:
A leading cosmetic brand analysed the number of people who looked at their content, identified the content types and went onto make a purchase. They used this to change the content they created and promoted.
Outcome: A 300% increase in conversion and 20% in average spend per customer.
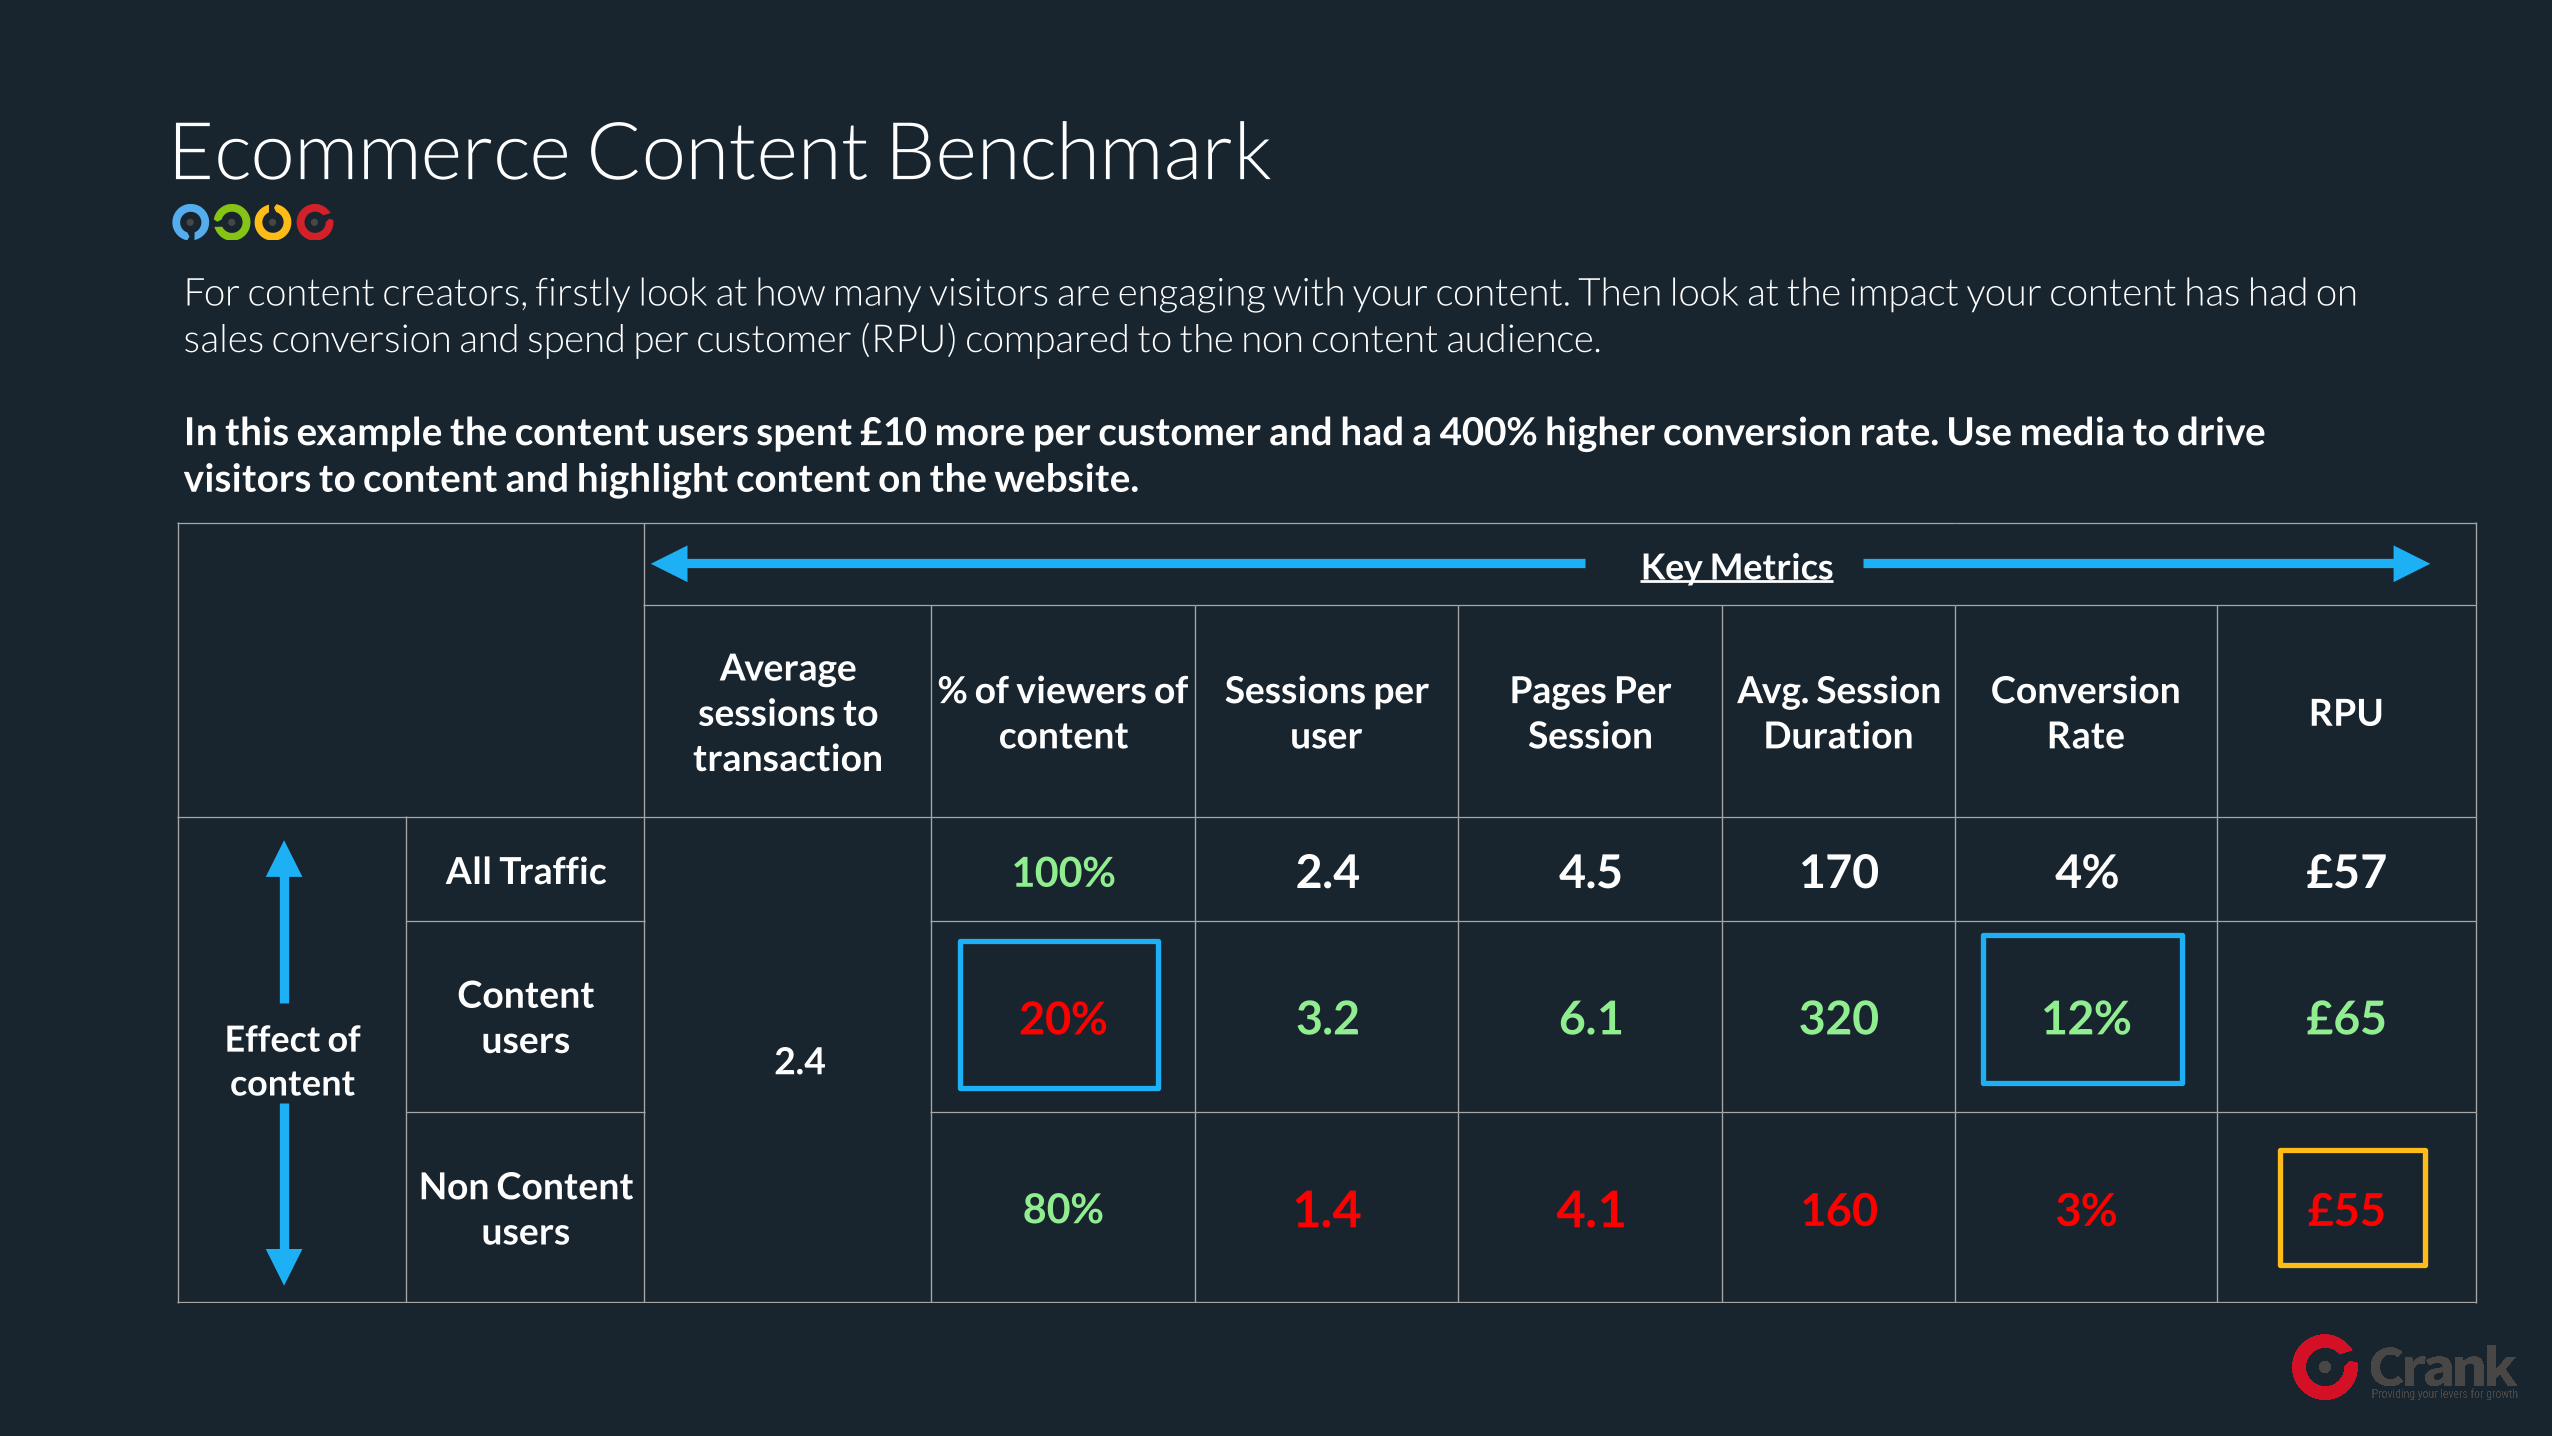
Ecommerce Content Benchmark
Key Metrics
Average sessions to transaction
% of viewers of content
Sessions per user
Pages Per Session
Avg. Session Duration
Conversion Rate
RPU
Effect of content
All Traffic
2.4
100% 2.4 4.5 170 4% £57
Content users 20% 3.2 6.1 320 12% £65
Non Content users
80% 1.4 4.1 160 3% £55
For content creators, firstly look at how many visitors are engaging with your content. Then look at the impact your content has had on sales conversion and spend per customer (RPU) compared to the non content audience.
In this example the content users spent £10 more per customer and had a 400% higher conversion rate. Use media to drive visitors to content and highlight content on the website.

Metrics Glossary
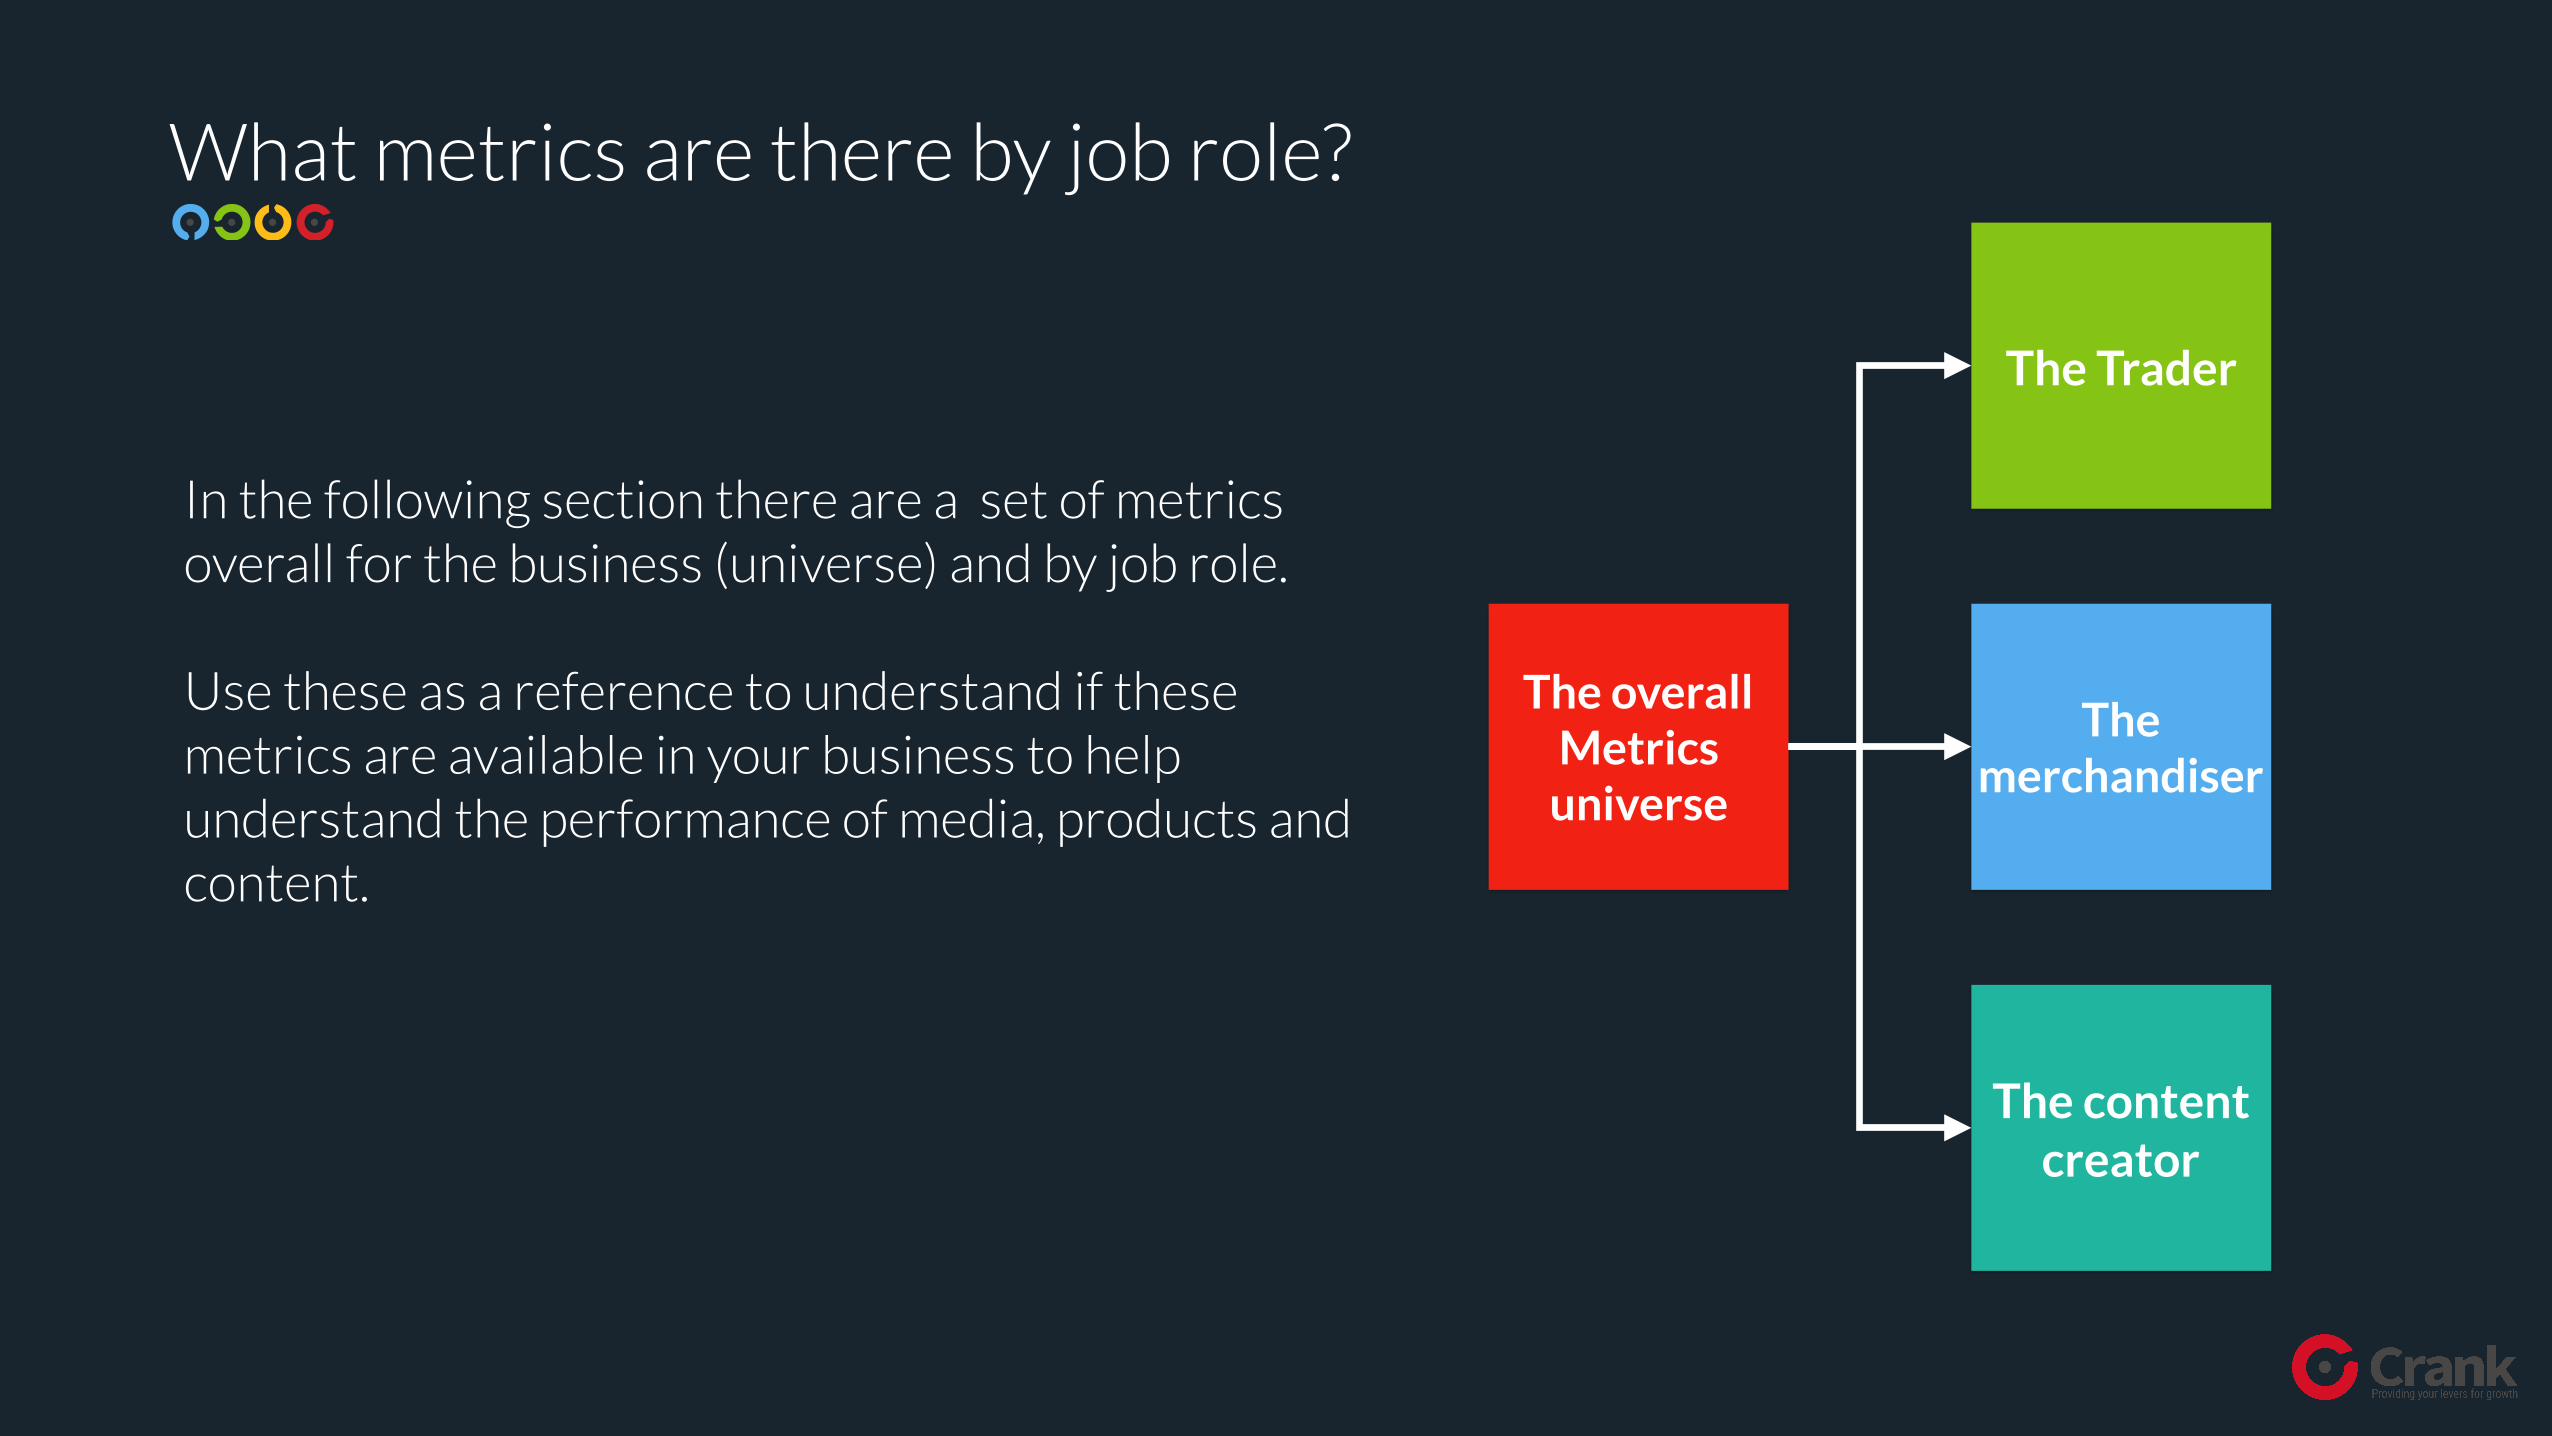
What metrics are there by job role?
In the following section there are a set of metrics overall for the business (universe) and by job role.
Use these as a reference to understand if these metrics are available in your business to help understand the performance of media, products and content.
The Trader
The content creator
The merchandiser
The overall Metrics
universe
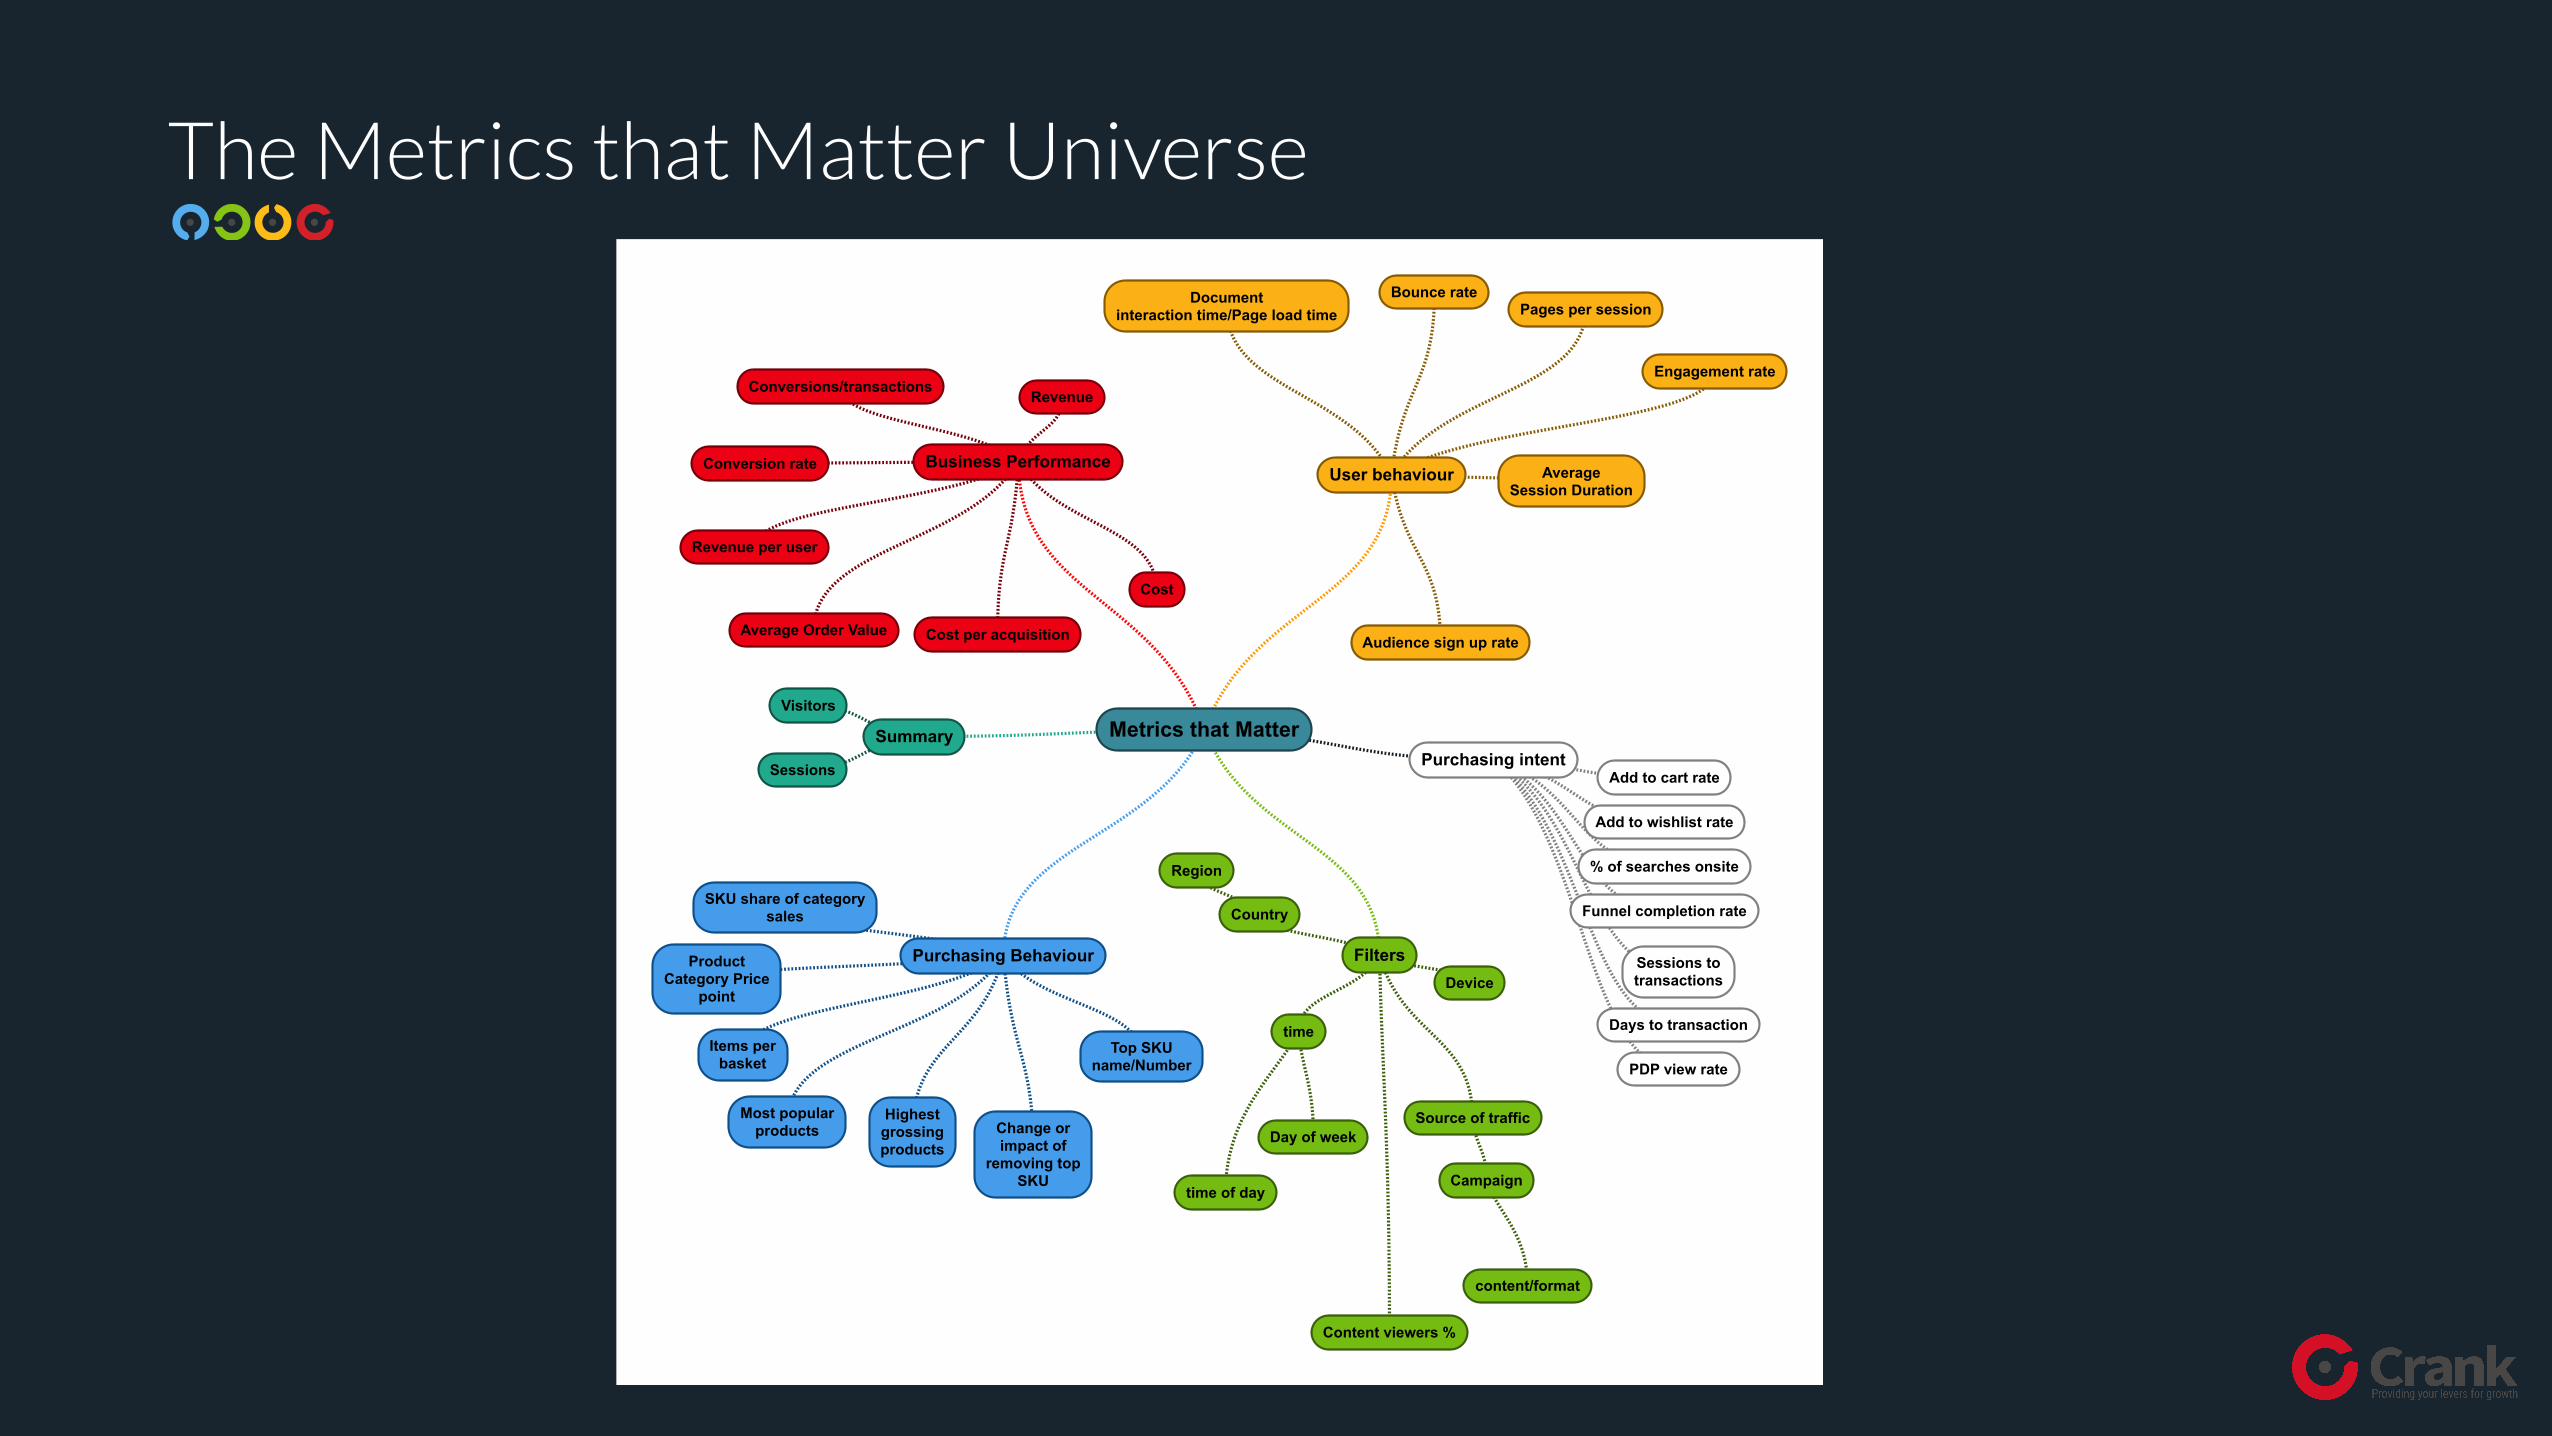
The Metrics that Matter Universe
Metrics that Matter
Business Performance
RevenueConversions/transactions
Conversion rate
Average Order Value Cost per acquisition
Revenue per user
Cost
User behaviour
Bounce ratePages per session
Documentinteraction time/Page load time
Average Session Duration
Audience sign up rate
Engagement rate
Purchasing Behaviour
Items perbasket
Most popularproducts
Highestgrossingproducts
Top SKUname/Number
SKU share of categorysales
Change orimpact of
removing topSKU
ProductCategory Price
point
Purchasing intentAdd to cart rate
Add to wishlist rate
% of searches onsite
Funnel completion rate
Sessions totransactions
Days to transaction
PDP view rate
Summary
Sessions
Visitors
FiltersDevice
Source of traffic
Campaign
content/format
time
Day of week
time of day
Country
Region
Content viewers %
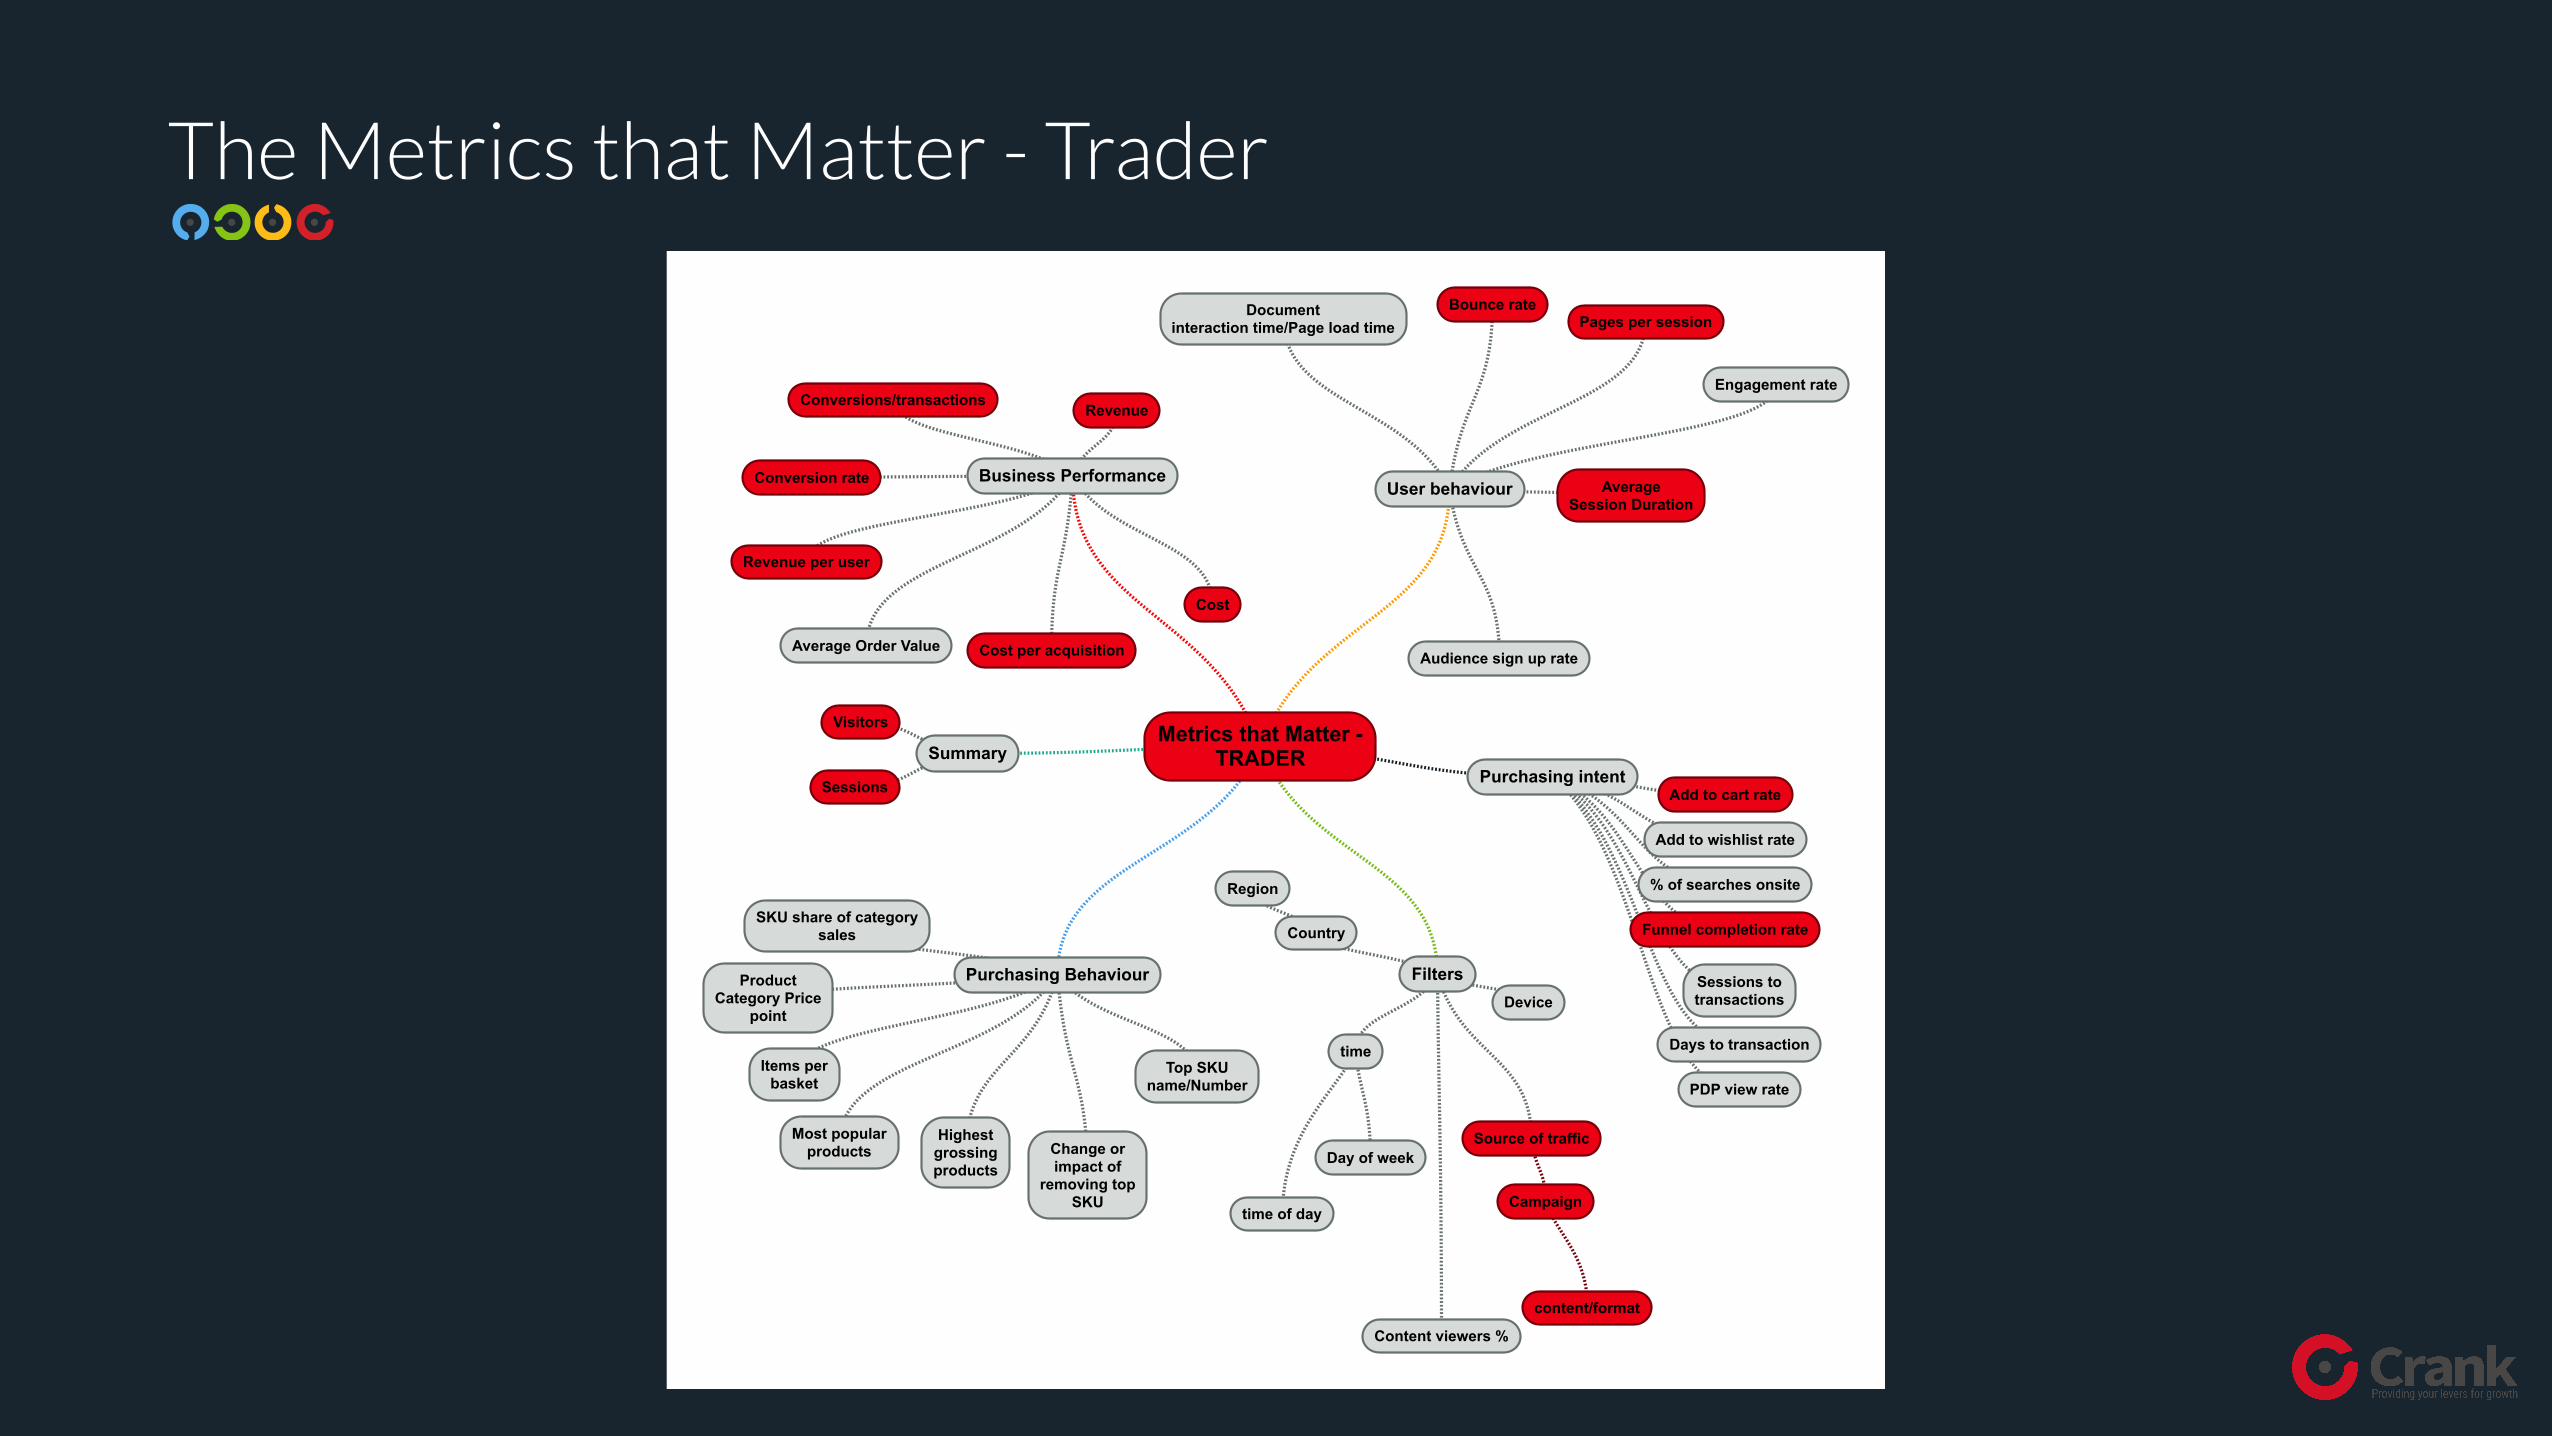
The Metrics that Matter - Trader
Metrics that Matter -TRADER
Business Performance
RevenueConversions/transactions
Conversion rate
Average Order Value Cost per acquisition
Revenue per user
Cost
User behaviour
Bounce ratePages per session
Documentinteraction time/Page load time
Average Session Duration
Audience sign up rate
Engagement rate
Purchasing Behaviour
Items perbasket
Most popularproducts
Highestgrossingproducts
Top SKUname/Number
SKU share of categorysales
Change orimpact of
removing topSKU
ProductCategory Price
point
Purchasing intentAdd to cart rate
Add to wishlist rate
% of searches onsite
Funnel completion rate
Sessions totransactions
Days to transaction
PDP view rate
Summary
Sessions
Visitors
FiltersDevice
Source of traffic
Campaign
content/format
time
Day of week
time of day
Country
Region
Content viewers %
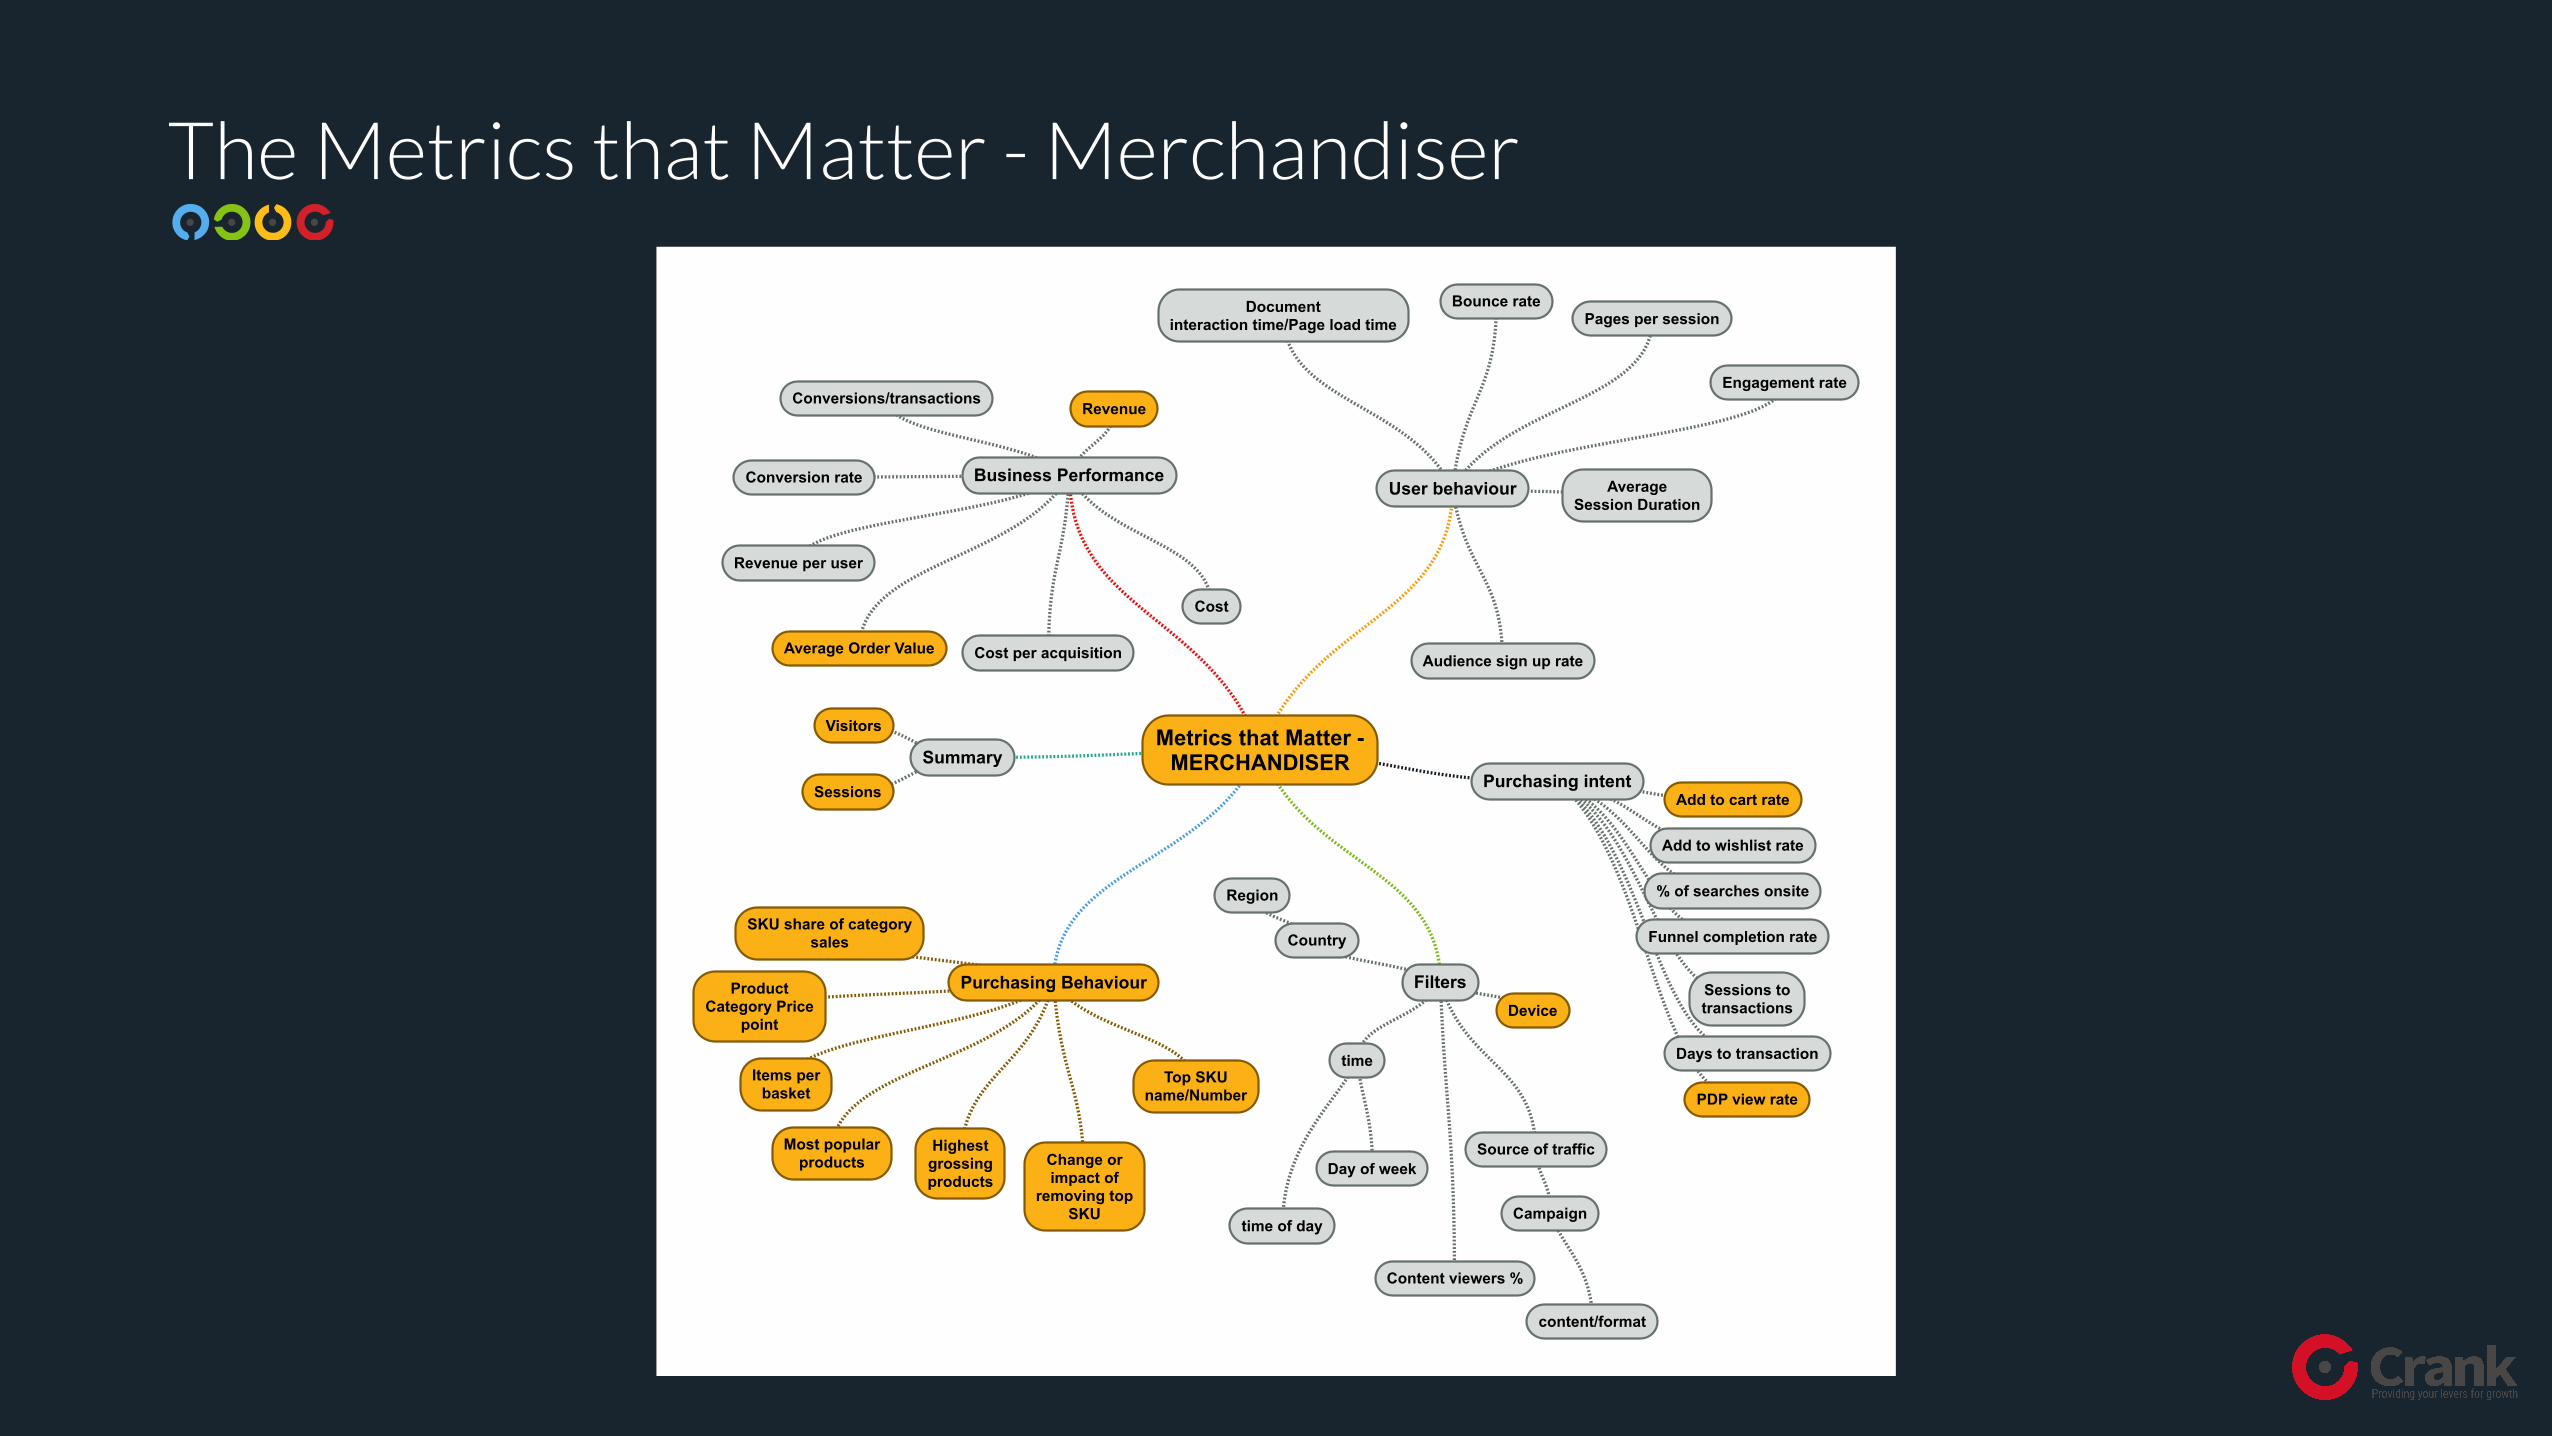
The Metrics that Matter - Merchandiser
Metrics that Matter -MERCHANDISER
Business Performance
RevenueConversions/transactions
Conversion rate
Average Order Value Cost per acquisition
Revenue per user
Cost
User behaviour
Bounce ratePages per session
Documentinteraction time/Page load time
Average Session Duration
Audience sign up rate
Engagement rate
Purchasing Behaviour
Items perbasket
Most popularproducts
Highestgrossingproducts
Top SKUname/Number
SKU share of categorysales
Change orimpact of
removing topSKU
ProductCategory Price
point
Purchasing intentAdd to cart rate
Add to wishlist rate
% of searches onsite
Funnel completion rate
Sessions totransactions
Days to transaction
PDP view rate
Summary
Sessions
Visitors
FiltersDevice
Source of traffic
Campaign
content/format
time
Day of week
time of day
Country
Region
Content viewers %
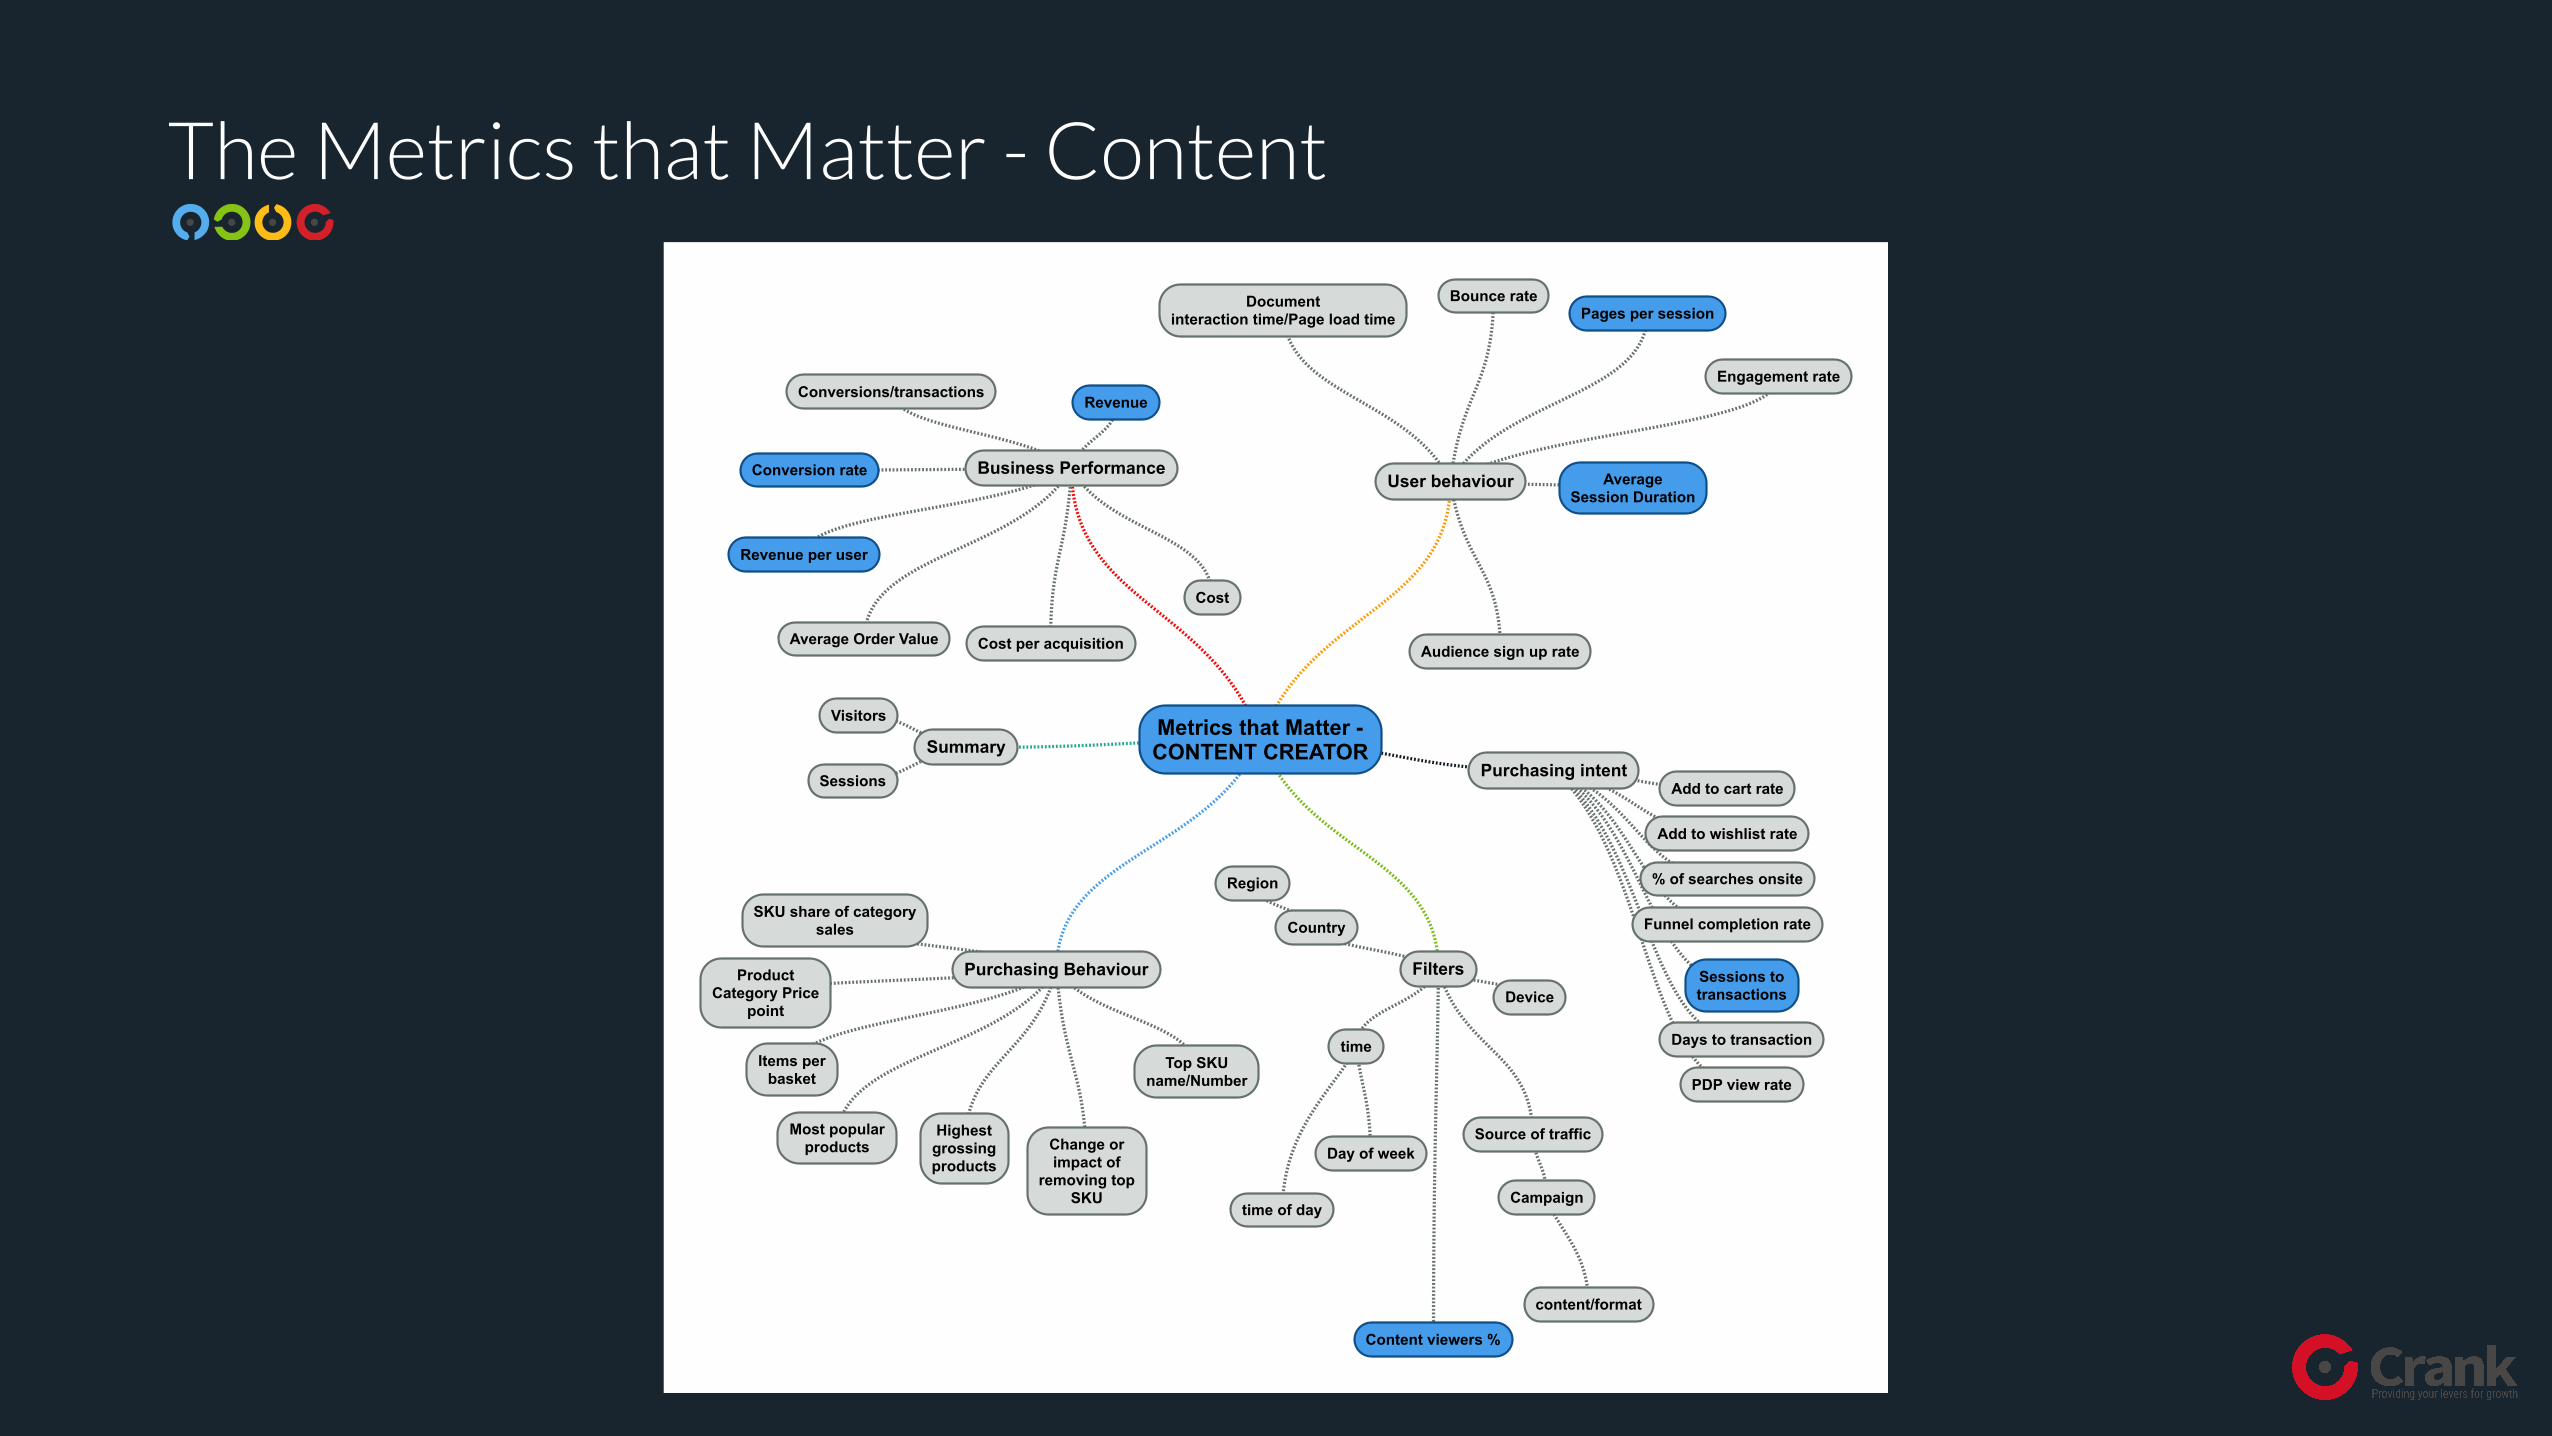
The Metrics that Matter - Content
Metrics that Matter -CONTENT CREATOR
Business Performance
RevenueConversions/transactions
Conversion rate
Average Order Value Cost per acquisition
Revenue per user
Cost
User behaviour
Bounce ratePages per session
Documentinteraction time/Page load time
Average Session Duration
Audience sign up rate
Engagement rate
Purchasing Behaviour
Items perbasket
Most popularproducts
Highestgrossingproducts
Top SKUname/Number
SKU share of categorysales
Change orimpact of
removing topSKU
ProductCategory Price
point
Purchasing intentAdd to cart rate
Add to wishlist rate
% of searches onsite
Funnel completion rate
Sessions totransactions
Days to transaction
PDP view rate
Summary
Sessions
Visitors
FiltersDevice
Source of traffic
Campaign
content/format
time
Day of week
time of day
Country
Region
Content viewers %

What metrics do you use?
We hope this overview was useful.
If you think we’ve missed anything or you have a different approach which you think is better please drop us an email and let us know.
Good luck!

▸ wearecrank.com
▸ @wearecrank
Wearecrank Ltd, trading as Crank. Registered number: 9456050 | Registered address: 3rd floor, Crown House, 151 High Road, Loughton, Essex IG10 4LG | VAT: 234 2270 39