Embed Size (px)
Citation preview
Metrics that Matter
Presented by
Steve JacobsonSteve Jacobson
President and CEO
Jacobson Consulting Applications, Inc.
November 16, 2009
©2008 Lodermeier & Montei Design

Agenda
• Overview – Making data work for you
• Context – Why do we need to use our data?
• 30,000 Feet: Strategies and scorecards• 30,000 Feet: Strategies and scorecards
• 10,000 Feet: Perspectives and objectives
• 500 Feet: Key Performance Indicators (KPI’s)
• Putting it into practice
• Questions and Answers
Overview
…Or, a Brief History of JCA……Or, a Brief History of JCA…
What we used to hear
I need more information to manage my business
Then we heard
I have the data but it’s a mess
Then we heard
I have the data, but it’s in 10 different places
What we hear now…
I have the data….
It is clean….It is clean….
It is integrated….
What we hear now…
How Do I Use My Data
To Make My Business
Successful???

Now More than Ever
According to Gartner:
“Through 2012, more than 35 % of the top “Through 2012, more than 35 % of the top 5,000 global companies will regularly fail to make insightful decisions about significant changes in their business…”
Now More than Ever
“…The economic downturn forces businesses to
• Be aware of changes in their organizations • Be aware of changes in their organizations
• Re-think their strategies
• Face demands from stakeholders for greater
transparency about core performance metrics
Now More than Ever
“However, most organizations do not have the
• Information, • Information,
• Processes, and
• Tools
needed to make informed, responsive decisions”
So We Return To:
How Do I Use My Data
To Make My Business
Successful???
Citation
The Balanced Scorecard
Strategy MapsStrategy Maps
Robert Kaplan & David Norton
Before Technology, Focus on Business
We will get to Metrics
We will get to Technology
We will get to Tangible AdviceWe will get to Tangible Advice
But First We Must Think Bigger
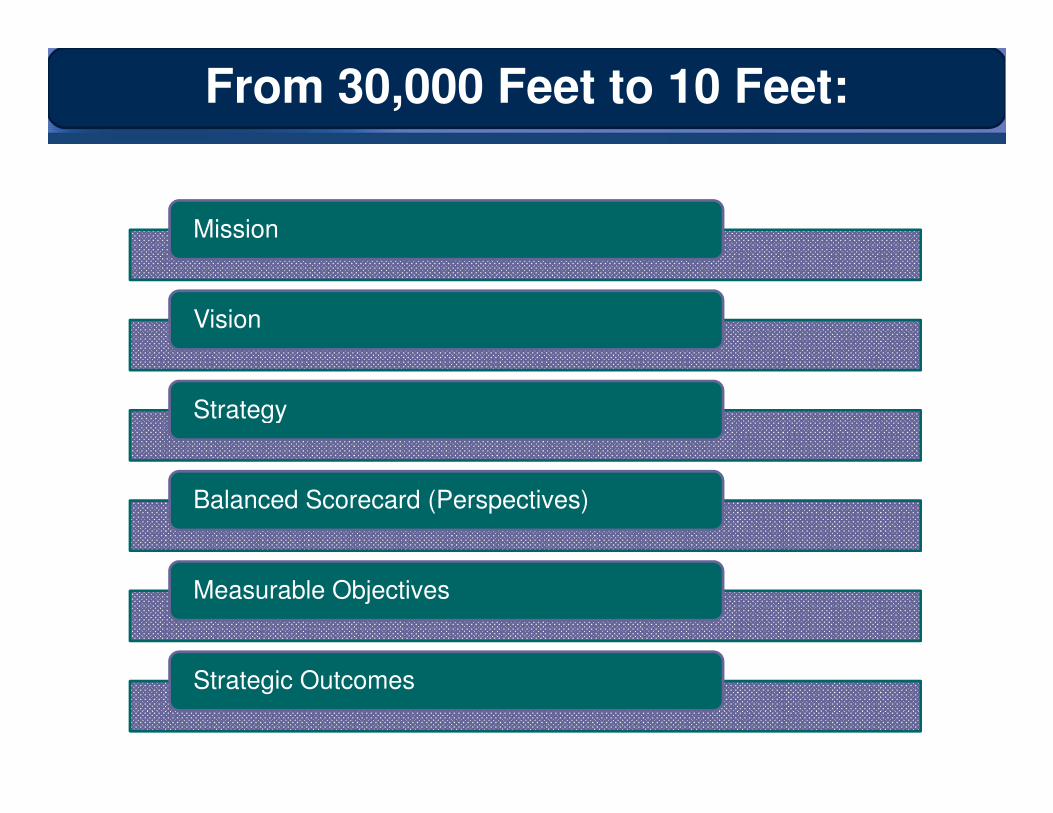
Mission
Vision
Strategy
From 30,000 Feet to 10 Feet:
Strategy
Balanced Scorecard (Perspectives)
Measurable Objectives
Strategic Outcomes
The Mission
Why we exist…
“…to develop the most creative, innovative and
profitable entertainment experiences and related profitable entertainment experiences and related
products in the world”
{Walt Disney Company}
“…to inspire an understanding of and passion for
science and technology learning”
{The Franklin Institute}
The Vision
How We Achieve Our Mission…
“…to deliver unique, memorable and rewarding
experiences to millions of visitors”experiences to millions of visitors”
{Merlin Entertainments}
“…to inspire and motivate our children to achieve their
full potential in the fields of science, technology,
engineering and medicine.”
{Museum of Science and Industry, Chicago}
The Strategy
How to Reach Our Vision
• A mission is stable, a strategy is dynamic• A mission is stable, a strategy is dynamic
• Set of activities an organization can excel at to
create a sustainable difference in the
marketplace

Examples of Strategy
ThemePark
ScienceCenter
• Build lifelong loyalty
• Attract broader age range
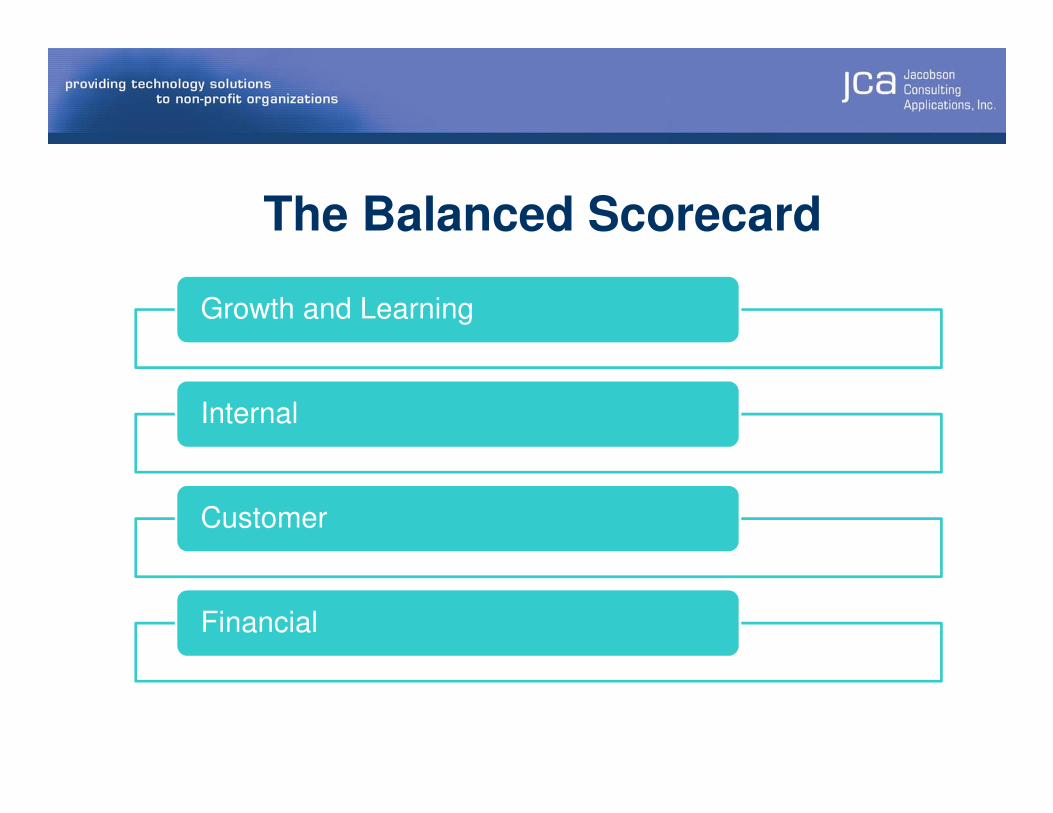
The Balanced Scorecard
Growth and Learning
InternalInternal
Customer
Financial
Show Me the Money?
Not always…
A Balanced Scorecard
looks at all aspects of the businesslooks at all aspects of the business
This presentation focuses on
revenue-generating metrics only
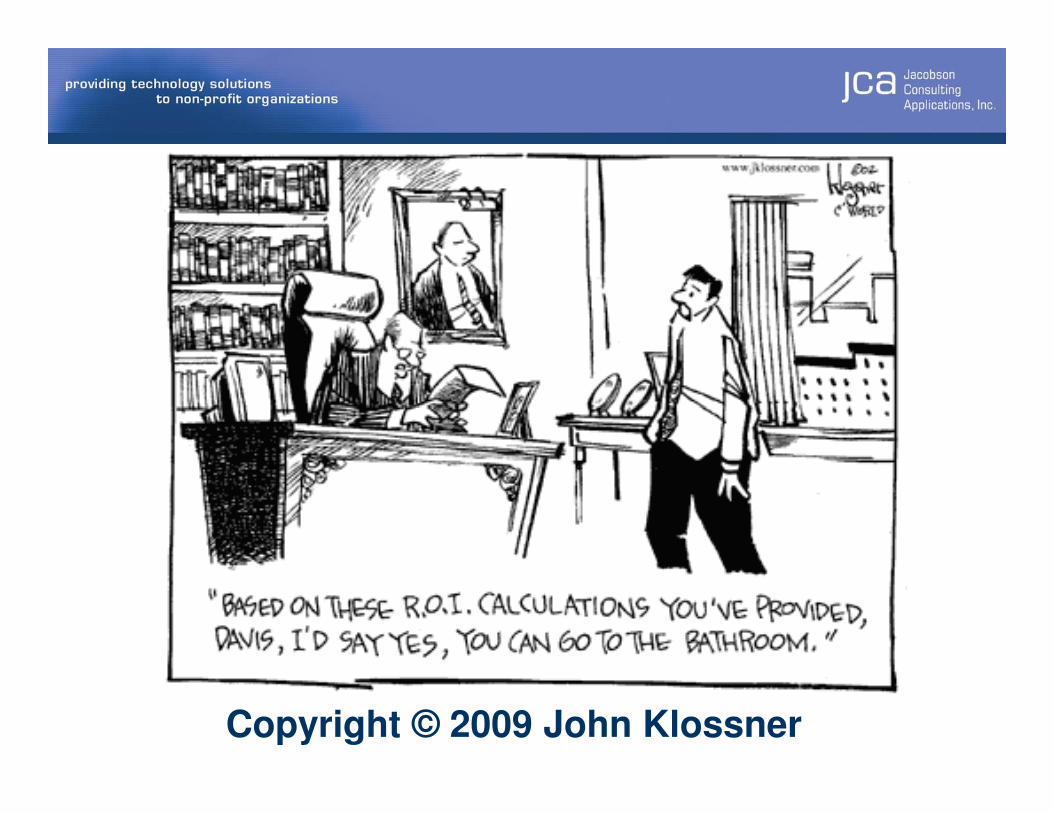
Copyright © 2009 John Klossner
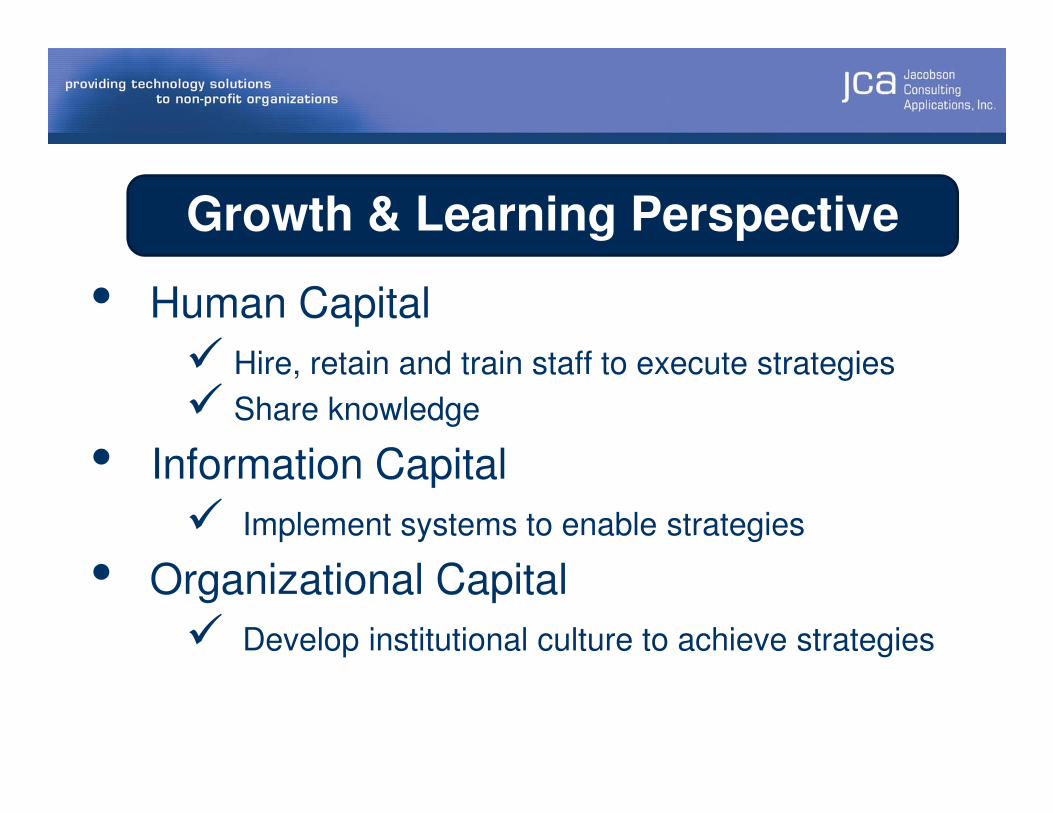
Growth & Learning Perspective
• Human Capital
� Hire, retain and train staff to execute strategies
� Share knowledge� Share knowledge
• Information Capital
� Implement systems to enable strategies
• Organizational Capital
� Develop institutional culture to achieve strategies
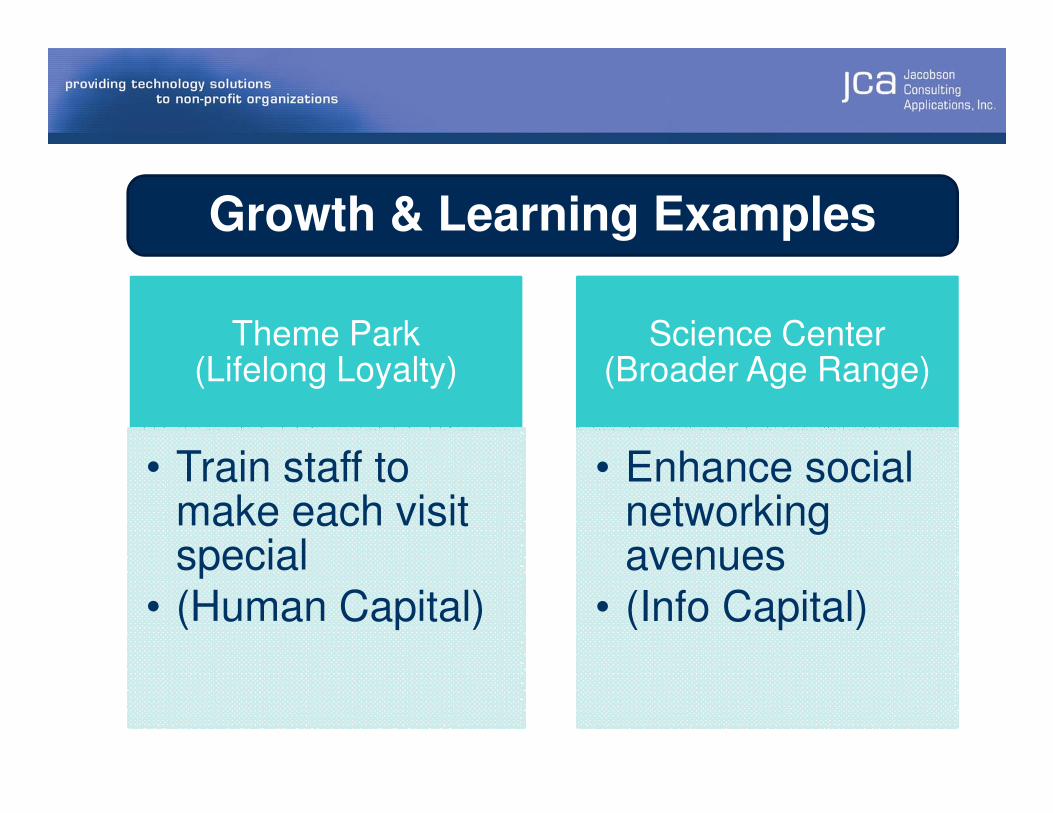
Growth & Learning Examples
Theme Park (Lifelong Loyalty)
Science Center(Broader Age Range)
• Train staff to make each visit special
• (Human Capital)
• Enhance social networking avenues
• (Info Capital)
Internal Perspective
• Internal Processes
• Create and Deliver the Value Proposition
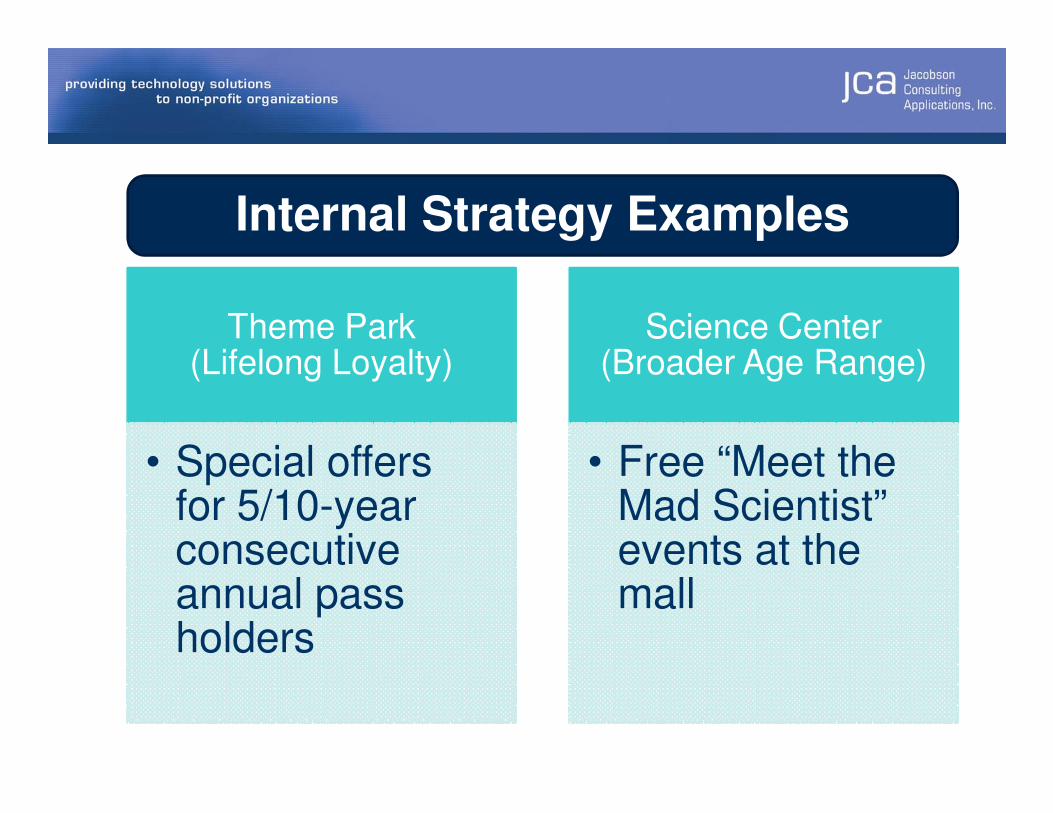
Internal Strategy Examples
Theme Park (Lifelong Loyalty)
Science Center(Broader Age Range)
• Special offers for 5/10-year consecutive annual pass holders
• Free “Meet the Mad Scientist” events at the mall
Customer Perspective
• Define the Value Proposition
• Acquire, Retain, Increase
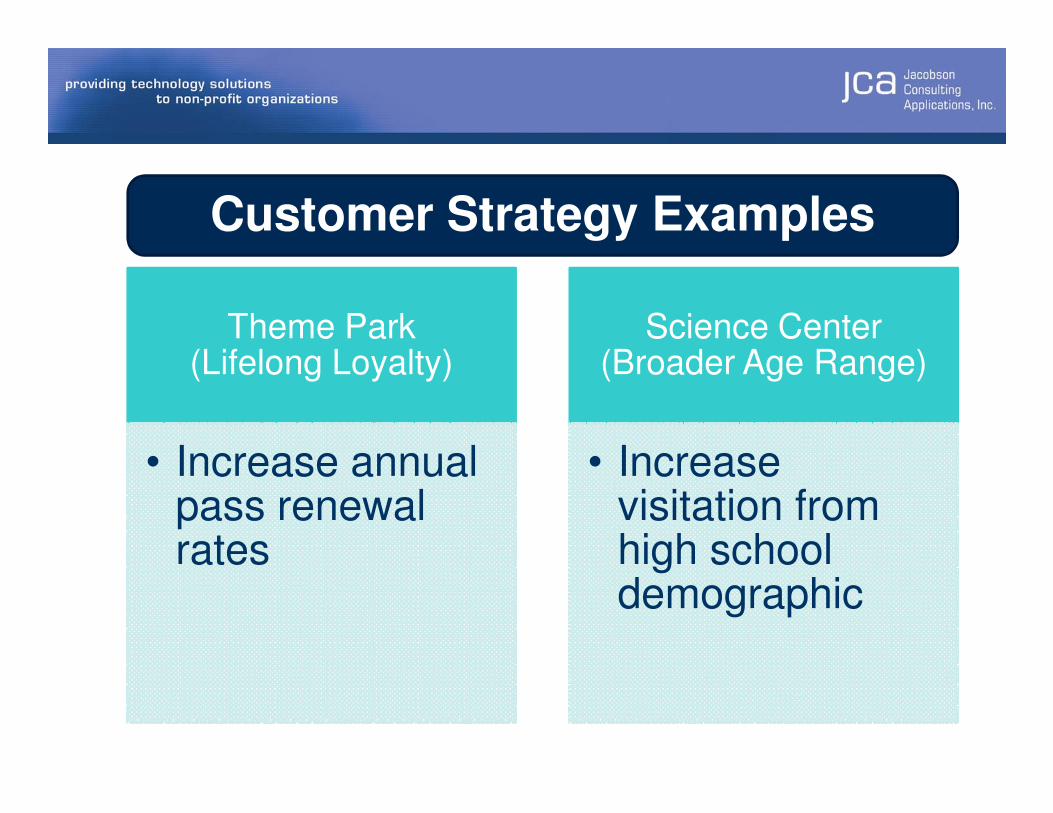
Customer Strategy Examples
Theme Park (Lifelong Loyalty)
Science Center(Broader Age Range)
• Increase annual pass renewal rates
• Increase visitation from high school demographic
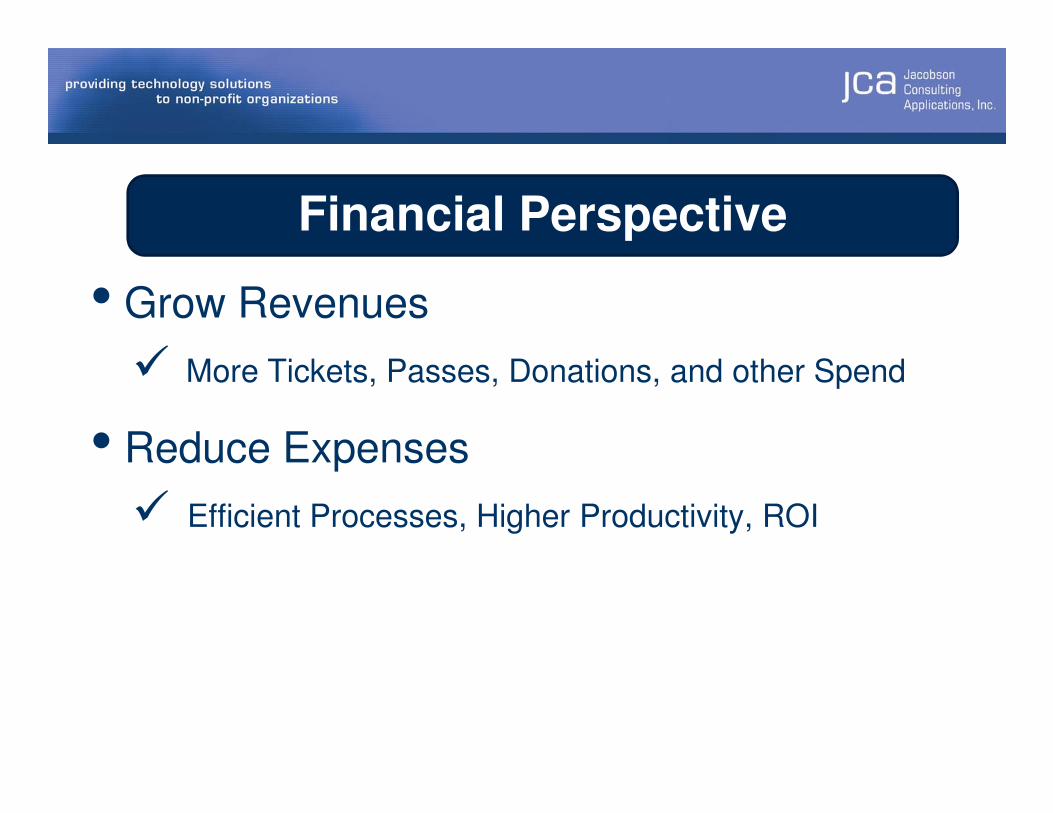
Financial Perspective
• Grow Revenues
� More Tickets, Passes, Donations, and other Spend
•• Reduce Expenses
� Efficient Processes, Higher Productivity, ROI
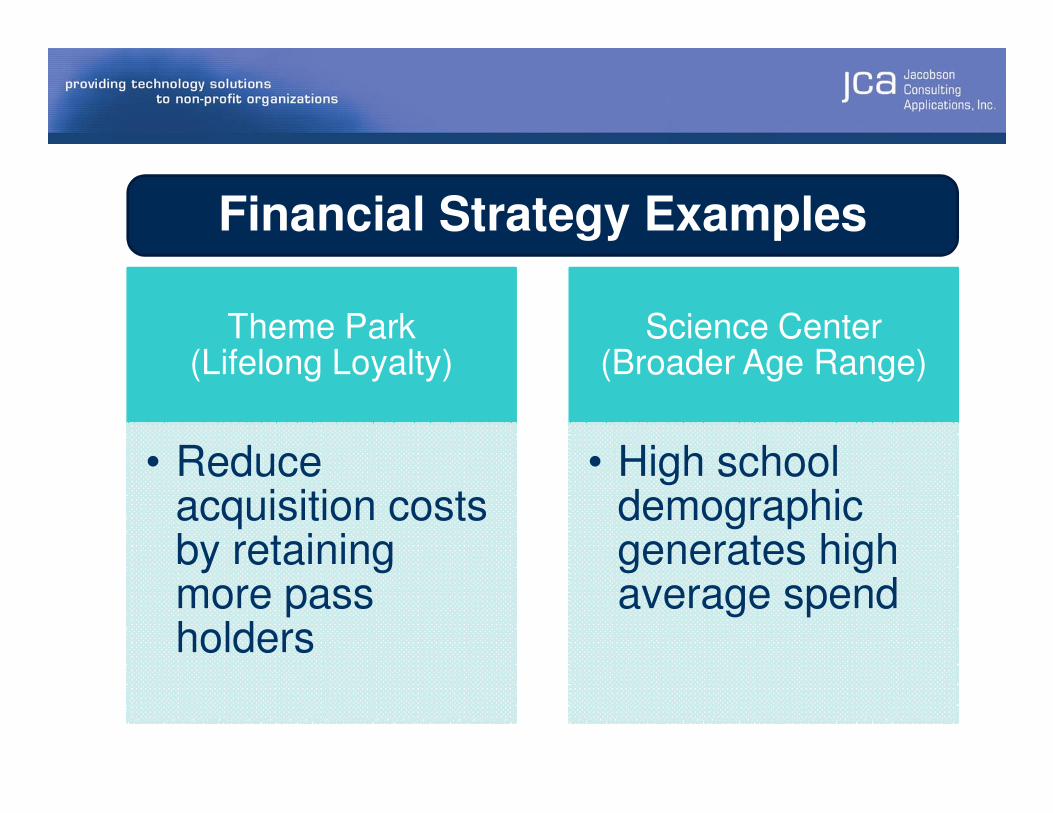
Financial Strategy Examples
Theme Park (Lifelong Loyalty)
Science Center(Broader Age Range)
• Reduce acquisition costs by retaining more pass holders
• High school demographic generates high average spend
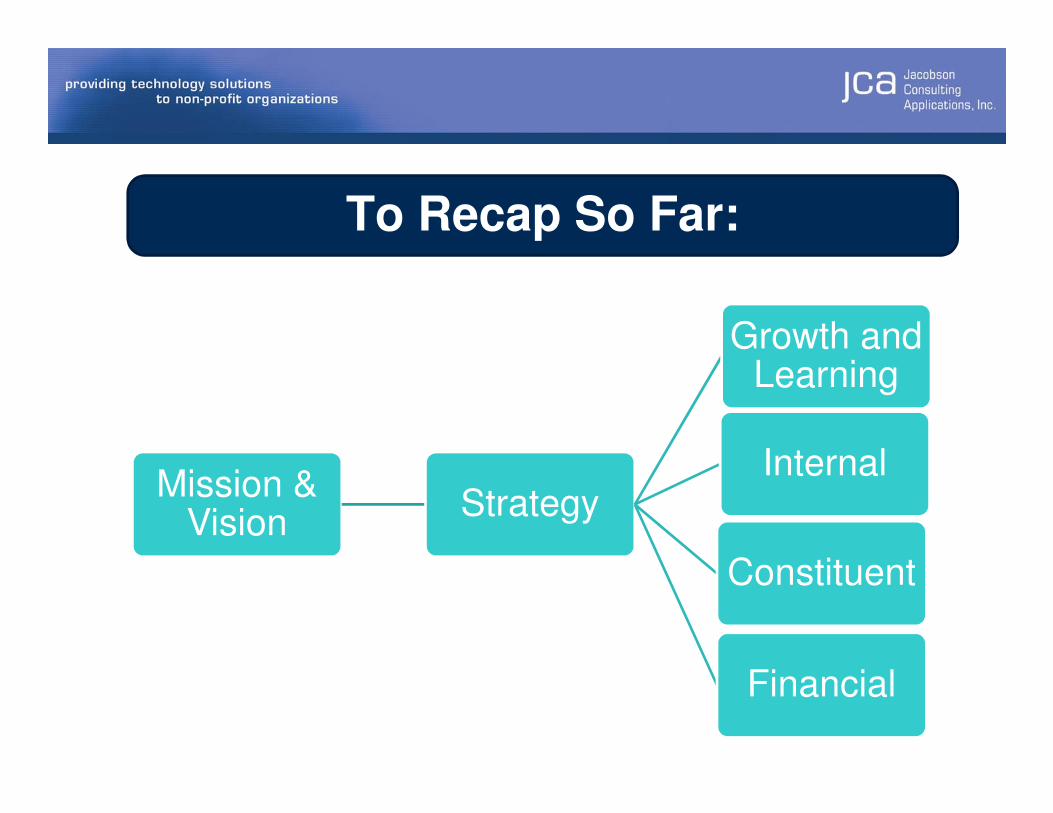
To Recap So Far:
Growth and Learning
Mission & Vision
Strategy
Financial
Constituent
Internal
Measuring Strategy
You now have a series of well-articulated strategies
But…
“You cannot manage what you cannot measure”
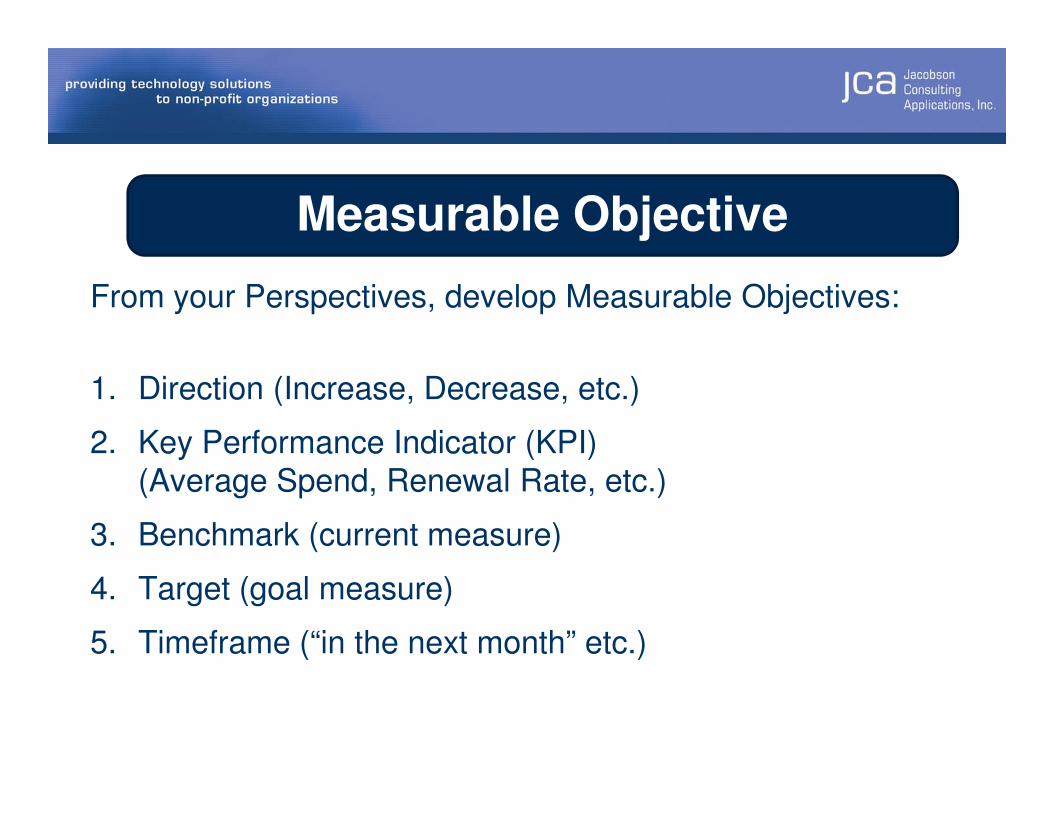
Measurable Objective
From your Perspectives, develop Measurable Objectives:
1. Direction (Increase, Decrease, etc.)
2. Key Performance Indicator (KPI)
(Average Spend, Renewal Rate, etc.)
3. Benchmark (current measure)
4. Target (goal measure)
5. Timeframe (“in the next month” etc.)
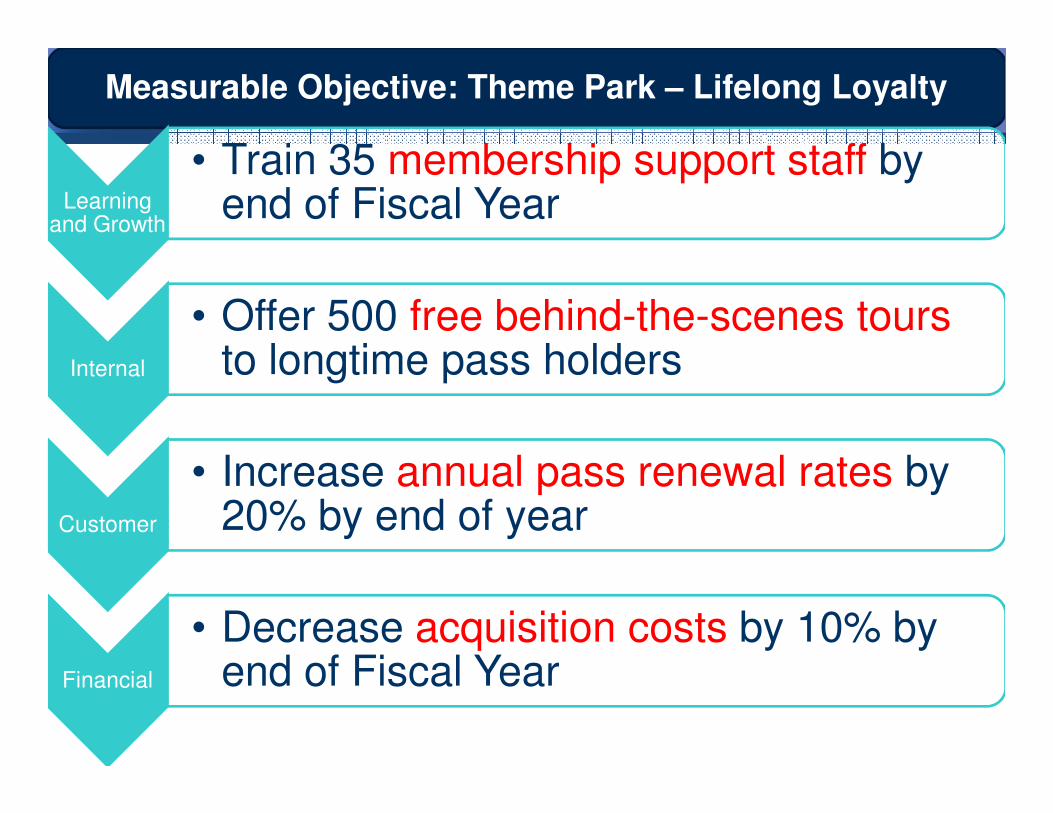
Measurable Objective: Theme Park – Lifelong Loyalty
Learning and Growth
• Train 35 membership support staff by end of Fiscal Year
Internal
• Offer 500 free behind-the-scenes tours to longtime pass holders
Customer
• Increase annual pass renewal rates by 20% by end of year
Financial
• Decrease acquisition costs by 10% by end of Fiscal Year
Key Performance Indicators (KPIs)
Key Performance Indicators (KPIs)
are
Metrics
that help an organization
evaluate the success of its strategies
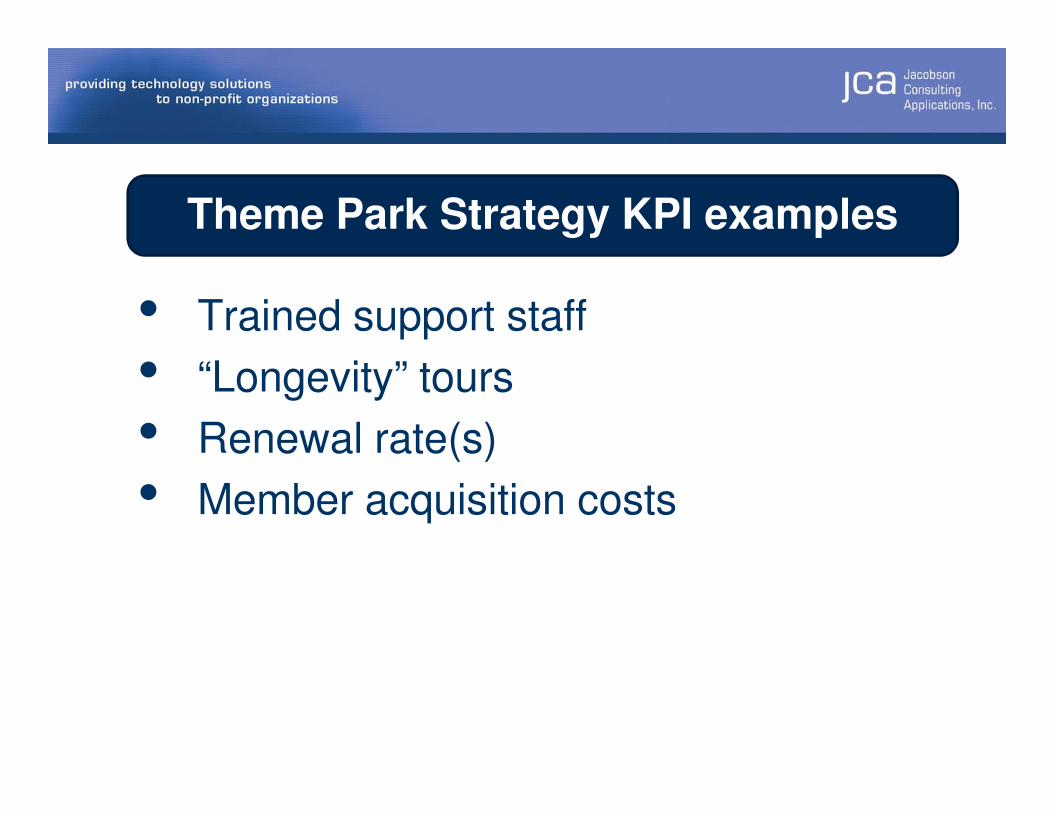
Theme Park Strategy KPI examples
• Trained support staff
• “Longevity” tours
•• Renewal rate(s)
• Member acquisition costs
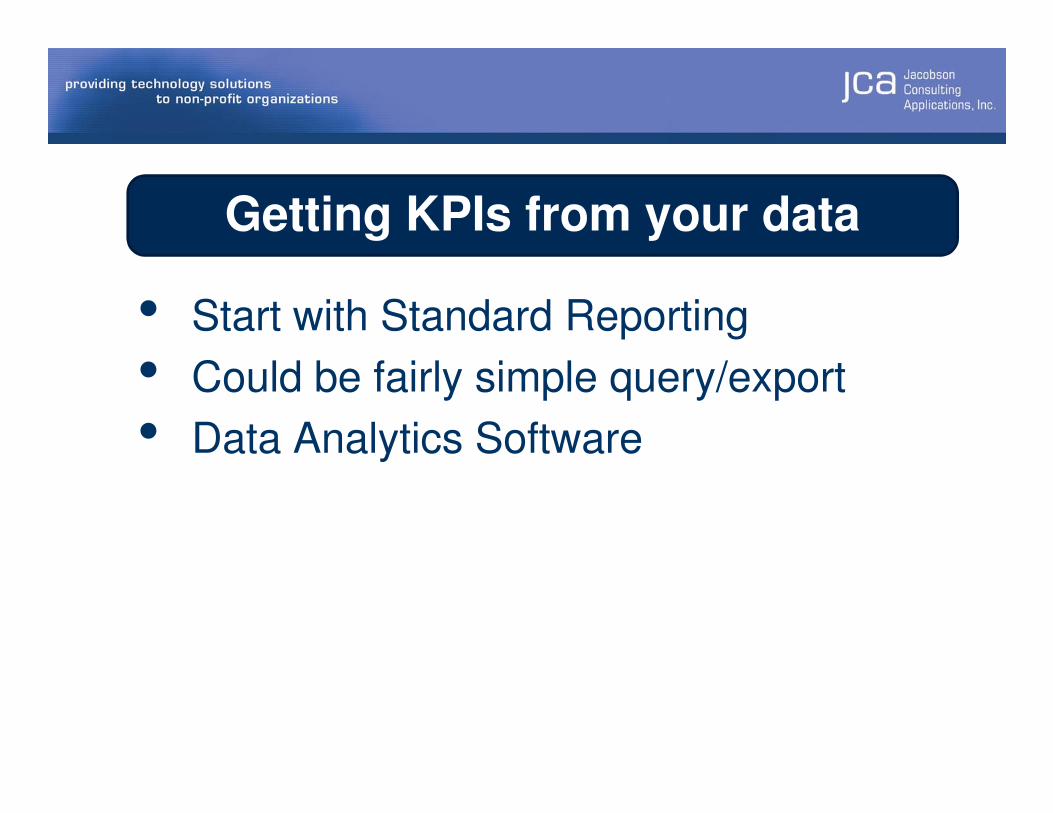
Getting KPIs from your data
• Start with Standard Reporting
• Could be fairly simple query/export
•• Data Analytics Software
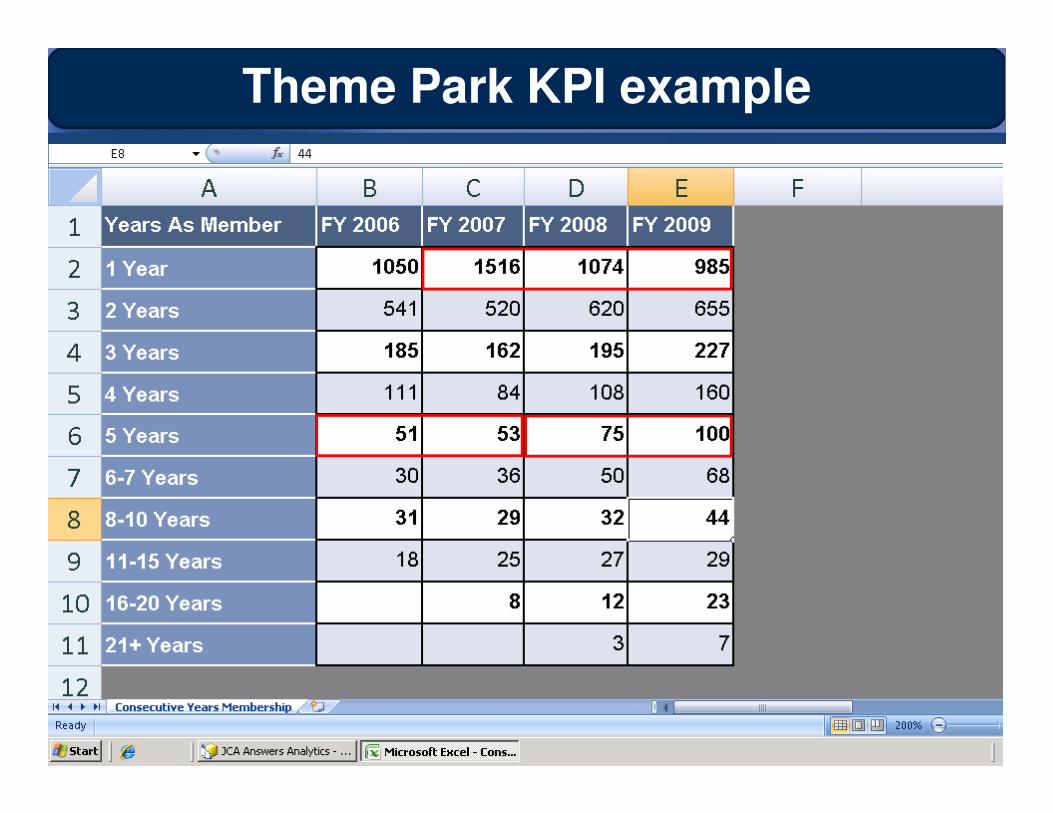
Theme Park KPI example

Make It Reusable
• Regardless of the Tool, try to make it reusable
� Microsoft Reporting Services
� Crystal Reports� Crystal Reports
� Excel / ODBC
�Analytics software
Tracking the Objectives
• Dashboard or Scorecard
� Custom Report
� Excel�
� Dashboard Tool
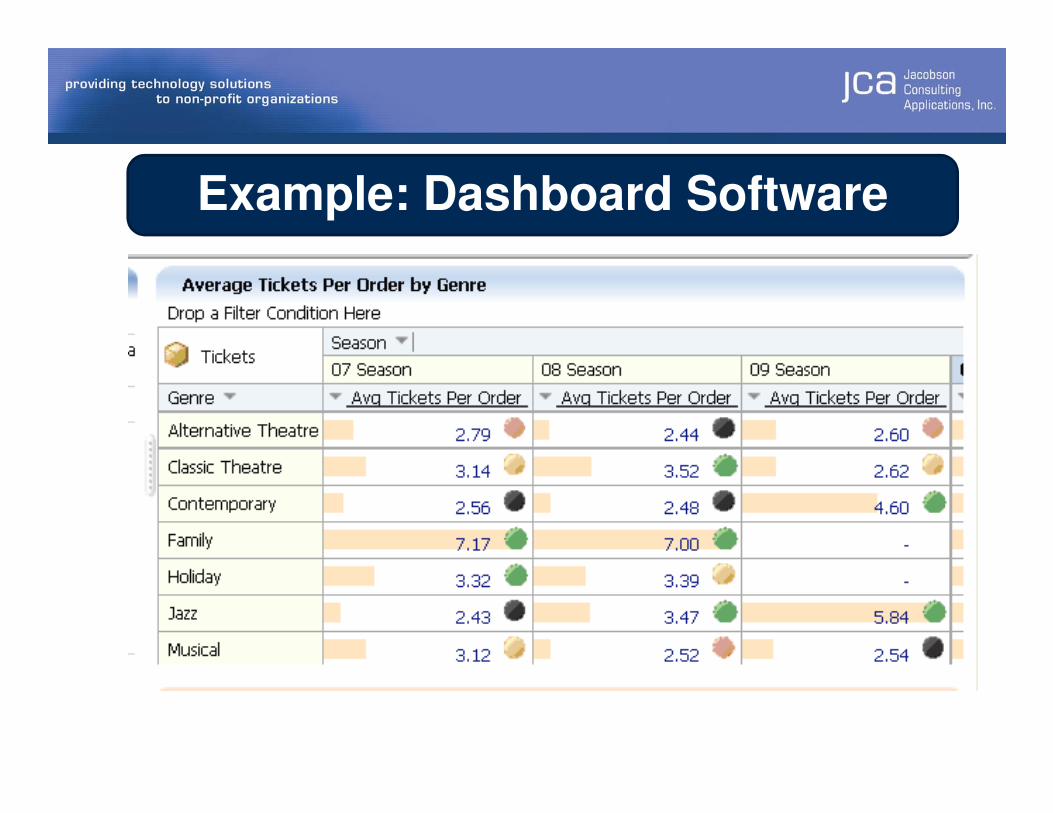
Example: Dashboard Software
Recap
• You have a world of information at your fingertips
• Now more than ever, you need to make the most of it
• Before you can really use it, you need your strategy• Before you can really use it, you need your strategy
• Once you have strategy you can develop objectives
• Once you have objectives you can use your information
Thank You!
Presented by
Steve JacobsonSteve Jacobson
President and CEO
Jacobson Consulting Applications, Inc.
November 16, 2009
©2008 Lodermeier & Montei Design