Embed Size (px)
Citation preview
Methods of Thermal Analysis
Michael Feist
Berlin Humboldt University, Institute of Chemistry
1. Conventional Thermal Analysis
2. Simultaneous Thermal Analysis
3. Hyphenated techniques in Thermal Analysis (EGA)
4. PulseTA® and catalysis
5. Determination of other thermal properties
1. Conventional Thermal Analysis
History
Cooling curves
The phase rule
Measuring principles of DTA and DSC
Information content
Sample carriers
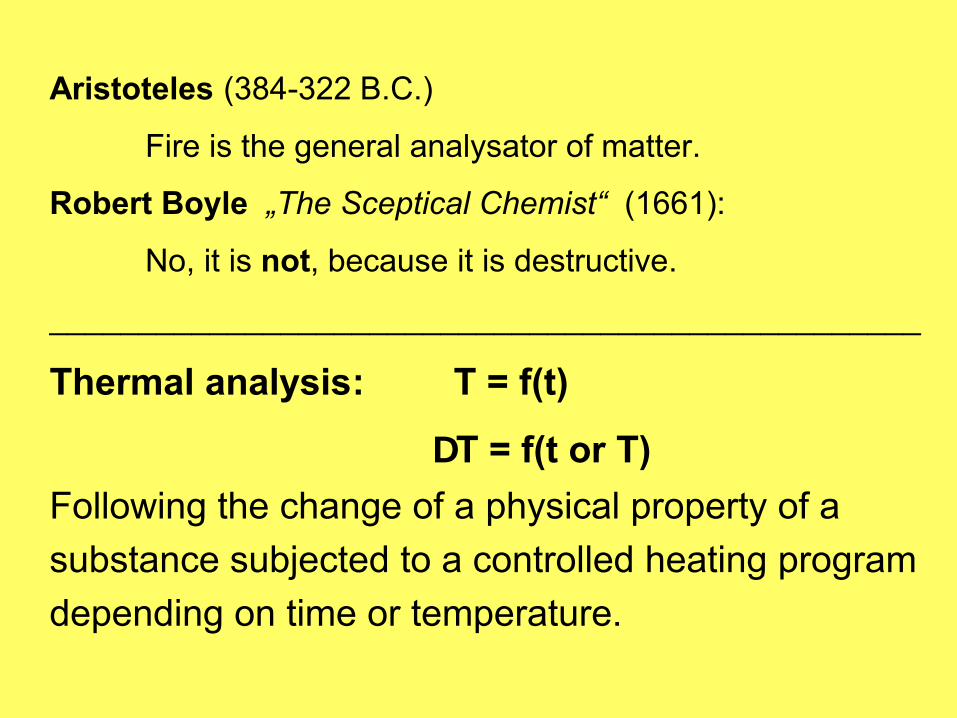
Aristoteles (384-322 B.C.)
Fire is the general analysator of matter.
Robert Boyle „The Sceptical Chemist“ (1661):
No, it is not, because it is destructive.
_________________________________________________
Thermal analysis: T = f(t)
∆T = f(t or T)Following the change of a physical property of asubstance subjected to a controlled heating programdepending on time or temperature.
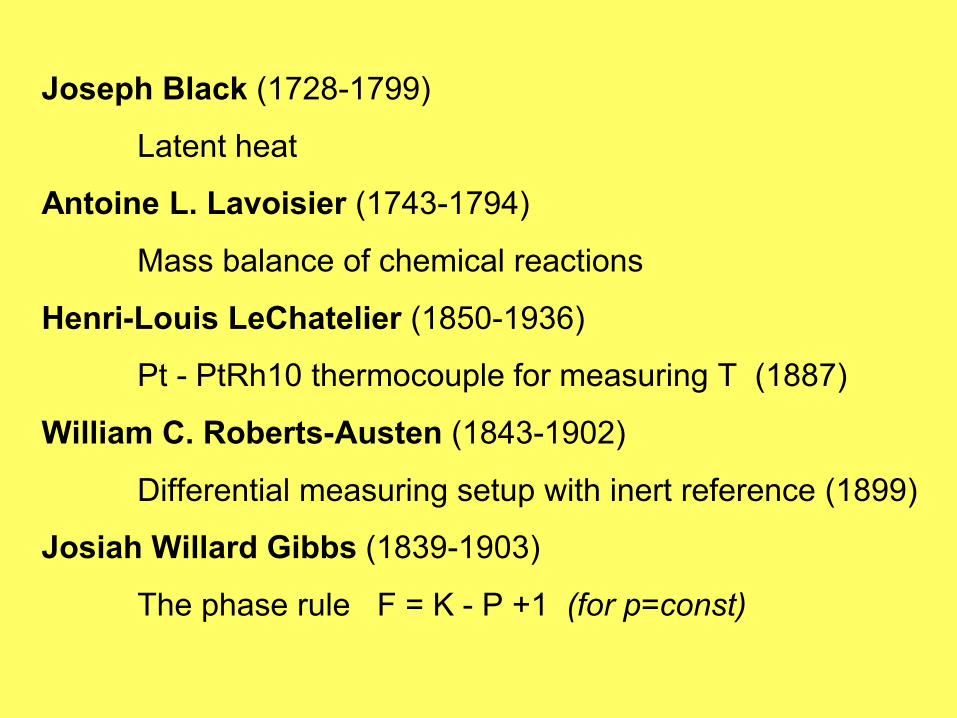
Joseph Black (1728-1799)
Latent heat
Antoine L. Lavoisier (1743-1794)
Mass balance of chemical reactions
Henri-Louis LeChatelier (1850-1936)
Pt - PtRh10 thermocouple for measuring T (1887)
William C. Roberts-Austen (1843-1902)
Differential measuring setup with inert reference (1899)
Josiah Willard Gibbs (1839-1903)
The phase rule F = K - P +1 (for p=const)
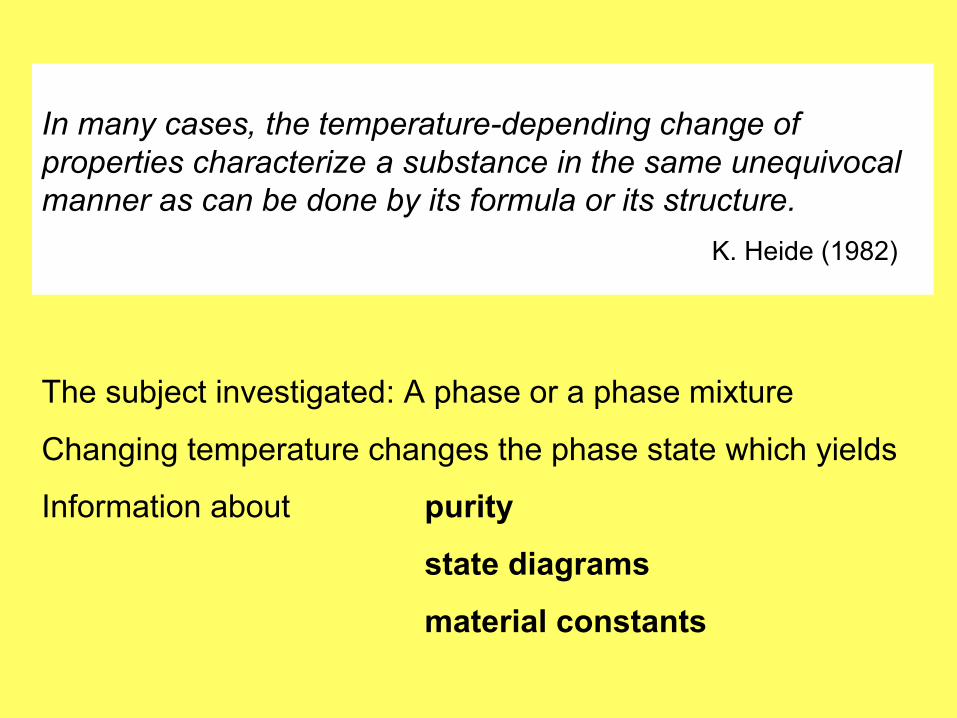
In many cases, the temperature-depending change of properties characterize a substance in the same unequivocal manner as can be done by its formula or its structure.
K. Heide (1982)
The subject investigated: A phase or a phase mixture
Changing temperature changes the phase state which yields
Information about purity
state diagrams
material constants
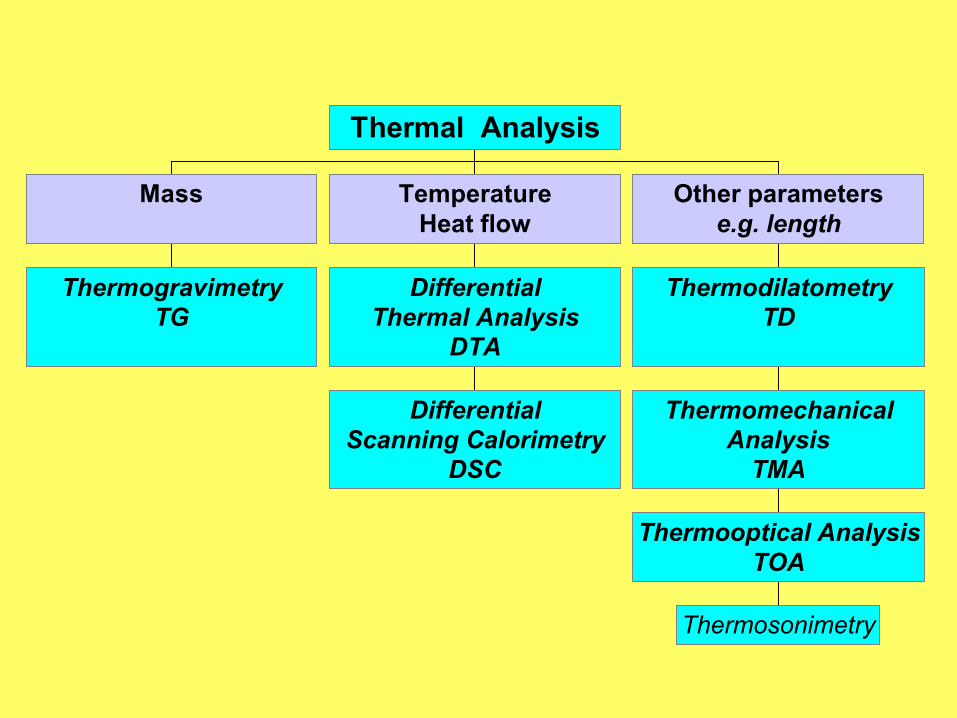
ThermogravimetryTG
Mass
DifferentialScanning Calorimetry
DSC
DifferentialThermal Analysis
DTA
TemperatureHeat flow
Thermosonimetry
Thermooptical AnalysisTOA
ThermomechanicalAnalysis
TMA
ThermodilatometryTD
Other parameterse.g. length
Thermal Analysis
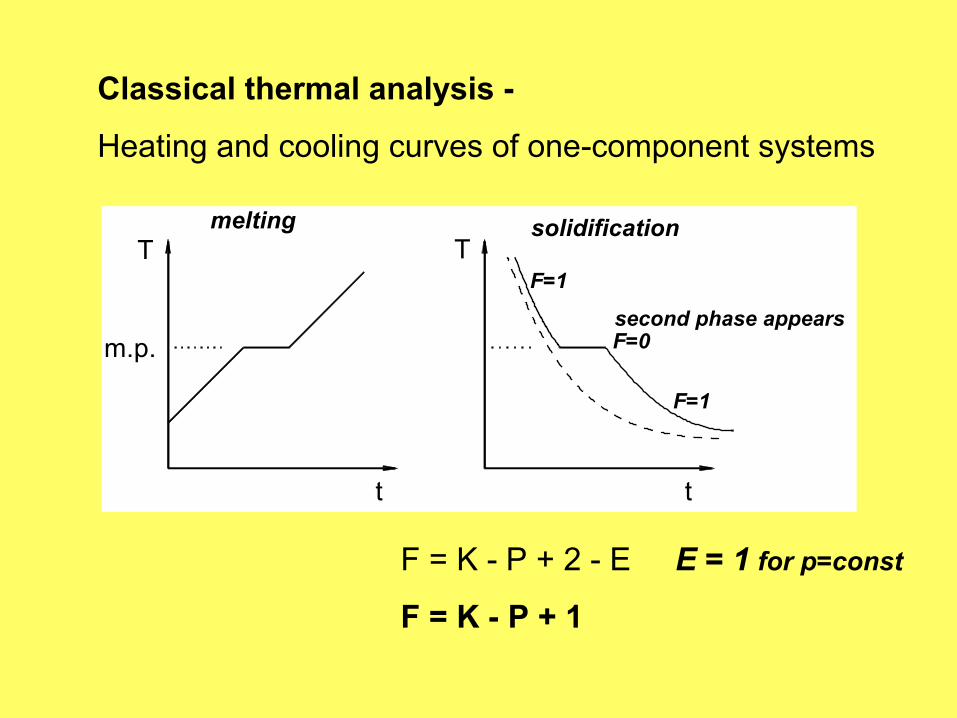
Classical thermal analysis -
Heating and cooling curves of one-component systems
T T
t t
m.p.
melting solidification
F=1
F=0
F=1
second phase appears
F = K - P + 2 - E E = 1 for p=const
F = K - P + 1
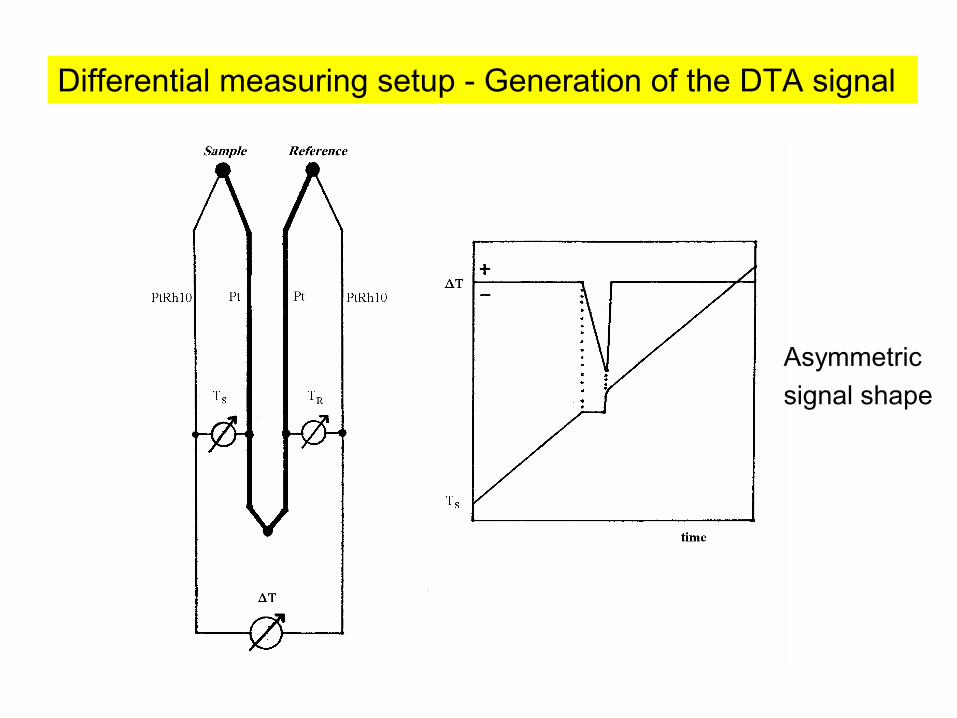
Differential measuring setup - Generation of the DTA signal
Asymmetricsignal shape
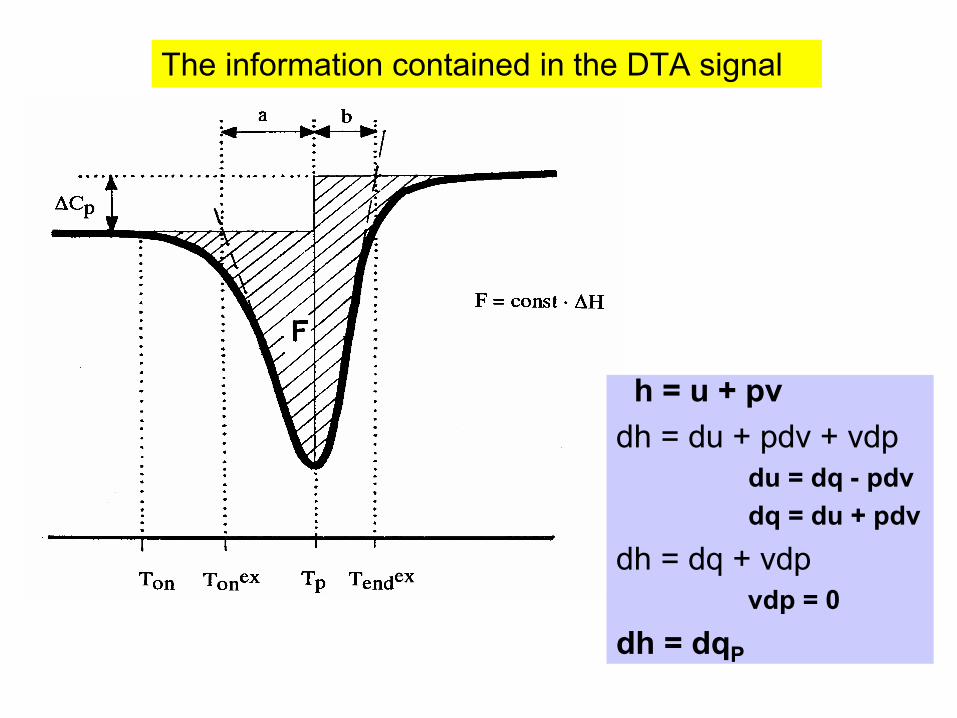
The information contained in the DTA signal
h = u + pvdh = du + pdv + vdp
du = dq - pdvdq = du + pdv
dh = dq + vdpvdp = 0
dh = dqP
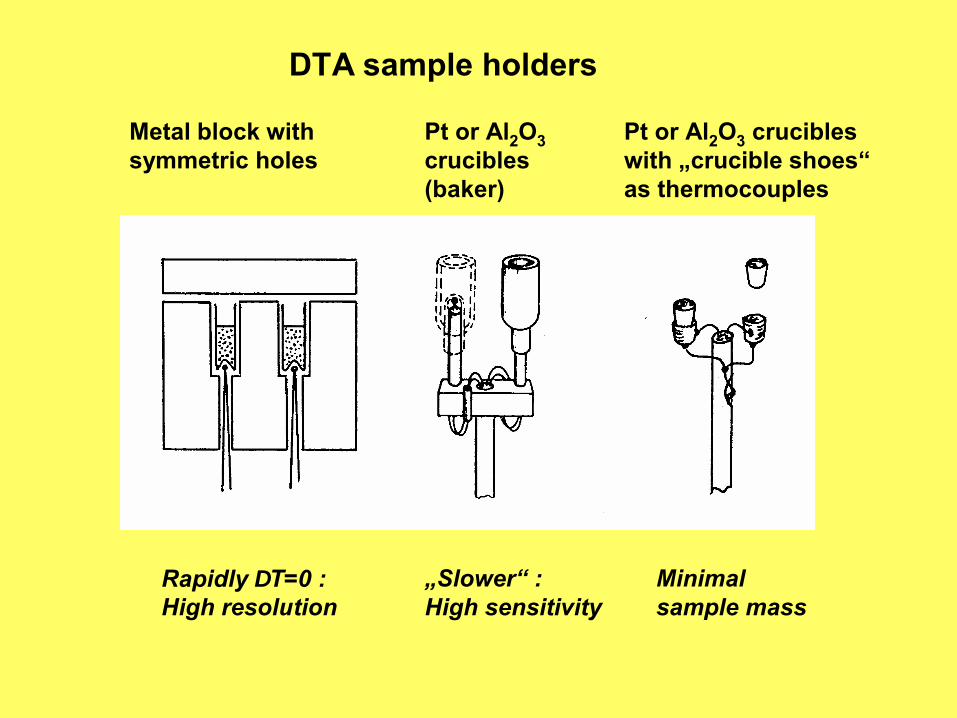
DTA sample holders
Pt or Al2O3crucibles (baker)
Metal block with symmetric holes
Pt or Al2O3 crucibles with „crucible shoes“ as thermocouples
Rapidly ∆T=0 :High resolution
„Slower“ :High sensitivity
Minimal sample mass
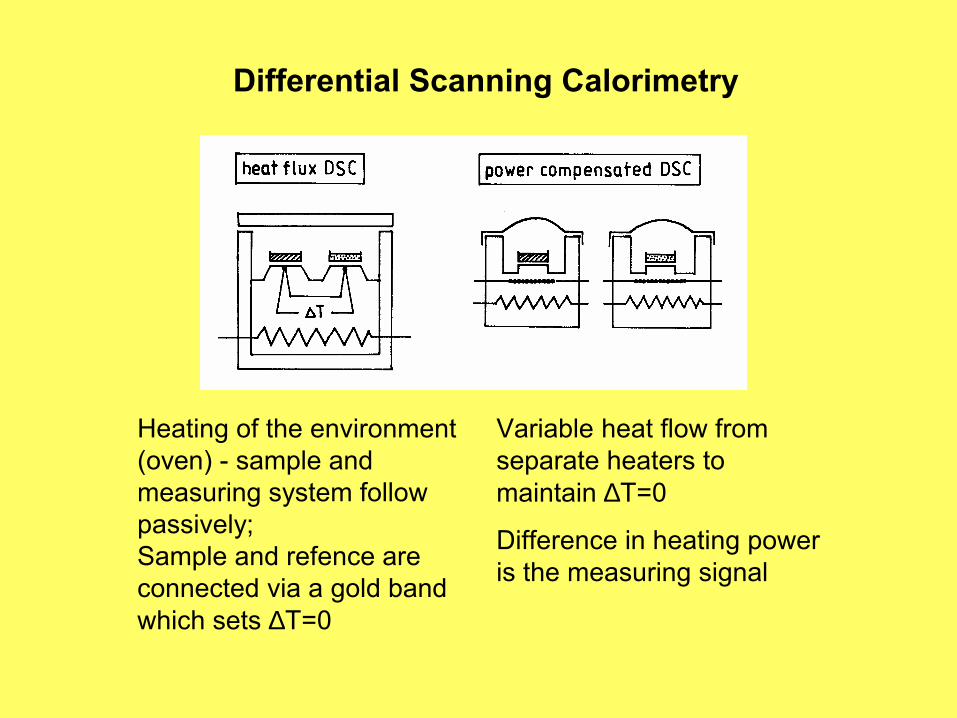
Heating of the environment(oven) - sample and measuring system follow passively; Sample and refence areconnected via a gold band which sets ∆T=0
Variable heat flow from separate heaters to maintain ∆T=0
Difference in heating power is the measuring signal
Differential Scanning Calorimetry
2. Simultaneous Thermal Analysis
Heating and cooling (CsFeF4 ·2 H2O)
Repeated heating runs (NaClO4 · H2O)
Gas changes (Coal)
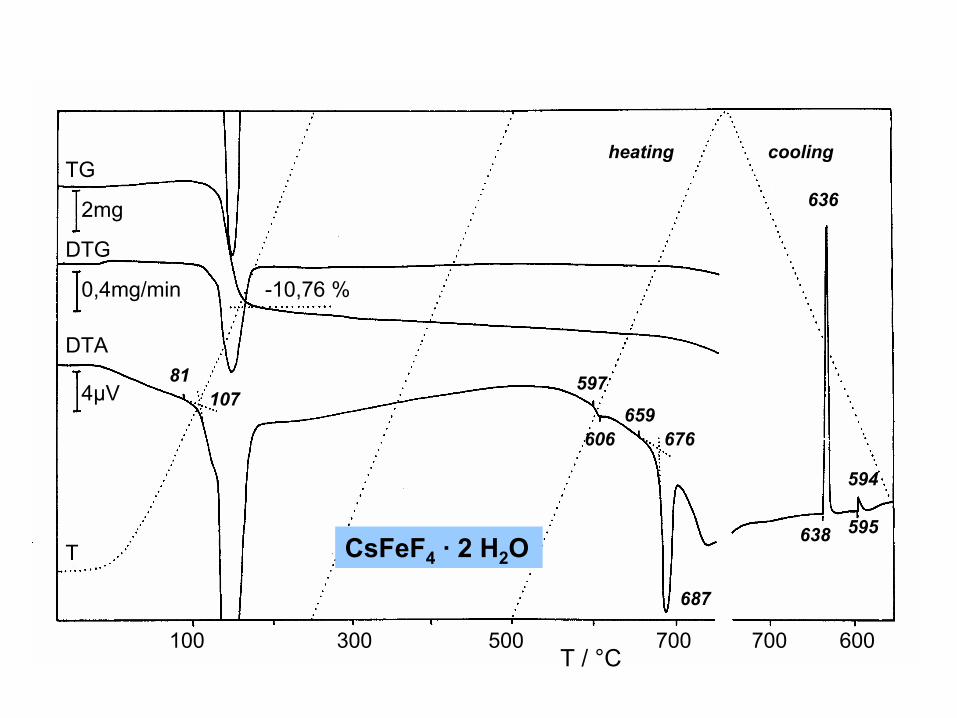
TG
DTG
DTA
2mg
0,4mg/min
4µV
T
-10,76 %
81107
597
606659
676
687
636
638 595
594
100 300 500 700 700 600T / °C
heating cooling
CsFeF4 · 2 H2O
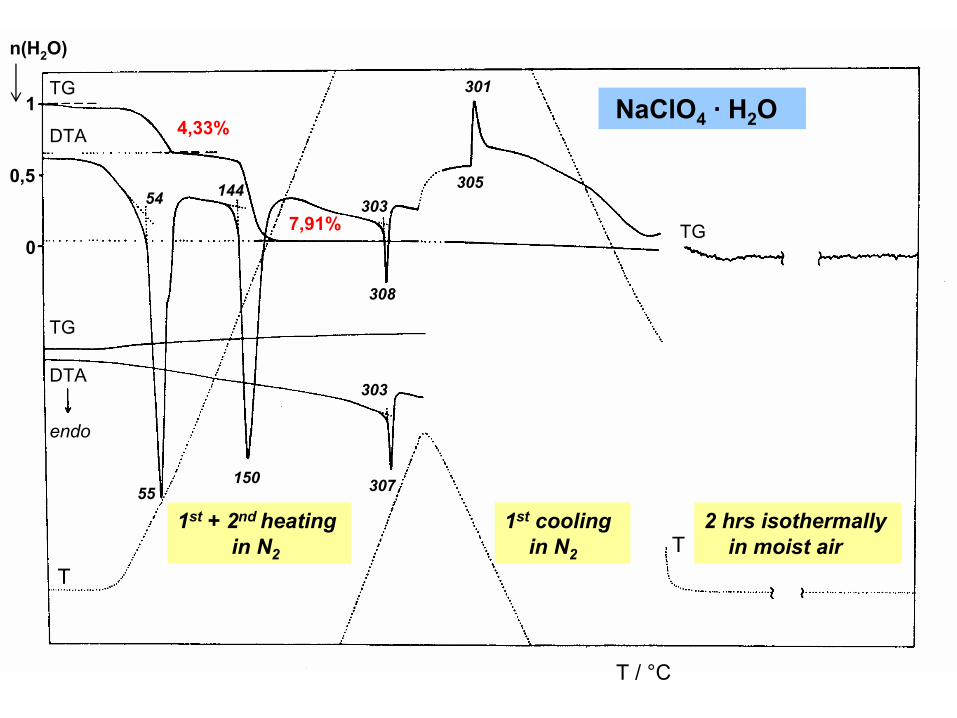
301
54
55150
308
307
303
303305144
4,33%
7,91%
TG
DTA
DTA
TG
n(H2O)
1
0,5
0
1st + 2nd heatingin N2
1st coolingin N2
2 hrs isothermallyin moist air
T
endo
T
TG
NaClO4 · H2O
T / °C
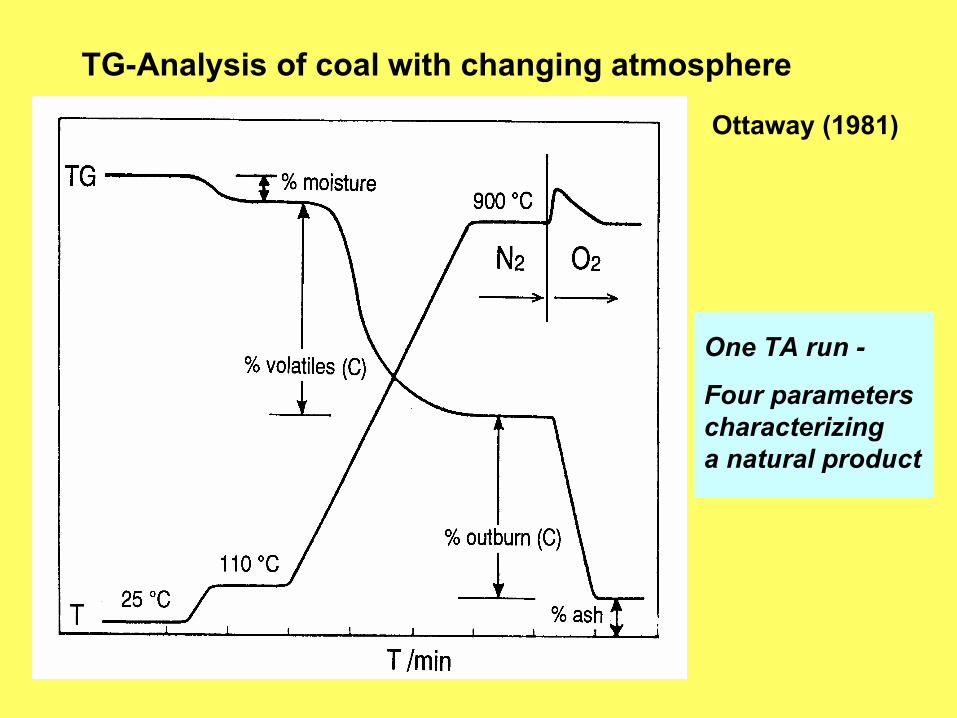
TG-Analysis of coal with changing atmosphere
One TA run -
Four parameterscharacterizinga natural product
Ottaway (1981)
S
SS
O OO
O
O
O
O NN+
N–
N+N
–N
NN+
N–hν, ∆
- 3 N2
S
SS
O OO
O
O
O
O N
N
N
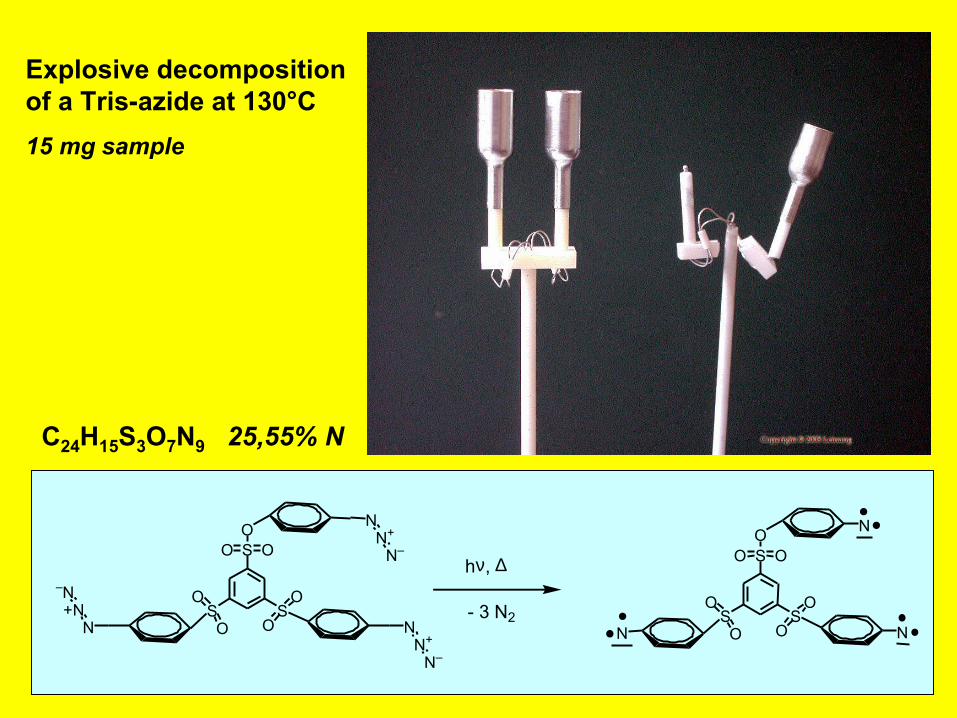
Explosive decompositionof a Tris-azide at 130°C15 mg sample
C24H15S3O7N9 25,55% N
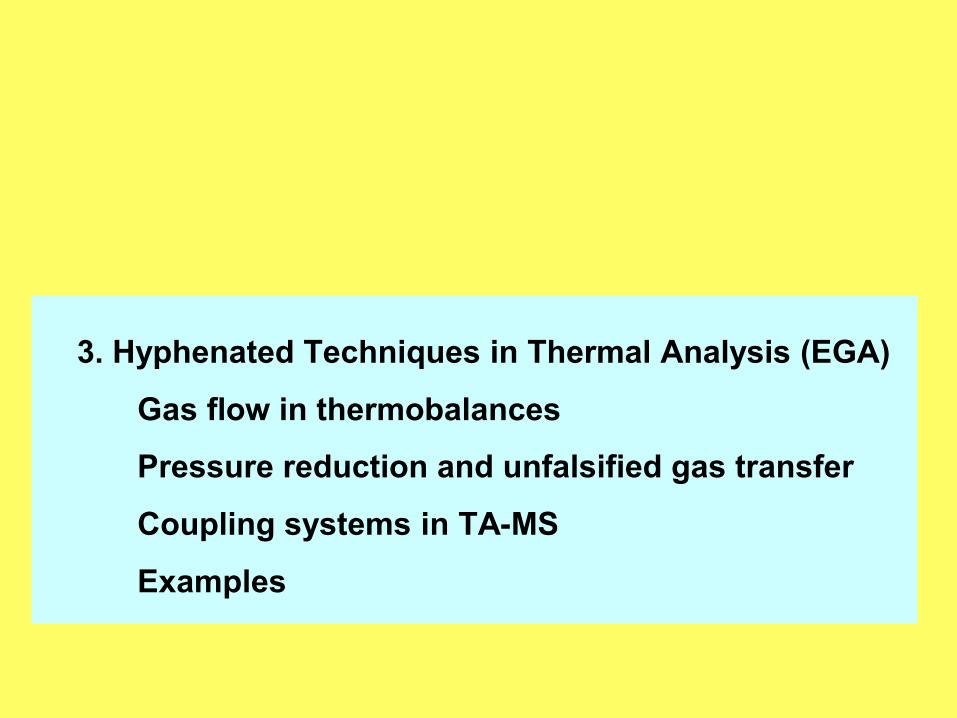
3. Hyphenated Techniques in Thermal Analysis (EGA)
Gas flow in thermobalances
Pressure reduction and unfalsified gas transfer
Coupling systems in TA-MS
Examples
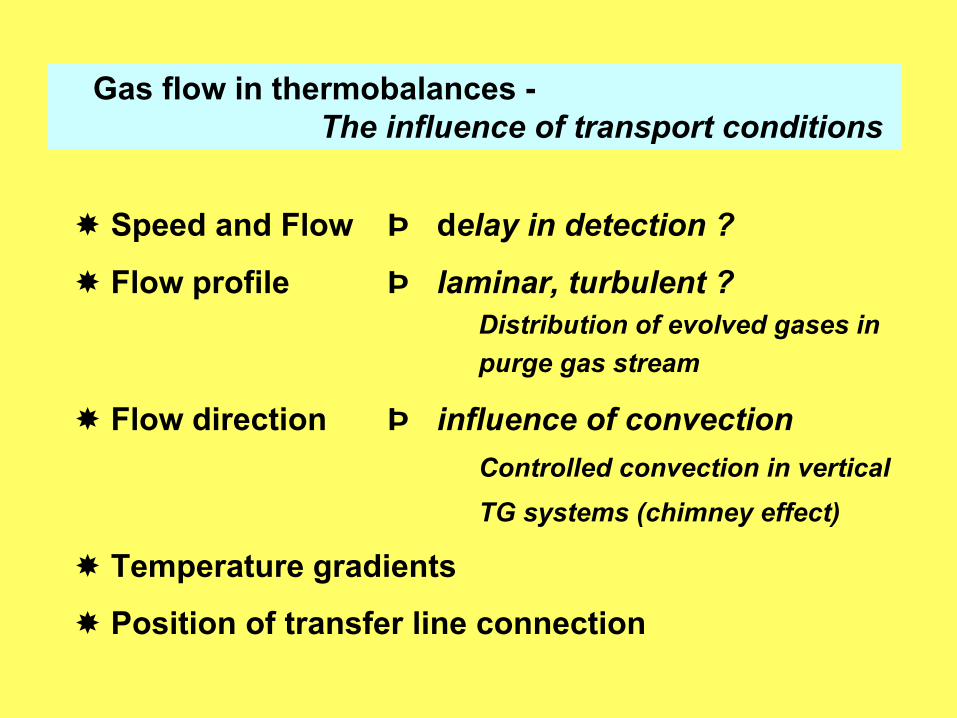
Speed and Flow ⇒ delay in detection ?
Flow profile ⇒ laminar, turbulent ?Distribution of evolved gases inpurge gas stream
Flow direction ⇒ influence of convectionControlled convection in verticalTG systems (chimney effect)
Temperature gradients
Position of transfer line connection
Gas flow in thermobalances -The influence of transport conditions
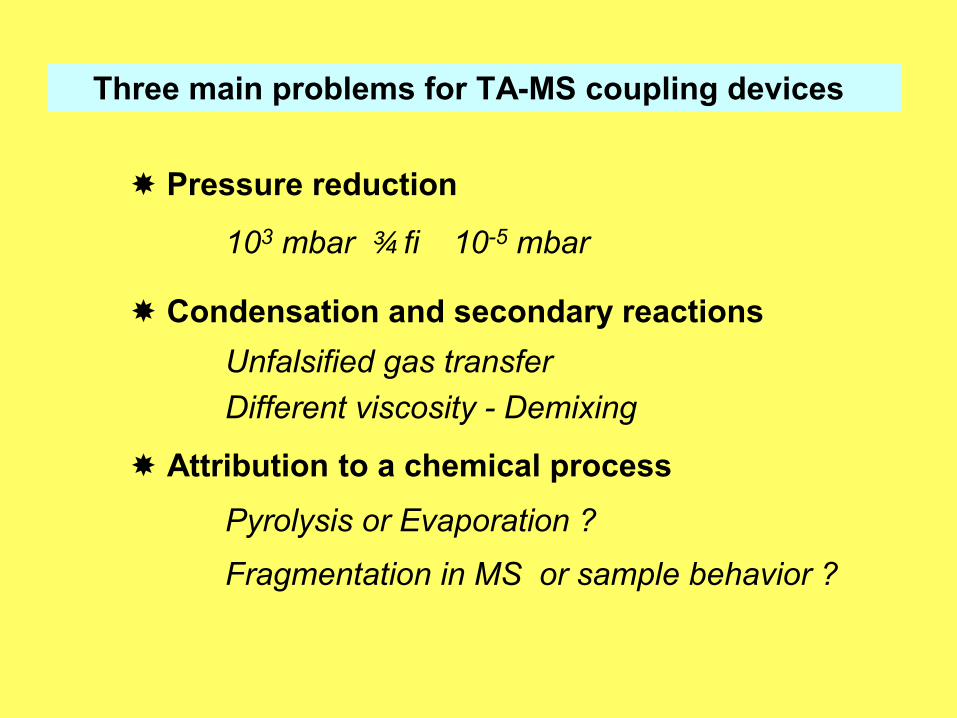
Pressure reduction
103 mbar → 10-5 mbar
Condensation and secondary reactionsUnfalsified gas transferDifferent viscosity - Demixing
Attribution to a chemical processPyrolysis or Evaporation ?
Fragmentation in MS or sample behavior ?
Three main problems for TA-MS coupling devices
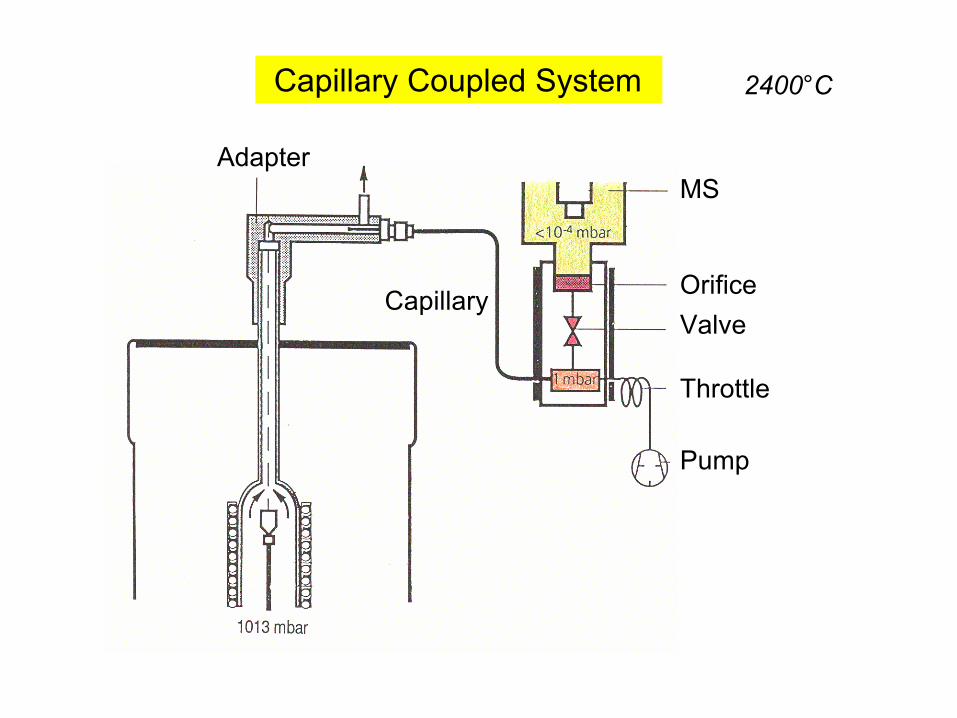
OrificeValve
Throttle
Pump
Capillary
AdapterMS
Capillary Coupled System 2400°C
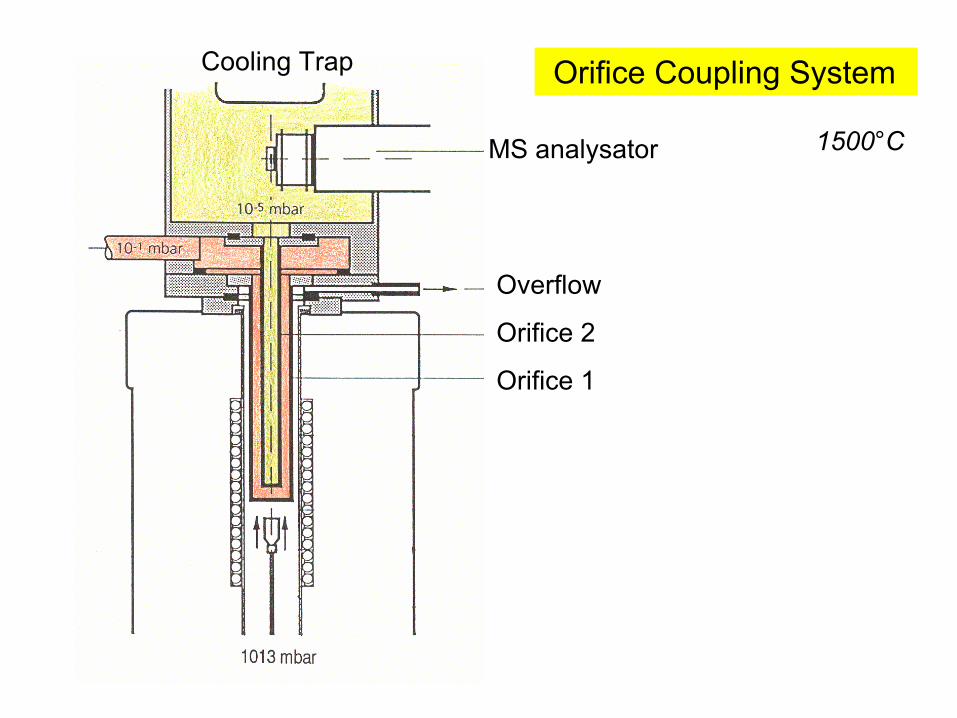
MS analysator
Overflow
Orifice 2
Orifice 1
Cooling Trap Orifice Coupling System
1500°C
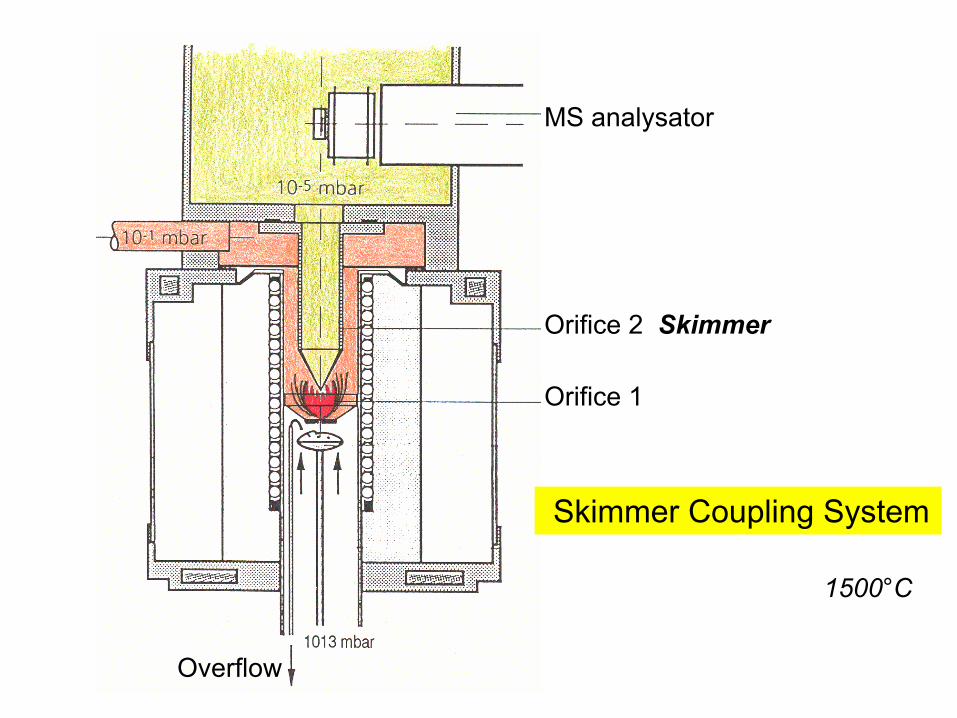
MS analysator
Orifice 2 Skimmer
Orifice 1
Skimmer Coupling System
Overflow
1500°C
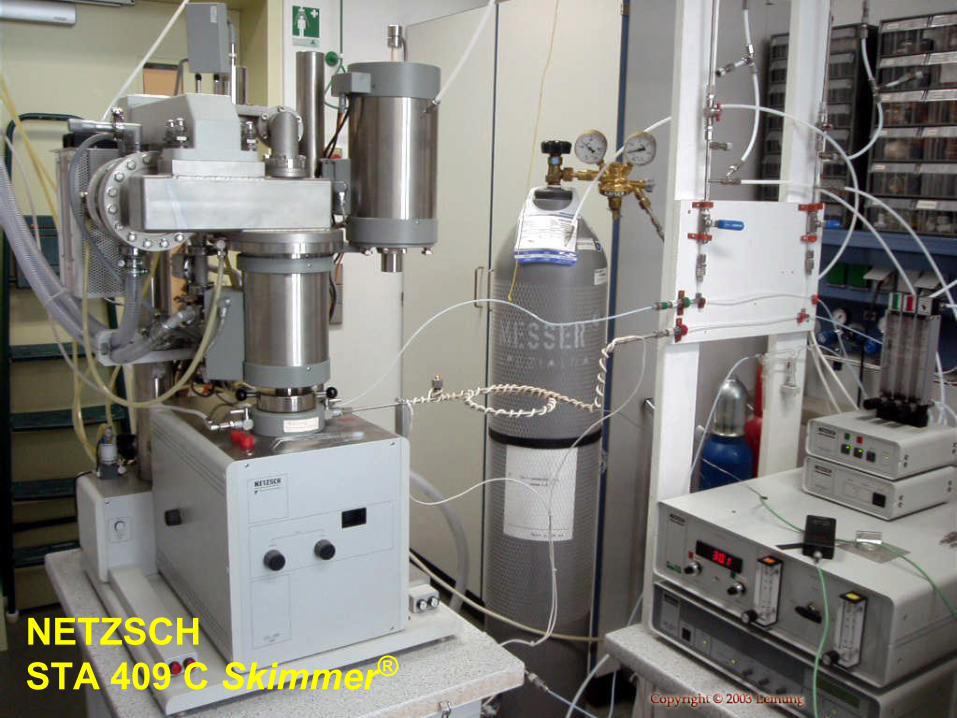
NETZSCHSTA 409 C Skimmer®
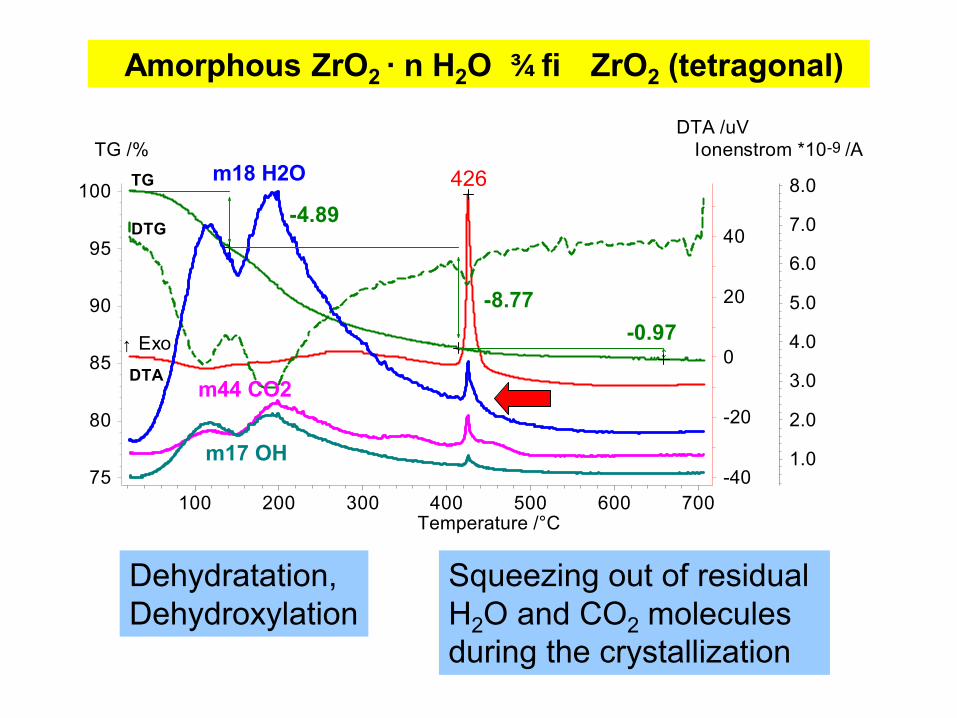
Amorphous ZrO2 · n H2O → ZrO2 (tetragonal)
-40
-20
0
20
40
DTA /uV
75
80
85
90
95
100
TG /%
100 200 300 400 500 600 700Temperature /°C
1.0
2.0
3.0
4.0
5.0
6.0
7.0
8.0
Ionenstrom *10-9 /Am18 H2O
m44 CO2
m17 OH
TG
DTG
DTA
-4.89
-8.77-0.97
426
↑ Exo
Dehydratation,Dehydroxylation
Squeezing out of residualH2O and CO2 moleculesduring the crystallization
0
0.2
0.4
0.6
0.8
1.0
Ionenstrom *10 -9 /A
50 100 150 200 250Temperatur /°C
60.0
65.0
70.0
75.0
80.0
85.0
90.0
95.0
100.0
TG /%
m18
m28
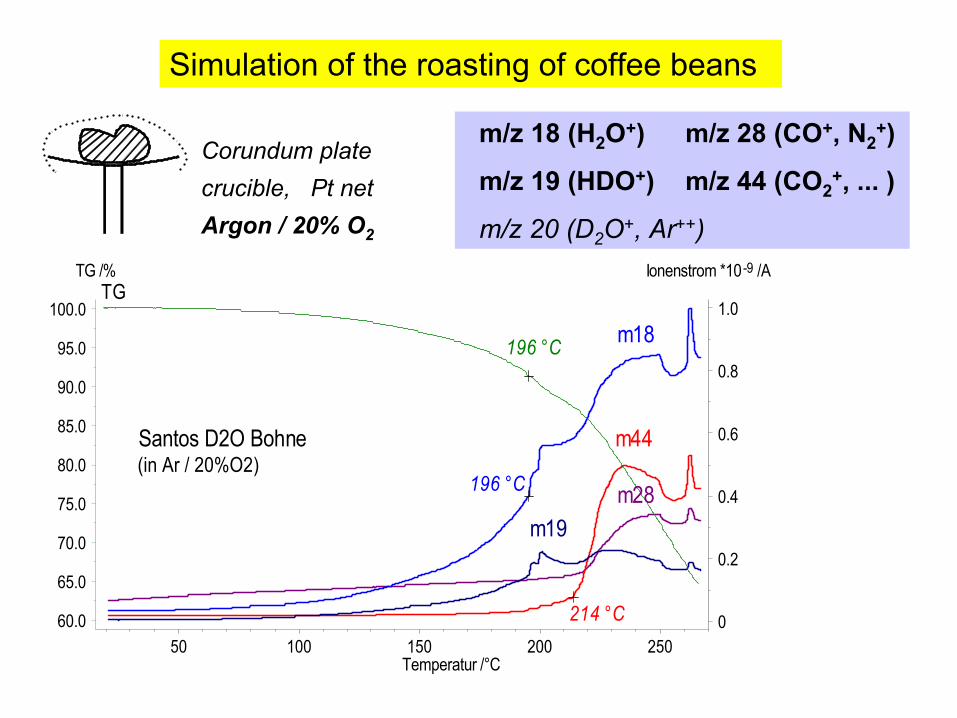
Santos D2O Bohne(in Ar / 20%O2)
m44
m19
TG
196 °C
196 °C
214 °C
Simulation of the roasting of coffee beans
Corundum platecrucible, Pt netArgon / 20% O2
m/z 18 (H2O+) m/z 28 (CO+, N2+)
m/z 19 (HDO+) m/z 44 (CO2+, ... )
m/z 20 (D2O+, Ar++)
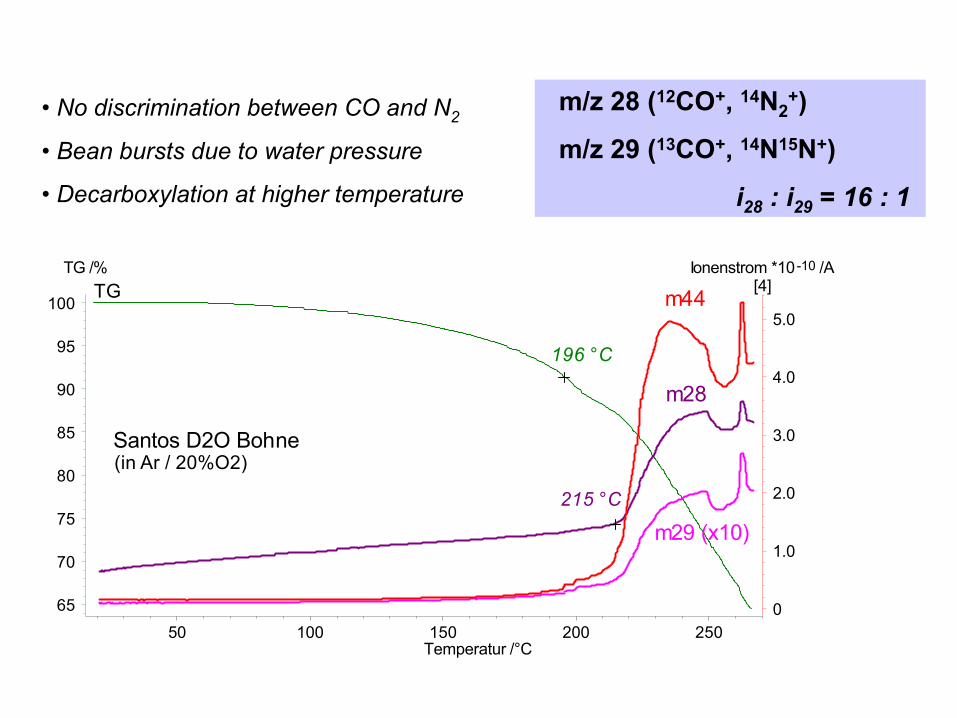
m/z 28 (12CO+, 14N2+)
m/z 29 (13CO+, 14N15N+)
i28 : i29 = 16 : 1
65
70
75
80
85
90
95
100
TG /%
50 100 150 200 250Temperatur /°C
0
1.0
2.0
3.0
4.0
5.0
[4]Ionenstrom *10 -10 /A
m28
m29 (x10)
Santos D2O Bohne(in Ar / 20%O2)
m44TG
196 °C
215 °C
• No discrimination between CO and N2
• Bean bursts due to water pressure
• Decarboxylation at higher temperature
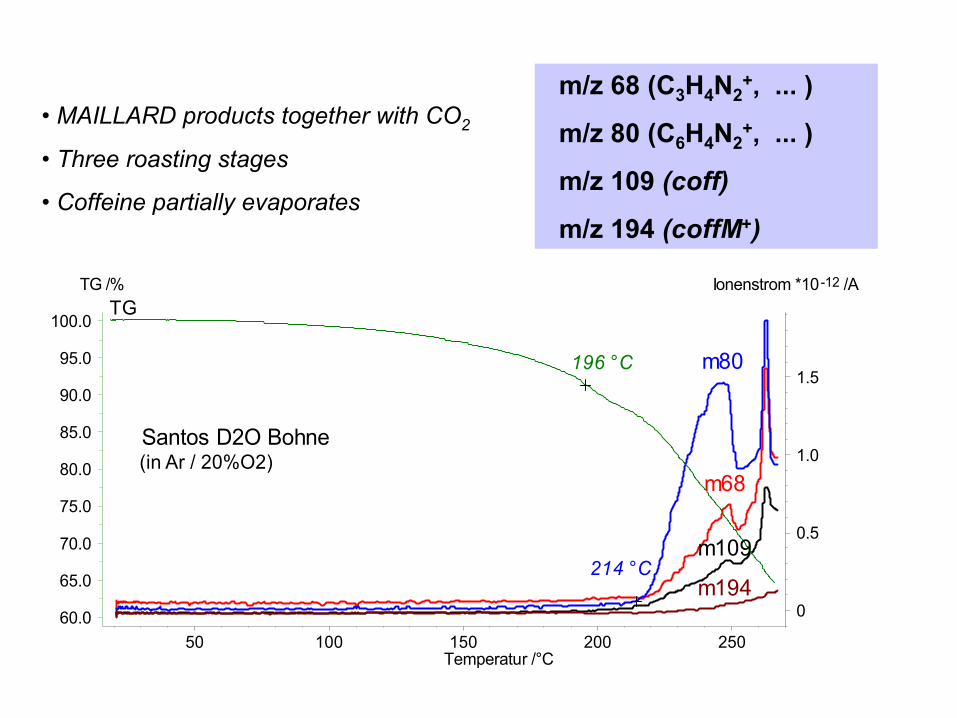
m/z 68 (C3H4N2+, ... )
m/z 80 (C6H4N2+, ... )
m/z 109 (coff)
m/z 194 (coffM+)
• MAILLARD products together with CO2
• Three roasting stages
• Coffeine partially evaporates
0
0.5
1.0
1.5
Ionenstrom *10 -12 /A
50 100 150 200 250Temperatur /°C
60.0
65.0
70.0
75.0
80.0
85.0
90.0
95.0
100.0
TG /%
Santos D2O Bohne(in Ar / 20%O2)
m80
m68
m109
m194
TG
196 °C
214 °C
4. Pulse Thermal Analysis® and Catalysis
Quantitative evaluation of MS or FT-IR signals
Taylor made redox catalysts
Applications
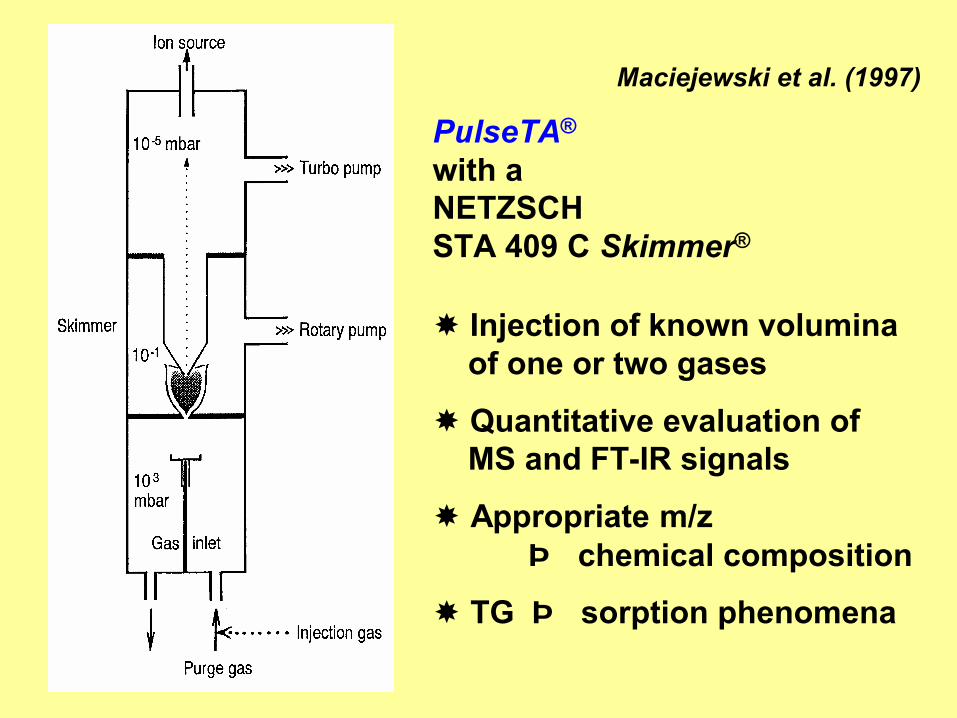
Maciejewski et al. (1997)
PulseTA®
with aNETZSCHSTA 409 C Skimmer®
Injection of known voluminaof one or two gases
Quantitative evaluation ofMS and FT-IR signals
Appropriate m/z⇒ chemical composition
TG ⇒ sorption phenomena
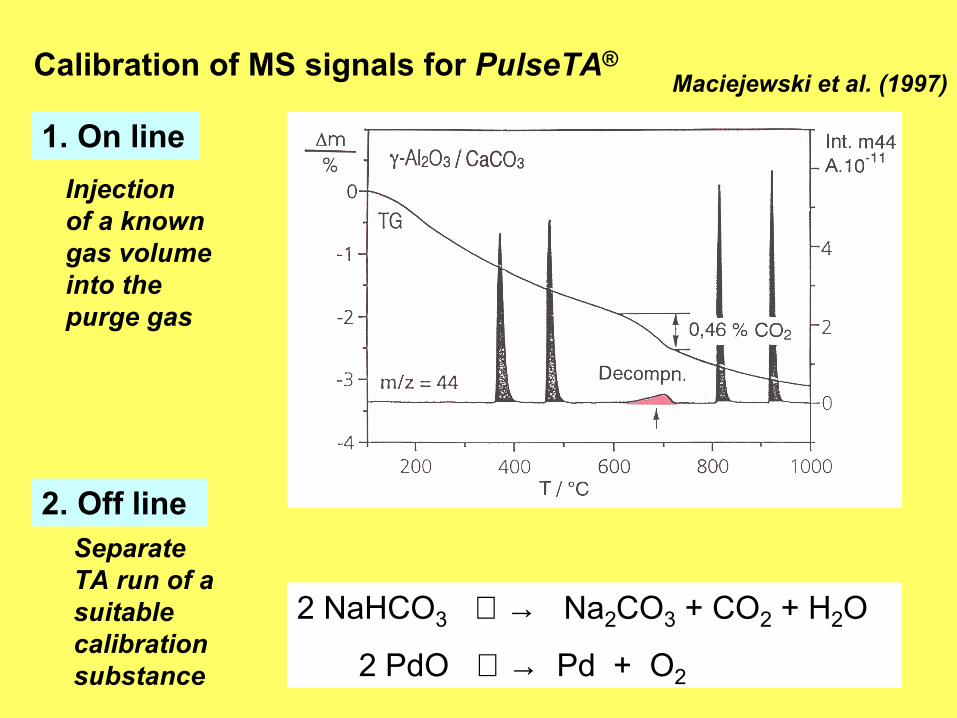
Calibration of MS signals for PulseTA®Maciejewski et al. (1997)
1. On line
2 NaHCO3 → Na2CO3 + CO2 + H2O
2 PdO → Pd + O2
2. Off line
Injectionof a known gas volume into the purge gas
SeparateTA run of a suitable calibration substance
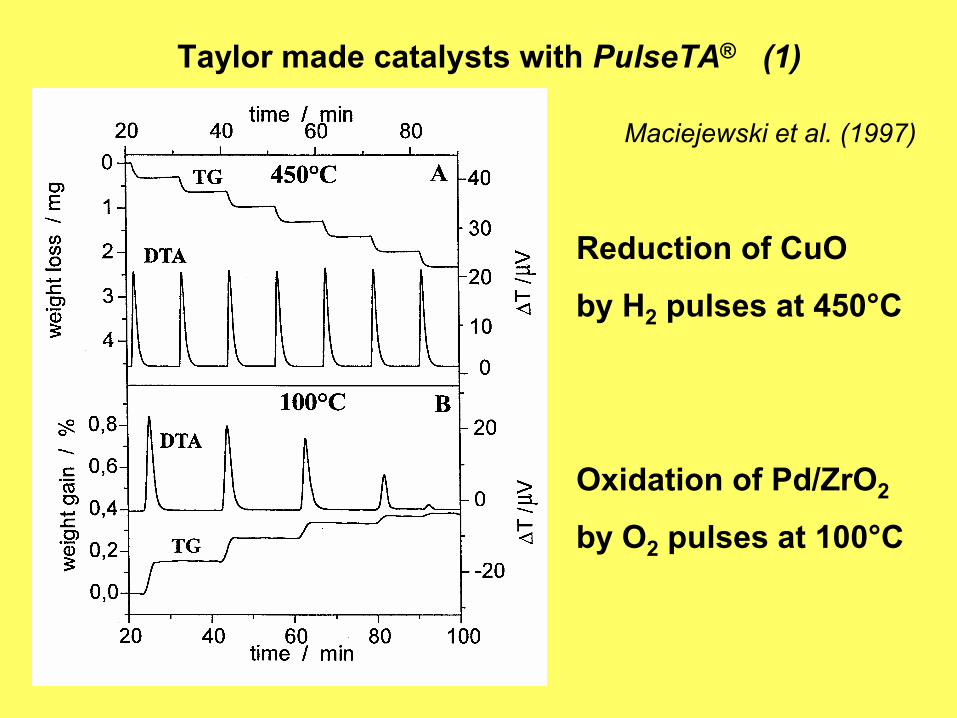
Taylor made catalysts with PulseTA® (1)
Maciejewski et al. (1997)
Reduction of CuO
by H2 pulses at 450°C
Oxidation of Pd/ZrO2
by O2 pulses at 100°C
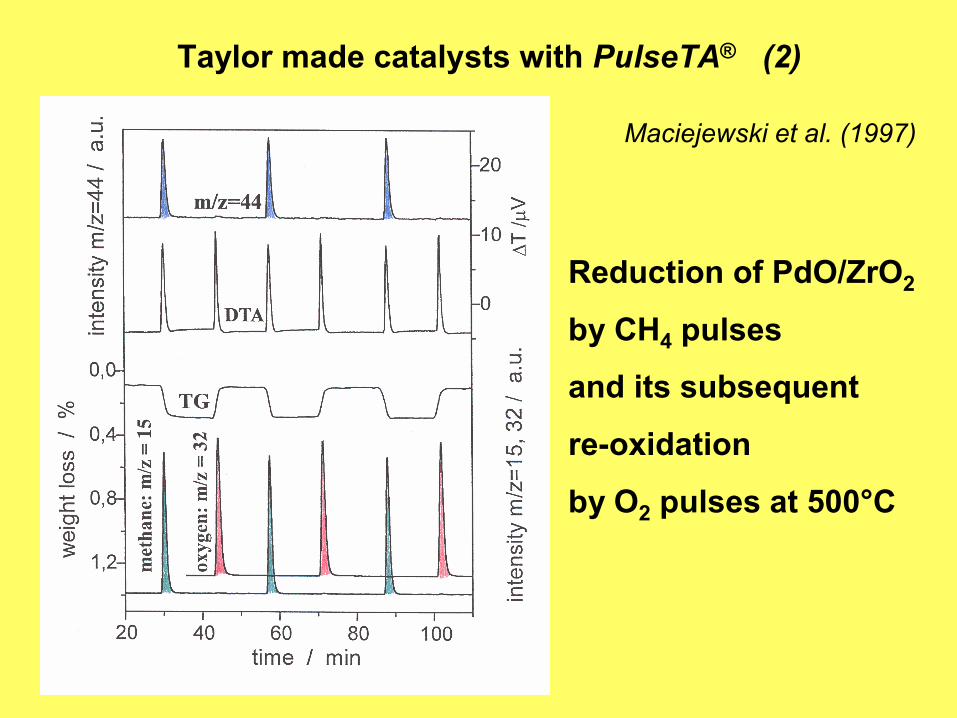
Taylor made catalysts with PulseTA® (2)
Maciejewski et al. (1997)
Reduction of PdO/ZrO2
by CH4 pulses
and its subsequent
re-oxidation
by O2 pulses at 500°C
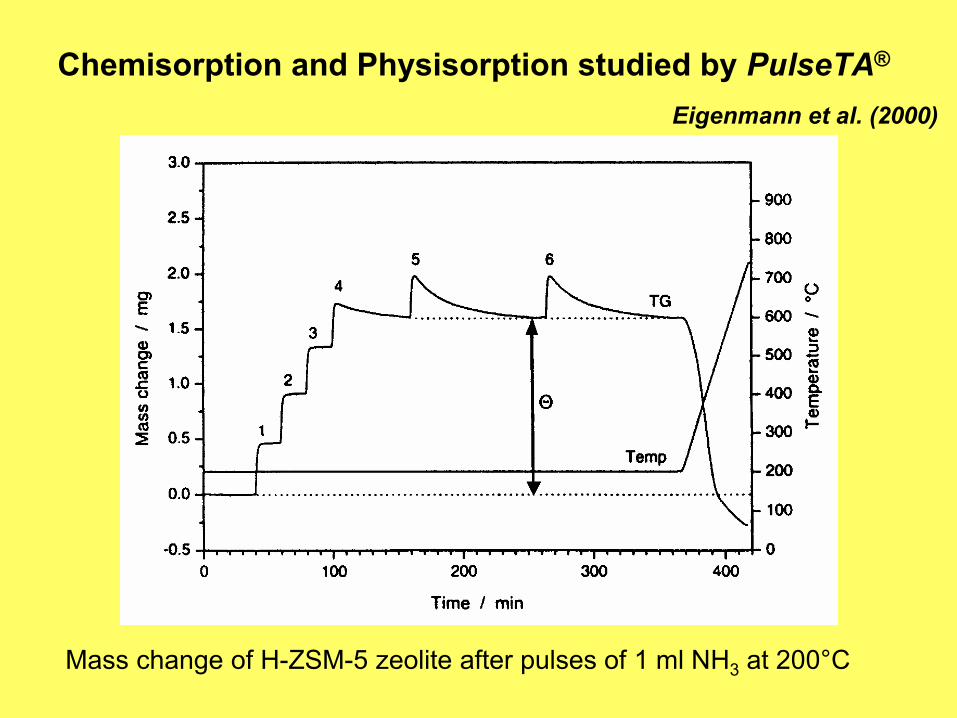
Mass change of H-ZSM-5 zeolite after pulses of 1 ml NH3 at 200°C
Chemisorption and Physisorption studied by PulseTA®
Eigenmann et al. (2000)
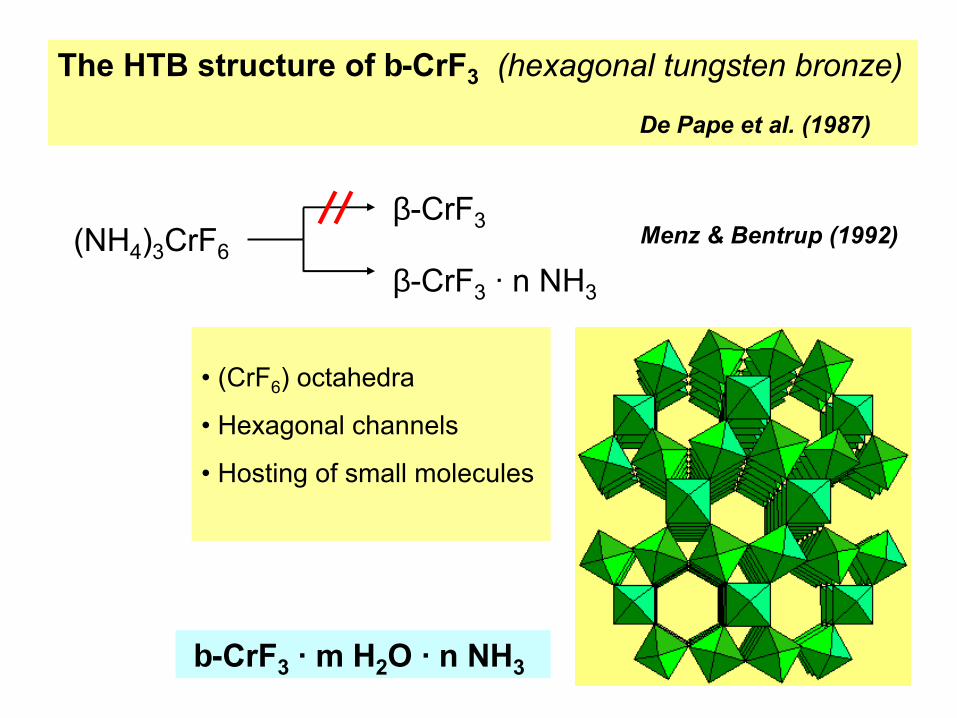
The HTB structure of β-CrF3 (hexagonal tungsten bronze)
De Pape et al. (1987)
• (CrF6) octahedra
• Hexagonal channels
• Hosting of small molecules
(NH4)3CrF6β-CrF3 · n NH3
β-CrF3 Menz & Bentrup (1992)
β-CrF3 · m H2O · n NH3
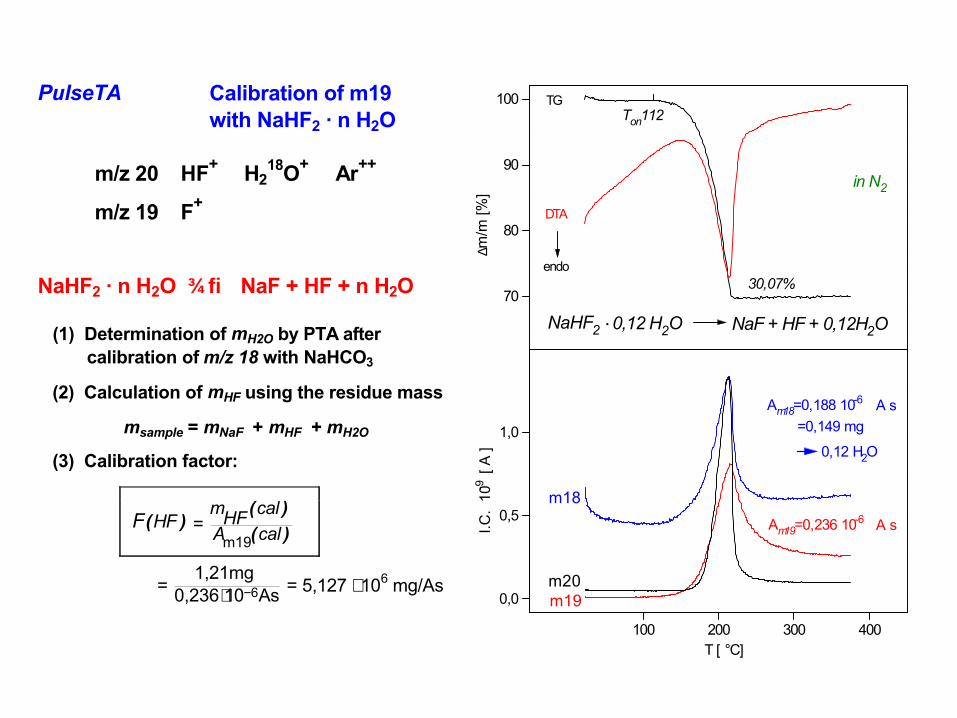
PulseTA Calibration of m19with NaHF2 · n H2O
m/z 20 HF+ H218O+ Ar++
m/z 19 F+
NaHF2 · n H2O → NaF + HF + n H2O
(1) Determination of mH2O by PTA after calibration of m/z 18 with NaHCO3
(2) Calculation of mHF using the residue mass
msample = mNaF + mHF + mH2O
(3) Calibration factor:
= 1,21mg
0,236 10 As6⋅ − = 5,127 ⋅ 106 mg/As
F HF( ) = mHF calA cal
( )( )m19
100 200 300 400
0,0
0,5
1,00,12 H2O
=0,149 mgA sAm18=0,188 10-6
A sAm19=0,236 10-6
I.C.
10-9 [
A ]
T [ °C]
70
80
90
100
in N2
NaF + HF + 0,12H2O
Ton112
endo
.0,12 H2ONaHF2
30,07%
DTA
TG
∆m/m
[%]
m20m19
m18
100 200 300 400 500 600 700
0
1
2
3
I.C. [
10 -9 A
]
T [ °C]
92
94
96
98
100
0,05 H2O .
DTG
endo
599
Te 593
. 0,06 NH3β-CrF3
0,27mg
1,25mg
0.40mgDTA
TG
∆m/m
[%]
1,22mg
0,10mg0,21mg
151917
18
5x
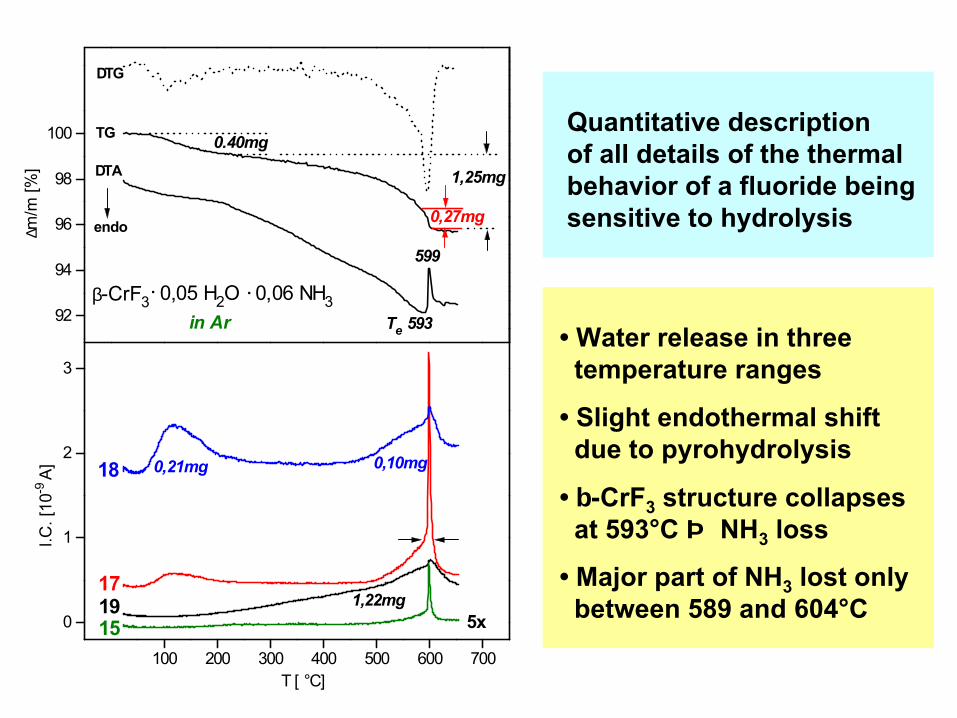
in Ar • Water release in threetemperature ranges
• Slight endothermal shiftdue to pyrohydrolysis
• β-CrF3 structure collapsesat 593°C ⇒ NH3 loss
• Major part of NH3 lost onlybetween 589 and 604°C
Quantitative descriptionof all details of the thermalbehavior of a fluoride beingsensitive to hydrolysis
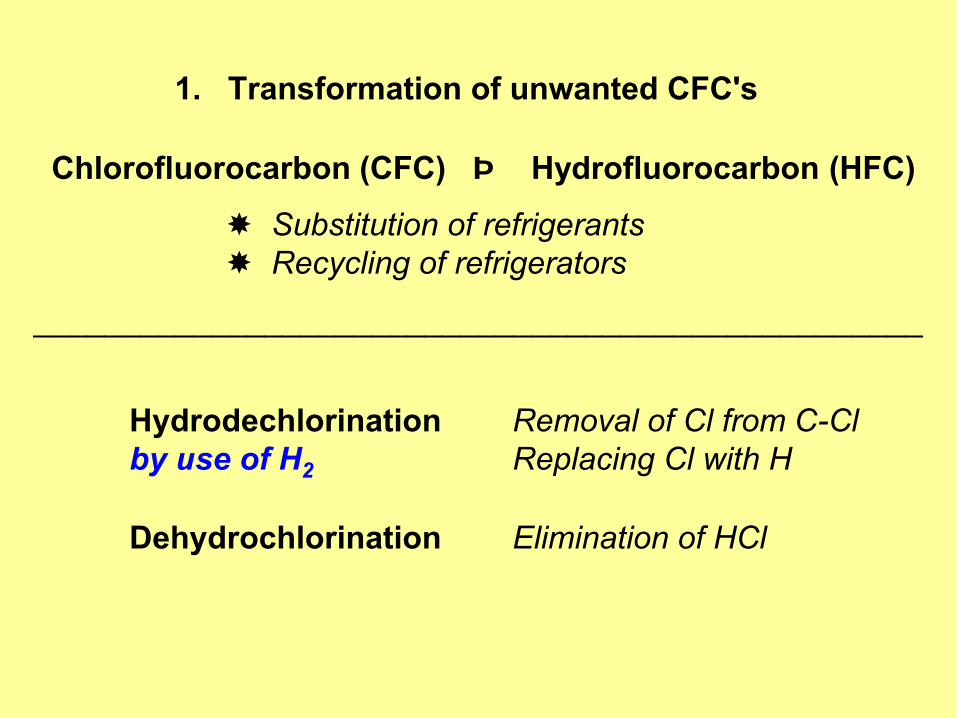
1. Transformation of unwanted CFC's
Chlorofluorocarbon (CFC) ⇒ Hydrofluorocarbon (HFC)
Substitution of refrigerants Recycling of refrigerators
__________________________________________________
Hydrodechlorination Removal of Cl from C-Clby use of H2 Replacing Cl with H
Dehydrochlorination Elimination of HCl
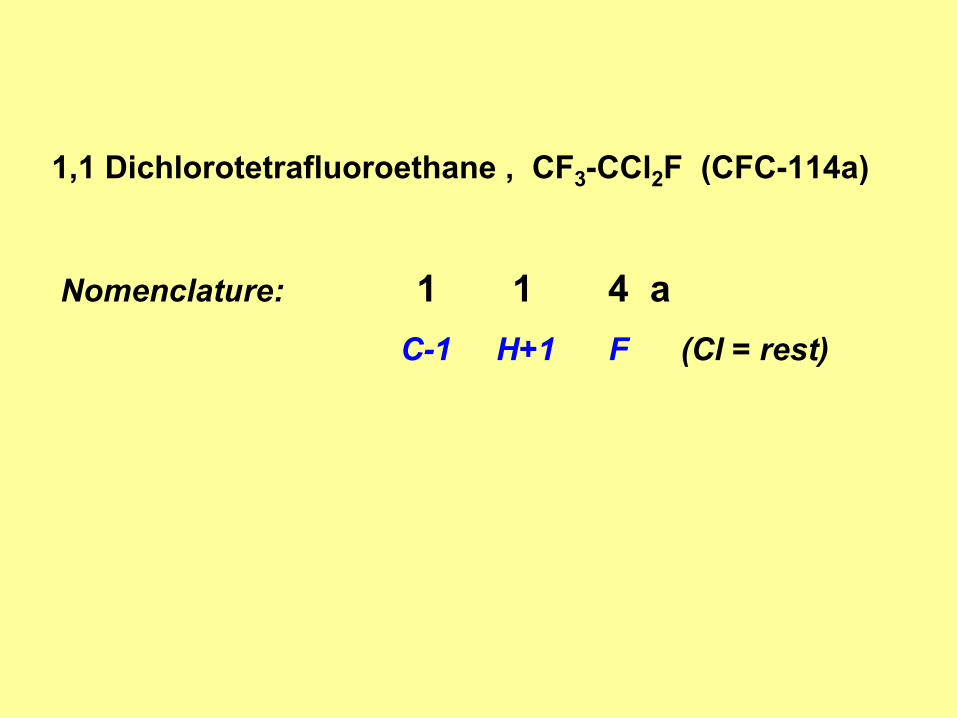
1,1 Dichlorotetrafluoroethane , CF3-CCl2F (CFC-114a)
Nomenclature: 1 1 4 aC-1 H+1 F (Cl = rest)
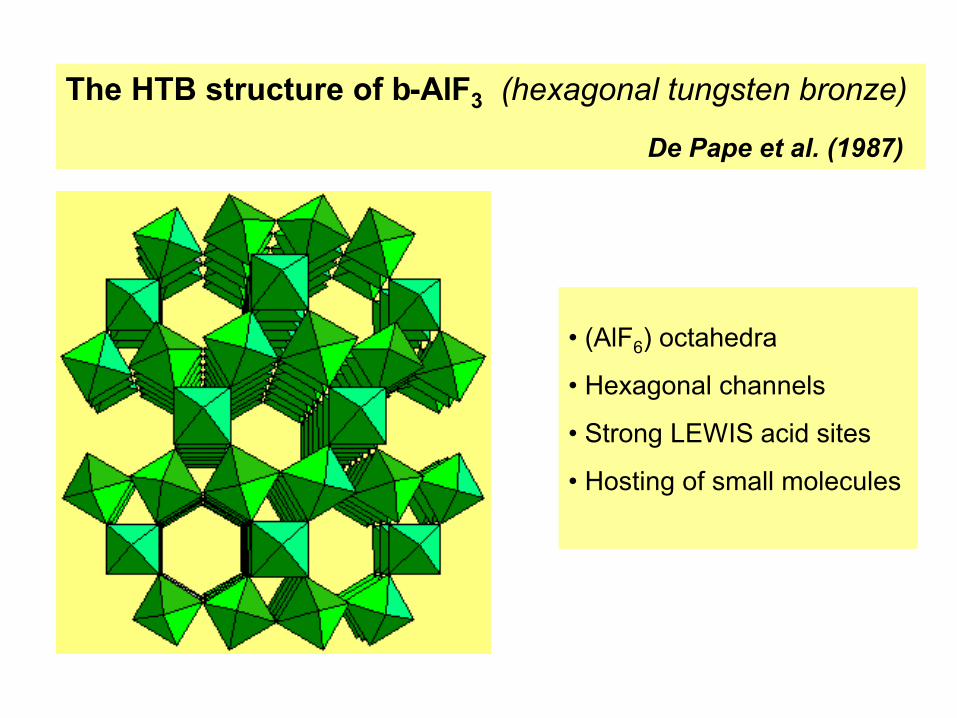
The HTB structure of β-AlF3 (hexagonal tungsten bronze)
De Pape et al. (1987)
• (AlF6) octahedra
• Hexagonal channels
• Strong LEWIS acid sites
• Hosting of small molecules

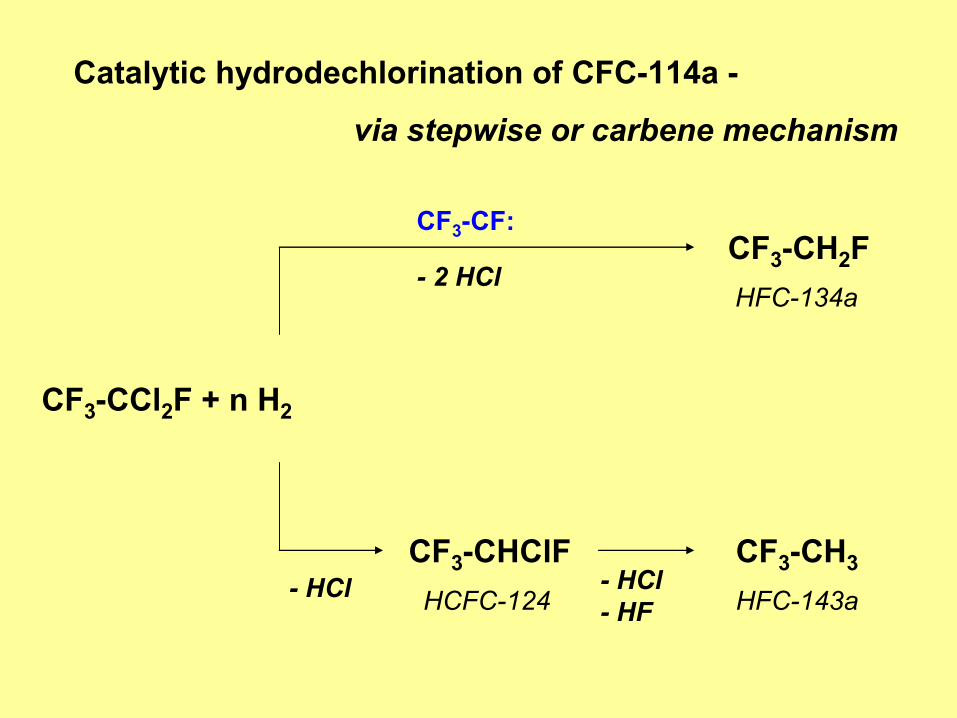
Catalytic hydrodechlorination of CFC-114a -
via stepwise or carbene mechanism
CF3-CCl2F + n H2
CF3-CH2FHFC-134a
CF3-CH3
HFC-143a
CF3-CHClFHCFC-124
CF3-CF:
- 2 HCl
- HCl- HF
- HCl
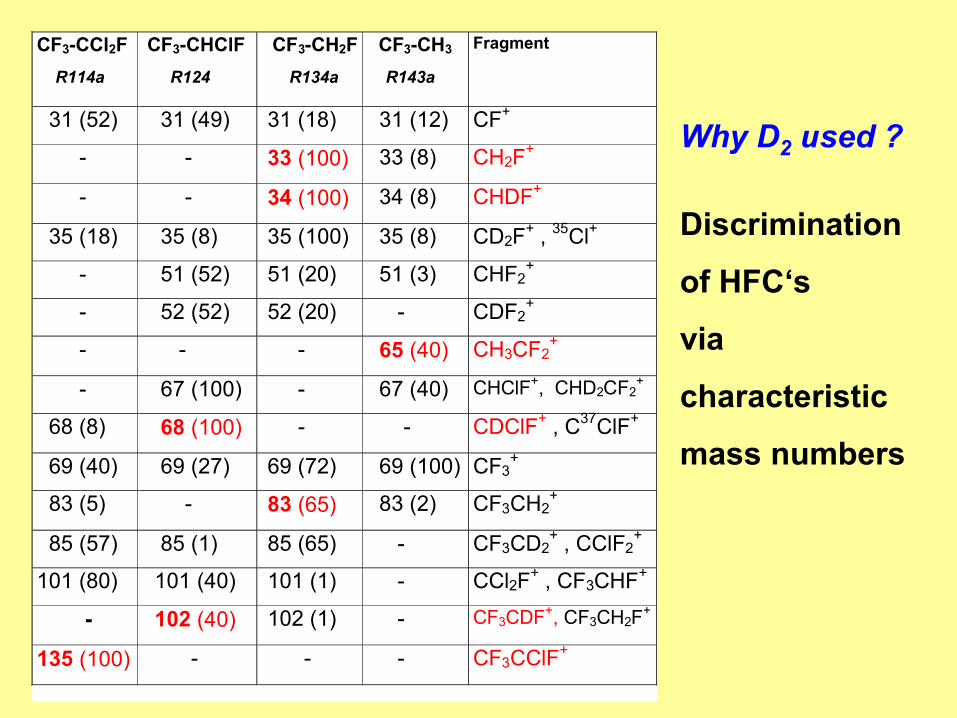
CF3-CCl2F R114a
CF3-CHClF R124
CF3-CH2F R134a
CF3-CH3
R143a
Fragment
31 (52) 31 (49) 31 (18) 31 (12) CF+
- - 33 (100) 33 (8) CH2F+
- - 34 (100) 34 (8) CHDF+
35 (18) 35 (8) 35 (100) 35 (8) CD2F+ , 35Cl+
- 51 (52) 51 (20) 51 (3) CHF2+
- 52 (52) 52 (20) - CDF2+
- - - 65 (40) CH3CF2+
- 67 (100) - 67 (40) CHClF+, CHD2CF2+
68 (8) 68 (100) - - CDClF+ , C37ClF+
69 (40) 69 (27) 69 (72) 69 (100) CF3+
83 (5) - 83 (65) 83 (2) CF3CH2+
85 (57) 85 (1) 85 (65) - CF3CD2+ , CClF2
+
101 (80) 101 (40) 101 (1) - CCl2F+ , CF3CHF+
- 102 (40) 102 (1) - CF3CDF+, CF3CH2F+
135 (100) - - - CF3CClF+
Discrimination
of HFC‘s
via
characteristic
mass numbers
Why D2 used ?
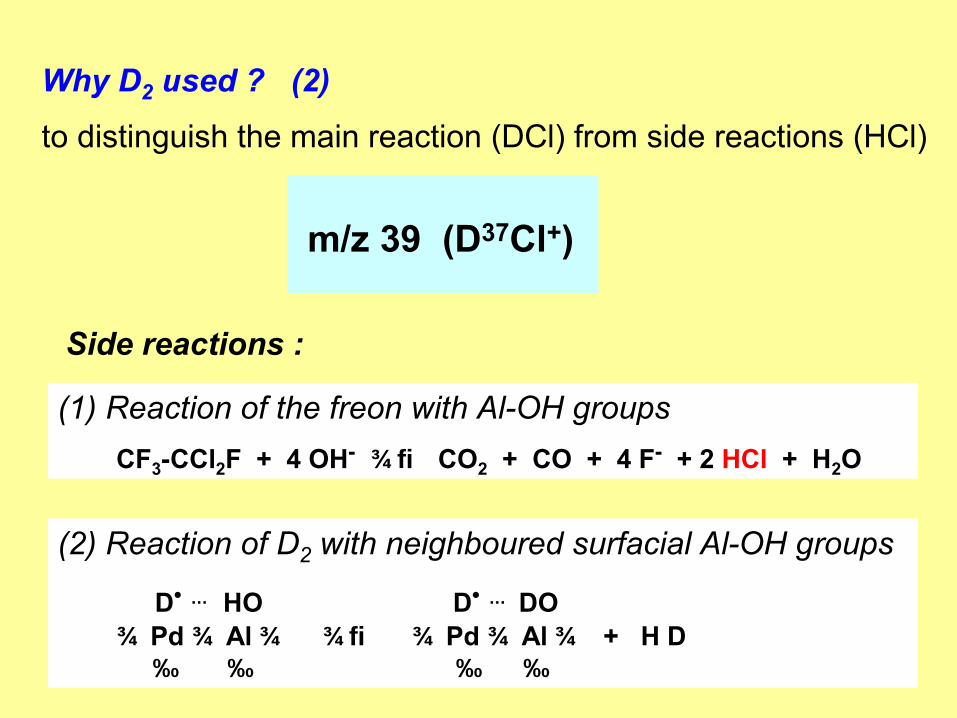
Why D2 used ? (2)
to distinguish the main reaction (DCl) from side reactions (HCl)
m/z 39 (D37Cl+)
(1) Reaction of the freon with Al-OH groupsCF3-CCl2F + 4 OH- → CO2 + CO + 4 F- + 2 HCl + H2O
(2) Reaction of D2 with neighboured surfacial Al-OH groups
D• … HO D• … DO Pd Al → Pd Al + H D
Side reactions :
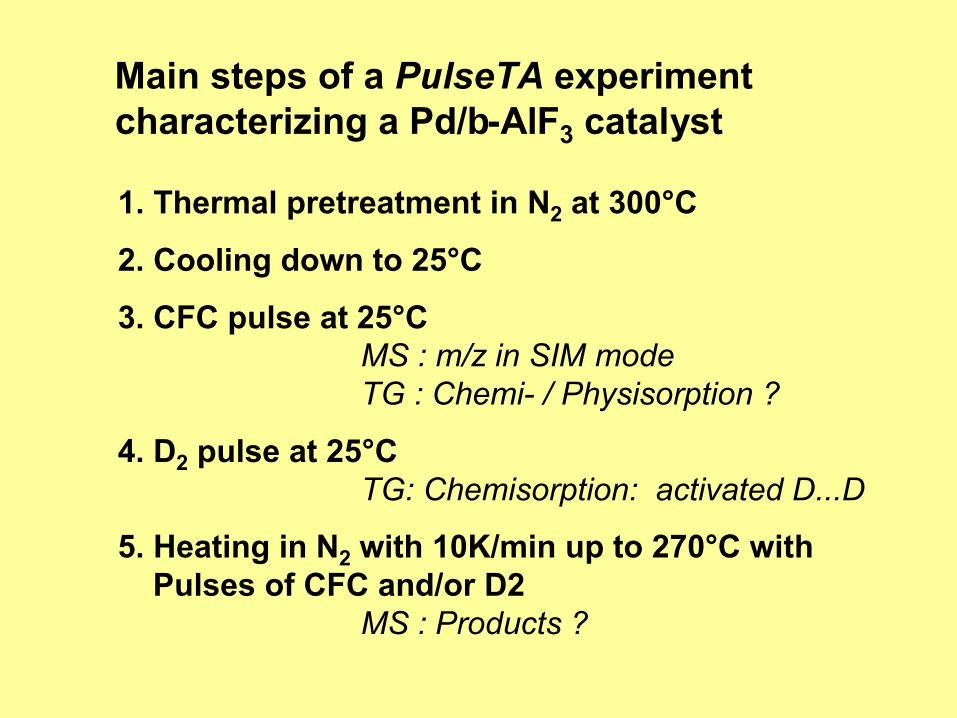
Main steps of a PulseTA experimentcharacterizing a Pd/β-AlF3 catalyst
1. Thermal pretreatment in N2 at 300°C
2. Cooling down to 25°C
3. CFC pulse at 25°CMS : m/z in SIM modeTG : Chemi- / Physisorption ?
4. D2 pulse at 25°CTG: Chemisorption: activated D...D
5. Heating in N2 with 10K/min up to 270°C withPulses of CFC and/or D2
MS : Products ?
0 20 40 60 80
Ion
curr
ent /
A
m102 (x5)
m18
m33 (x1000)
Time / min
92
94
96
98
100
T
TG
m101
0
100
200
300
∆m/%
1E-9
T/°C
m34 (x1000)
m39 (x1000)
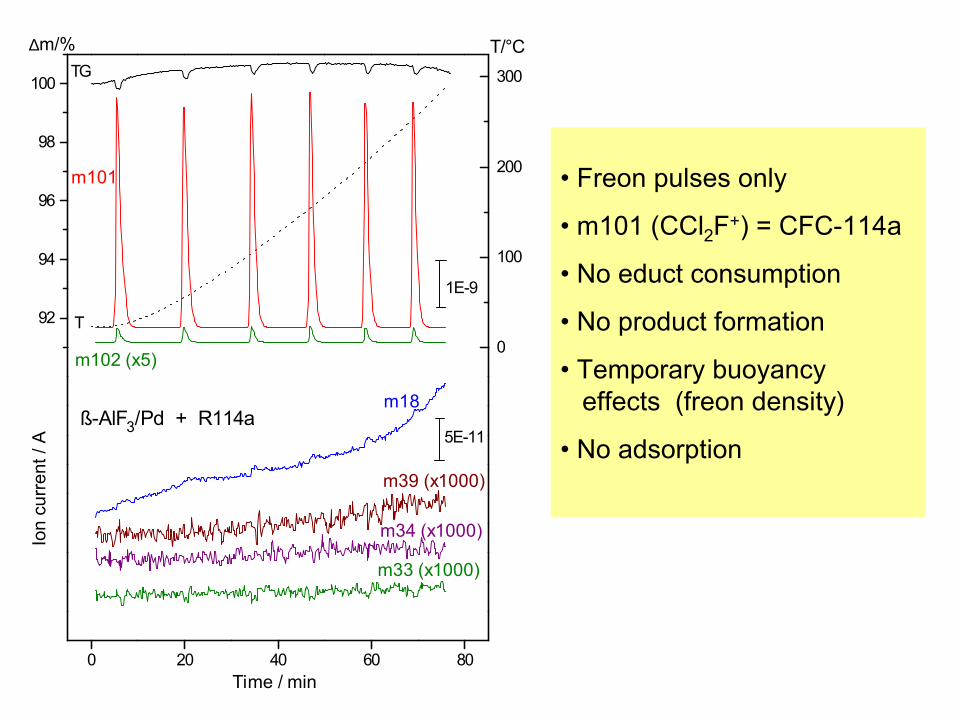
ß-AlF3/Pd + R114a 5E-11
• Freon pulses only
• m101 (CCl2F+) = CFC-114a
• No educt consumption
• No product formation
• Temporary buoyancy effects (freon density)
• No adsorption
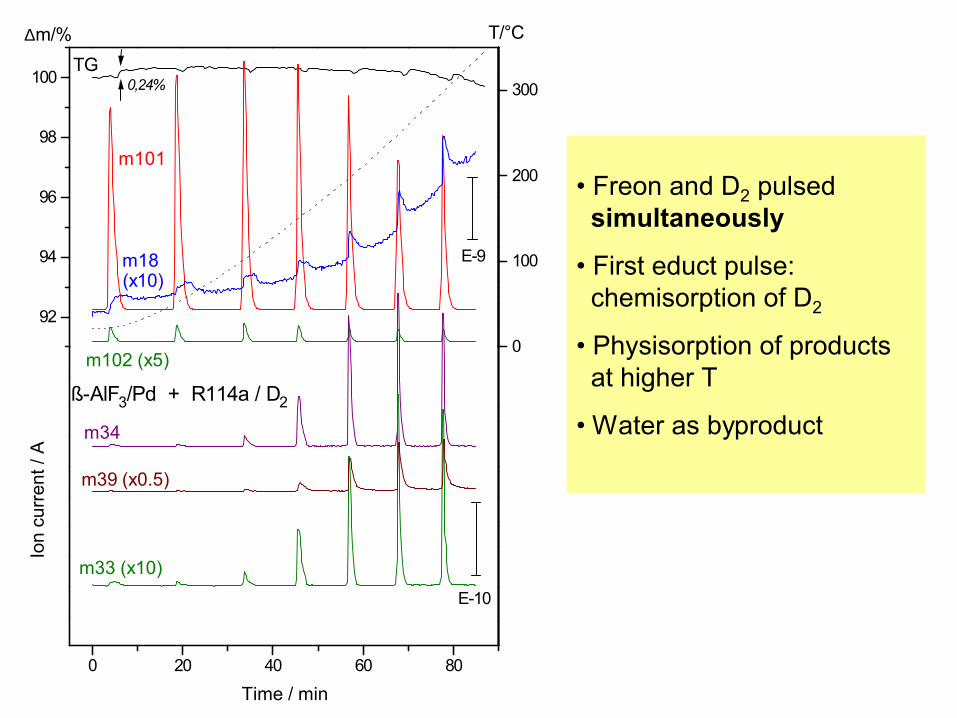
• Freon and D2 pulsedsimultaneously
• First educt pulse:chemisorption of D2
• Physisorption of productsat higher T
• Water as byproduct
0 20 40 60 80
E-10
T/°C
Time / min
Ion
curr
ent /
A
ß-AlF3/Pd + R114a / D2
m102 (x5)
m33 (x10)
m34
92
94
96
98
100
E-9
TG0,24%
∆m/%
(x10)m18
m101
0
100
200
300
m39 (x0.5)
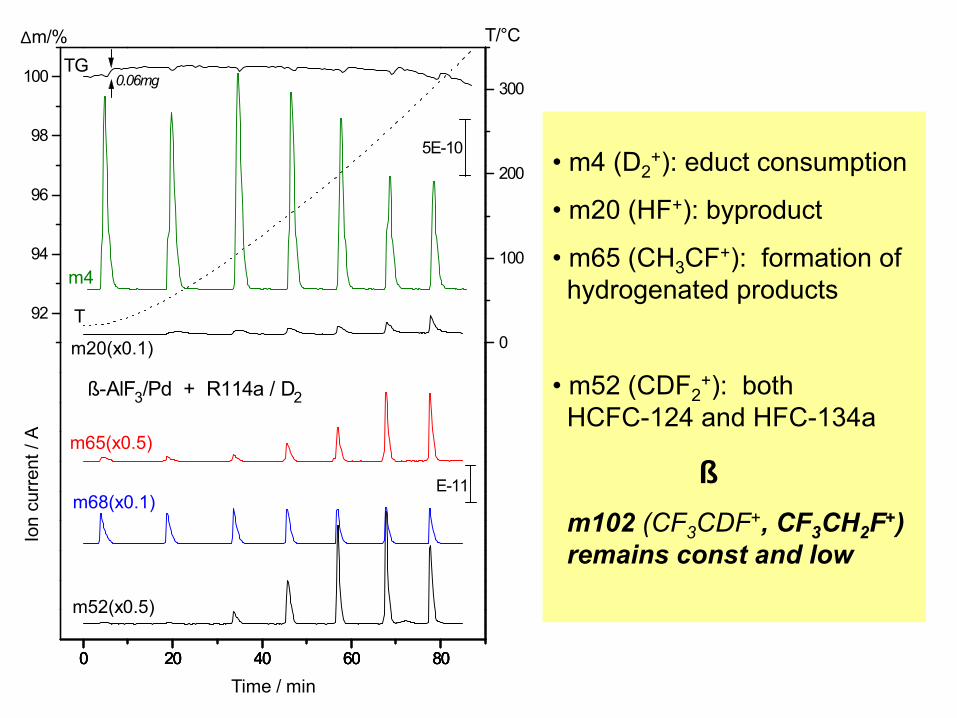
0 20 40 60 80
ß-AlF3/Pd + R114a / D2
Time / min
Ion
curr
ent /
A
E-11m68(x0.1)
m65(x0.5)
92
94
96
98
100
T/°C∆m/%
m20(x0.1)
m4
TG
0
100
200
300
T
0.06mg
5E-10
0 20 40 60 800 20 40 60 80
m52(x0.5)
0 20 40 60 80
• m4 (D2+): educt consumption
• m20 (HF+): byproduct
• m65 (CH3CF+): formation ofhydrogenated products
• m52 (CDF2+): both
HCFC-124 and HFC-134a
⇓m102 (CF3CDF+, CF3CH2F+)remains const and low
Catalytic hydrodechlorination of CFC-114a -
via stepwise or carbene mechanism
CF3-CCl2F + n H2
CF3-CH2FHFC-134a
CF3-CH3
HFC-143a
CF3-CHClFHCFC-124
CF3-CF:
- 2 HCl
- HCl- HF
- HCl
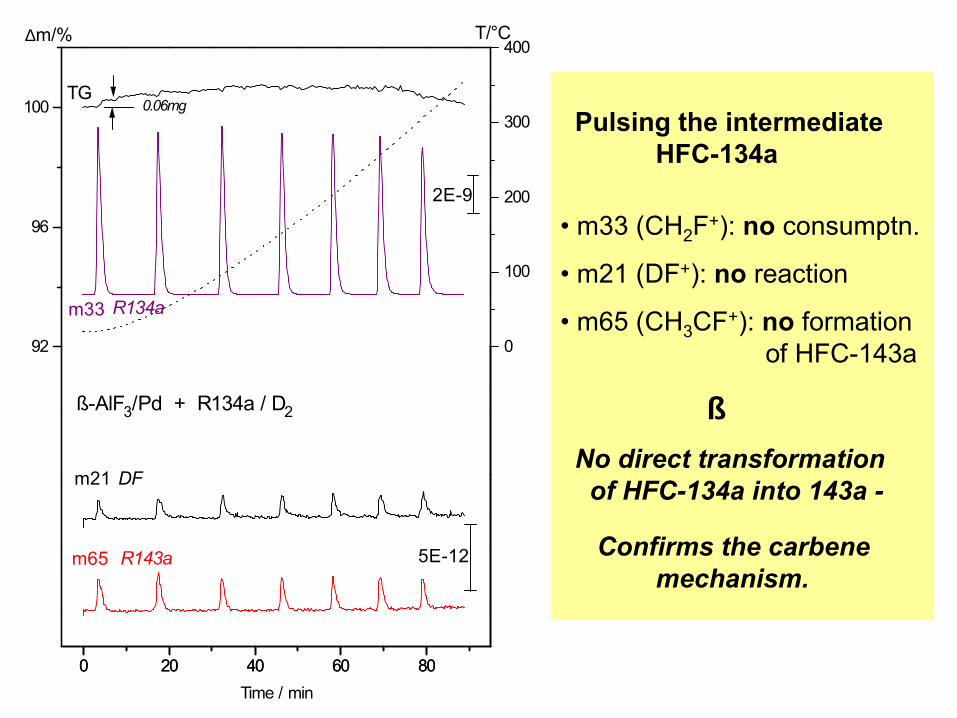
0 20 40 60 80
R143a
Time / min
ß-AlF3/Pd + R134a / D2
DFm21
m65
92
96
100
2E-9
0.06mg
R134am33
TG
0
100
200
300
400T/°C
5E-12
∆m/%
0 20 40 60 80
Pulsing the intermediateHFC-134a
• m33 (CH2F+): no consumptn.
• m21 (DF+): no reaction
• m65 (CH3CF+): no formationof HFC-143a
⇓No direct transformationof HFC-134a into 143a -
Confirms the carbene mechanism.
5. Other thermal properties
Heat capacity
Thermal diffusivity
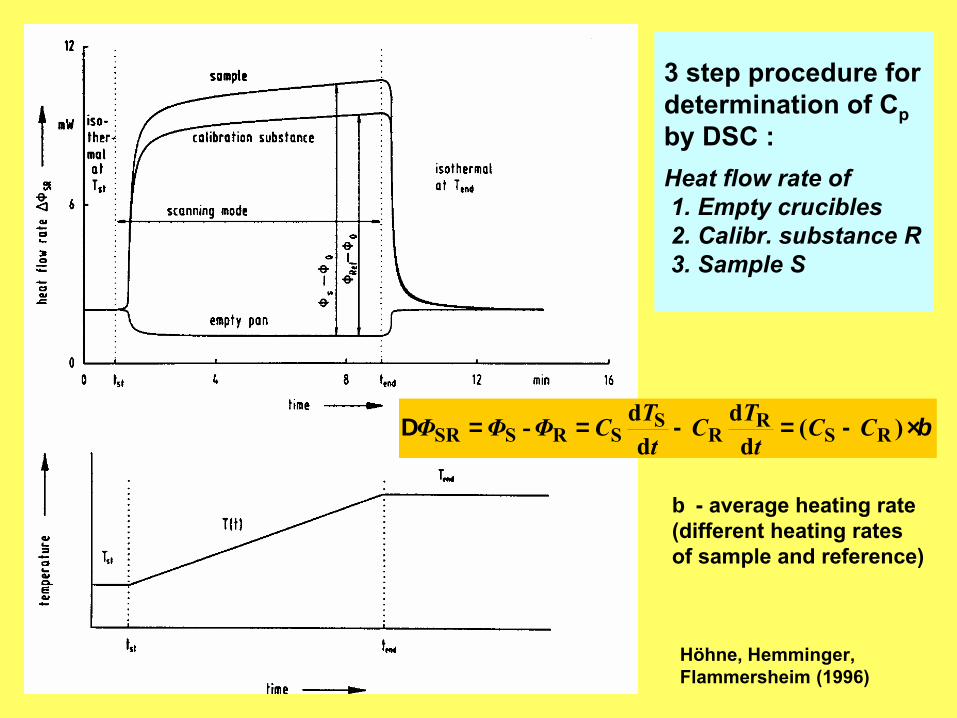
3 step procedure fordetermination of Cpby DSC :Heat flow rate of1. Empty crucibles2. Calibr. substance R3. Sample S
Höhne, Hemminger, Flammersheim (1996)
β⋅−=−==∆ )(d
dd
d- RSR
RS
SRSSR CCt
TCt
TCΦΦΦ
β - average heating rate(different heating ratesof sample and reference)
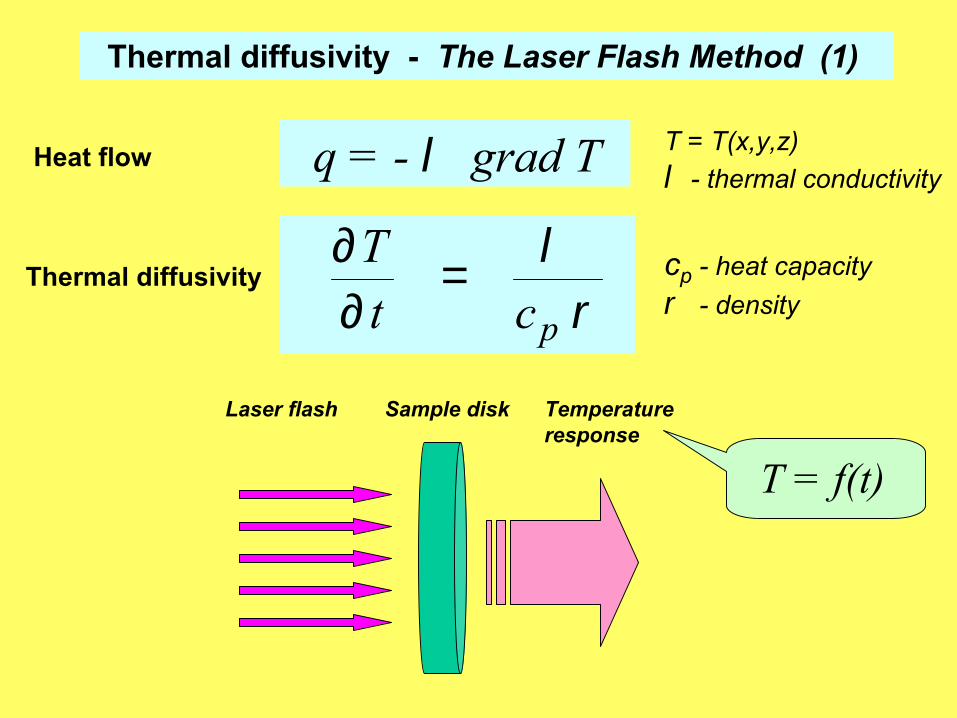
Thermal diffusivity - The Laser Flash Method (1)
ρλ
pctT =
∂∂
q = - λ grad THeat flow
Thermal diffusivity
T = T(x,y,z)λ - thermal conductivity
cp - heat capacityρ - density
Temperatureresponse
Sample diskLaser flash
T = f(t)
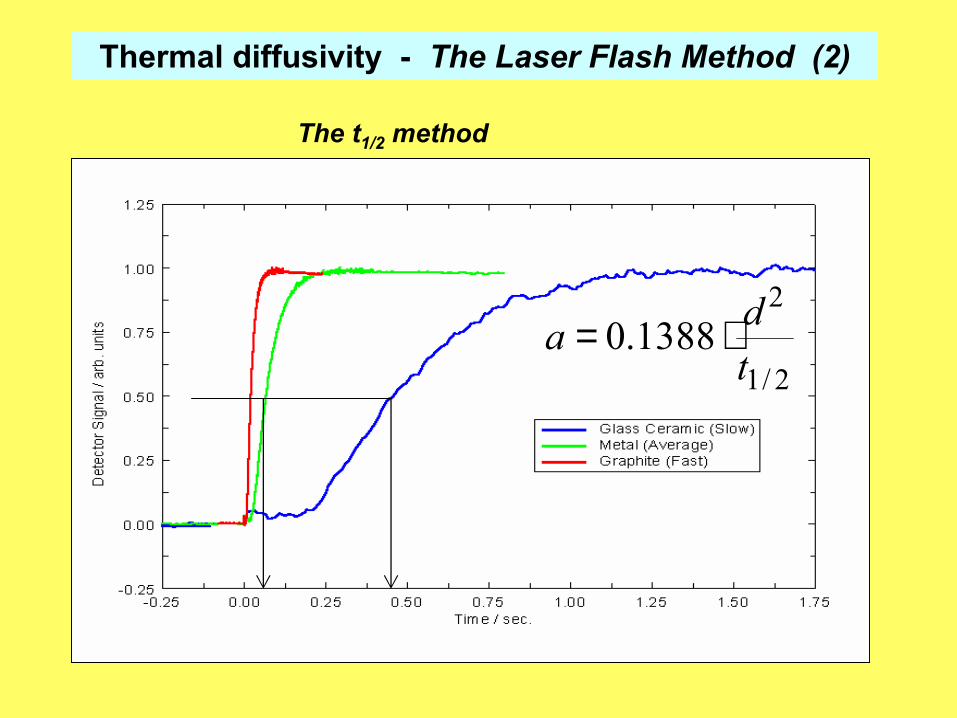
Thermal diffusivity - The Laser Flash Method (2)
The t1/2 method
2/1
21388.0
tda ⋅=
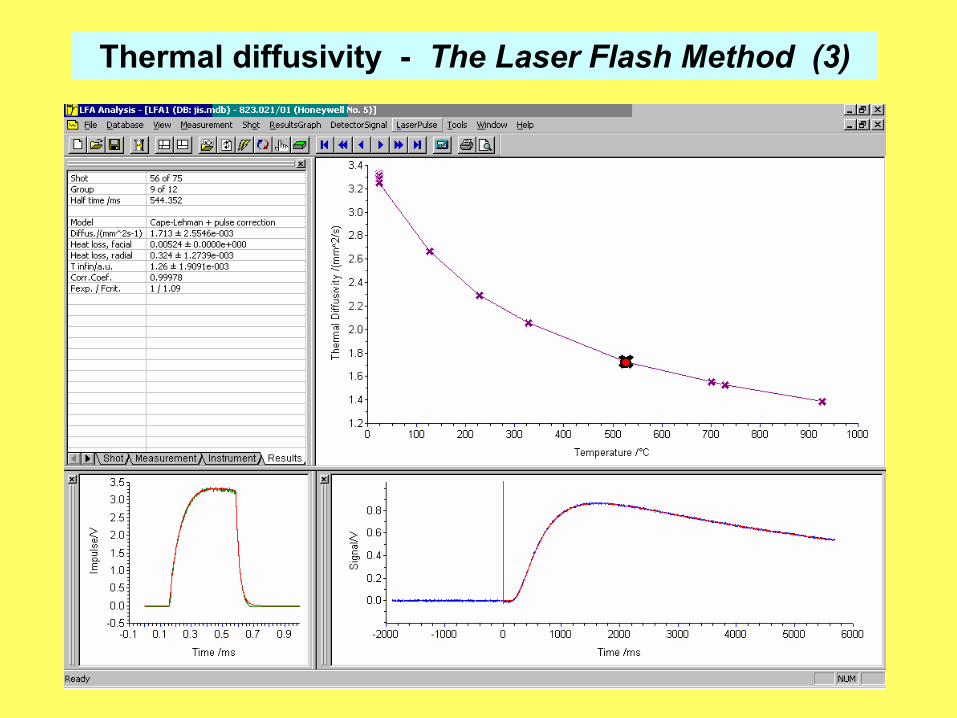
Thermal diffusivity - The Laser Flash Method (3)


![[PVG] Feist - The Reminder](https://img.pdfslide.us/doc/110x75/56d6bf331a28ab3016954c24/pvg-feist-the-reminder.jpg)


![Artist research -feist[1]](https://img.pdfslide.us/doc/110x75/5495af25b479593a508b4577/artist-research-feist1.jpg)