Embed Size (px)
Citation preview
METHODS OF SPECIFYING INTUMESCENTCOATING ON CONCRETE FILLED STEELTUBULAR SECTIONS
M.Jafarian (Exova)Y.C.Wang (University of Manchester)
Layout of presentationØDecision on tests’ specifications (e.g. section sizes, DFT, number of
tests, Conducting the fire tests on a total number of 48 specimens) ;
ØA conversion program ;
ØGenerating DFT tables for each product ;
ØFireSoft validation against ABAQUS ;
ØDetermining effective thermal conductivity to be used in FireSoft ;
ØConsistency check of the evaluated thermal conductivity with finalDFT tables;
ØAccuracy check of the available formulations.
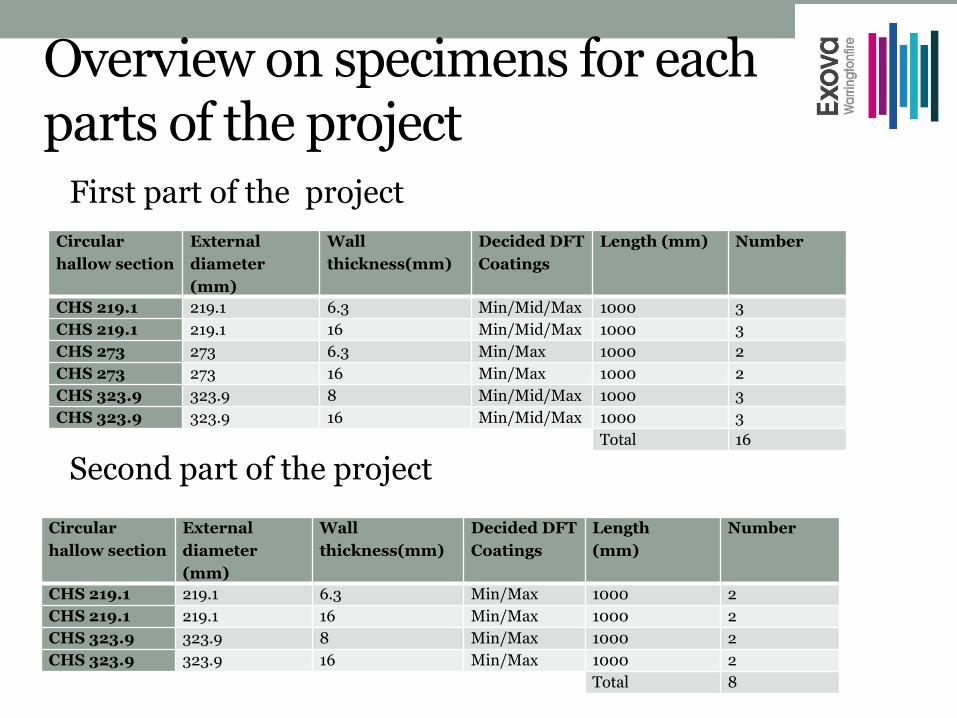
Overview on specimens for each parts of the project
First part of the project
Second part of the project
Circular hallow section
External diameter (mm)
Wall thickness(mm)
Decided DFT Coatings
Length (mm) Number
CHS 219.1 219.1 6.3 Min/Mid/Max 1000 3CHS 219.1 219.1 16 Min/Mid/Max 1000 3CHS 273 273 6.3 Min/Max 1000 2CHS 273 273 16 Min/Max 1000 2CHS 323.9 323.9 8 Min/Mid/Max 1000 3CHS 323.9 323.9 16 Min/Mid/Max 1000 3
Total 16
Circular hallow section
External diameter (mm)
Wall thickness(mm)
Decided DFT Coatings
Length(mm)
Number
CHS 219.1 219.1 6.3 Min/Max 1000 2CHS 219.1 219.1 16 Min/Max 1000 2CHS 323.9 323.9 8 Min/Max 1000 2CHS 323.9 323.9 16 Min/Max 1000 2
Total 8
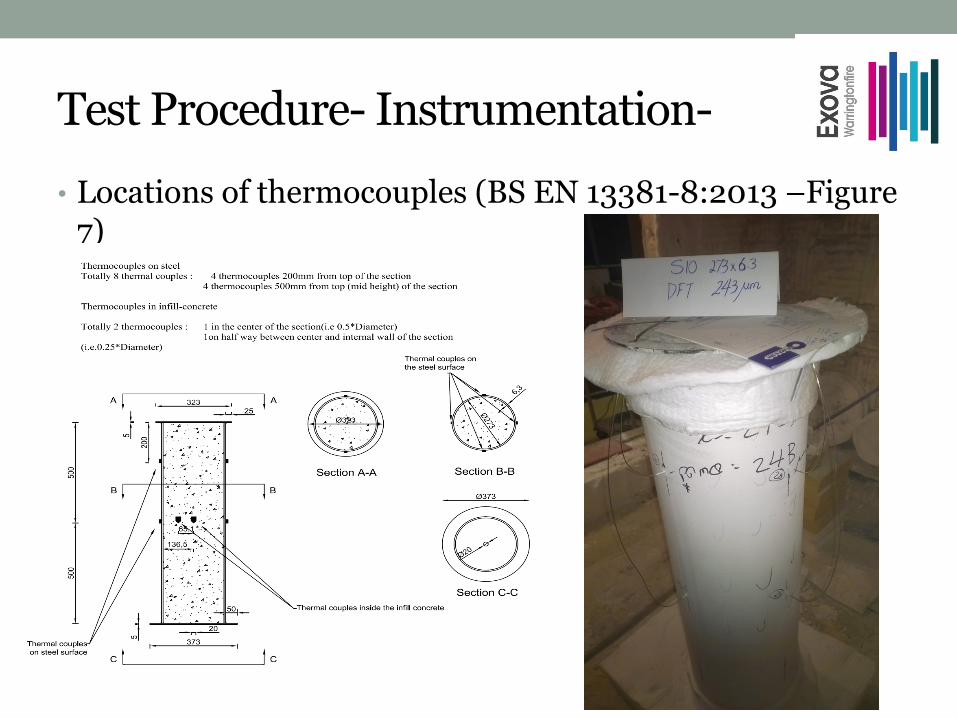
Test Procedure- Instrumentation-• Locations of thermocouples (BS EN 13381-8:2013 –Figure
7)
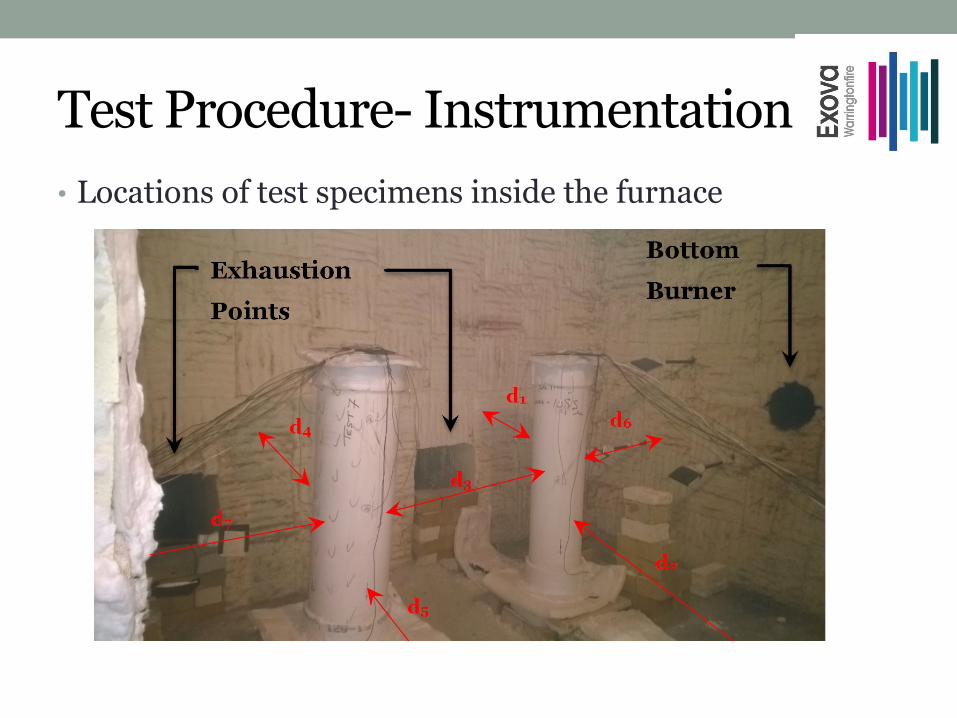
Test Procedure- Instrumentation• Locations of test specimens inside the furnace
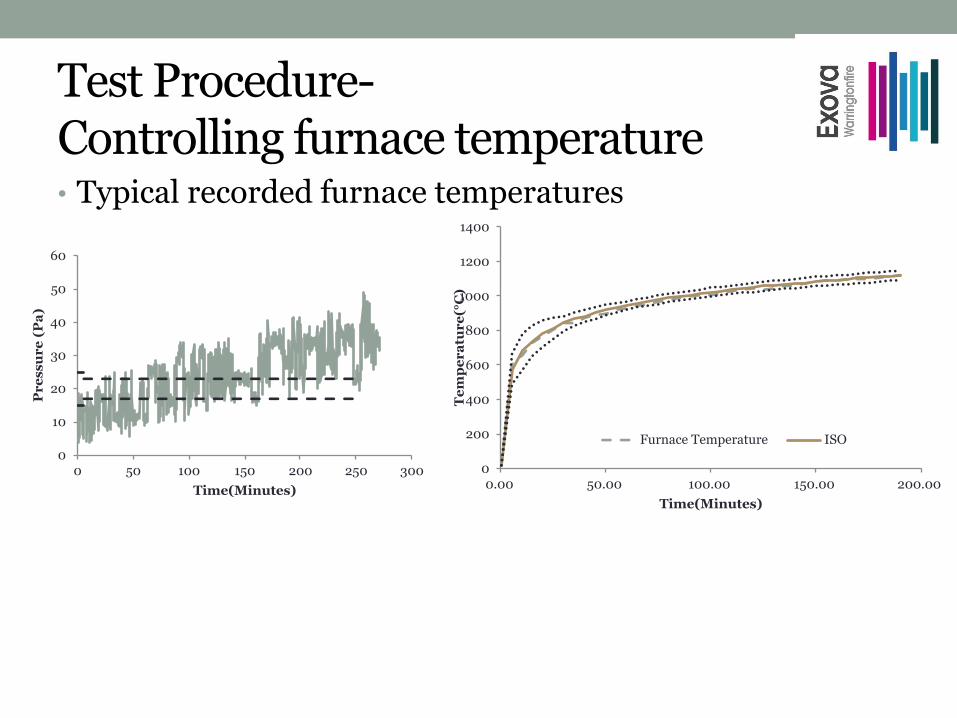
Test Procedure-Controlling furnace temperature • Typical recorded furnace temperatures
0
200
400
600
800
1000
1200
1400
0.00 50.00 100.00 150.00 200.00
Tem
pera
ture
(°C
)
Time(Minutes)
Furnace Temperature ISO0
10
20
30
40
50
60
0 50 100 150 200 250 300
Pre
ssur
e (P
a)
Time(Minutes)
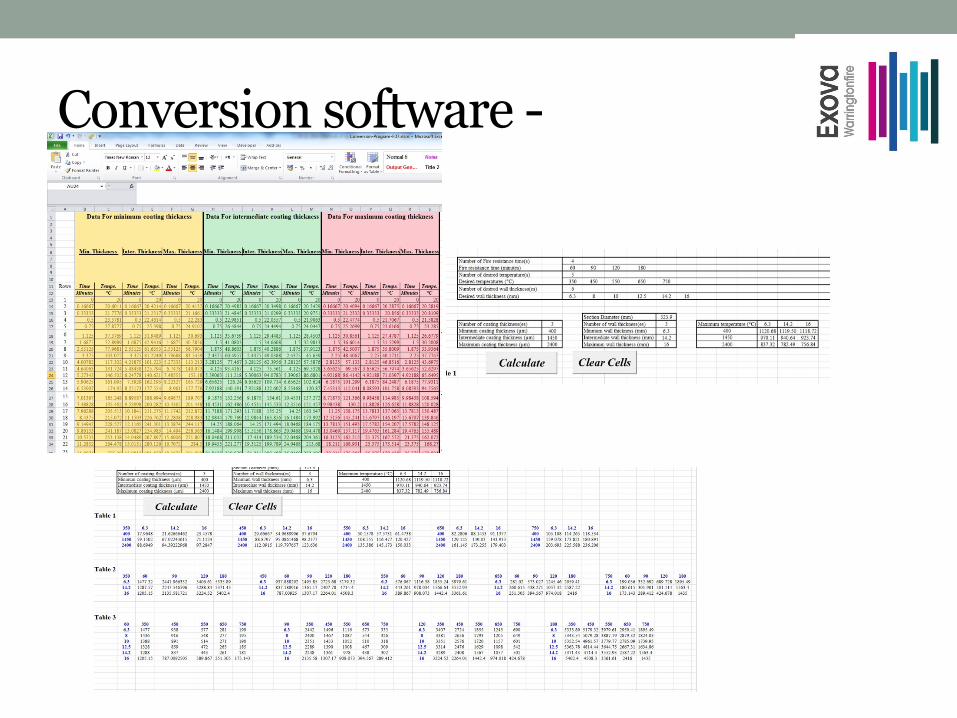
Conversion software -
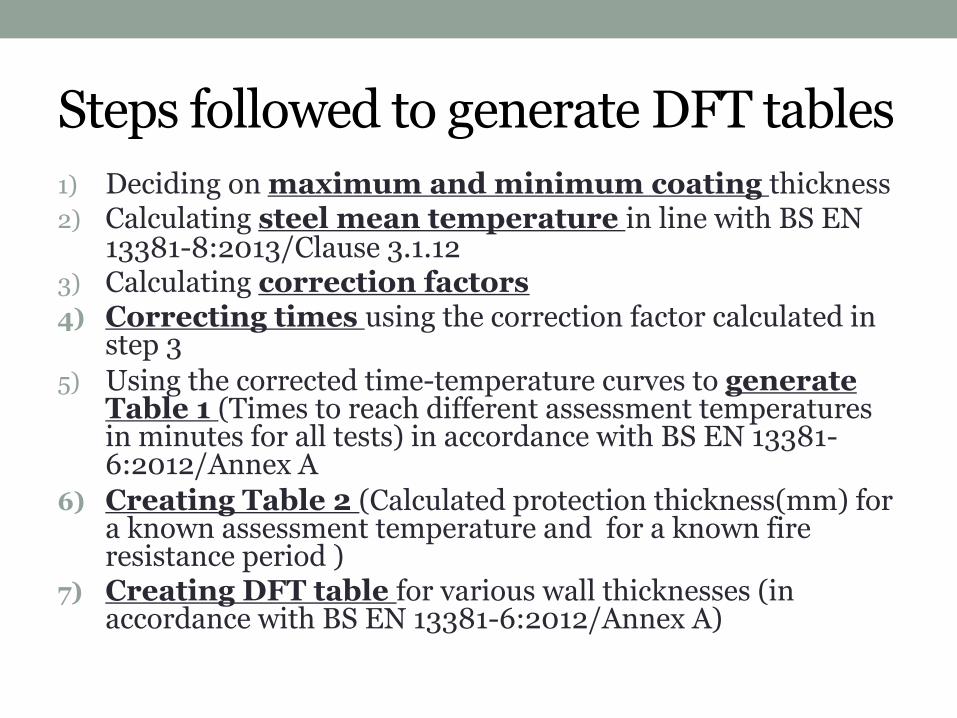
Steps followed to generate DFT tables1) Deciding on maximum and minimum coating thickness2) Calculating steel mean temperature in line with BS EN
13381-8:2013/Clause 3.1.123) Calculating correction factors 4) Correcting times using the correction factor calculated in
step 35) Using the corrected time-temperature curves to generate
Table 1 (Times to reach different assessment temperatures in minutes for all tests) in accordance with BS EN 13381-6:2012/Annex A
6) Creating Table 2 (Calculated protection thickness(mm) for a known assessment temperature and for a known fire resistance period )
7) Creating DFT table for various wall thicknesses (in accordance with BS EN 13381-6:2012/Annex A)
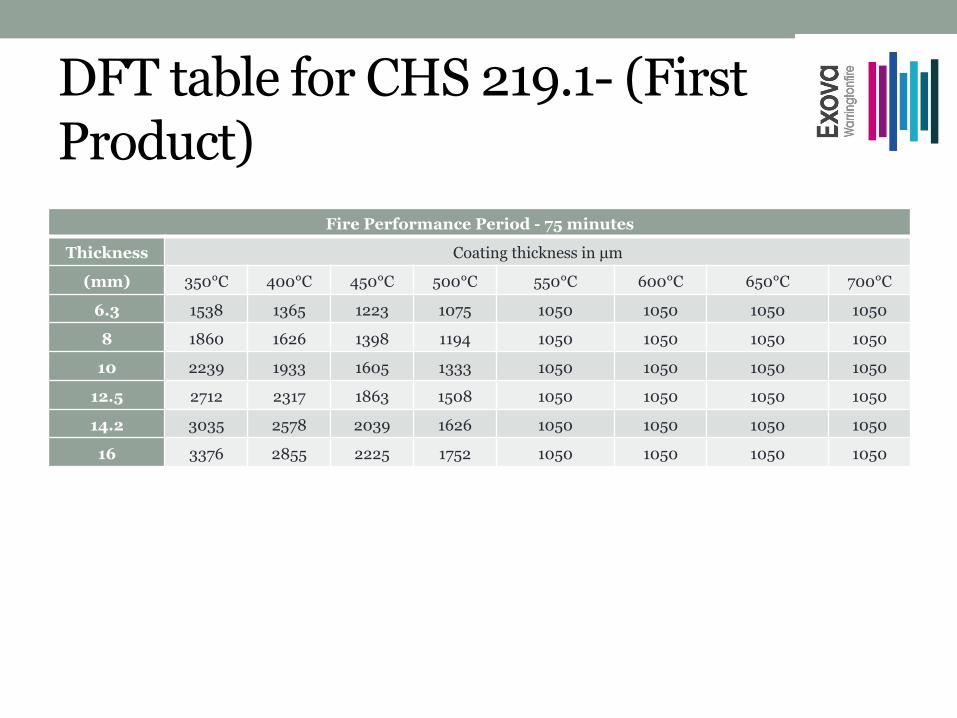
DFT table for CHS 219.1- (First Product)
Fire Performance Period - 75 minutes
Thickness Coating thickness in µm
(mm) 350°C 400°C 450°C 500°C 550°C 600°C 650°C 700°C
6.3 1538 1365 1223 1075 1050 1050 1050 1050
8 1860 1626 1398 1194 1050 1050 1050 1050
10 2239 1933 1605 1333 1050 1050 1050 1050
12.5 2712 2317 1863 1508 1050 1050 1050 1050
14.2 3035 2578 2039 1626 1050 1050 1050 1050
16 3376 2855 2225 1752 1050 1050 1050 1050
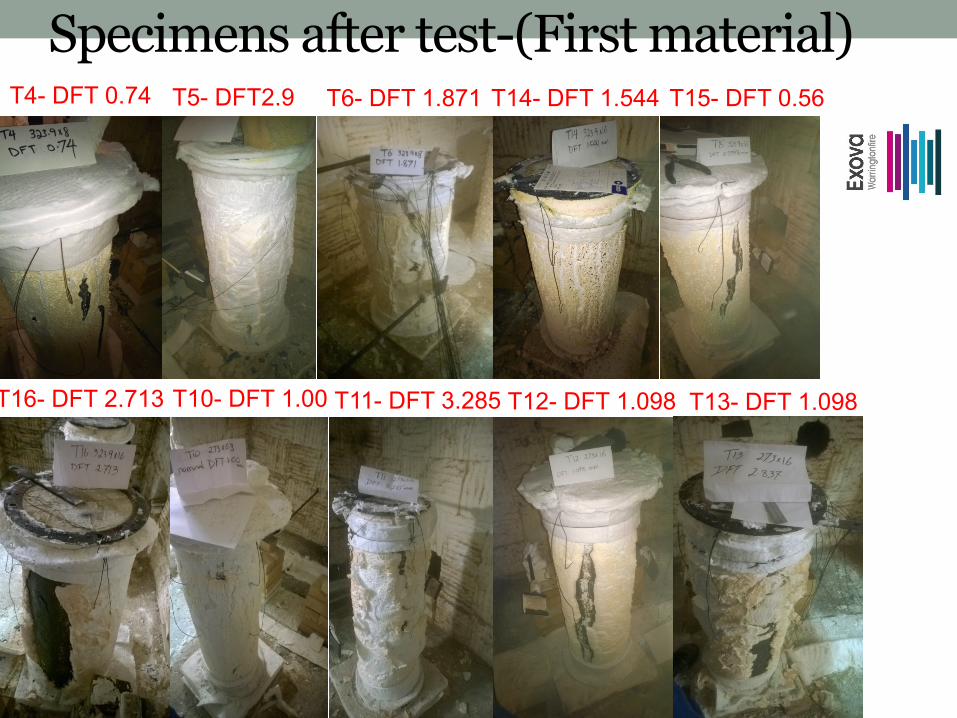
Specimens after test-(First material)T4- DFT 0.74 T5- DFT2.9 T6- DFT 1.871
T16- DFT 2.713
T15- DFT 0.56T14- DFT 1.544
T10- DFT 1.00 T11- DFT 3.285 T12- DFT 1.098 T13- DFT 1.098
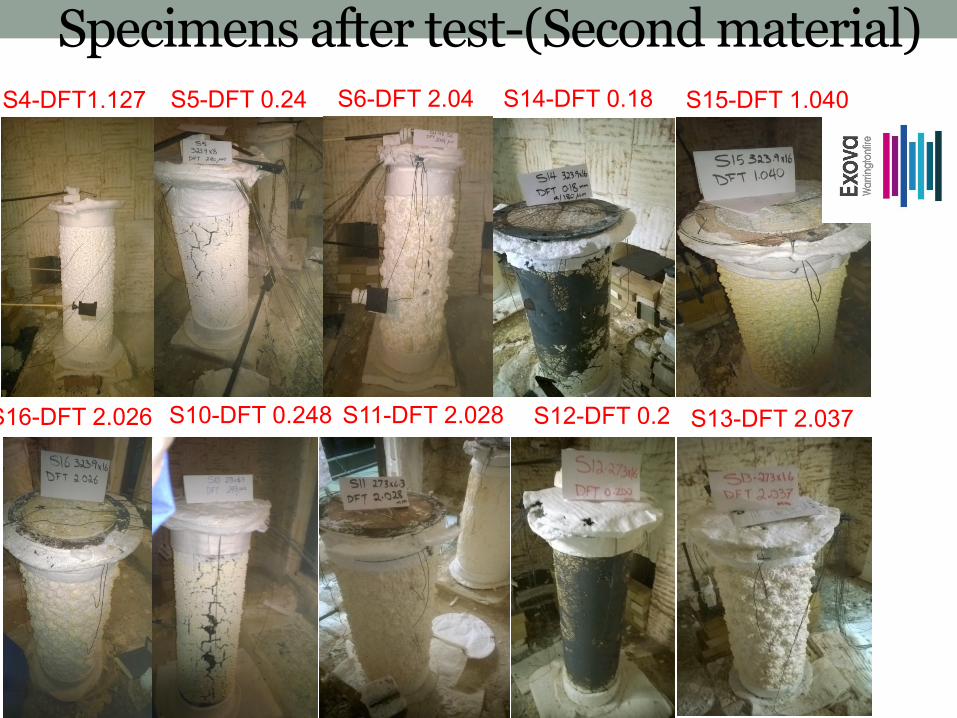
Specimens after test-(Second material)S4-DFT1.127 S5-DFT 0.24 S6-DFT 2.04 S14-DFT 0.18 S15-DFT 1.040
S16-DFT 2.026 S10-DFT 0.248 S11-DFT 2.028 S12-DFT 0.2 S13-DFT 2.037
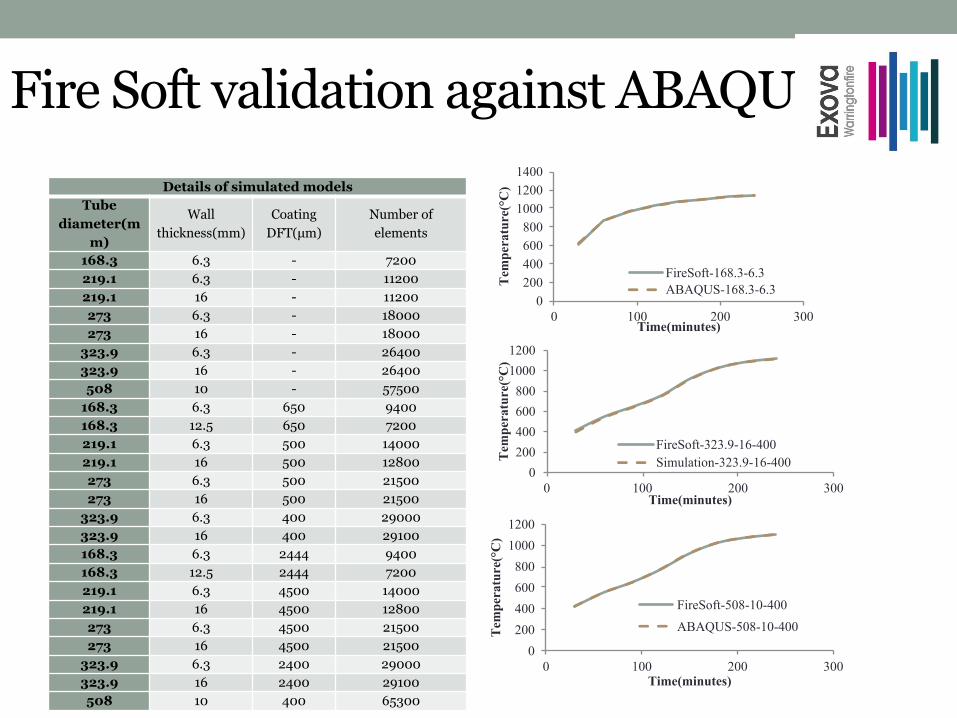
Fire Soft validation against ABAQUS
• as Details of simulated modelsTube
diameter(mm)
Wall thickness(mm)
CoatingDFT(µm)
Number of elements
168.3 6.3 - 7200219.1 6.3 - 11200219.1 16 - 11200273 6.3 - 18000273 16 - 18000
323.9 6.3 - 26400323.9 16 - 26400508 10 - 57500
168.3 6.3 650 9400168.3 12.5 650 7200219.1 6.3 500 14000219.1 16 500 12800273 6.3 500 21500273 16 500 21500
323.9 6.3 400 29000323.9 16 400 29100168.3 6.3 2444 9400168.3 12.5 2444 7200219.1 6.3 4500 14000219.1 16 4500 12800273 6.3 4500 21500273 16 4500 21500
323.9 6.3 2400 29000323.9 16 2400 29100508 10 400 65300
0200400600800100012001400
0 100 200 300
Temperature(°C)
Time(minutes)
FireSoft-168.3-6.3ABAQUS-168.3-6.3
020040060080010001200
0 100 200 300
Temperature(°C)
Time(minutes)
FireSoft-508-10-400ABAQUS-508-10-400
020040060080010001200
0 100 200 300Temperature(°C)
Time(minutes)
FireSoft-323.9-16-400Simulation-323.9-16-400
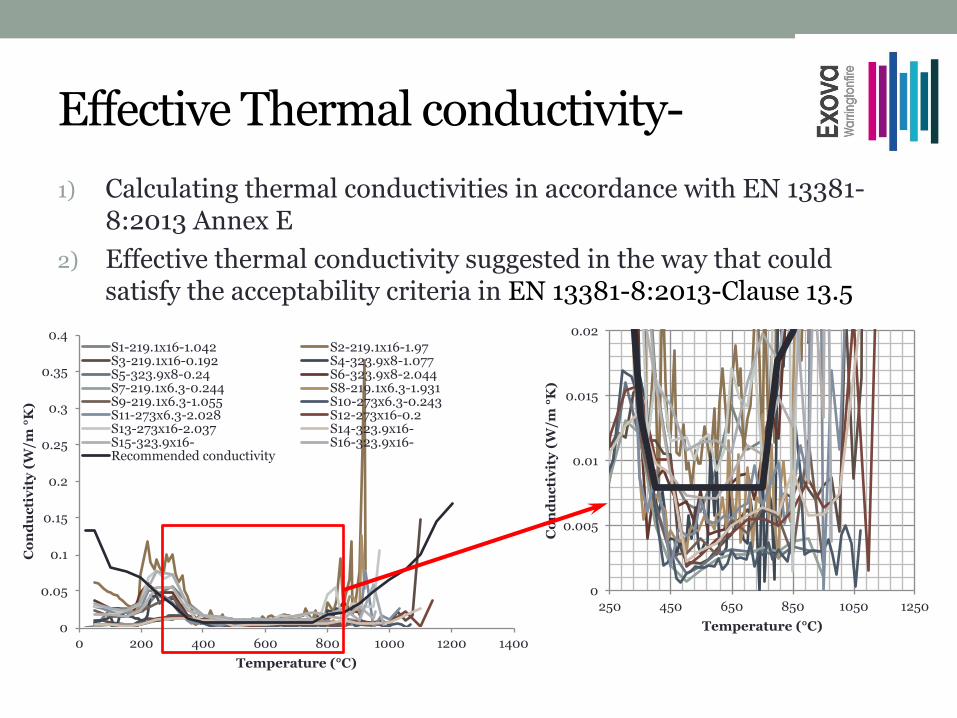
Effective Thermal conductivity-1) Calculating thermal conductivities in accordance with EN 13381-
8:2013 Annex E2) Effective thermal conductivity suggested in the way that could
satisfy the acceptability criteria in EN 13381-8:2013-Clause 13.5
0
0.05
0.1
0.15
0.2
0.25
0.3
0.35
0.4
0 200 400 600 800 1000 1200 1400
Con
duct
ivit
y (W
/m °K
)
Temperature (°C)
S1-219.1x16-1.042 S2-219.1x16-1.97S3-219.1x16-0.192 S4-323.9x8-1.077S5-323.9x8-0.24 S6-323.9x8-2.044S7-219.1x6.3-0.244 S8-219.1x6.3-1.931S9-219.1x6.3-1.055 S10-273x6.3-0.243S11-273x6.3-2.028 S12-273x16-0.2S13-273x16-2.037 S14-323.9x16-S15-323.9x16- S16-323.9x16-Recommended conductivity
0
0.005
0.01
0.015
0.02
250 450 650 850 1050 1250
Con
duct
ivit
y (W
/m °K
)
Temperature (°C)
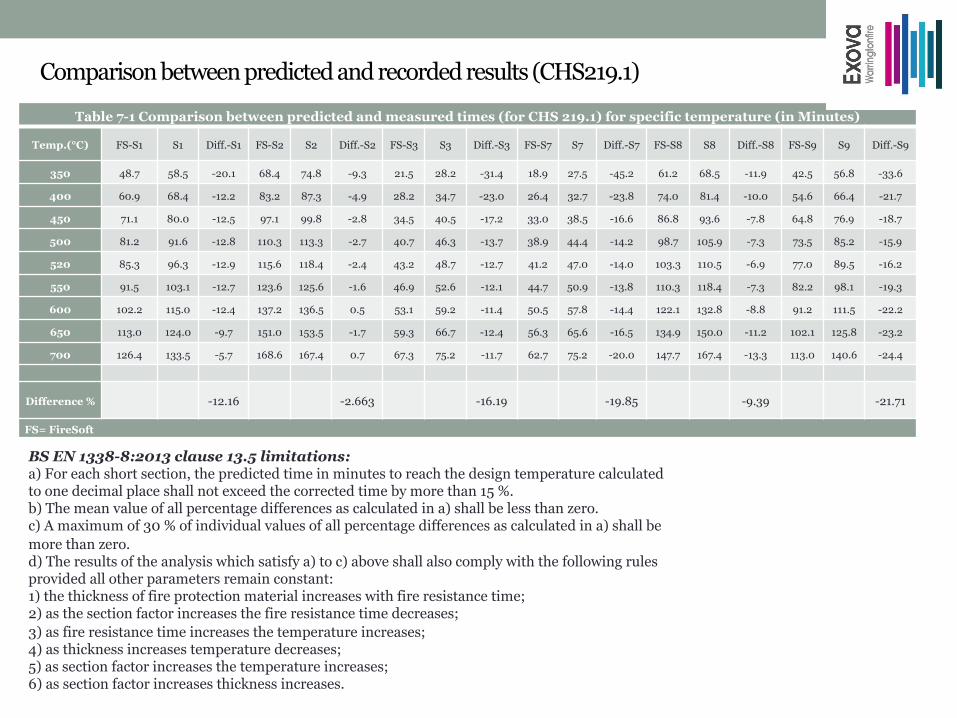
Comparison between predicted and recorded results (CHS219.1)
Table 7-1 Comparison between predicted and measured times (for CHS 219.1) for specific temperature (in Minutes)
Temp.(°C) FS-S1 S1 Diff.-S1 FS-S2 S2 Diff.-S2 FS-S3 S3 Diff.-S3 FS-S7 S7 Diff.-S7 FS-S8 S8 Diff.-S8 FS-S9 S9 Diff.-S9
350 48.7 58.5 -20.1 68.4 74.8 -9.3 21.5 28.2 -31.4 18.9 27.5 -45.2 61.2 68.5 -11.9 42.5 56.8 -33.6
400 60.9 68.4 -12.2 83.2 87.3 -4.9 28.2 34.7 -23.0 26.4 32.7 -23.8 74.0 81.4 -10.0 54.6 66.4 -21.7
450 71.1 80.0 -12.5 97.1 99.8 -2.8 34.5 40.5 -17.2 33.0 38.5 -16.6 86.8 93.6 -7.8 64.8 76.9 -18.7
500 81.2 91.6 -12.8 110.3 113.3 -2.7 40.7 46.3 -13.7 38.9 44.4 -14.2 98.7 105.9 -7.3 73.5 85.2 -15.9
520 85.3 96.3 -12.9 115.6 118.4 -2.4 43.2 48.7 -12.7 41.2 47.0 -14.0 103.3 110.5 -6.9 77.0 89.5 -16.2
550 91.5 103.1 -12.7 123.6 125.6 -1.6 46.9 52.6 -12.1 44.7 50.9 -13.8 110.3 118.4 -7.3 82.2 98.1 -19.3
600 102.2 115.0 -12.4 137.2 136.5 0.5 53.1 59.2 -11.4 50.5 57.8 -14.4 122.1 132.8 -8.8 91.2 111.5 -22.2
650 113.0 124.0 -9.7 151.0 153.5 -1.7 59.3 66.7 -12.4 56.3 65.6 -16.5 134.9 150.0 -11.2 102.1 125.8 -23.2
700 126.4 133.5 -5.7 168.6 167.4 0.7 67.3 75.2 -11.7 62.7 75.2 -20.0 147.7 167.4 -13.3 113.0 140.6 -24.4
Difference % -12.16 -2.663 -16.19 -19.85 -9.39 -21.71
FS= FireSoft
BS EN 1338-8:2013 clause 13.5 limitations:a) For each short section, the predicted time in minutes to reach the design temperature calculatedto one decimal place shall not exceed the corrected time by more than 15 %.b) The mean value of all percentage differences as calculated in a) shall be less than zero.c) A maximum of 30 % of individual values of all percentage differences as calculated in a) shall bemore than zero.d) The results of the analysis which satisfy a) to c) above shall also comply with the following rulesprovided all other parameters remain constant:1) the thickness of fire protection material increases with fire resistance time;2) as the section factor increases the fire resistance time decreases;3) as fire resistance time increases the temperature increases;4) as thickness increases temperature decreases;5) as section factor increases the temperature increases;6) as section factor increases thickness increases.
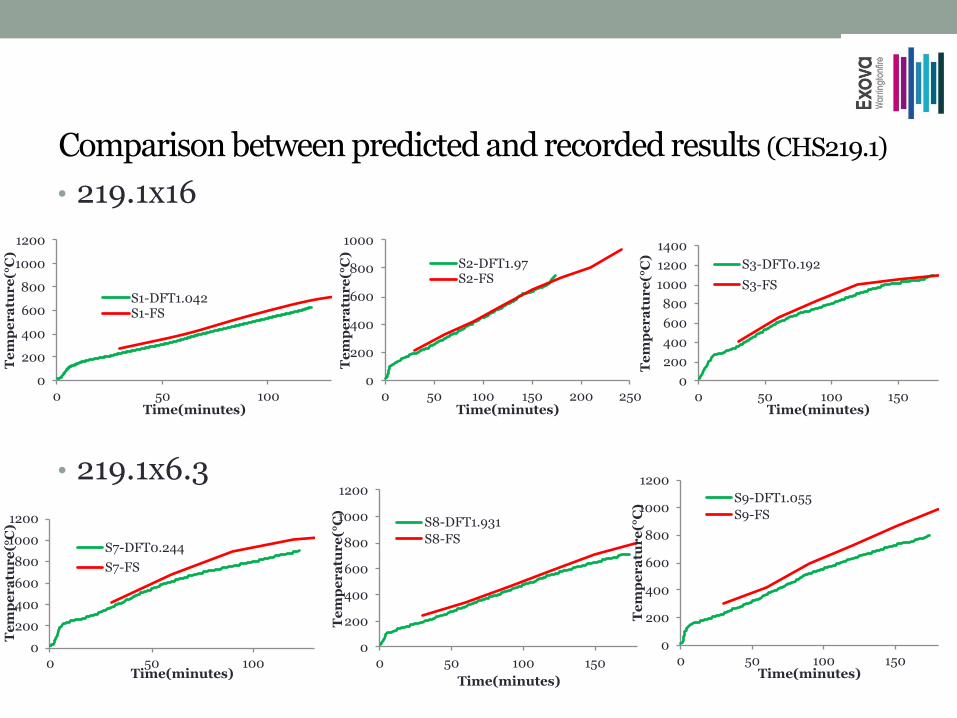
Comparison between predicted and recorded results (CHS219.1)
• 219.1x16
• 219.1x6.3
0
200
400
600
800
1000
1200
0 50 100
Tem
pera
ture
(°C
)
Time(minutes)
S1-DFT1.042S1-FS
0
200
400
600
800
1000
0 50 100 150 200 250
Tem
pera
ture
(°C
)
Time(minutes)
S2-DFT1.97S2-FS
0200400600800
100012001400
0 50 100 150
Tem
pera
ture
(°C
)
Time(minutes)
S3-DFT0.192S3-FS
0200400600800
10001200
0 50 100
Tem
pera
ture
(°C
)
Time(minutes)
S7-DFT0.244S7-FS
0
200
400
600
800
1000
1200
0 50 100 150
Tem
pera
ture
(°C
)
Time(minutes)
S8-DFT1.931S8-FS
0
200
400
600
800
1000
1200
0 50 100 150
Tem
pera
ture
(°C
)
Time(minutes)
S9-DFT1.055S9-FS

Consistency check of the evaluated thermal conductivity with final DFT tables-(First material)
CHS 219.1 60 minutes of Fire resistance 90 minutes of Fire resistance
Thickness(mm) DFT Expected Calculate Diff(%) DFT Expected Calculate Diff(%)
8 714 550 °C 547.49 0.46 1417 550 °C 572.79 -3.98
10 686 550 °C 544.32 1.04 1338 550 °C 574.08 -4.19
12.5 650 550 °C 541.77 1.52 1238 550 °C 577.79 -4.81
14.2 626 550 °C 540.62 1.73 1170 550 °C 590.99 -6.94
CHS 323.9 60 minutes of Fire resistance 120 minutes of Fire resistance
Thickness(mm)Level1
DFTExpected Calculate Diff(%) Level1 DFT Expected Calculate Diff(%)
8 700 550 °C 519.8 -5.8 1589 550 °C 599.5 8.3
10 700 550 °C 511.3 -7.6 1526 550 °C 598.0 8.0
12.5 700 550 °C 501.5 -9.7 1447 550 °C 597.7 8.0
14.2 700 550 °C 495.2 -11.1 1393 550 °C 598.3 8.1
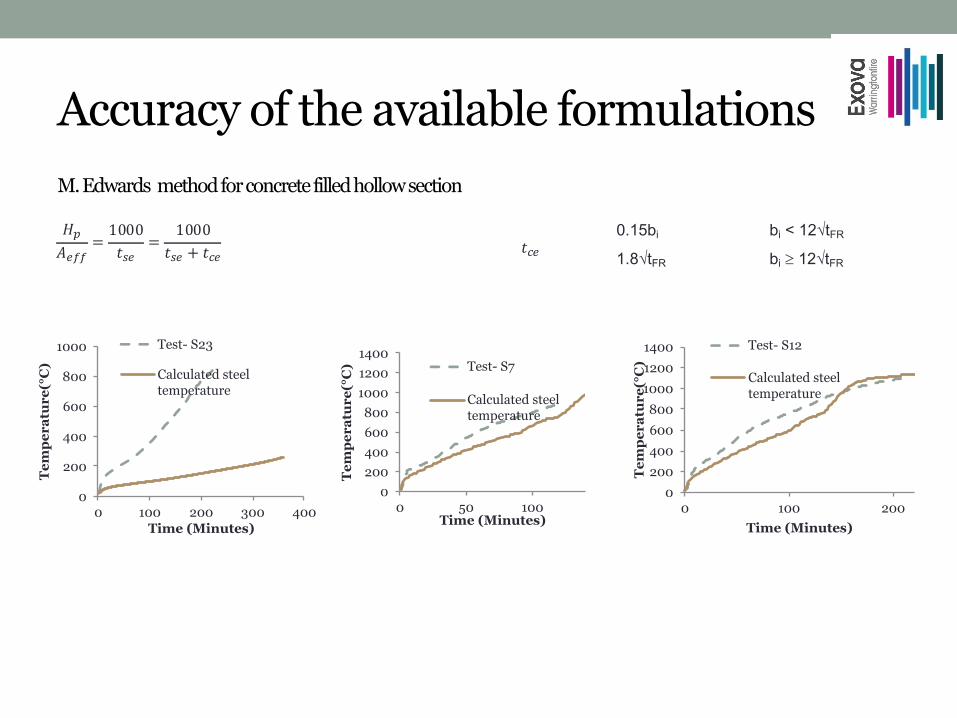
Accuracy of the available formulationsM.Edwards methodforconcretefilledhollowsection
𝐻"𝐴$%%
=1000𝑡*$
=1000
𝑡*$ + 𝑡,$
0
200
400
600
800
1000
0 100 200 300 400
Tem
pera
ture
(°C
)
Time (Minutes)
Test- S23
Calculated steel temperature
0200400600800
100012001400
0 50 100
Tem
pera
ture
(°C
)
Time (Minutes)
Test- S7
Calculated steel temperature
0200400600800
100012001400
0 100 200
Tem
pera
ture
(°C
)
Time (Minutes)
Test- S12
Calculated steel temperature
𝑡,$0.15bi bi < 12√tFR
1.8√tFR bi ³ 12√tFR

•Thank you for your attention.