Embed Size (px)
Citation preview
Methods of Measuring Usual
Dietary Intake for Risk
Assessment
Amy F Subar, PhD, MPH, RDApplied Research Program
Risk Factor Monitoring and Methods Branch
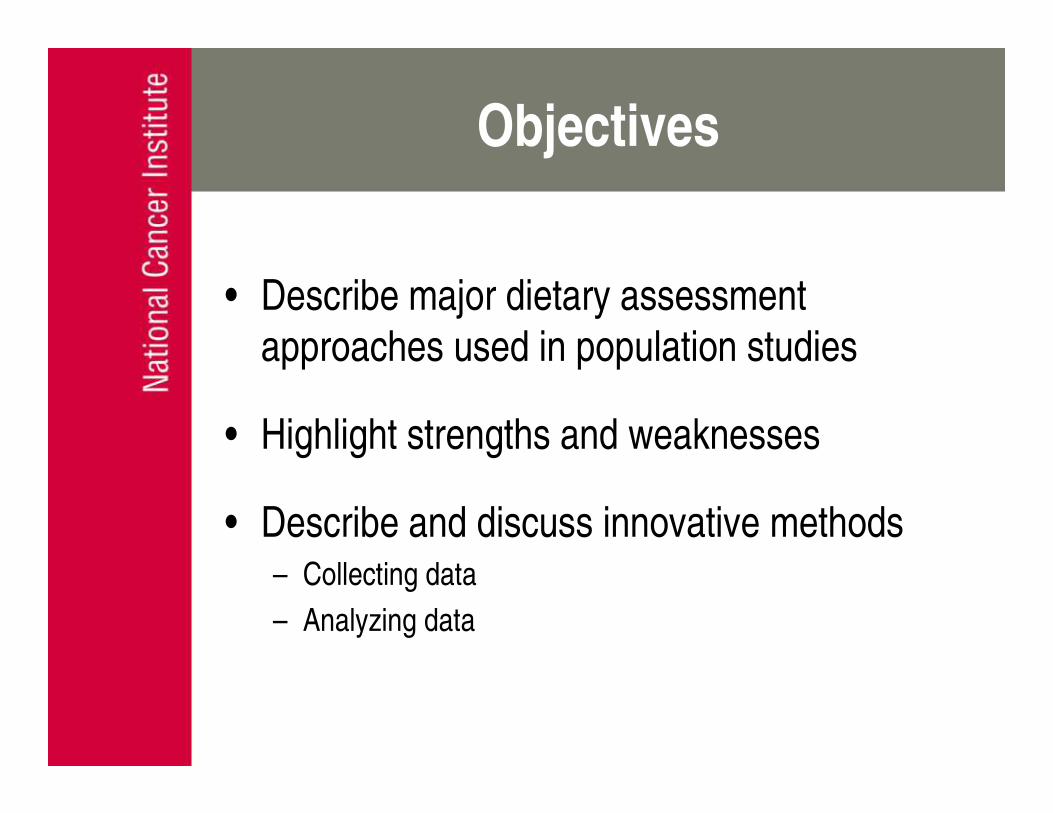
Objectives
• Describe major dietary assessment
approaches used in population studies
• Highlight strengths and weaknesses
• Describe and discuss innovative methods– Collecting data
– Analyzing data

I gather inaccurate data for a living. Luckily no one realizes it.
Your glass is half full.
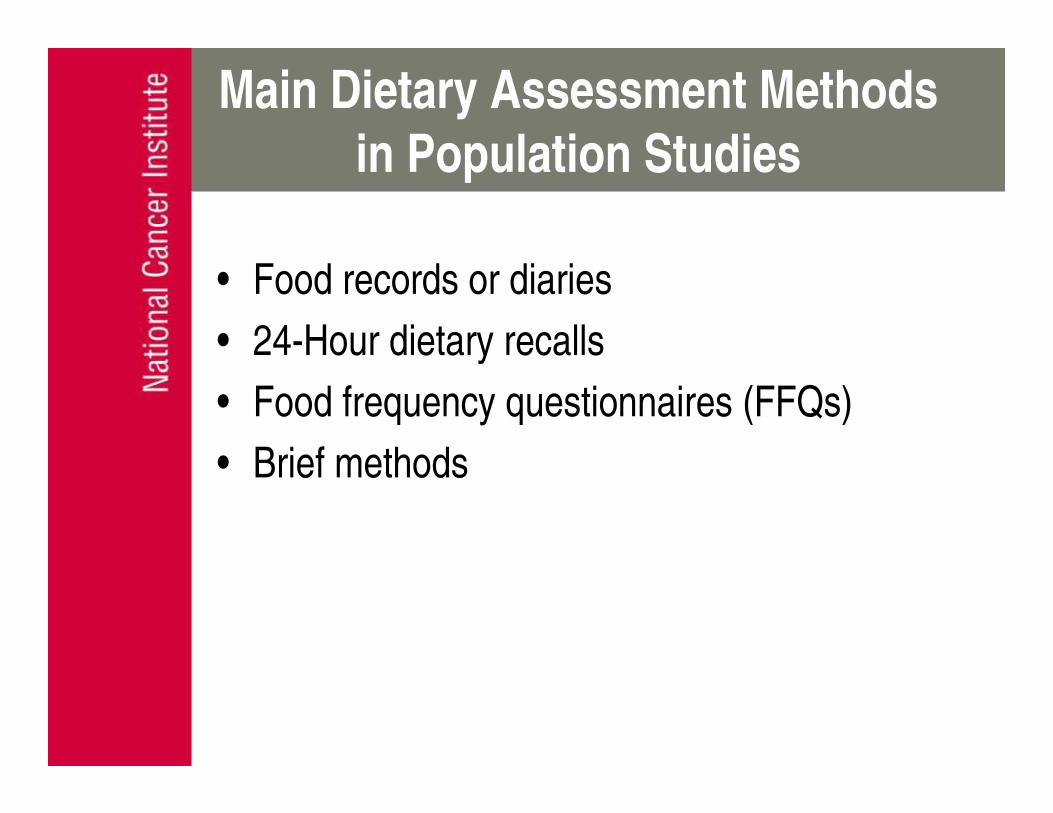
Main Dietary Assessment Methods
in Population Studies
• Food records or diaries
• 24-Hour dietary recalls
• Food frequency questionnaires (FFQs)
• Brief methods
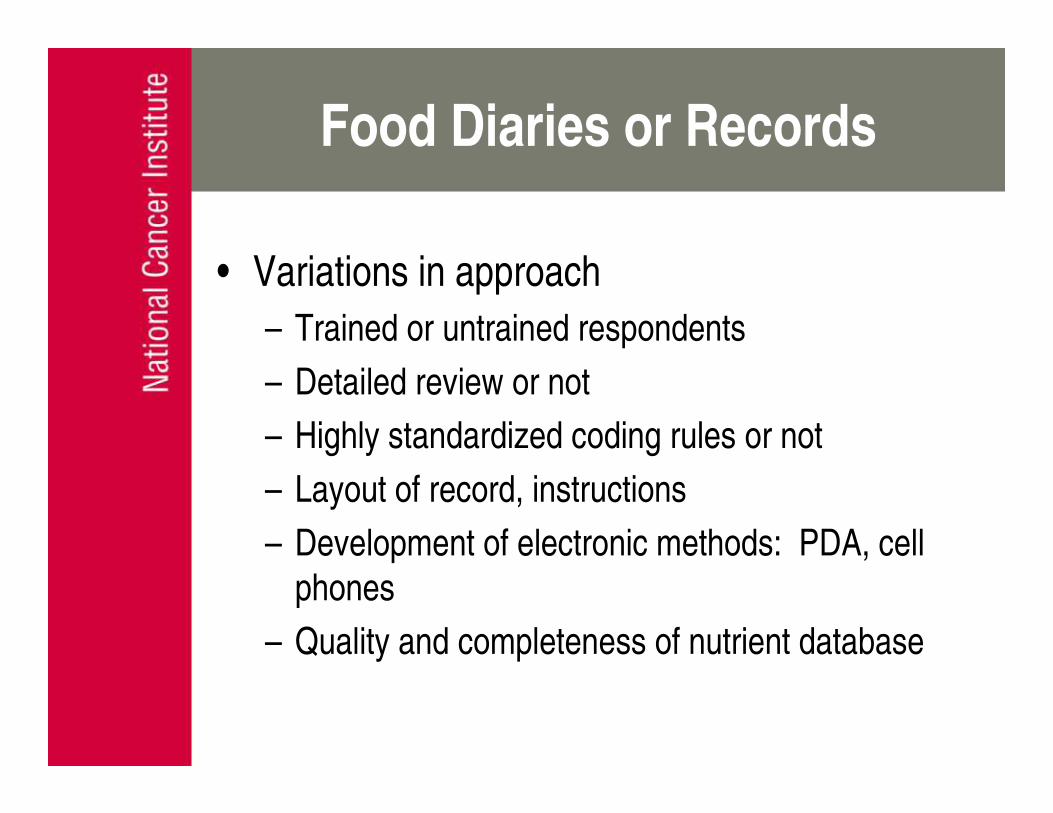
Food Diaries or Records
• Variations in approach
– Trained or untrained respondents
– Detailed review or not
– Highly standardized coding rules or not
– Layout of record, instructions
– Development of electronic methods: PDA, cell
phones
– Quality and completeness of nutrient database
Food Diaries or Records:
Strengths
• Intake is quantified, detailed
• Could be relatively accurate
• Data are rich
– Nutrients
– Cooking practices
– Meal and eating frequency
Food Records/Diaries:
Weaknesses• Recording influences diet (reactive tool)
– Biased measurement
• Requires literacy
• High respondent and investigator burden
• Multiple days required to estimate usual intake
• Sample selection bias
• Completion worse over time
• Underreporting is typical– Worse with overweight/obese
24-Hour Dietary Recalls
• Variations in approach
– Training of interviewers
– Standardization of probing questions
– Multiple passes through the day
– Computer vs. paper/pencil administration
– In-person vs. telephone
– Portion size models or measurement aids
– Quality and completeness of nutrient database
– Development of self-administered automated
systems
24-Hour Dietary Recall: Strengths
• Intake is quantified, detailed
• Data are rich– Nutrients
– Cooking practices
– Meal and eating frequency
• Does not affect eating behavior
• Lower sample selection bias than record– Literacy not required (if interviewer administered)
– Respondent burden relatively low
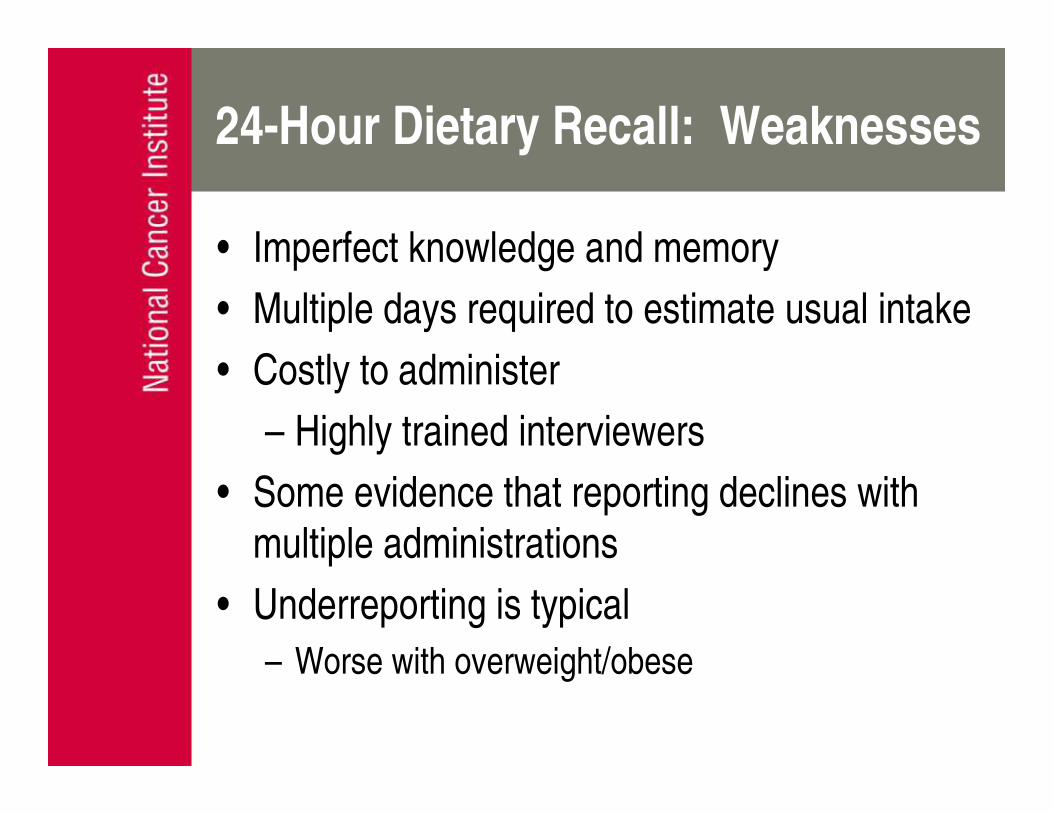
24-Hour Dietary Recall: Weaknesses
• Imperfect knowledge and memory
• Multiple days required to estimate usual intake
• Costly to administer
– Highly trained interviewers
• Some evidence that reporting declines with
multiple administrations
• Underreporting is typical
– Worse with overweight/obese
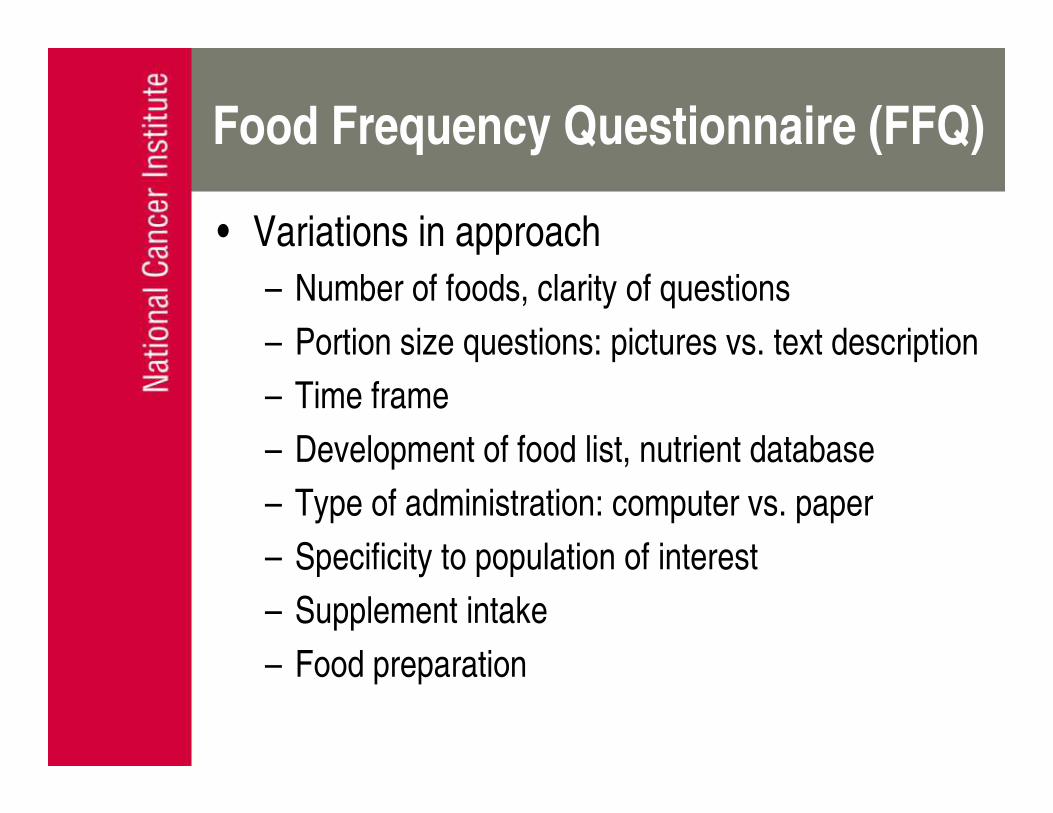
Food Frequency Questionnaire (FFQ)
• Variations in approach
– Number of foods, clarity of questions
– Portion size questions: pictures vs. text description
– Time frame
– Development of food list, nutrient database
– Type of administration: computer vs. paper
– Specificity to population of interest
– Supplement intake
– Food preparation
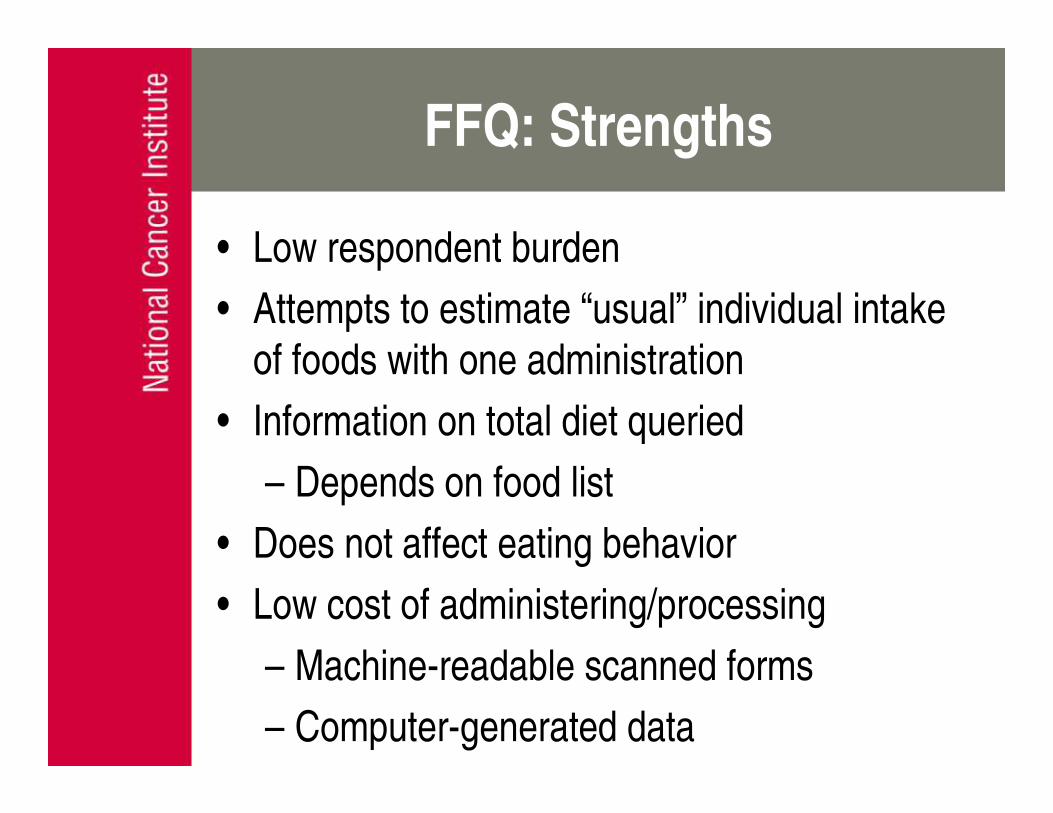
FFQ: Strengths
• Low respondent burden
• Attempts to estimate “usual” individual intake
of foods with one administration
• Information on total diet queried
– Depends on food list
• Does not affect eating behavior
• Low cost of administering/processing
– Machine-readable scanned forms
– Computer-generated data
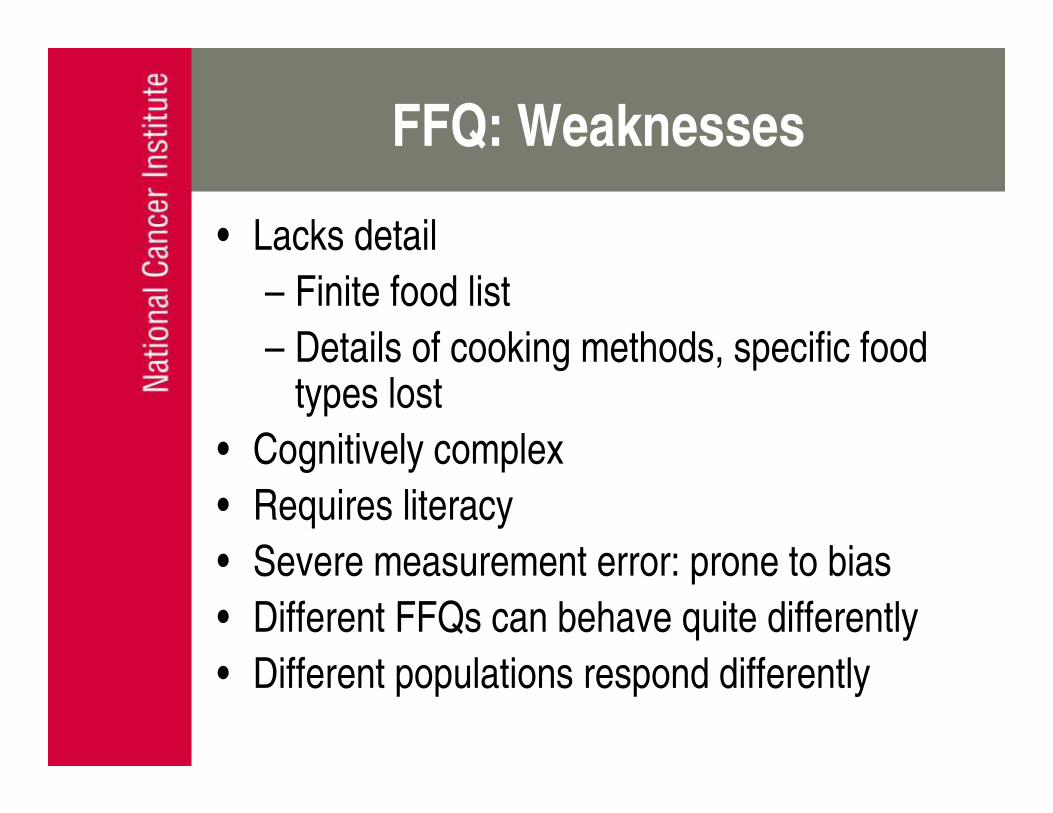
FFQ: Weaknesses
• Lacks detail
– Finite food list
– Details of cooking methods, specific food types lost
• Cognitively complex
• Requires literacy
• Severe measurement error: prone to bias
• Different FFQs can behave quite differently
• Different populations respond differently
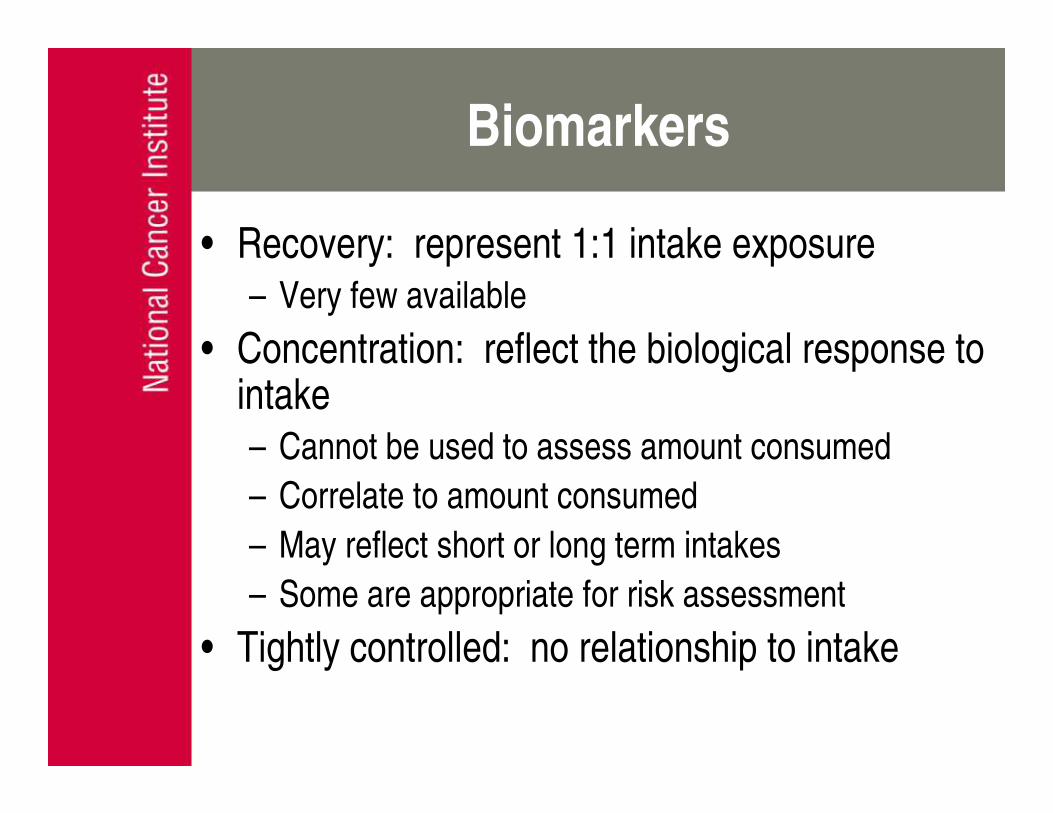
Biomarkers
• Recovery: represent 1:1 intake exposure – Very few available
• Concentration: reflect the biological response to intake– Cannot be used to assess amount consumed
– Correlate to amount consumed
– May reflect short or long term intakes
– Some are appropriate for risk assessment
• Tightly controlled: no relationship to intake

Isn’t There ANYTHING
Better Than This?
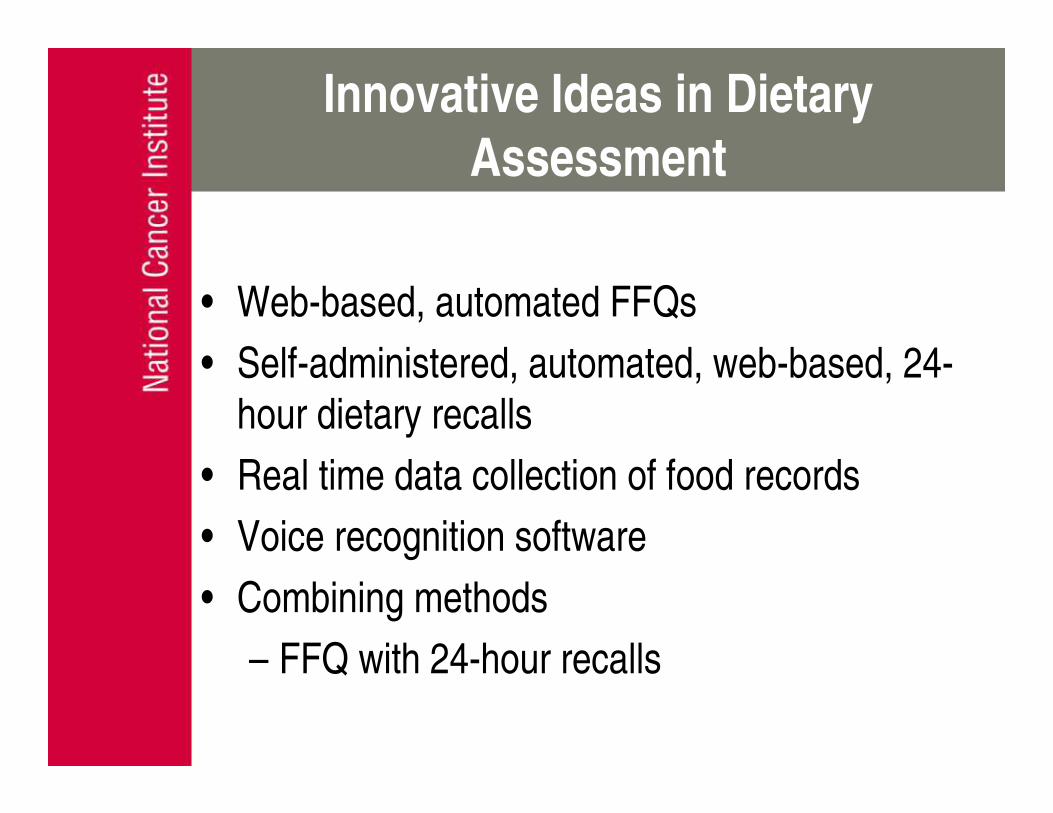
Innovative Ideas in Dietary
Assessment
• Web-based, automated FFQs
• Self-administered, automated, web-based, 24-
hour dietary recalls
• Real time data collection of food records
• Voice recognition software
• Combining methods
– FFQ with 24-hour recalls
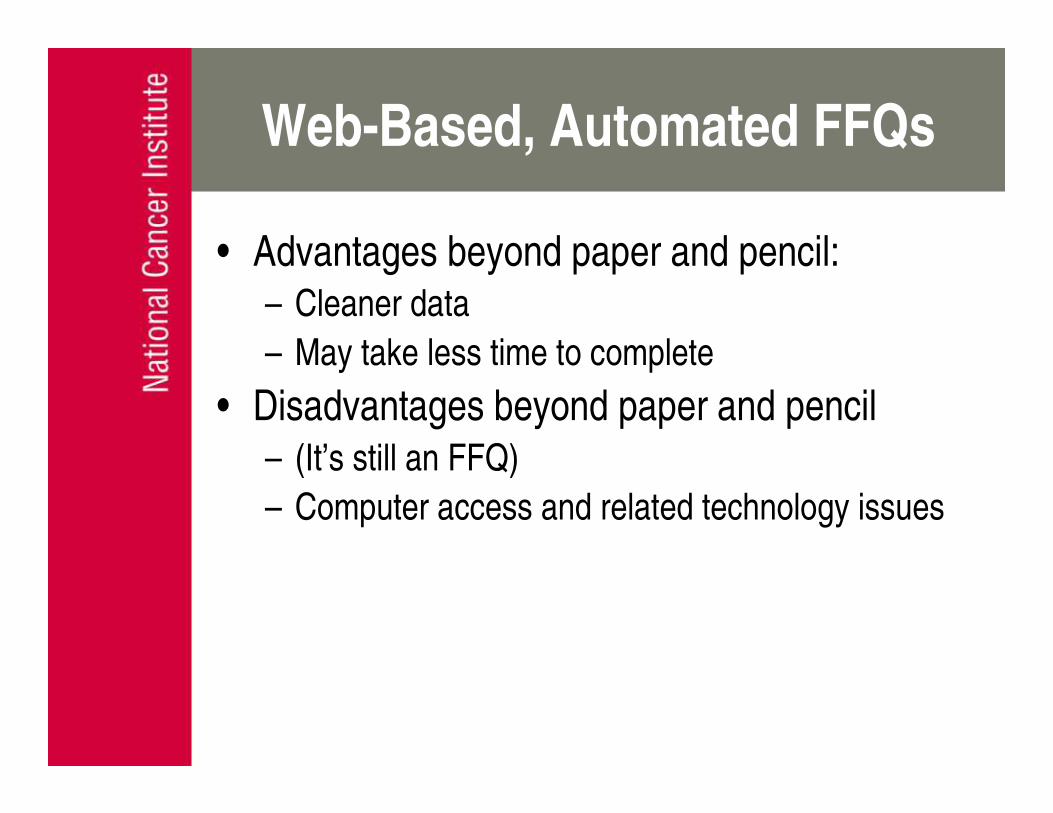
Web-Based, Automated FFQs
• Advantages beyond paper and pencil:– Cleaner data
– May take less time to complete
• Disadvantages beyond paper and pencil– (It’s still an FFQ)
– Computer access and related technology issues
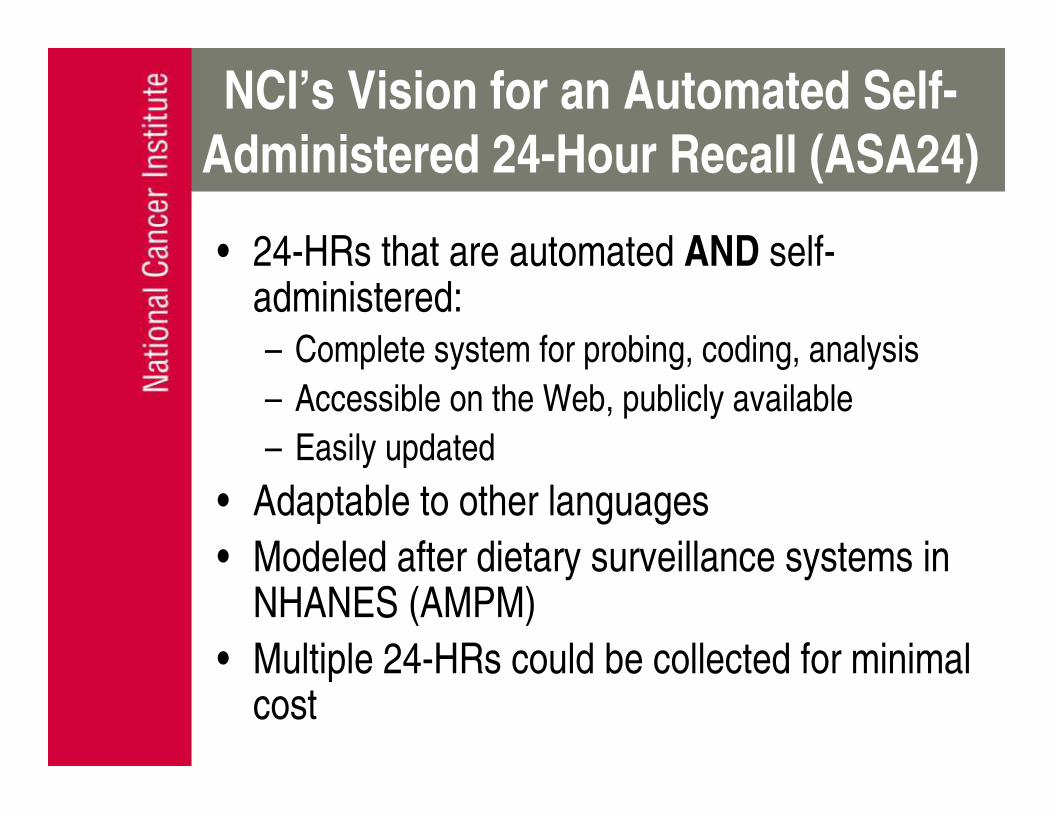
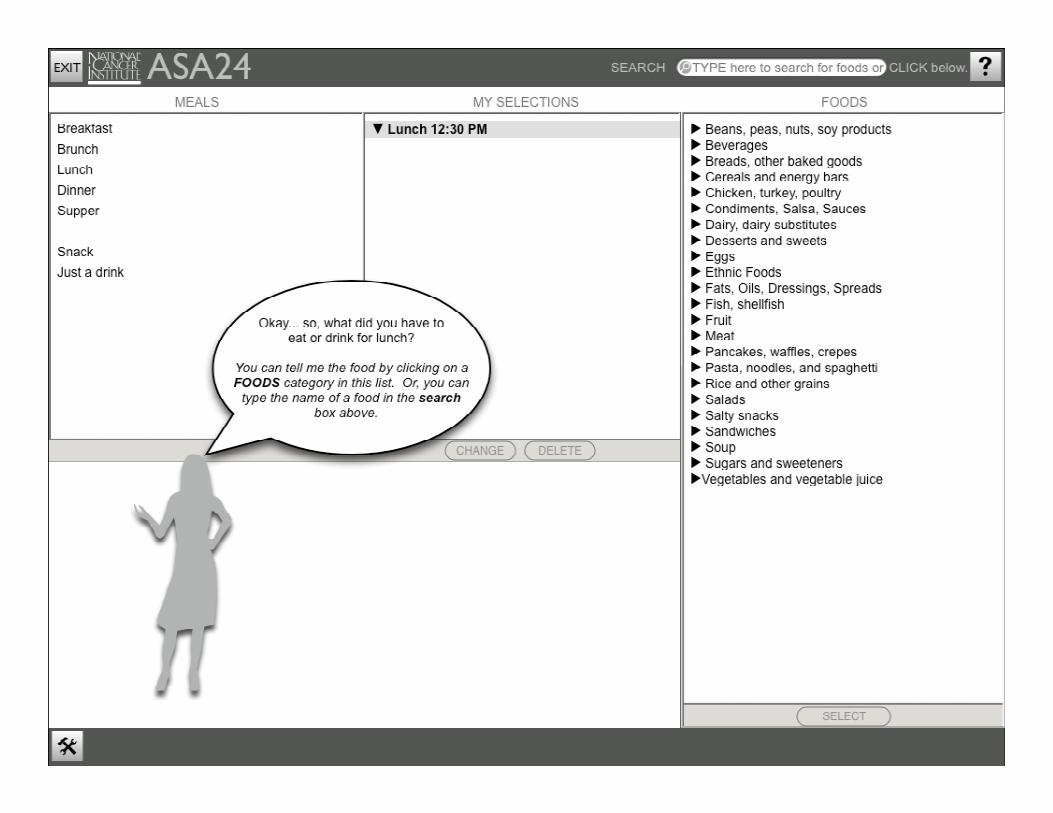
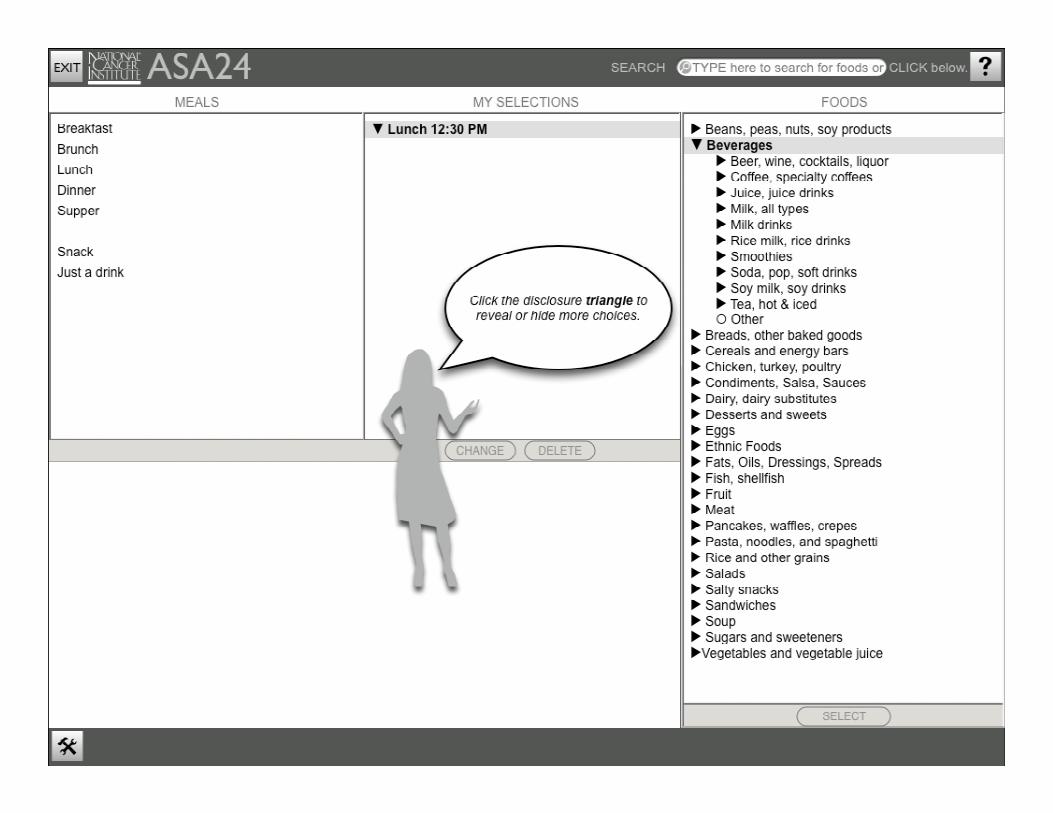
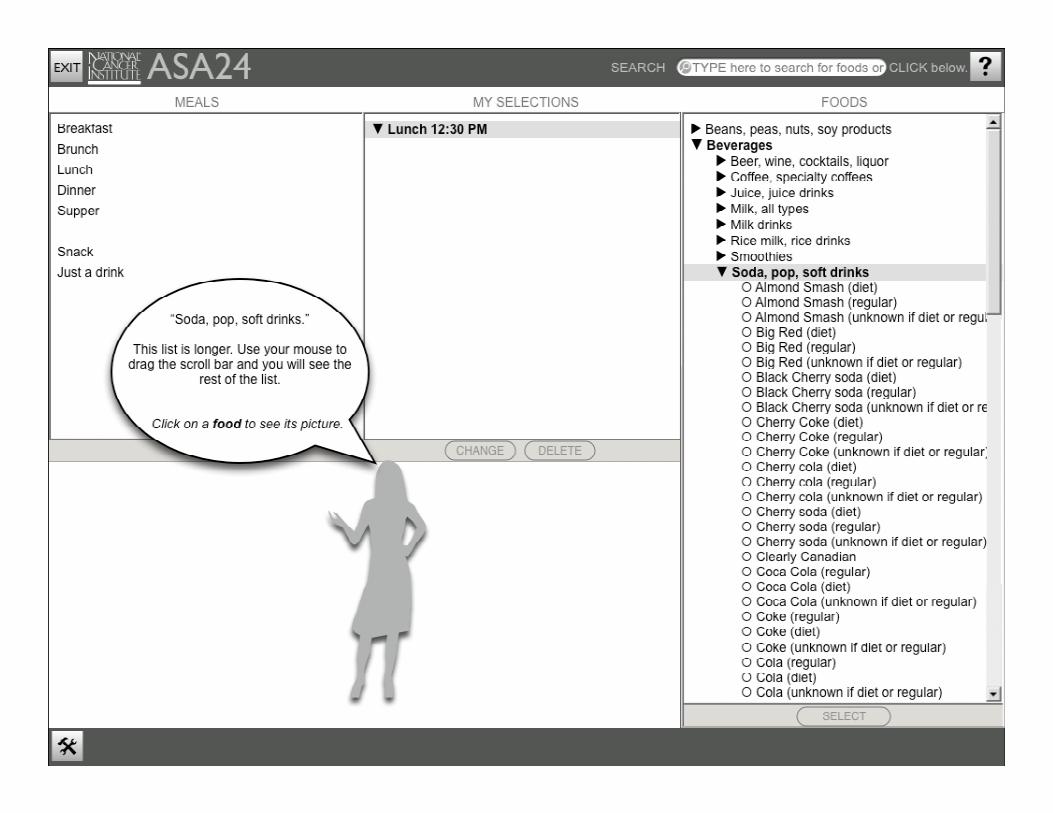
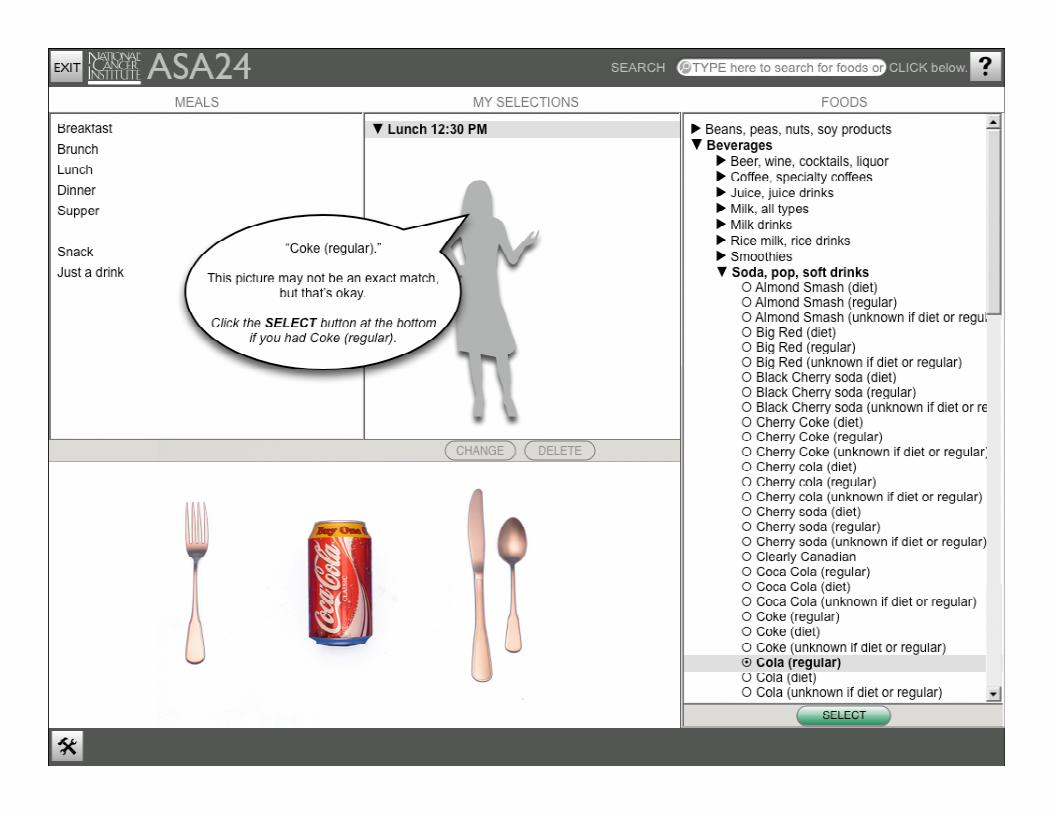
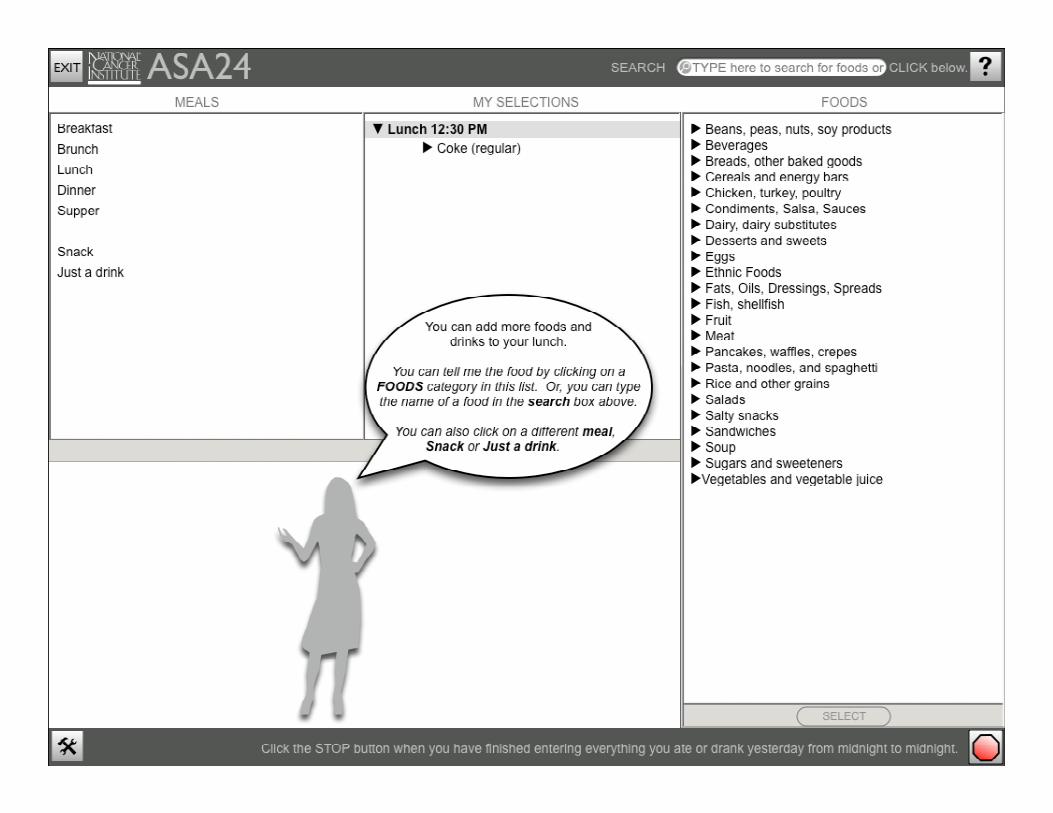
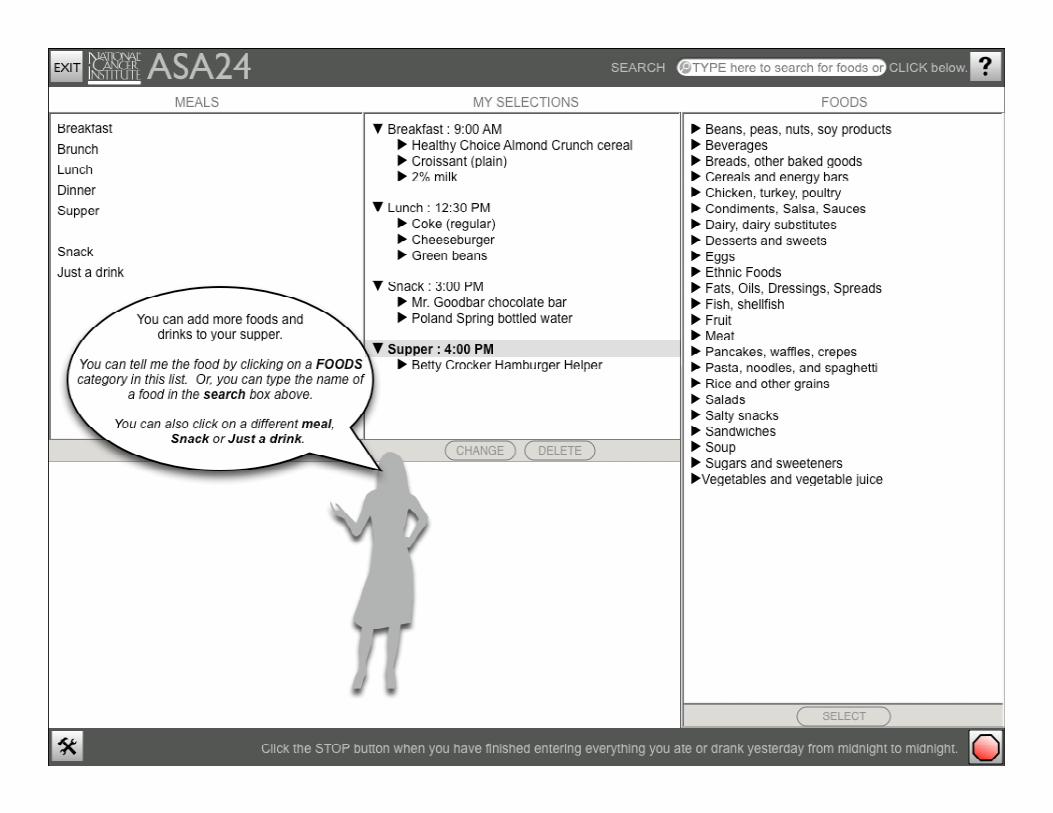
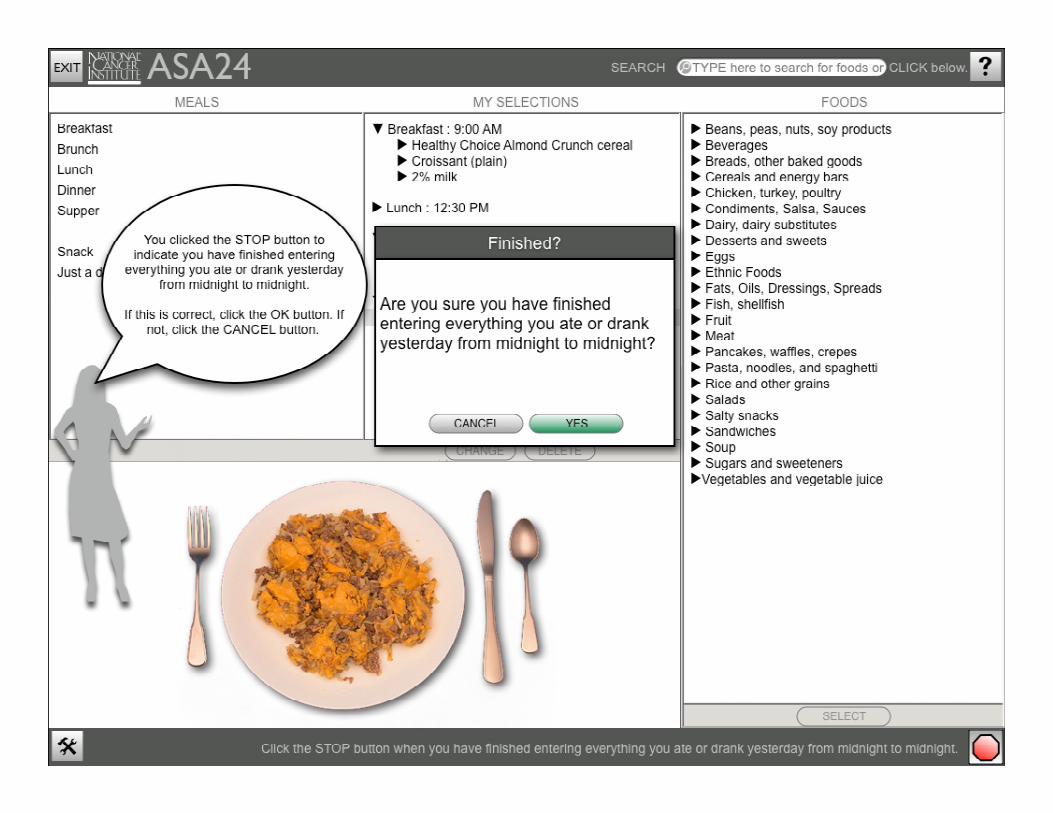
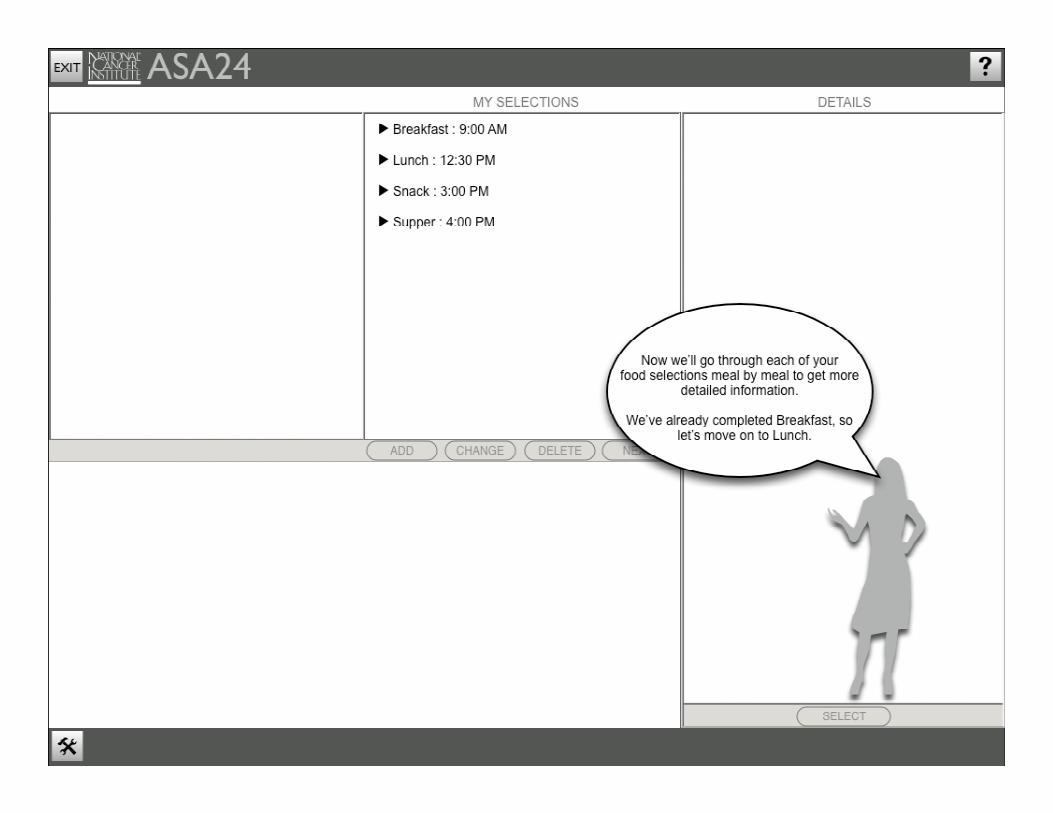
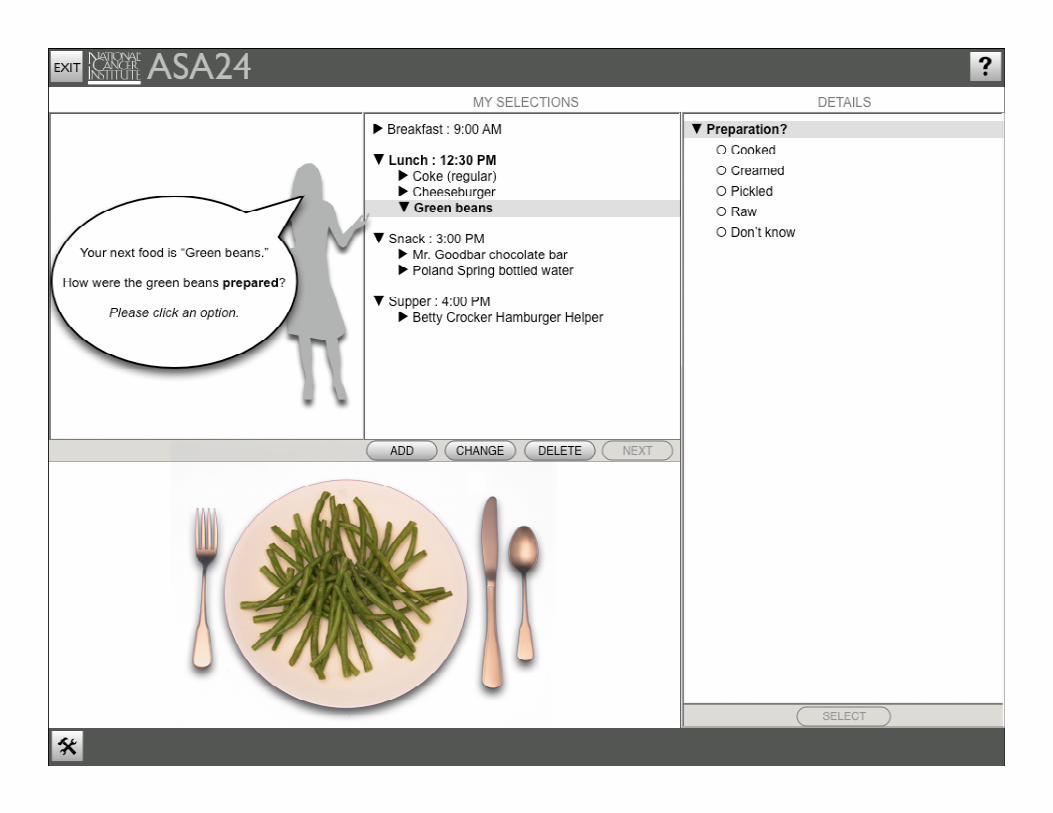
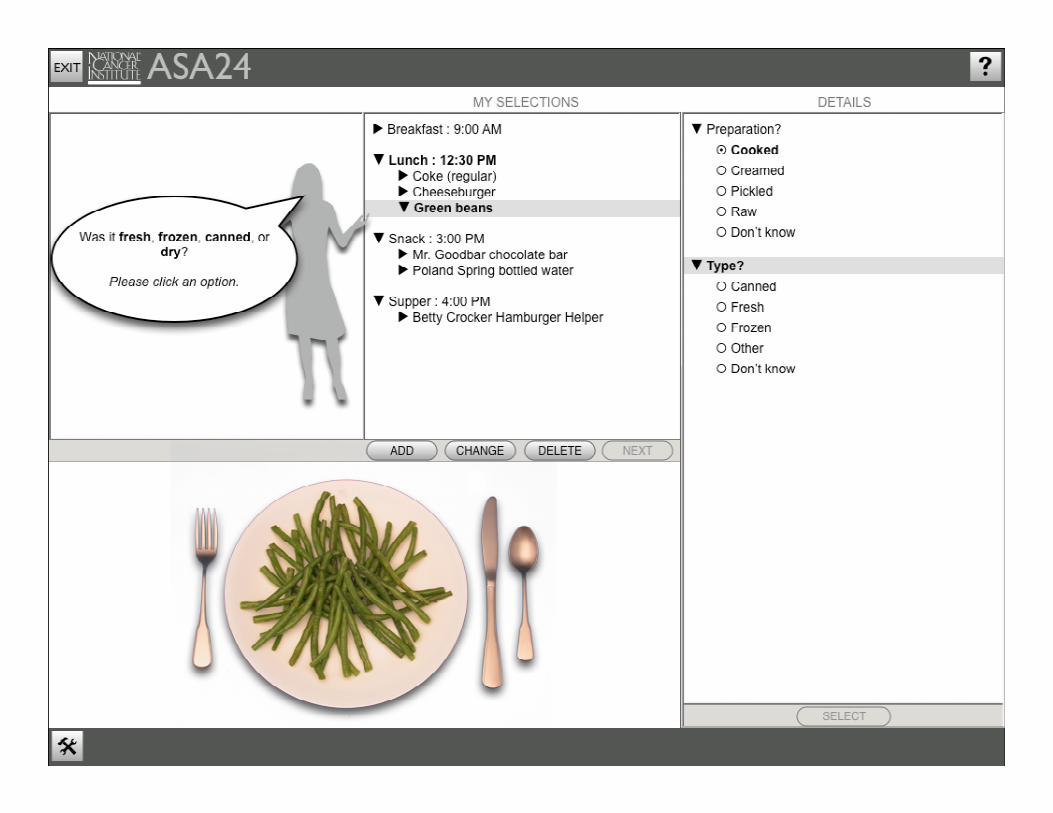
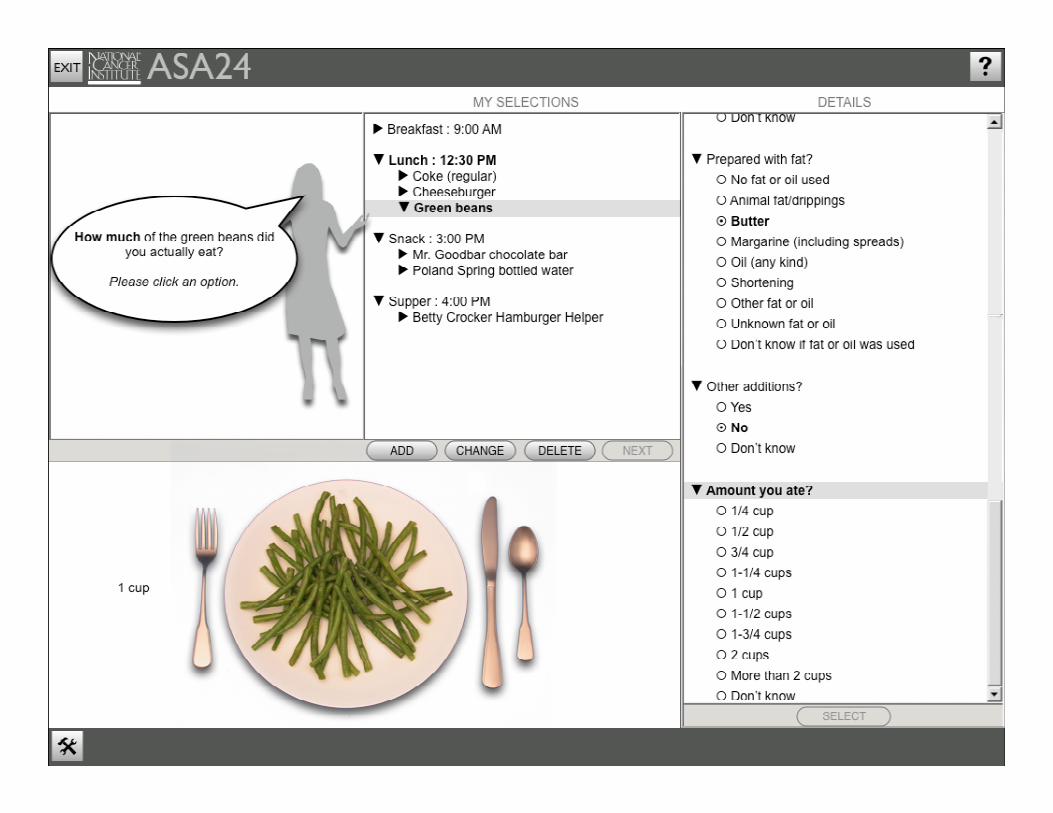
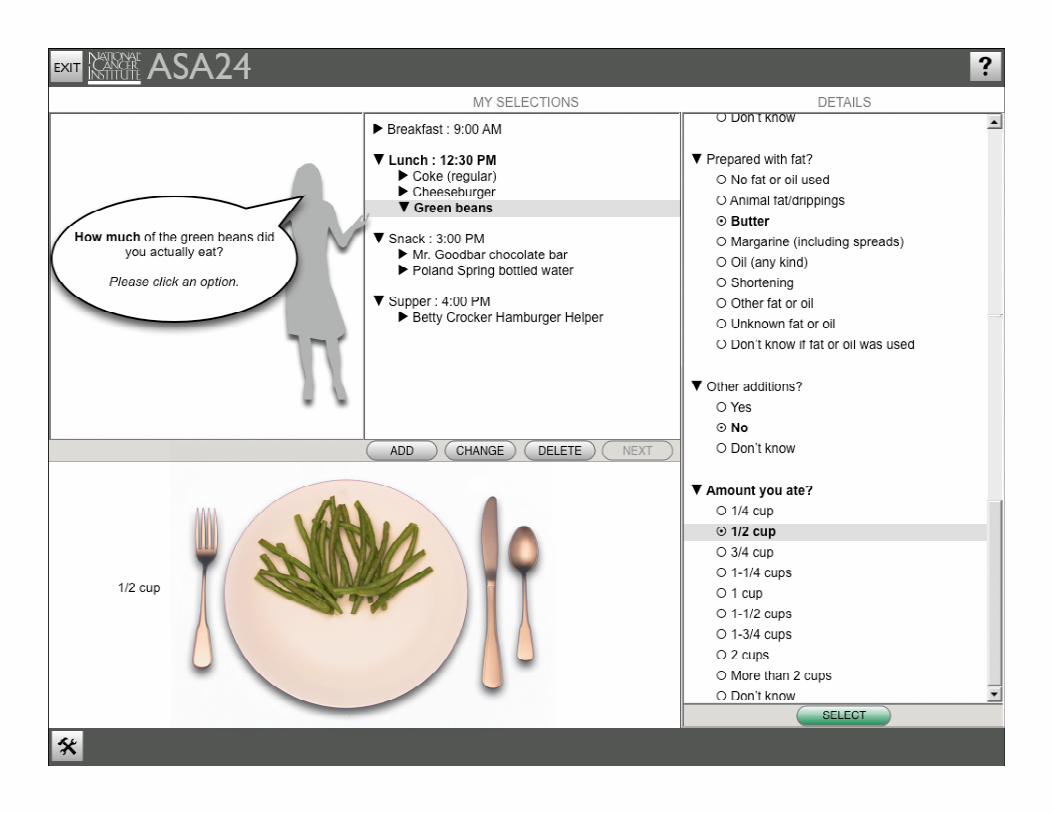
NCI’s Vision for an Automated Self-
Administered 24-Hour Recall (ASA24)
• 24-HRs that are automated AND self-administered:– Complete system for probing, coding, analysis
– Accessible on the Web, publicly available
– Easily updated
• Adaptable to other languages
• Modeled after dietary surveillance systems in NHANES (AMPM)
• Multiple 24-HRs could be collected for minimal cost
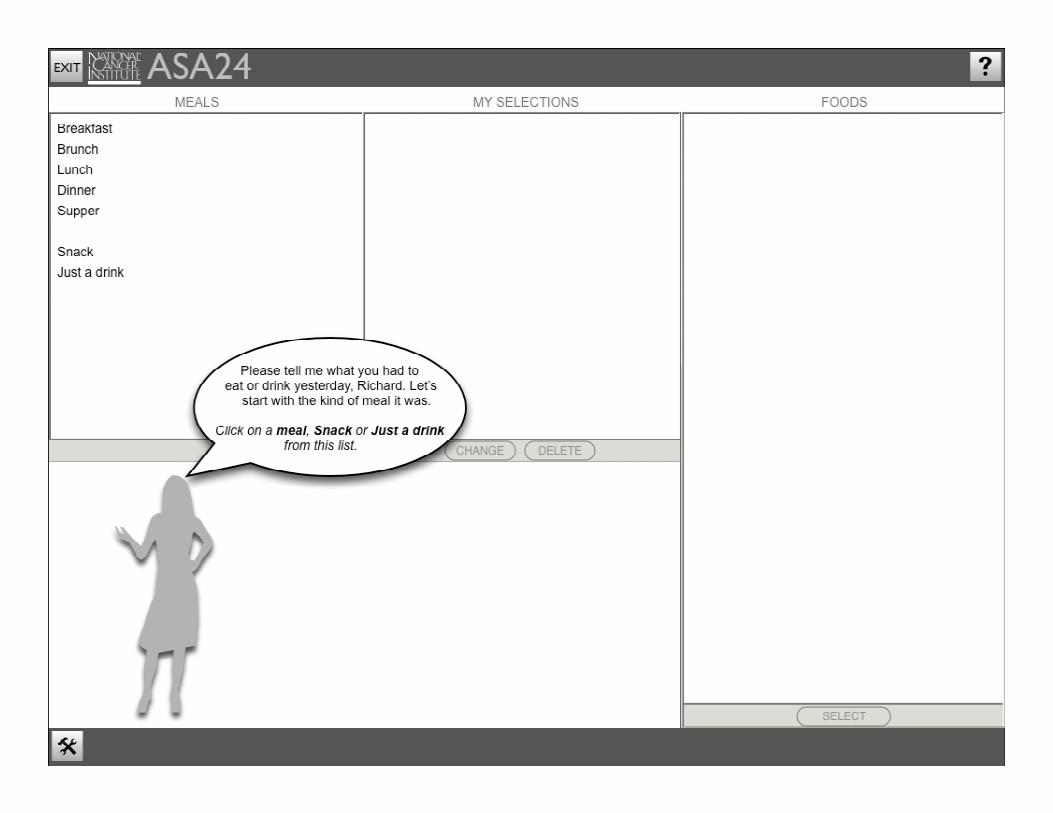
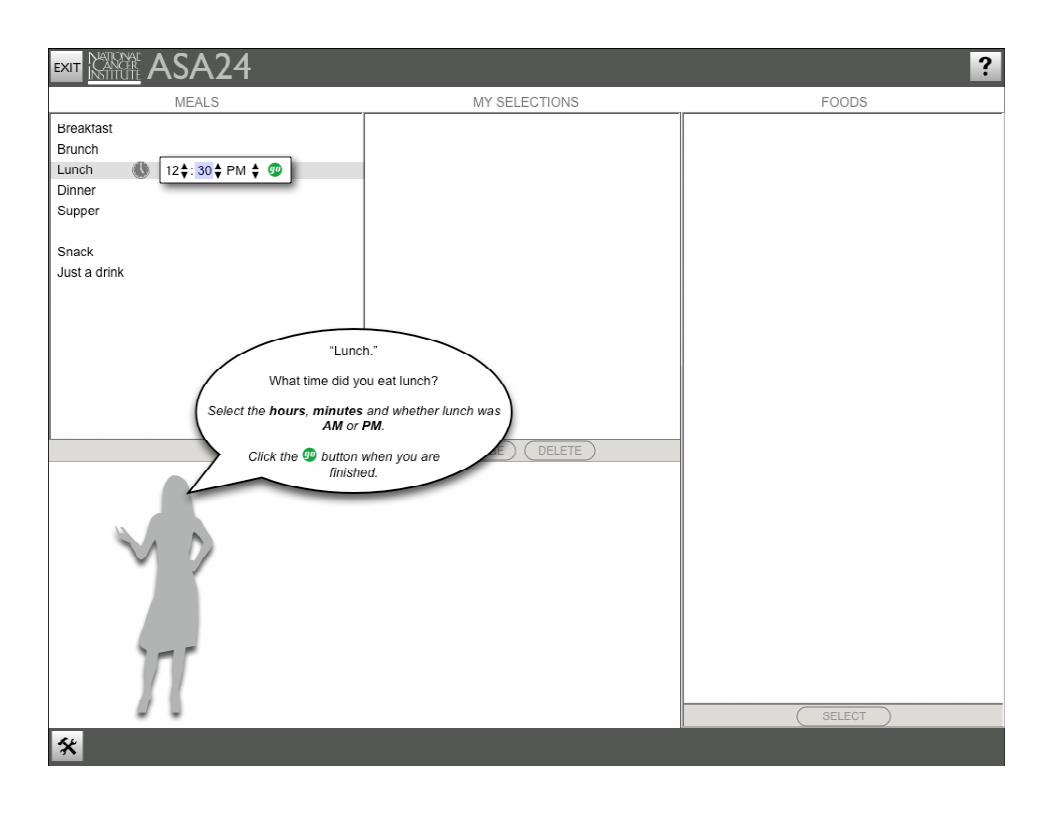
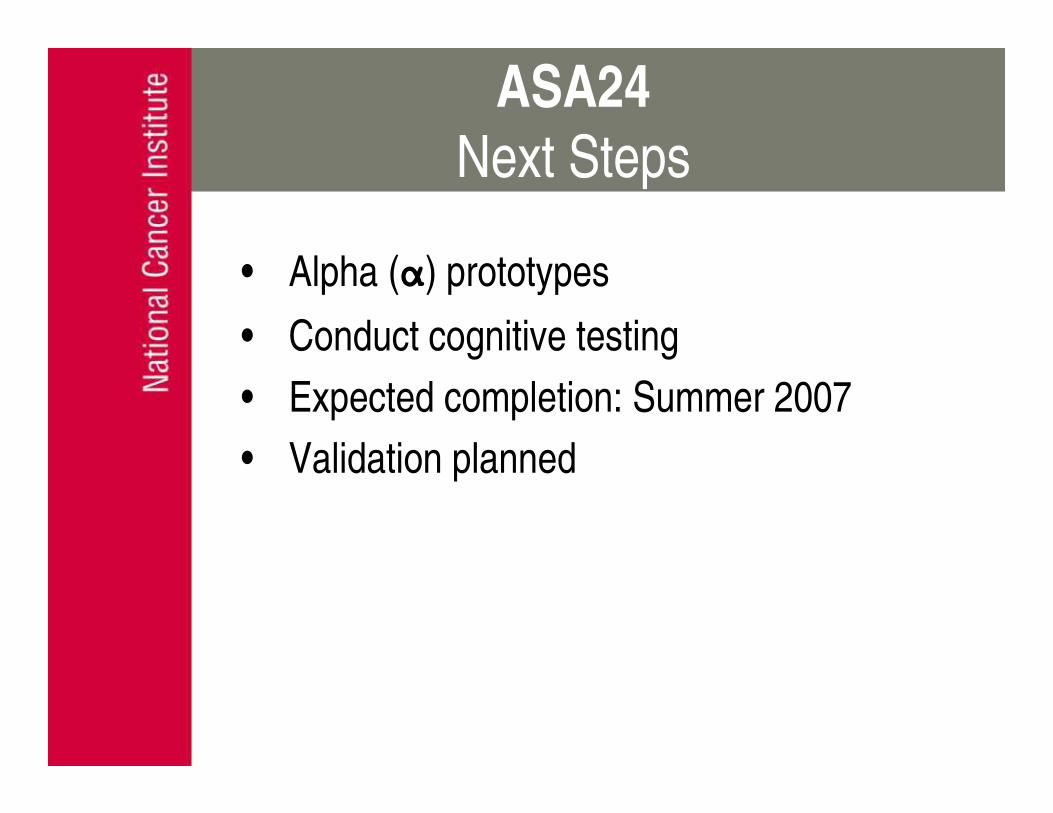
ASA24
Next Steps
• Alpha (α) prototypes
• Conduct cognitive testing
• Expected completion: Summer 2007
• Validation planned
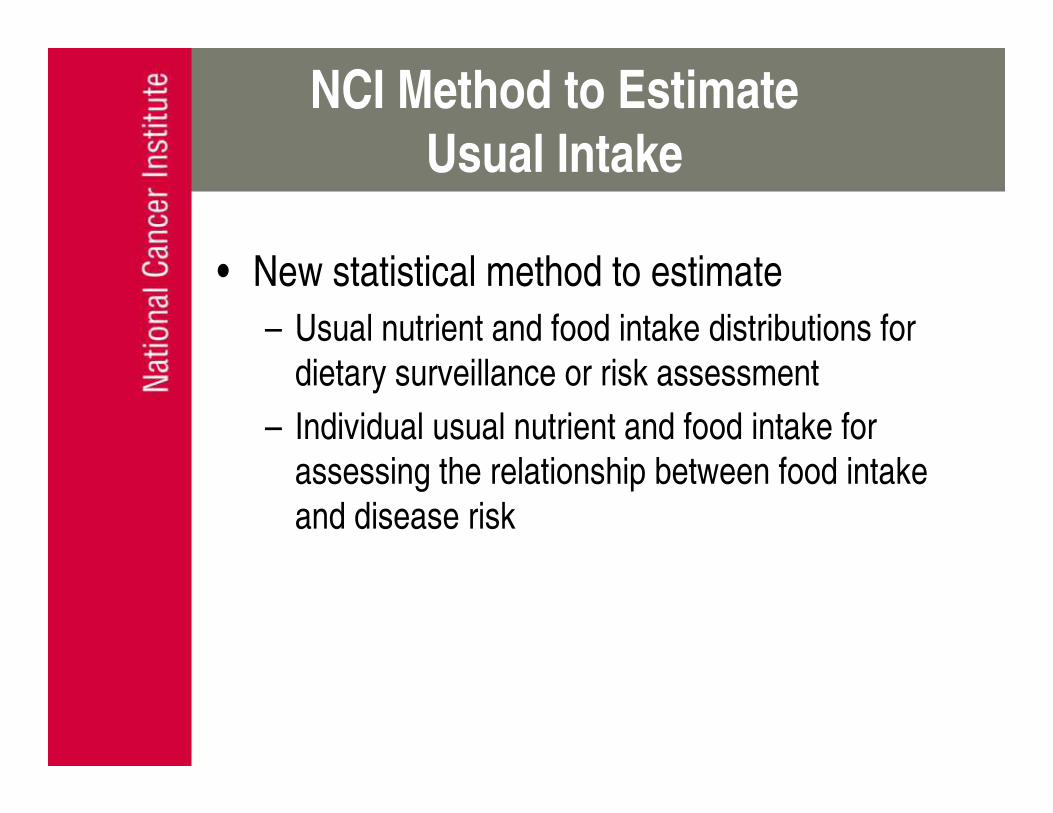
NCI Method to Estimate
Usual Intake
• New statistical method to estimate
– Usual nutrient and food intake distributions for
dietary surveillance or risk assessment
– Individual usual nutrient and food intake for
assessing the relationship between food intake
and disease risk
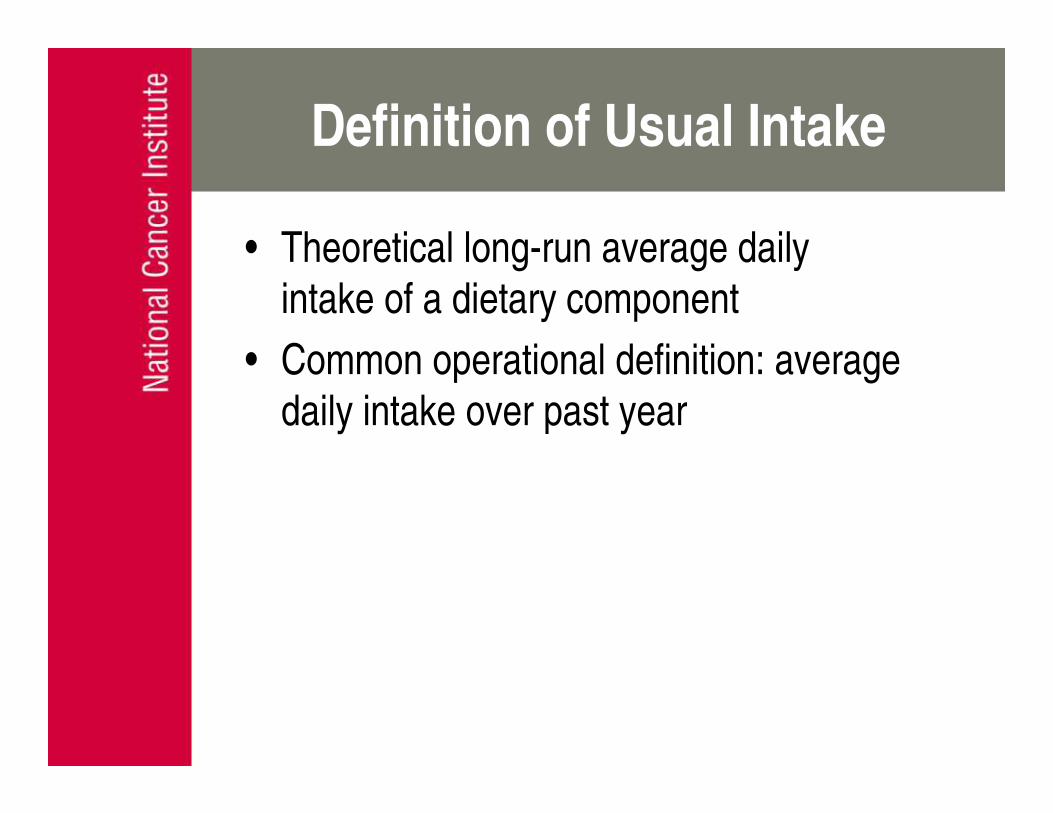
Definition of Usual Intake
• Theoretical long-run average daily
intake of a dietary component
• Common operational definition: average
daily intake over past year
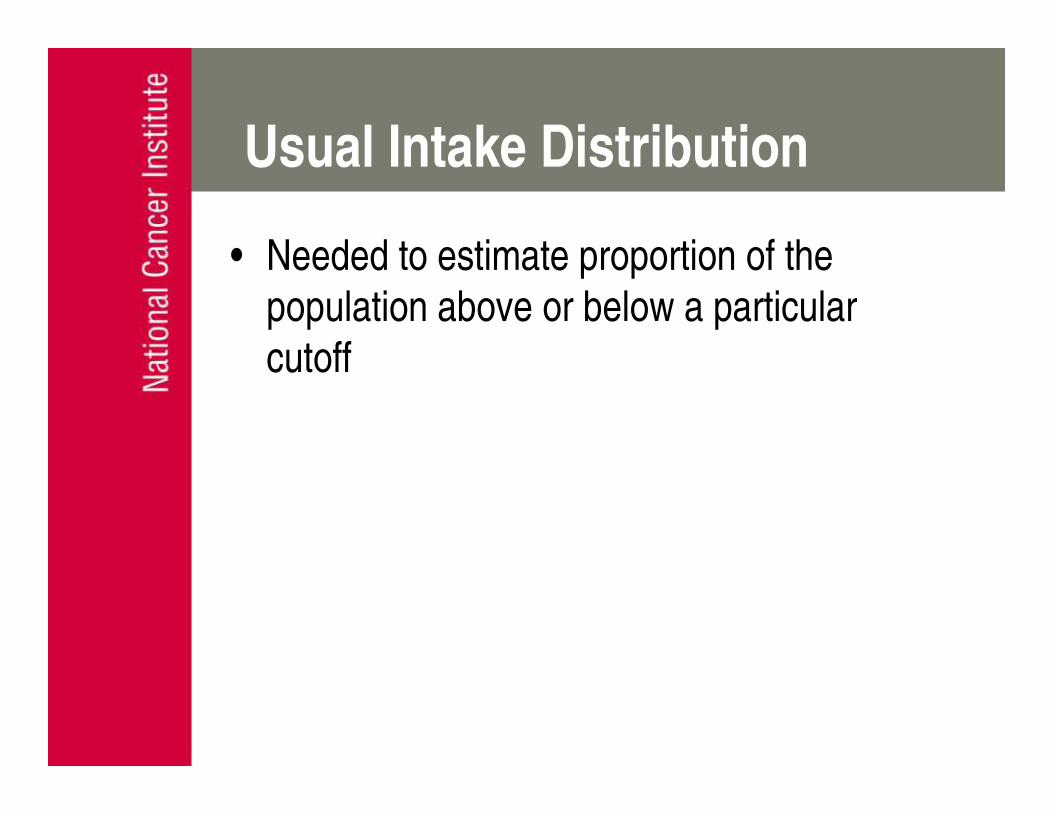
Usual Intake Distribution
for the Population• Needed to estimate proportion of the
population above or below a particular
cutoff
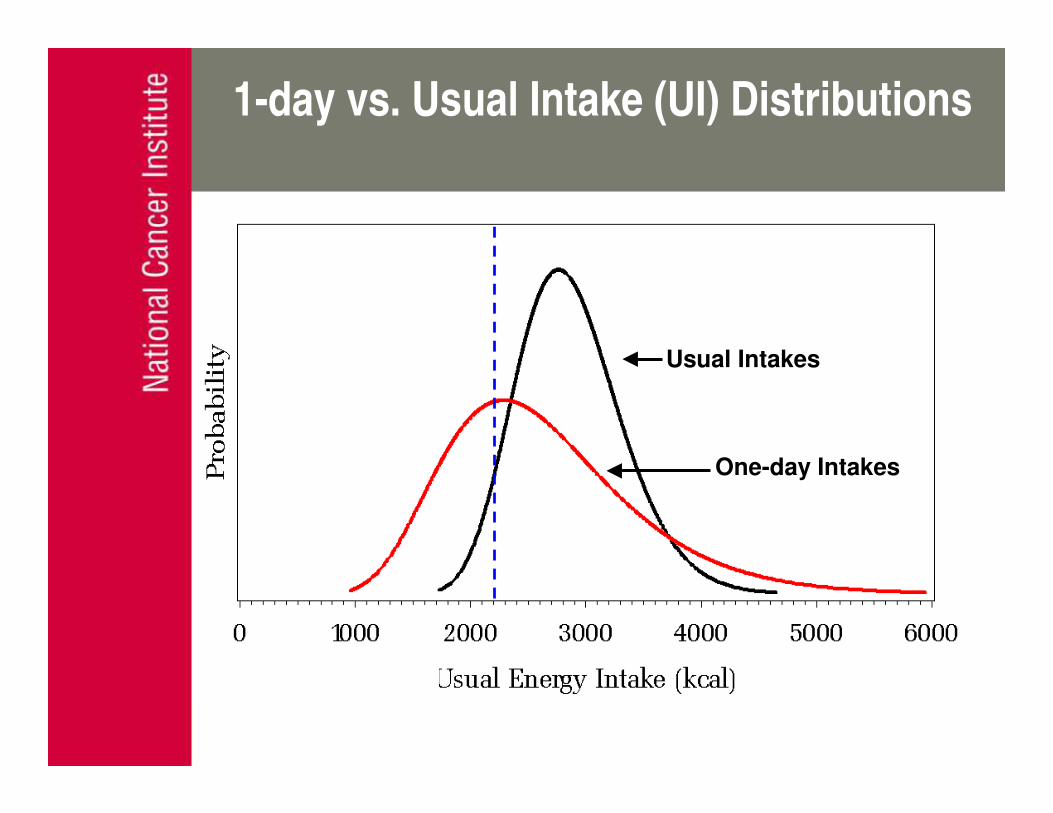
1-day vs. Usual Intake (UI) Distributions
Usual Intakes
One-day Intakes
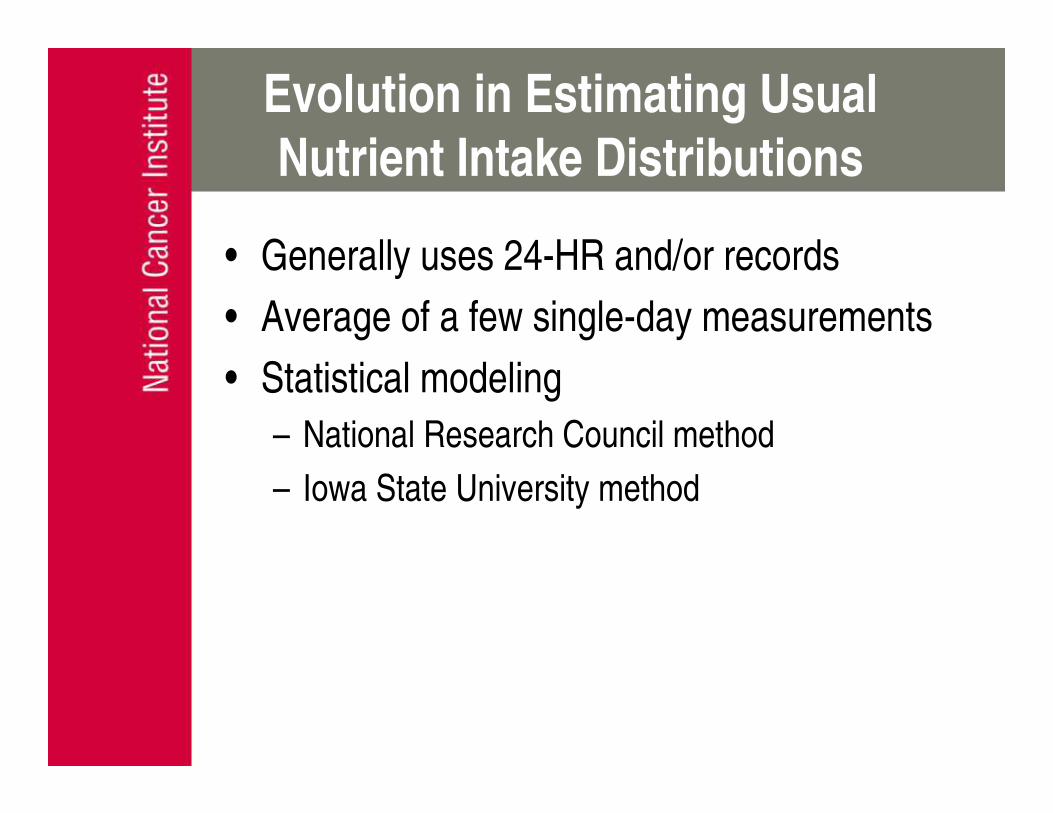
Evolution in Estimating Usual
Nutrient Intake Distributions
• Generally uses 24-HR and/or records
• Average of a few single-day measurements
• Statistical modeling
– National Research Council method
– Iowa State University method
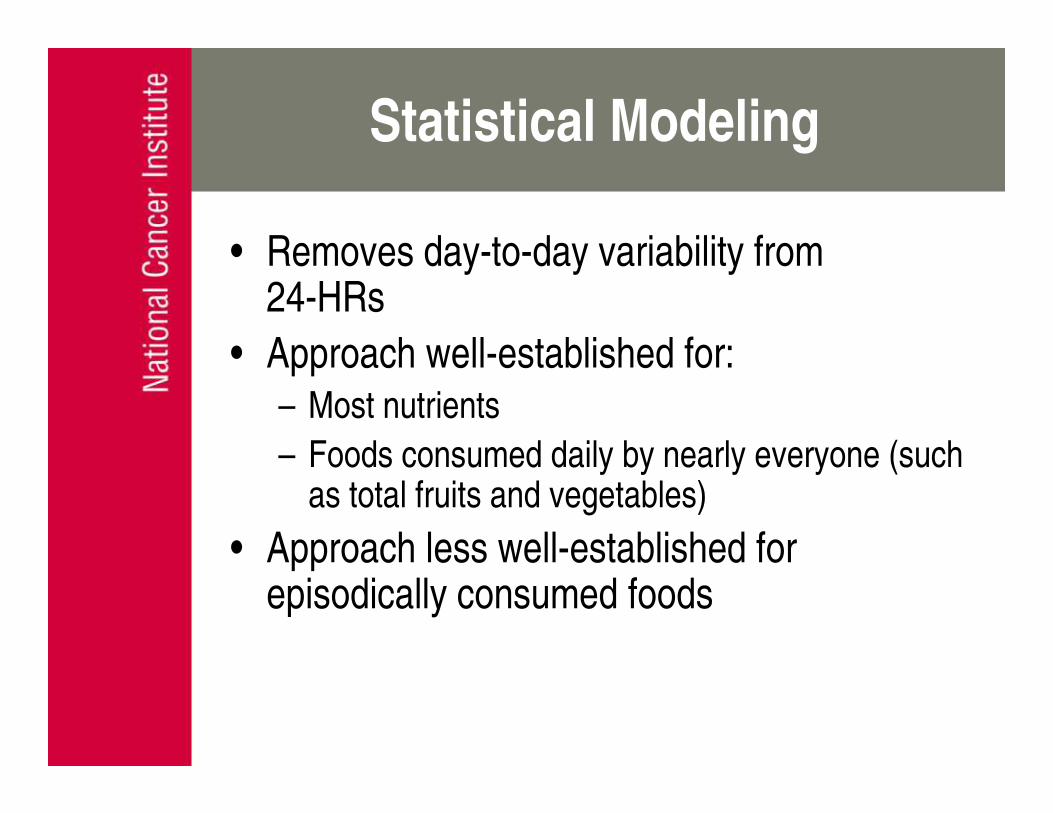
Statistical Modeling
• Removes day-to-day variability from 24-HRs
• Approach well-established for:– Most nutrients
– Foods consumed daily by nearly everyone (such as total fruits and vegetables)
• Approach less well-established for episodically consumed foods
Estimating UI Distributions of
Episodically Consumed Foods
• Small number of 24-HRs makes this difficult
– large number of “zero” intakes observed
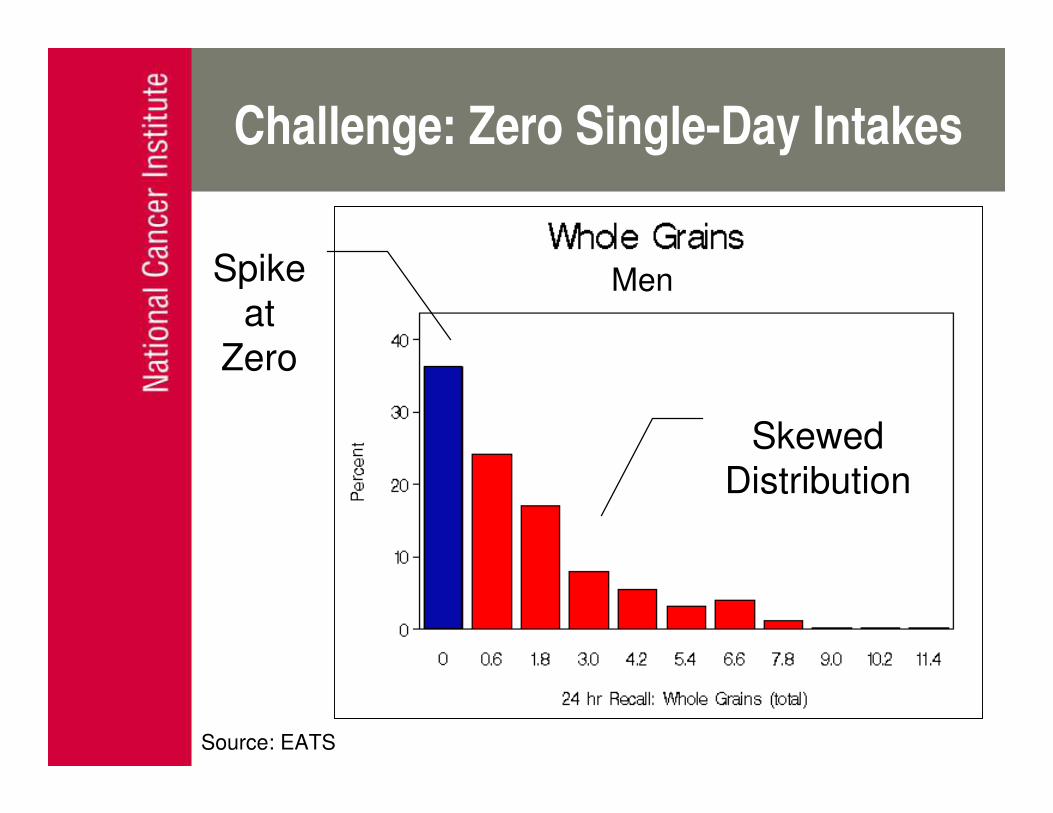
Challenge: Zero Single-Day Intakes
Spike
at
Zero
Skewed
Distribution
Men
Source: EATS
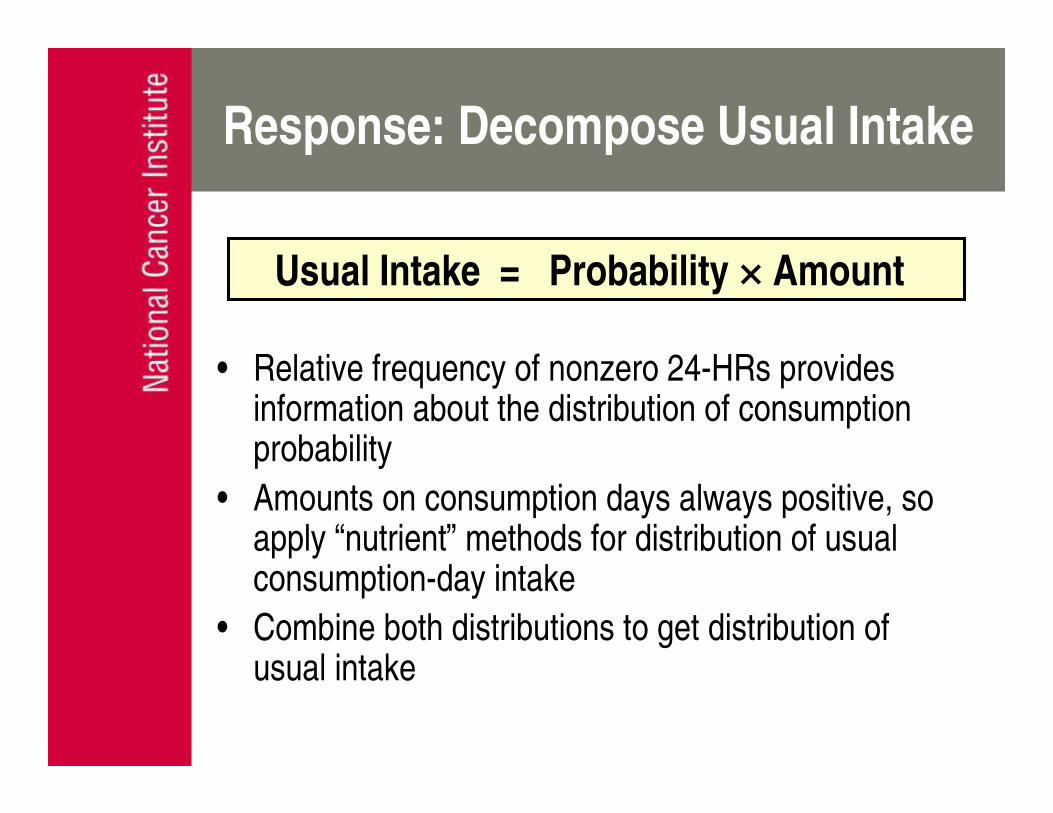
Response: Decompose Usual Intake
Probability × Amount=Usual Intake
• Relative frequency of nonzero 24-HRs provides information about the distribution of consumption probability
• Amounts on consumption days always positive, so apply “nutrient” methods for distribution of usual consumption-day intake
• Combine both distributions to get distribution of usual intake
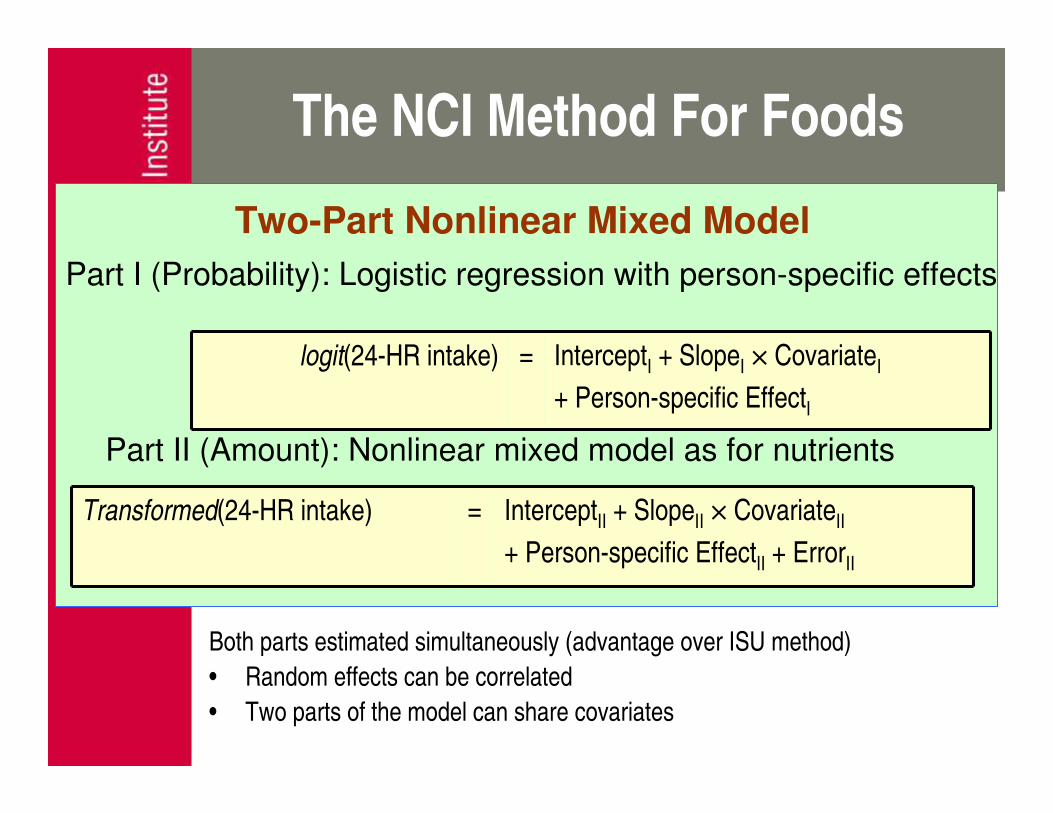
The NCI Method For Foods
InterceptI + SlopeI × CovariateI
+ Person-specific EffectI
=logit(24-HR intake)
InterceptII + SlopeII × CovariateII
+ Person-specific EffectII + ErrorII
=Transformed(24-HR intake)
Part I (Probability): Logistic regression with person-specific effects
Part II (Amount): Nonlinear mixed model as for nutrients
Both parts estimated simultaneously (advantage over ISU method)
• Random effects can be correlated
• Two parts of the model can share covariates
Two-Part Nonlinear Mixed Model
NCI Method: Efficiently Accounts for
Effects of Covariates on Usual Intake
• Separate estimation of usual intake distributions for subgroups may be impractical/inefficient
• Use of covariates in NCI method allows direct evaluation of covariate effects on usual intake, in addition to correction for measurement error
Food Propensity Questionnaire
(FPQ)
• FFQ that does not query portion size
• Directly queries long-term frequency of
intake
• Relatively low respondent/interviewer
burden
• Can be used as a covariate in NCI model
Rationale for Using an FPQ as a
Covariate
• Responses to FPQ are related to information from 24-HR– Probability
– Amount
• Based on these relationships, FPQ responses act as covariates in model estimating individual usual intake from 24-HRs
Can We Trust the FPQ?
• Concerns about bias in FFQs when used to measure absolute intake
• In this case, FPQ being used:– In conjunction with another instrument
– As covariate in model to predict probability and amount of food consumed
– Nutrient or food group estimates from the FPQ are not used
Relationships Between
Diet and Outcomes
• Challenge: usual intake is unobservable
– have 24-HR intakes or FFQs instead
• Typical Response: Fit disease model to
average of 24-HR intakes or FFQ
• NCI method suggests that at least 2 recalls
and a FPQ might be useful
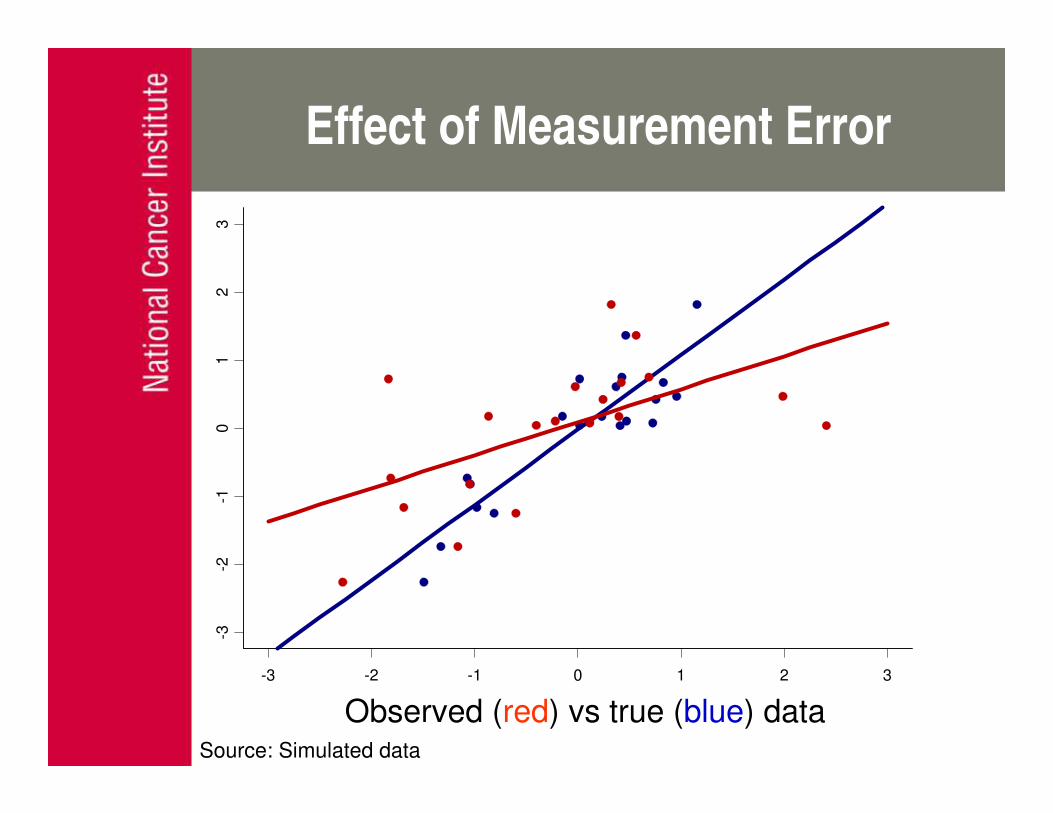
Effect of Measurement Error
-3 -2 -1 0 1 2 3
-3-2
-10
12
3
Observed (red) vs true (blue) dataSource: Simulated data
Effect of Measurement Error
• Typically measurement error causes two things:
– bias in the estimated exposure effect (flattened or
attenuated true slope)
– more variation about the flattened line, thus loss of
statistical power for testing significance of the
exposure effect
Summary: NCI Method
• Important assumption that 24-HR is an unbiased instrument for measuring usual intake
• Misreporting of energy on 24-HR suggests misreporting of some foods
• For foods reported with bias on 24-HR, estimates of usual intake will be biased
• FPQ may improve estimation
• Development of user-friendly software for this purpose
• Requires collaboration between statisticians and nutritionists
• October Journal of the American Dietetic Assn: 3 papers on this work: Dodd et al, Subar et al, Tooze et al
Conclusion
• A good estimate of usual intake is necessary for
risk assessment
• Usual intake cannot be observed
– Can be modeled

GOOD LUCK TO US ALL!