Embed Size (px)
Citation preview

CALL FOR PAPERS Methods in cell physiology
Microarray-based comparison of three amplification methods for nanogramamounts of total RNA
Ruchira Singh,1* Rajanikanth J. Maganti,1* Sairam V. Jabba,1* Martin Wang,2
Glenn Deng,2 Joe Don Heath,2 Nurith Kurn,2 and Philine Wangemann1
1Department of Anatomy & Physiology, Kansas State University, Manhattan, Kansas;and 2NuGEN Technologies, Inc., San Carlos, California
Submitted 25 May 2004; accepted in final form 17 December 2004
Singh, Ruchira, Rajanikanth J. Maganti, Sairam V. Jabba,Martin Wang, Glenn Deng, Joe Don Heath, Nurith Kurn, andPhiline Wangemann. Microarray-based comparison of three ampli-fication methods for nanogram amounts of total RNA. Am J PhysiolCell Physiol 288: C1179–C1189, 2005. First published December 22,2004; doi:10.1152/ajpcell.00258.2004.—Gene expression profilingusing microarrays requires microgram amounts of RNA, which limitsits direct application for the study of nanogram RNA samples ob-tained using microdissection, laser capture microscopy, or needlebiopsy. A novel system based on Ribo-SPIA technology (RS, Ova-tion-Biotin amplification and labeling system) was recently intro-duced. The utility of the RS system, an optimized prototype systemfor picogram RNA samples (pRS), and two T7-based systems involv-ing one or two rounds of amplification (OneRA, Standard Protocol, orTwoRA, Small Sample Prototcol, version II) were evaluated in thepresent study. Mouse kidney (MK) and mouse universal reference(MUR) RNA samples, 0.3 ng to 10 �g, were analyzed using high-density Affymetrix Mouse Genome 430 2.0 GeneChip arrays. Callconcordance between replicates, correlations of signal intensity, sig-nal intensity ratios, and minimal fold increase necessary for signifi-cance were determined. All systems amplified partially overlappingsets of genes with similar signal intensity correlations. pRS amplifiedthe highest number of genes from 10-ng RNA samples. We detected24 of 26 genes verified by RT-PCR in samples prepared using pRS.TwoRA yielded somewhat higher call concordances than did RS andpRS (91.8% vs. 89.3% and 88.1%, respectively). Although all targetpreparation methods were suitable, pRS amplified the highest numberof targets and was found to be suitable for amplification of as little as0.3 ng of total RNA. In addition, RS and pRS were faster and simplerto use than the T7-based methods and resulted in the generation ofcDNA, which is more stable than cRNA.
gene expression microarray analysis; microdissection; nucleic acidamplification techniques
MICROARRAYS PROVIDE A WIDELY accepted method for gene ex-pression profiling on a genome-wide scale. Affymetrix Gene-Chip microarrays (Affymetrix, Santa Clara, CA) consist ofoligonucleotide probes presented on a chip for hybridization tobiotin-labeled cDNA or cRNA targets prepared from sampleRNA (11). Hybridization is detected as fluorescence afterbinding to labeled streptavidin. Gene expression profiling us-ing GeneChip arrays requires amplification of sample RNA,
regardless of the available amounts of RNA. The Affymetrixstandard protocol, which is well established for the preparationof cRNA targets from microgram amounts of total RNA,consists of one round of T7 amplification (OneRA) to generatebiotin-labeled targets. Gene expression profiling of small tissuesamples obtained by microdissection, laser capture micros-copy, or needle biopsy that yield mere nanograms of RNArequires amplification of either the hybridization signal (8, 20)or the starting material. Methods for amplification of thestarting material consist of exponential amplification by PCR(7, 13, 16, 22) and linear amplification with multiple rounds ofT7 polymerase (1, 3, 4, 9, 15, 21). T7-based linear amplifica-tion systems have been used widely for amplification andproduction of cRNA targets. The Affymetrix small sampleprotocol consists of two rounds of amplification (TwoRA),including biotin labeling, and is a well-established, T7-basedmethod for the preparation of cRNA targets from nanogramamounts of RNA (4). A novel linear amplification method,Ribo-SPIA, which enables mRNA amplification in a simpleand rapid procedure, was recently introduced (NuGEN Tech-nologies, San Carlos CA) (2, 5). In the present study, twosystems based on this novel amplification technology, theOvation Biotin System (RS) and a prototype system designedfor target preparation from subnanogram level total RNAsamples (picogram Ribo-SPIA prototype system, or pRS),were evaluated and compared with the T7-based one- andtwo-round amplification systems. The Ribo-SPIA systemshave several advantages. Sample preparation can be performedwithin 1 day, which is much faster than the 20� h required forTwoRA. Furthermore, RS and pRS yield cDNA, which is morestable than cRNA and eliminates biases in microarray resultsdue to RNA degradation (19). The present study was designedto evaluate target populations generated by the Ribo-SPIA-based and T7-based systems. Targets were analyzed usinghigh-density Affymetrix Mouse Genome 430 2.0 GeneChiparrays. Evaluation was based on direct comparisons and dif-ferential gene expression and included call concordances, sig-nal correlations, and sensitivities. Detection of a limited set oftargets was verified using RT-PCR.
* R. Singh, R. J. Maganti, and S. V. Jabba contributed equally to this work.Address for reprint requests and other correspondence: P. Wangemann,
Dept. of Anatomy & Physiology, College of Veterinary Medicine, KansasState Univ., 1600 Denison Ave., Coles Hall 205, Manhattan, KS 66506(E-mail: [email protected]).
The costs of publication of this article were defrayed in part by the paymentof page charges. The article must therefore be hereby marked “advertisement”in accordance with 18 U.S.C. Section 1734 solely to indicate this fact.
Am J Physiol Cell Physiol 288: C1179–C1189, 2005.First published December 22, 2004; doi:10.1152/ajpcell.00258.2004.
0363-6143/05 $8.00 Copyright © 2005 the American Physiological Societyhttp://www.ajpcell.org C1179
on May 23, 2006
ajpcell.physiology.orgD
ownloaded from

MATERIALS AND METHODS
Target Preparation
Mouse kidney (MK) total RNA (Ambion, Austin, TX) and mouseuniversal reference (MUR) total RNA (Stratagene, La Jolla, CA) werechosen as sources for RNA to minimize biological variation andinterexperimental differences. Targets were prepared using four dif-ferent methods: 1) one round of amplification (OneRA), 2) two roundsof amplification (TwoRA), 3) Ribo-SPIA linear amplification with theOvation biotin system (RS), and 4) Ribo-SPIA linear amplificationwith the picogram Ribo-SPIA prototype system (pRS).
One round of amplification. Starting with 10 �g of total RNA,cRNA targets were prepared using OneRA [standard protocol, versionVII; Affymetrix (see https://www.affymetrix.com/support/downloads/manuals/expression_s2_manual.pdf)] (Fig. 1). Briefly, RNA was tran-scribed into cDNA using reverse transcriptase with a T7 primer thatcontains a promoter for DNA-dependent RNA polymerase (3, 21).After RNase H-mediated second-strand cDNA synthesis, the double-stranded cDNA (dscDNA) was purified and served as a template inthe subsequent in vitro transcription (IVT) reaction. The IVT reactionwas performed in the presence of T7 RNA polymerase and a biotin-ylated nucleotide analog-ribonucleotide mix for cRNA amplification
and biotin labeling. The biotinylated cRNA targets were then cleanedup, fragmented, and hybridized to GeneChip expression arrays.
Two rounds of amplification. Starting with 10 ng of total RNA,cRNA targets were generated using TwoRA (small sample protocol,version II; Affymetrix) (Fig. 1). Briefly, in vitro transcribed cRNAgenerated by the first round of amplification (see above) was subjectedto a second round of amplification. cRNA was transcribed into cDNAusing random primers and subsequently removed using heat-inducedfragmentation. A second cDNA strand was synthesized using aT7-primer. A second cDNA strand was synthesized using a T7 primerto generate a dscDNA template containing the T7 promoter sequence.The resulting dscDNA was then amplified and labeled using a bio-tinylated nucleotide analog-ribonucleotide mix in the second IVTreaction. The labeled cRNA was then cleaned up, fragmented, andhybridized to GeneChip expression arrays.
Ribo-SPIA linear amplification. Ribo-SPIA-based RNA amplifica-tions and target preparations were performed according to the manu-facturer’s instructions (picogram Ribo-SPIA prototype system, pRSand Ovation Biotin System, RS; see http://www.nugeninc.com/technology/index.shtml) (Fig. 2). Briefly, RNA was reverse tran-scribed into cDNA using reverse transcriptase with a DNA/RNAchimeric primer that is part DNA and part RNA. RNA was degradedby heating, and fragments served as primers for second-strand syn-thesis, yielding a dscDNA with an RNA/DNA heteroduplex at one
Fig. 2. Schematic representation of target preparation using Ribo-SPIA linearamplification (RS, Ovation-Biotin amplification and labeling system; and pRS,picogram RNA samples). RNA is shown in blue, and DNA is shown in pink.
Fig. 1. Schematic representation of target preparation using one (OneRA) andtwo (TwoRA) rounds of amplification. RNA is shown in blue, and DNA isshown in pink.
C1180 MICROARRAY-BASED COMPARISON OF FOUR AMPLIFICATION METHODS
AJP-Cell Physiol • VOL 288 • MAY 2005 • www.ajpcell.org
on May 23, 2006
ajpcell.physiology.orgD
ownloaded from

Table 1. GeneChip array quality metrics
MethodNo. ofChips
ScaleFactor
Average CallAll
%PresentCall
BackgroundIntensity Noise Raw Q
OneRA 6 3.5�0.6 696.5�7.8 45.4�4.0 42.6�2.0 2.6�0.2 1.4�0.1TwoRA 6 2.4�0.2 698.0�7.8 46.7�2.5 47.2�2.8 3.0�0.2 1.5�0.1RS 15 4.1�0.7 685.7�19.8 43.6�2.0 46.0�5.5 2.9�0.7 1.5�0.2pRS 12 2.0�0.3 712.1�27.9 51.3�3.8 74.4�12.7 3.9�0.6 2.5�0.3
Values are averages � SD. OneRA, one round of amplification; TwoRA, two rounds of amplification; RS, Ribo-SPIA technology; pRS, picogram RNAsamples.
Table 2. Verification of GeneChip array data obtained from MUR RNA
Gene SymbolAffymetrix No.
Average Intensity
Left PrimerRight Primer
ExpectedProduct
Size
AverageObservedProduct
SizeRT-PCRResultOneRA TwoRA RS pRS
Cdknla 128 1252 302 1415 CCGTGGACAGTGAGCAGTT 286 279 Present1421679_a_at A P A P GAGTGCAAGACAGCGACAAGNckl 584 826 117 205 TTTGGAACCATCTCCTCCAC 254 248 Present1421487_a_at A P A P GCCCAATGCAGTAAACAGTCNme3 262 531 7 165 AAGCTGGTGGCACTGAAGCTAG 266 270 Present1448905_at A P A P CGAGTCGCTGCCATGAATTACCpsf1 3330 3990 184 827 GCCCATGCAAGAAAAGACAT 267 275 Present1417665_a_at P P A P GGTCTGTCTCCAGCCAAGTCRuvb12 2858 2752 166 478 GGACCGCTTGCTCATTGTAT 275 276 Present1422482_at P P A P GTACTGTGTGGAGCGGGATTHrmt111 1833 2311 48 243 ACCCACTGTGACATCCACAC 262 269 Present1416844_at P P A * GCATCAAGGACACCACTGACTce2 1980 1974 207 387 ATGTACCACGATTGGCGTTT 283 275 Present1421971_a_at P P A P CACAGGACCTCTCTGCCAGTPrkcsh 2563 1828 162 764 GACGAGCTGTAGCCTGAACC 287 279 Present1416339_a_at P P A P TCATCCATTTATCTCCCACCA1110035H23Rik 1210 1273 99 191 AGCAAAGGTGATTCCTGGTG 271 268 Present1416315_at P P A P CACTGGAGAGAGCTGATGGAPold1 1480 1238 108 260 CTGCCCATCGACACTCAGTA 146 137 Present1448187_at P P A P GTCTTGCATCGTGTGTGGTCNxph3 900 1082 136 68 ACTGAGGCTGAAATGGCAAC 257 256 Present1419710_at P P A A AGGTGGTTAGGGCAGAGGATNsd1 1132 882 111 438 GGAGTTCCAGTGCTCCTTCA 273 271 Present1420882_a_at P P A P GCCCATGTGTCCTCTGCTATSlc22a5 677 667 101 180 GGGGAGTTTGTTTGTTTGTCA 291 298 Present1450395_at P P A P CACCGATGTGACACGACTGLmnb2 334 313 1092 636 AACCTCCAGAACCCACCAG 251 243 Present1448531_at A A P P CACTCCGGGTAACCATCTCAHspa4 343 146 1081 170 CAGTTGGGTGTAGGCATGGT 299 293 Present1416147_at A A P P GTCGGCAATGAGGTGTTCTTNeu3 83 22 536 539 GCCCTTATCCTTCCAATAATGC 294 297 Present1419339_at A A P P CAGTGTTAGAATGTCCCCCTGGFoxc2 898 355 3582 4382 GGGACCCCTAATGACTTCTG 124 123 Present1416693_at P A P P TTAAAGGCTCTGGGCAAGAAHoxc4 357 275 2844 942 CCCCATCTCTTTCTTAGGC 271 259 Present1422870_at A A P P TAACCACGATGAGGGTAGGGTle3 382 42 2146 1998 ACAGCGAGGATTTTCTGTGG 300 293 Present1419654_at P A P P AAAAGCACCCACACCAGTTGMax 215 151 2001 2268 TCCTCCCTCACCTCTGTTTG 197 185 Present1423501_at A A P P CTGCAAATCTGTCCCCACTTDusp10 204 93 1889 2339 GACCTGGAACTGACTGCACA 138 138 Present1417163_at A A P P TAGCCTGTCTCCCCAGAGAATcp1-rsl 1051 326 1340 1110 ATCCTCTGGGAGCATCTGG 214 217 Present1425195_a_at P A P P GGTCCTCTGGTTTCCCTTTCAkl3 369 65 1304 795 ATTGCCTGCGTTTTCTTTTG 220 220 Present1422078_at P A P P CCTCTCACATCCATCCCTTGHspa4 343 146 1081 170 CAGTTGGGTGTAGGCATGGT 299 294 Present1416147_at A A P P GTCGGCAATGAGGTGTTCTTZfp235 70 66 889 645 AGCTGGTGATTGGCAGAAC 255 259 Present1449329_at A A P P TGGGTAGCACTATGCCTCAAPik3rl 309 43 677 1289 TCATGTGTCAGAAGGCAGGA 287 290 Present1425515_at P A P P CCCAACCCTCCCACTTCTAT
Targets were selected according to a set of criteria to ensure a fair comparison between TwoRA and RS (see MATERIALS AND METHODS). Targets called presentor absent in all three replicates are marked P or A, respectively. Targets variably called present or absent are marked with an asterisk.
C1181MICROARRAY-BASED COMPARISON OF FOUR AMPLIFICATION METHODS
AJP-Cell Physiol • VOL 288 • MAY 2005 • www.ajpcell.org
on May 23, 2006
ajpcell.physiology.orgD
ownloaded from
end. The RNA portion of the heteroduplex portion of the dscDNA wasdigested using RNase H added to the reaction mixture together with aDNA polymerase and a second chimeric cDNA/cRNA primer (am-plification primer). Amplification was continued using primer exten-sion, strand displacement, and degradation of the RNA portion of theprimer extension product hybridized to the target to reveal part of thepriming site for subsequent primer hybridization and extension bystrand displacement DNA synthesis. Accumulated cDNA amplifica-tion products were fragmented and labeled to generate biotinylatedcDNA targets. cDNA targets were prepared using RS starting with100, 30, 10, or 3 ng of total RNA or pRS starting from 10, 3, or 0.3ng of total RNA.
Quantification and Qualitative Assessment of RNA, cRNA,and cDNA
Quantities of total RNA, cRNA, and cDNA were determinedusing absorbance spectrophotometry (ND-1000 spectrophotome-ter; NanoDrop Technologies, Wilmington, DE). For total RNA andcRNA, the conventional conversion, 1 OD260 � 40 ng/�l, wasused. For cDNA, the manufacturer’s (NuGEN Technologies) rec-
ommended conversion, 1 OD260 � 33 ng/�l, was used. The qualityof total RNA (eukaryotic total RNA nano assay) and cRNA andcDNA (mRNA smear nano assay) was determined using microflu-idic electrophoresis (Bioanalyzer; Agilent Technologies, PaloAlto, CA).
Microarray Analysis
Hybridizations of cRNA and cDNA targets were performed ac-cording to the manufacturer’s recommended procedures on high-density oligonucleotide gene chips (Affymetrix Mouse Genome 4302.0 GeneChip arrays; see http://www.affymetrix.com/support/techni-cal/datasheets/mogarrays_datasheet.pdf). A total of 39 target prepara-
Fig. 3. Quality of RNA used as starting material. Electropherograms (Bioana-lyzer, Agilent) of mouse kidney (MK) total RNA (A) and mouse universalreference (MUR) total RNA (B). Sharp peaks representing 18S and 28S rRNAdemonstrate good quality (solid lines), although the mass ratio for the tworRNA species was lower for MK RNA. Each sample was spiked with a 25-ntmarker to aid alignment of traces with a ladder consisting of 200-, 500-, 1,000-,2,000-, and 4,000-nt fragments (shaded traces).
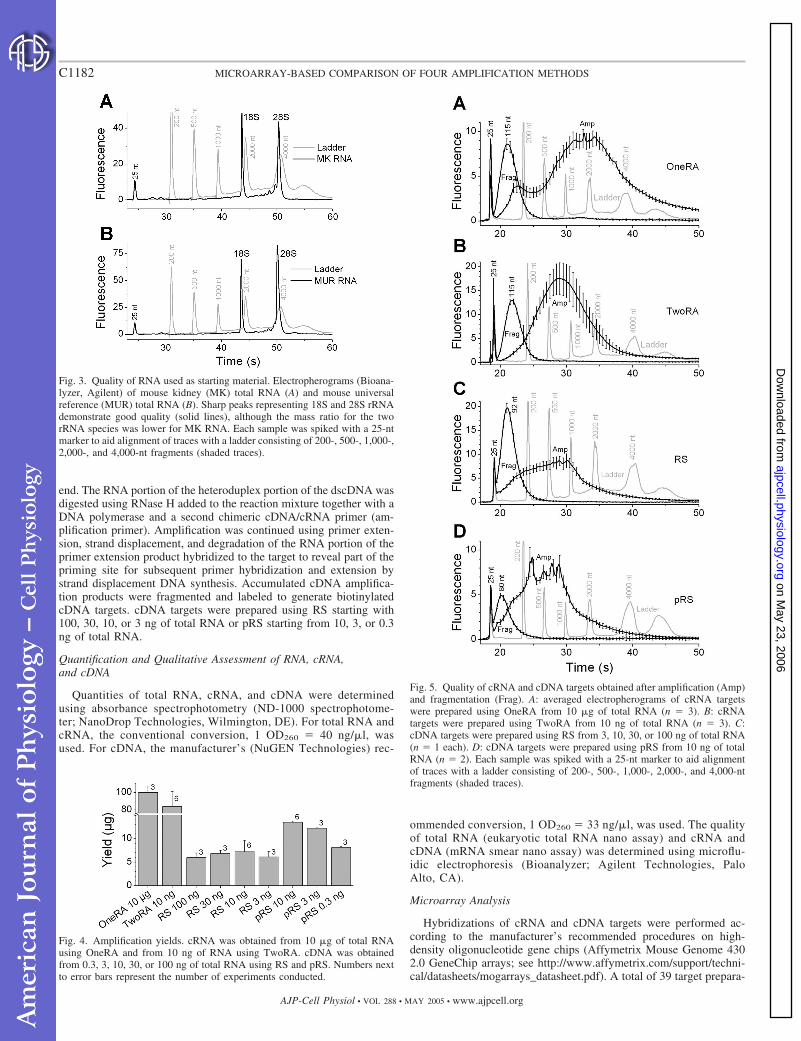
Fig. 4. Amplification yields. cRNA was obtained from 10 �g of total RNAusing OneRA and from 10 ng of RNA using TwoRA. cDNA was obtainedfrom 0.3, 3, 10, 30, or 100 ng of total RNA using RS and pRS. Numbers nextto error bars represent the number of experiments conducted.
Fig. 5. Quality of cRNA and cDNA targets obtained after amplification (Amp)and fragmentation (Frag). A: averaged electropherograms of cRNA targetswere prepared using OneRA from 10 �g of total RNA (n � 3). B: cRNAtargets were prepared using TwoRA from 10 ng of total RNA (n � 3). C:cDNA targets were prepared using RS from 3, 10, 30, or 100 ng of total RNA(n � 1 each). D: cDNA targets were prepared using pRS from 10 ng of totalRNA (n � 2). Each sample was spiked with a 25-nt marker to aid alignmentof traces with a ladder consisting of 200-, 500-, 1,000-, 2,000-, and 4,000-ntfragments (shaded traces).
C1182 MICROARRAY-BASED COMPARISON OF FOUR AMPLIFICATION METHODS
AJP-Cell Physiol • VOL 288 • MAY 2005 • www.ajpcell.org
on May 23, 2006
ajpcell.physiology.orgD
ownloaded from
tions were performed, and each preparation was analyzed using oneGeneChip array. Data were scaled to a target intensity of 500 (GCOSsoftware; Affymetrix). Normalization quality controls, including scal-ing factors, average intensities, present calls, background intensities,noise, and raw Q values all were within acceptable limits (Table 1).Hybridization controls, BioB, BioC, BioD, and CreX, were calledpresent on all chips and yielded the expected increases in intensities.Analyses of target populations were supported by GeneSpring (Sili-con Genetics, Redwood City, CA), Excel (Microsoft, CA), and Origin6.0 (OriginLab, Northampton, MA). Microarray data were depositedin the National Center for Biotechnology Information’s Gene Expres-sion Omnibus (accession nos. GSE1435 and GSE2019).
Call concordance. Probe sets were either called present (P), absent(A), or marginal (M) on the basis of detection P values (P, P � 0.05;M, P � 0.05–0.065; A, P � 0.065). Nine-field P/A/M matricescomparing data from two chips were constructed (Origin, version 6.0).Call concordance was the sum of the three concordant fields (P-P,A-A, and M-M), and call discordance was the sum of the other sixfields (P-A, A-P, P-M, M-P, A-M, and M-A). Data were expressed asa percentage of the total number of probe sets (n � 45,101). Callconcordance within a set of triplicate data was computed as average �SD of three pairwise comparisons. Call concordance between two setsof triplicates was computed as average � SD of all nine pairwisecomparisons.
Signal correlation. Signal intensities without regard to present,absent, or marginal calls were correlated, and linear correlationcoefficients (r) were determined (Origin, version 6.0). Correlation rvalues within a set of triplicates were reported as averages � SD ofthe three possible correlations. Correlation r values between two setsof triplicates were based on averaged intensities and reported as asimple r value.
Sensitivity. Sensitivity was evaluated from the estimated foldchange necessary for significance (Foldsig). Foldsig was obtainedaccording to Foldsig � [Avg � 2.776 � √(2/3 � SD2)]/Avg, whereAvg and SD are the average and standard deviation of the signalintensity of genes called present in all replicates, and 2.776 is the tvalue at P � 0.05, assuming 4 df.
Differential gene expression. The signal intensity ratios of genesdetected in all targets prepared from 10 �g and 10 ng MK and MUR
RNA using OneRA, TwoRA, RS, and pRS were calculated from theaverages of triplicates. Ratios were correlated between amplificationsystems, and correlation coefficients were obtained.
Verification of Microarray Data
A small number of gene targets amplified from MUR RNA anddetected using microarrays were verified by performing RT-PCR(Table 2). Targets were chosen on the basis of gene array dataobtained from 10 ng of MUR RNA amplified using either TwoRA orRS. For each method, 13 targets were selected on the basis of sixcriteria established to ensure fair selection between these two meth-ods. 1) Targets must be called present in three replicates of theconsidered amplification method (TwoRA or RS). 2) Targets must becalled absent in three replicates of the other amplification method. 3)Hybridization intensities of the three replicates of the consideredamplification method must be �100. 4) Targets of the consideredamplification method must be annotated by Affymetrix as full-lengthmRNA and not as expressed sequence tag. 5) Hybridization intensitiesbetween sets of chosen targets must be comparable. 6) Fold differ-ences between called present using one amplification method andabsent using the other method must be comparable between sets ofchosen targets. Average intensities and calls for the 26 selected genesare shown in Table 2, not only for TwoRA and RS but also for OneRAand pRS.
Real time RT-PCR was performed in the presence of 0.2� SYBRGreen I (Molecular Probes, Eugene, OR) using MUR RNA andgene-specific primers (Table 1) (23). RT was performed for 30 min at50°C and for 15 min at 95°C. PCR consisted of 50 cycles of 1 min at60°C, 1 min at 72°C, 7-s heating to hot measurement temperature,13-s hot measurement at 78°C below product melting temperature,and 1 min at 94°C. Hot measurements were performed to eliminate thedetection of primer dimers that tend to have melting temperaturesbetween 72 and 75°C. PCR was followed by melting (60–95°C).Targets were considered present when a single product of the appro-priate size was obtained. Target sizes were determined by performingmicrofluidic electrophoresis (Bioanalyzer; Agilent Technologies). Theaverage difference between observed and expected product sizes was5.6 � 3.8 bp (n � 25).
Statistics
Gene array experiments were performed in triplicate. RT-PCRexperiments were performed at least in duplicate, mostly in quadru-plicate. Data, including quality control values, are expressed asaverages � SD. The significance of continuous data was determinedusing one-way ANOVA with a Bonferroni post hoc test. Significancewas assumed at P � 0.05.
RESULTS
Target Yields and Amplification
Samples of total RNA ranging from 0.3 ng to 10 �g wereused as starting materials. Quantities were verified spectropho-tometrically. RNA qualities were evaluated by performing
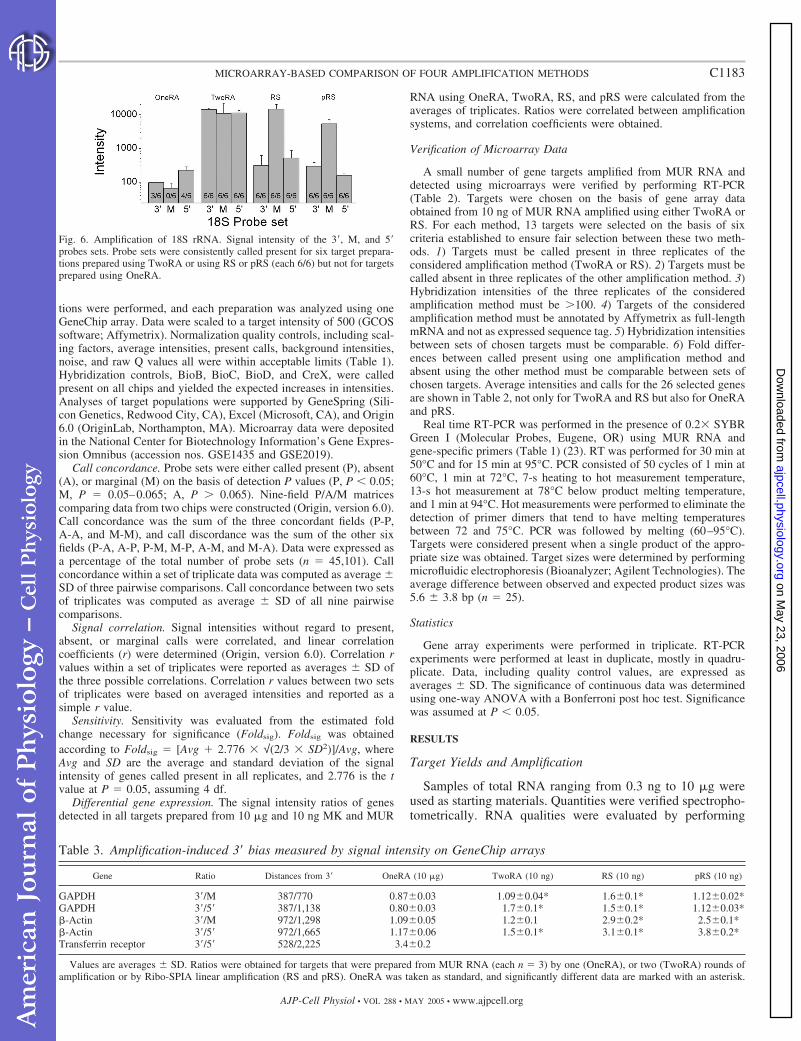
Fig. 6. Amplification of 18S rRNA. Signal intensity of the 3�, M, and 5�probes sets. Probe sets were consistently called present for six target prepara-tions prepared using TwoRA or using RS or pRS (each 6/6) but not for targetsprepared using OneRA.
Table 3. Amplification-induced 3� bias measured by signal intensity on GeneChip arrays
Gene Ratio Distances from 3� OneRA (10 �g) TwoRA (10 ng) RS (10 ng) pRS (10 ng)
GAPDH 3�/M 387/770 0.87�0.03 1.09�0.04* 1.6�0.1* 1.12�0.02*GAPDH 3�/5� 387/1,138 0.80�0.03 1.7�0.1* 1.5�0.1* 1.12�0.03*-Actin 3�/M 972/1,298 1.09�0.05 1.2�0.1 2.9�0.2* 2.5�0.1*-Actin 3�/5� 972/1,665 1.17�0.06 1.5�0.1* 3.1�0.1* 3.8�0.2*Transferrin receptor 3�/5� 528/2,225 3.4�0.2
Values are averages � SD. Ratios were obtained for targets that were prepared from MUR RNA (each n � 3) by one (OneRA), or two (TwoRA) rounds ofamplification or by Ribo-SPIA linear amplification (RS and pRS). OneRA was taken as standard, and significantly different data are marked with an asterisk.
C1183MICROARRAY-BASED COMPARISON OF FOUR AMPLIFICATION METHODS
AJP-Cell Physiol • VOL 288 • MAY 2005 • www.ajpcell.org
on May 23, 2006
ajpcell.physiology.orgD
ownloaded from

microfluidic electrophoresis (Fig. 3). MUR RNA was ofslightly higher quality than MK RNA as evidenced by thelarger ratio between the 28S and 18S peak. cRNA targets wereprepared using OneRA or TwoRA starting with 10 �g or 10 ngRNA, respectively. Alternatively, cDNA targets were preparedusing RS starting with 3, 10, 30, or 100 ng of RNA and usingpRS starting with 0.3, 3, and 10 ng of RNA. Figure 4 summa-rizes cRNA and cDNA target yields obtained after amplifica-tion. Yields for cRNA and cDNA targets were significantlydifferent, but each was sufficient for preparation of the hybrid-ization cocktail (Affymetrix). The size distributions of ampli-fied products and of biotinylated and fragmented targets areshown in Fig. 5.
These target preparation methods, OneRA, TwoRA, RS andpRS, are designed to amplify mRNA by priming at the polyAtail. Adherence to this design goal was evaluated using genearray analysis. PolyA tail-independent amplification was eval-uated by probes for 18S rRNA, which is thought not to containa polyA tail and therefore should not be amplified and conse-quently not called present. Probe sets for 18S hybridized withtargets prepared using OneRA yielded low signal intensitiesand were not consistently called present (see Fig. 6). Incontrast, 18S probe sets hybridized with targets prepared using
TwoRA, RS, or pRS were consistently called present. Hybrid-ization with targets prepared using TwoRA, RS, or pRSyielded high signal intensities.
Bias toward amplification of the 3� end of targets wasevaluated using probes located toward the 3� and 5� ends andin the middle of GAPDH, -actin, and transferrin receptor.Signal intensity ratios, 3�-5� and 3�-M, were calculated (Table3). Ratios should ideally be unity. Ratios for targets preparedusing OneRA were closest to unity. Increased 3�-5� ratios werenoted for all other target preparation methods from the lower-input total RNA samples. This observation is similar to thatnoted by others and likely does not affect the quality ofexpression profiling with the GeneChip arrays, because theprobe design for these arrays is 3� biased (12). 3� Biases fortargets prepared using RS and pRS were similar, regardless ofthe amount of starting material.
The number of probe sets that were called present, absent, ormarginal were tabulated (Table 4). pRS had the highest numberof present calls, followed by OneRA, TwoRA, and RS, respec-tively. More genes were consistently (in all three replicates)called present after pRS than after TwoRA or RS (Fig. 7). Asizable number of targets (n � 13,539, based on MUR RNA)was amplified by all three methods. Similar observations were
Fig. 7. Venn diagrams of genes consistently calledpresent. Target populations were prepared from 10ng of MK or MUR RNA using TwoRA or using RSor pRS. The total of 45,101 probe sets is 100%.
Table 4. Call distribution, call concordance, signal correlation, and estimated average fold changenecessary for significance
Method RNA P, % A, % M, % Concordance, % Correlation, r Foldsig
OneRA 10 �g MK 42.0�2.1 56.1�2.1 1.94�0.06 90.8�0.6 0.991�0.005 1.27�0.20TwoRA 10 ng MK 44.5�1.3 53.5�1.2 1.96�0.06 91.4�0.4 0.99562�0.00004 1.26�0.19*RS 100 ng MK 45.8�0.5* 52.4�0.5* 1.81�0.11 89.7�0.3* 0.991�0.001 1.33�0.22*RS 30 ng MK 45.2�0.7* 53.0�0.7* 1.75�0.02 90.0�0.3 0.995�0.001 1.29�0.21*RS 10 ng MK 41.7�1.0 56.5�1.0 1.78�0.05 88.4�0.6* 0.981�0.010 1.44�0.28*RS 3 ng MK 41.2�0.2 57.1�0.3 1.77�0.14 88.5�0.2* 0.990�0.001 1.43�0.30*pRS 10 ng MK 50.4�0.7 48.2�0.7 1.37�0.06 88.4�0.04* 0.9957�0.0002 1.39�0.34*OneRA 10 �g MUR 48.8�0.6 49.3�0.6 1.87�0.03 92.2�0.1 0.9978�0.0002 1.20�0.17TwoRA 10 ng MUR 48.8�0.5 49.2�0.5 1.97�0.04 91.8�0.2 0.9964�0.0003 1.24�0.18*RS 10 ng MUR 44.2�0.7* 53.8�0.7* 1.91�0.06 89.3�0.3* 0.995�0.001 1.29�0.21*pRS 10 ng MUR 54.8�1.1 43.7�1.0 1.43�0.12 88.1�0.1* 0.991�0.005 1.40�0.30*pRS 3 ng MUR 53.2�0.9 45.3�0.9 1.43�0.12 87.0�0.3* 0.990�0.003 1.50�0.39*pRS 0.3 ng MUR 45.9�1.2 52.9�1.2 1.27�0.06 83.6�0.8* 0.966�0.005* 1.91�0.64*
Call distributions and call concordances are relative to the total number of 45,101 probe sets. Call concordances and signal correlations are based on the threepossible comparisons within triplicate samples. Estimated average fold changes necessary for significance (Foldsig) were based on average intensity and standarddeviation for present genes. Targets were prepared from mouse kidney (MK) or mouse universal reference (MUR) RNA using OneRA or TwoRA or Ribo-SPIAlinear amplification (RS or pRS). Targets prepared using OneRA from 10 �g of RNA were taken as standard, and significantly different data are marked withan asterisk.
C1184 MICROARRAY-BASED COMPARISON OF FOUR AMPLIFICATION METHODS
AJP-Cell Physiol • VOL 288 • MAY 2005 • www.ajpcell.org
on May 23, 2006
ajpcell.physiology.orgD
ownloaded from

Fig. 8. Intensity dependence of estimatedfold change necessary for significance. Foldchanges for significance were computed onthe basis of averages and standard devia-tions. Traces represent smoothed averages.A, C, and E: estimated fold changes forsignificance computed from target popula-tions amplified from different amounts ofMK RNA or MUR RNA. B, D, and F:smoothed frequency distributions of intensi-ties are provided for comparison. Targetpopulations were prepared using OneRA orTwoRA or using RS or pRS.
Fig. 9. Correlation of signal intensities and ratios. A–D: best examples of correlations of individual data sets (replicates) prepared using one OneRA or TwoRAor using RS or pRS from MUR RNA. E–H: correlation of averaged data sets prepared by OneRA, TwoRA, RS, or pRS from MK RNA. I–L: correlation of ratioscomputed from averaged data sets (MK/MUR) that originated from samples prepared using OneRA, TwoRA, RS, or pRS.
C1185MICROARRAY-BASED COMPARISON OF FOUR AMPLIFICATION METHODS
AJP-Cell Physiol • VOL 288 • MAY 2005 • www.ajpcell.org
on May 23, 2006
ajpcell.physiology.orgD
ownloaded from

made for MK RNA. For targets prepared using RS and pRS,present calls decreased and absent calls increased with decreas-ing amounts of starting material (Table 4). Sensitivity wascomputed as the average fold change necessary for significance(Table 4). Foldsig was found to be intensity dependent (Fig. 8).
Verification of Amplification
A sizable number of targets (n � 13,995; 13,539 � 456,based on MUR RNA) were amplified from 10 ng of RNA usingboth TwoRA and RS (Fig. 7). An additional 5,929 (2,546 �3,383) targets were TwoRA specific because they were ampli-fied using TwoRA and not RS, and an additional 3,093 (845 �2,248) targets were RS specific because they were amplifiedusing RS and not TwoRA. TwoRA- and RS-specific targetshad similar distributions of hybridization intensities and of folddifferences between hybridization intensities that were calledpresent and called absent. TwoRA- and RS-specific targetpopulations were sampled according to a set of criteria (seeMATERIALS AND METHODS) that ensured fair comparison betweenthese two systems. All 13 TwoRA-specific and all 13 RS-specific targets could be verified in MUR RNA (Table 1), afinding consistent with equal fidelity of TwoRA and RS. Of the26 selected targets, 15 were called present using OneRA and24 were called present using pRS. Quantitative comparisons
other than between TwoRA and RS are not warranted, giventhat unbiased selection was ensured only for TwoRA and RS.Taken together, these data demonstrate equal fidelity ofTwoRA and RS and suggest that each amplification systemamplifies a unique set of targets in addition to the overlappingtarget sets.
Reproducibility between Replicates
Call concordances and correlation coefficients within tripli-cate samples were calculated to evaluate reproducibility be-tween replicates (Table 4; the best examples are shown in Figs.9, A–D, and 10). Between replicates, call concordances weresimilar for targets prepared using OneRA or TwoRA andsomewhat lower for RS and pRS (92.2, 91.8, 89.3, and 88.1%,respectively, for target prepared from 10 �g and 10 ng of MURRNA). Signal correlations were similar for targets preparedusing all amplification systems.
Fidelity of Amplification Systems
Direct comparison. Call concordances were obtained fromcomparisons of samples prepared from 10 �g of RNA usingOneRA and from 10 ng using TwoRA, RS, or pRS (Table 5).Call concordances between OneRA and TwoRA were higherthan for any other comparison. Observations were similar forMK and MUR RNA. Signal intensities were correlated be-tween amplification systems (Fig. 9, E–H). Correlation coeffi-cients between OneRA and TwoRA and between RS and pRSwere better, most likely because of the greater similaritiesbetween these amplification systems. Low call concordancesand signal correlations between T7- and Ribo-SPIA-basedsystems suggest that the two amplification methods may intro-duce different biases or that cDNA and cRNA perform differ-ently on GeneChip arrays. Indeed, cDNA/DNA hybridizationsmay be more reliable than cRNA/DNA hybridization becauseof the lesser complexity of cDNA/DNA interactions (17, 18,24), which may affect both present vs. absent calls and signalintensities.
Differential gene expression. Amplification-induced bias insignal intensity can be canceled by computing differential geneexpression. Signal intensity ratios of data originating from MKand MUR RNA were calculated from averages of triplicates.
Fig. 10. Correlation of signal intensity for 0.3 ng of total RNA. Best exampleof correlations of individual data sets (replicates) prepared using pRS fromMUR RNA.
Table 5. Call concordances and signal intensity correlations between systems
RNA Concordance, % P-P, % A-A, % A-P, % P-A, % Correlation, r
MK RNAOneRA-TwoRA 86.7�0.8 37.6�1.3 49.0�0.9 5.9�1.3 3.7�0.6 0.923OneRA-RS 76.5�1.0 31.2�1.0 45.3�1.1 9.8�1.1 10.1�0.9 0.693OneRA-pRS 60.7�0.3 27.4�1.0 33.2�0.9 22.0�1.1 14.1�0.8 0.702TwoRA-RS 77.5�0.4 32.9�0.6 44.5�0.8 8.1�0.7 10.8�0.6 0.729TwoRA-pRS 60.6�0.2 28.6�0.7 31.9�0.6 20.8�0.7 15.3�0.6 0.730RS-pRS 60.0�0.3 26.9�0.5 33.1�0.7 22.6�0.5 14.3�0.6 0.923
MUR RNAOneRA-TwoRA 87.6�0.2 43.5�0.3 43.9�0.4 4.4�0.3 4.5�0.3 0.930OneRA-RS 74.0�0.3 34.6�0.4 39.3�0.4 8.9�0.3 13.4�0.5 0.685OneRA-pRS 59.3�0.1 32.6�0.3 26.7�0.2 21.8�0.3 15.6�0.3 0.734TwoRA-RS 75.3�0.3 35.3�0.5 40.0�0.3 8.3�0.3 12.7�0.5 0.701TwoRA-pRS 58.7�0.2 32.3�0.3 26.4�0.2 22.0�0.2 15.9�0.2 0.741RS-pRS 56.6�0.2 28.9�0.4 27.6�0.3 25.4�0.4 14.8�0.2 0.907
Call concordances are calculated between target populations generated from 10 �g of RNA using one (OneRA), or from 10 ng RNA using two (TwoRA),rounds of amplification or Ribo-SP1A linear amplification (RS or pRS). Call concordances are averages � SD of the nine possible comparisons between twosets of triplicates. Signal correlation coefficients were obtained from correlation of averaged triplicates.
C1186 MICROARRAY-BASED COMPARISON OF FOUR AMPLIFICATION METHODS
AJP-Cell Physiol • VOL 288 • MAY 2005 • www.ajpcell.org
on May 23, 2006
ajpcell.physiology.orgD
ownloaded from

Ratios of samples that were prepared using different amplifi-cation systems were compared. Correlation coefficients wereobtained for probes that were called present in all sets oftriplicates prepared using OneRA, TwoRA, RS, and pRS (Fig.9, I–L). Correlation between TwoRA and OneRA was consid-erably better than between other amplification systems.
DISCUSSION
Microarray-based gene expression profiling of microdis-sected tissue samples and needle biopsies is often limitedbecause of insufficient amounts of RNA. Methods devised toovercome this limitation include signal amplification (8, 20)and sample amplification, including exponential amplificationusing PCR (7, 9, 13, 16, 22) and linear amplification using T7polymerase (1, 4, 15, 21). T7-based linear amplification meth-ods, including TwoRA, are commonly used for preparation oftargets from nanogram amounts of RNA (3, 21). RS and pRSare novel systems that are based on Ribo-SPIA technology thatwas recently introduced as an alternative to TwoRA. The goalof the present study was to compare RS, pRS, TwoRA, andOneRA. Target yields and qualities, amplification biases, callconcordances, correlation coefficients, and sensitivities weredetermined. Evaluations were based on direct comparisons andon differential gene expression. OneRA was taken as thebaseline, mostly for historical reasons (11). Although OneRAis the major linear amplification protocol used on the Af-fymetrix platform, it should not be assumed to generate a“true” or “standard” gene expression profile as implied by itscommercial name.
RS and pRS generated significantly smaller amounts ofcDNA than TwoRA generated cRNA (Fig. 4), although allsystems produced sufficient amounts of targets, given that 15�g of cRNA and only 2 �g of cDNA are needed for arrayhybridization. Yields of cDNA targets prepared using RS andpRS were independent of the amount of starting material,which is similar to the pattern observed with PCR.
Probe sets for 18S rRNA were low in signal intensity andinconsistently called present in targets prepared using OneRA.However, 18S rRNA was consistently called present, with highsignal intensities in target preparations prepared using TwoRA,RS, and pRS (Fig. 6). This observation may indicate that bothT7- and Ribo-SPIA-based amplification systems prime at in-ternal polyA sites. Alternatively, it is conceivable that polyad-enylated forms 18S rRNA may be present as recently observedin yeast (10). Thus it is possible that the higher sensitivityafforded by RNA amplification enables the detection of smallamounts of polyadenylated rRNA on the arrays. The majorityof amplified transcripts generated using RS and pRS were up to1,000 nt in length (Fig. 5). A similar length distribution wasfound for TwoRA. In contrast, the majority of amplifiedtranscripts generated using OneRA were up to 2,500 nt inlength. These differences are not likely to be important onAffymetrix arrays, in which �98% of the probe sets arelocated �600 nt from the 3� end.
3� Bias was further determined for three genes with probesets that varied in their distances from the 3� end of the mRNA(Table 3). 3�/M and 3�/5� ratios for GAPDH are best suited topredict fidelity of expression profiling given that �98% ofprobe sets on Affymetrix Mouse Genome 430 2.0 GeneChipsare specific for sequences within 600 nt from the 3� end. The
observation that 3�-M and 3�-5� ratios for GAPDH were closeto unity is consistent with the view that TwoRA, RS, and pRSamplify targets with high fidelity. The observation that 3�-5�ratios for the transferrin receptor, which are based on probesets located 528 and 2,225 nt from the 3� end, could beobtained only for OneRA is consistent with the finding thatOneRA yielded longer transcripts than TwoRA, RS, or pRS.
The RNA starting material for MK and MUR differednotably in quality (Fig. 3). Consistently, significant differencesbetween MK and MUR RNA were found for probe sets that are
Fig. 11. 3� Bias as a function of the quality of the RNA starting material. MKRNA was of slightly lesser quality than MUR RNA as evidenced by the lesserratio of the 18S and the 28S peaks (see Fig. 3). Targets were prepared usingOneRA from 10 �g of RNA, TwoRA from 10 ng of RNA, or RS or pRS from10 ng of RNA. A–D: 3�-M and 3�-5� ratios for GAPDH and -actin; n � 3 foreach ratio. *Significant differences between MK and MUR RNA. Note that nosignificant differences were found for OneRA or for ratios that spanned shortdistances.
C1187MICROARRAY-BASED COMPARISON OF FOUR AMPLIFICATION METHODS
AJP-Cell Physiol • VOL 288 • MAY 2005 • www.ajpcell.org
on May 23, 2006
ajpcell.physiology.orgD
ownloaded from
located 972 and 1,665 nt from the 3� end (3�-5� ratio for-actin; Fig. 11). However, no significant differences werefound for ratios of probe sets located 387 and 770 nt from the3� end (3�-M ratio for GAPDH; Fig. 11). Given that �98% ofprobes are located within 600 nt of the 3� end, the difference inRNA quality was not expected to have a major effect on thegene array data. Consistently, analyses of GeneChip array datafrom both RNA gave similar results.
A sizable number of targets (13,539 in 10 ng of MUR RNA)were detected using TwoRA, RS, and pRS. The highest num-ber of genes (21,652 in 10 ng of MUR RNA) was consistentlycalled present in targets prepared using pRS compared with RSand TwoRA (Fig. 7). pRS consistently amplified 15,179 targetsfrom 0.3 ng of total RNA with acceptable reproducibility asmeasured by call concordance, signal correlation, and sensi-tivity (Table 4 and Figs. 8 and 10). Verification of 13 TwoRA-and 13 RS-specific targets using RT-PCR (Table 2) demon-strated that TwoRA and RS amplified partially unique sets oftargets.
Reproducibility between replicates was based on call con-cordance and estimated fold changes necessary for significance(Table 4 and Fig. 8). Reproducibility for targets that wereprepared from 10 ng of RNA using TwoRA was higher than fortargets prepared from 10 ng of RNA using RS or pRS. Foldchanges necessary for significance, however, were well below2 for all amplification systems. A fold change of 2 is some-times used as an arbitrary lower limit for significance.
As expected, comparisons of targets populations preparedusing different amplification methods yielded poorer call con-cordances and signal intensity correlations than comparisons oftargets populations prepared using the same method (9, 14).This difference illustrates the presence of system-specific bi-ases.
Call concordances were higher between the two T7-basedsystems, OneRA and TwoRA, than between T7- and Ribo-SPIA-based systems (Table 5), most likely because of thegreater similarity of the methods and the similar number ofpresent calls. Although RS and pRS are similar methods, theydiffered greatly in the number of present calls, which resultedin poorer call concordance. Signal correlation coefficientswithin the two T7-based (OneRA and TwoRA) or within thetwo Ribo-SPIA-based methods (RS and pRS) were signifi-cantly higher than any comparison between these methods(Table 5 and Fig. 9, E–H). The observation that absent vs.present calls between OneRA and TwoRA or between OneRAand pRS were significantly larger than present vs. absent callsis consistent with amplification of rare messages using TwoRAand pRS. Amplification is likely to raise signal intensities ofrare genes above the noise level (6).
Differential gene expression was computed in an attempt tocancel system-dependent biases. Nevertheless, correlation be-tween ratios of targets prepared using T7-based systems,TwoRA and OneRA, was considerably better than that be-tween ratios of T7- and Ribo-SPIA-based methods (Fig. 9,G–I). This observation underscores the presence of system-specific biases.
All nanogram amplification methods, TwoRA, RS, and pRS,yielded sufficient material for gene array work, althoughTwoRA yielded quantitatively more cRNA than RS or pRSyielded cDNA. The RS and pRS target preparation methodsproduced results comparable to those observed using more
traditional T7-based methods and will enable studies of smallerRNA samples because the required input level is lower and thetime and effort required for amplification are lower. pRSreproducibly amplified the highest number of targets and wasfound to be suitable for amplification of total RNA fromamounts as low as 0.3 ng. Reproducibility and sensitivity ofTwoRA relative to OneRA were higher than those of RS orpRS. All amplification systems, OneRA, TwoRA, RS, andpRS, amplified large overlapping sets of targets. Target prep-arations using RS and pRS were faster and produced cDNA,which is more stable than cRNA and thus can be banked foradditional studies. The presence of system-specific biasesprompts the recommendation that changes in amplificationmethodology within a study be avoided. Indeed, in the antici-pation of future refined studies on nanogram amounts RNA,investigators may want to choose a nanogram amplificationsystem for a pilot study even if microgram amounts of RNAare available.
ACKNOWLEDGMENTS
The excellent assistance provided by Clark Bloomer of the Kansas Univer-sity Medical Center Microarray Core is gratefully acknowledged.
GRANTS
This project was primarily supported by the National Institute on Deafnessand Other Communication Disorders Grants R01 DC-01098 and R01 DC-04280 (to P. Wangemann). Additional support was provided by the NationalCenter for Research Resources Grants P20 RR-16475 (Biomedical ResearchInfrastructure Network program) and P20 RR-017686 [to Kansas State Uni-versity, Centers of Biomedical Research Excellence (COBRE) MolecularBiology Core] and by NuGEN Technologies, Inc. The technical assistanceprovided by Jianfa Bai of the Kansas State University Gene ExpressionFacility, supported by the National Science Foundation Grant MRI 0421427, isgratefully acknowledged.
DISCLOSURES
J. D. Heath and N. Kurn are employees of NuGEN Technologies, Inc. M.Wang and G. Deng were employees of NuGEN at the time this study wasconducted. NuGEN has patents and patents pending on some of the productsand processes described in this article.
REFERENCES
1. Baugh LR, Hill AA, Brown EL, and Hunter CP. Quantitative analysisof mRNA amplification by in vitro transcription. Nucleic Acids Res 29:E29, 2001.
2. Deng G, Dafforn A, Wang M, Chen P, Purohit R, Wang S, PillarisettyS, Iglehart D, Koritala S, Lato S, Herrler M, Heath J, Stanchfield J,and Kurn N. A new method for amplification and labeling of RNA fromsmall clinical samples for use with the Affymetrix GeneChip platform(Abstract 1507). Poster presented at the 53rd annual meeting of theAmerican Society of Human Genetics, Los Angeles, CA, 2003.
3. Eberwine J. Amplification of mRNA populations using aRNA generatedfrom immobilized, oligo(dT)-T7 primed cDNA. Biotechniques 20: 584–591, 1996.
4. Feldman AL, Costouros NG, Wang E, Qian M, Marincola FM,Alexander HR, and Libutti SK. Advantages of mRNA amplification formicroarray analysis. Biotechniques 33: 906–914, 2002.
5. Heath J, Brooks A, Richfield E, Thiruchelvam M, Cory-Slechta D,Wang M, Chen P, Dafforn A, Deng G, Iglehart D, Koritala S, Lato S,Pillarisetty S, Purohit R, Herrler M, Stanchfield J, and Kurn N.Comparative gene expression analysis of microdissected brain tissues in amouse model of idiopathic Parkinson’s disease using a novel RNAamplification system (Abstract 1553). Poster presented at the 53rd annualmeeting of the American Society of Human Genetics, Los Angeles, CA,2003.
6. Hu L, Wang J, Baggerly K, Wang H, Fuller GN, Hamilton SR,Coombes KR, and Zhang W. Obtaining reliable information from minuteamounts of RNA using cDNA microarrays. BMC Genomics 3: 16, 2002.
C1188 MICROARRAY-BASED COMPARISON OF FOUR AMPLIFICATION METHODS
AJP-Cell Physiol • VOL 288 • MAY 2005 • www.ajpcell.org
on May 23, 2006
ajpcell.physiology.orgD
ownloaded from
7. Iscove NN, Barbara M, Gu M, Gibson M, Modi C, and Winegarden N.Representation is faithfully preserved in global cDNA amplified exponentiallyfrom sub-picogram quantities of mRNA. Nat Biotechnol 20: 940–943, 2002.
8. Karsten SL, Van Deerlin VMD, Sabatti C, Gill LH, and GeschwindDH. An evaluation of tyramide signal amplification and archived fixed andfrozen tissue in microarray gene expression analysis. Nucleic Acids Res30: E4, 2002.
9. Kenzelmann M, Klaren R, Hergenhahn M, Bonrouhi M, Grone HJ,Schmid W, and Schutz G. High-accuracy amplification of nanogram totalRNA amounts for gene profiling. Genomics 83: 550–558, 2004.
10. Kuai L, Fang F, Butler JS, and Sherman F. Polyadenylation of rRNA inSaccharomyces cerevisiae. Proc Natl Acad Sci USA 101: 8581–8586, 2004.
11. Lockhart DJ, Dong H, Byrne MC, Follettie MT, Gallo MV, Chee MS,Mittmann M, Wang C, Kobayashi M, Horton H, and Brown EL.Expression monitoring by hybridization to high-density oligonucleotidearrays. Nat Biotechnol 14: 1675–1680, 1996.
12. Luzzi V, Mahadevappa M, Raja R, Warrington JA, and Watson MA.Accurate and reproducible gene expression profiles from laser capturemicrodissection, transcript amplification, and high density oligonucleotidemicroarray analysis. J Mol Diagn 5: 9–14, 2003.
13. Makrigiorgos GM, Chakrabarti S, Zhang Y, Kaur M, and Price BD.A PCR-based amplification method retaining the quantitative differencebetween two complex genomes. Nat Biotechnol 20: 936–939, 2002.
14. McClintick JN, Jerome RE, Nicholson CR, Crabb DW, and EdenbergHJ. Reproducibility of oligonucleotide arrays using small samples. BMCGenomics 4: 4, 2003.
15. Pabon C, Modrusan Z, Ruvolo MV, Coleman IM, Daniel S, Yue H,and Arnold LJ Jr. Optimized T7 amplification system for microarrayanalysis. Biotechniques 31: 874–879, 2001.
16. Puskas LG, Zvara A, Hackler L Jr, and van Hummelen P. RNAamplification results in reproducible microarray data with slight ratio bias.Biotechniques 32: 1330–1340, 2002.
17. Rosenow C, Saxena RM, Durst M, and Gingeras TR. Prokaryotic RNApreparation methods useful for high density array analysis: comparison oftwo approaches. Nucleic Acids Res 29: e112, 2001.
18. Schwille P, Oehlenschlager F, and Walter NG. Quantitative hybrid-ization kinetics of DNA probes to RNA in solution followed bydiffusional fluorescence correlation analysis. Biochemistry 35: 10182–10193, 1996.
19. Spiess AN, Mueller N, and Ivell R. Amplified RNA degradation inT7-amplification methods results in biased microarray hybridizations.BMC Genomics 4: 44, 2003.
20. Stears RL, Getts RC, and Gullans SR. A novel, sensitive detectionsystem for high-density microarrays using dendrimer technology. PhysiolGenomics 3: 93–99, 2000.
21. Van Gelder RN, von Zastrow ME, Yool A, Dement WC, Barchas JD,and Eberwine JH. Amplified RNA synthesized from limited quantities ofheterogeneous cDNA. Proc Natl Acad Sci USA 87: 1663–1667, 1990.
22. Wang E, Miller LD, Ohnmacht GA, Liu ET, and Marincola FM.High-fidelity mRNA amplification for gene profiling. Nat Biotechnol 18:457–459, 2000.
23. Wangemann P, Itza EM, Albrecht B, Wu T, Jabba SV, Maganti RJ,Lee JH, Everett LA, Wall SM, Royaux IE, Green ED, and MarcusDC. Loss of KCNJ10 protein expression abolishes endocochlear potentialand causes deafness in Pendred syndrome mouse model. BMC Med 2: 30,2004.
24. Wu P, Nakano S, and Sugimoto N. Temperature dependence of thermo-dynamic properties for DNA/DNA and RNA/DNA duplex formation. EurJ Biochem 269: 2821–2830, 2002.
C1189MICROARRAY-BASED COMPARISON OF FOUR AMPLIFICATION METHODS
AJP-Cell Physiol • VOL 288 • MAY 2005 • www.ajpcell.org
on May 23, 2006
ajpcell.physiology.orgD
ownloaded from